Embed Size (px)
Citation preview
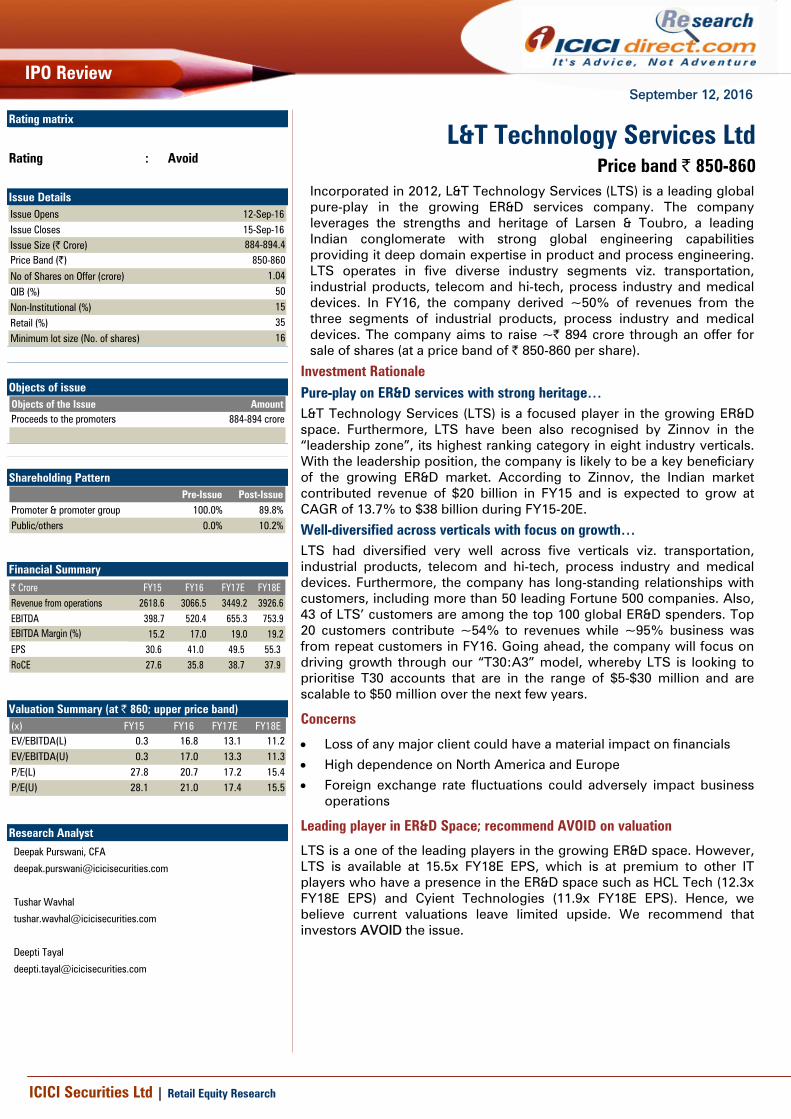
September 12, 2016
IPO Review
ICICI Securities Ltd | Retail Equity Research
Incorporated in 2012, L&T Technology Services (LTS) is a leading global pure-play in the growing ER&D services company. The company leverages the strengths and heritage of Larsen & Toubro, a leading Indian conglomerate with strong global engineering capabilities providing it deep domain expertise in product and process engineering. LTS operates in five diverse industry segments viz. transportation, industrial products, telecom and hi-tech, process industry and medical devices. In FY16, the company derived ~50% of revenues from the three segments of industrial products, process industry and medical devices. The company aims to raise ~| 894 crore through an offer for sale of shares (at a price band of | 850-860 per share).
Investment Rationale Pure-play on ER&D services with strong heritage… L&T Technology Services (LTS) is a focused player in the growing ER&D space. Furthermore, LTS have been also recognised by Zinnov in the “leadership zone”, its highest ranking category in eight industry verticals. With the leadership position, the company is likely to be a key beneficiary of the growing ER&D market. According to Zinnov, the Indian market contributed revenue of $20 billion in FY15 and is expected to grow at CAGR of 13.7% to $38 billion during FY15-20E.
Well-diversified across verticals with focus on growth… LTS had diversified very well across five verticals viz. transportation, industrial products, telecom and hi-tech, process industry and medical devices. Furthermore, the company has long-standing relationships with customers, including more than 50 leading Fortune 500 companies. Also, 43 of LTS’ customers are among the top 100 global ER&D spenders. Top 20 customers contribute ~54% to revenues while ~95% business was from repeat customers in FY16. Going ahead, the company will focus on driving growth through our “T30:A3” model, whereby LTS is looking to prioritise T30 accounts that are in the range of $5-$30 million and are scalable to $50 million over the next few years.
Concerns
• Loss of any major client could have a material impact on financials
• High dependence on North America and Europe
• Foreign exchange rate fluctuations could adversely impact business operations
Leading player in ER&D Space; recommend AVOID on valuation
LTS is a one of the leading players in the growing ER&D space. However, LTS is available at 15.5x FY18E EPS, which is at premium to other IT players who have a presence in the ER&D space such as HCL Tech (12.3x FY18E EPS) and Cyient Technologies (11.9x FY18E EPS). Hence, we believe current valuations leave limited upside. We recommend that investors AVOID the issue.
L&T Technology Services LtdPrice band | 850-860
Rating matrix
Rating : Avoid Issue Details Issue Opens 12-Sep-16Issue Closes 15-Sep-16Issue Size (| Crore) 884-894.4Price Band (|) 850-860
No of Shares on Offer (crore) 1.04
QIB (%) 50
Non-Institutional (%) 15
Retail (%) 35
Minimum lot size (No. of shares) 16 Objects of issue Objects of the Issue AmountProceeds to the promoters 884-894 crore
Shareholding Pattern
Pre-Issue Post-IssuePromoter & promoter group 100.0% 89.8%Public/others 0.0% 10.2%
Financial Summary | Crore FY15 FY16 FY17E FY18ERevenue from operations 2618.6 3066.5 3449.2 3926.6EBITDA 398.7 520.4 655.3 753.9EBITDA Margin (%) 15.2 17.0 19.0 19.2EPS 30.6 41.0 49.5 55.3 RoCE 27.6 35.8 38.7 37.9
Valuation Summary (at | 860; upper price band) (x) FY15 FY16 FY17E FY18EEV/EBITDA(L) 0.3 16.8 13.1 11.2EV/EBITDA(U) 0.3 17.0 13.3 11.3P/E(L) 27.8 20.7 17.2 15.4P/E(U) 28.1 21.0 17.4 15.5
Research Analyst
Deepak Purswani, CFA
Tushar Wavhal
Deepti Tayal
Page 2ICICI Securities Ltd | Retail Equity Research
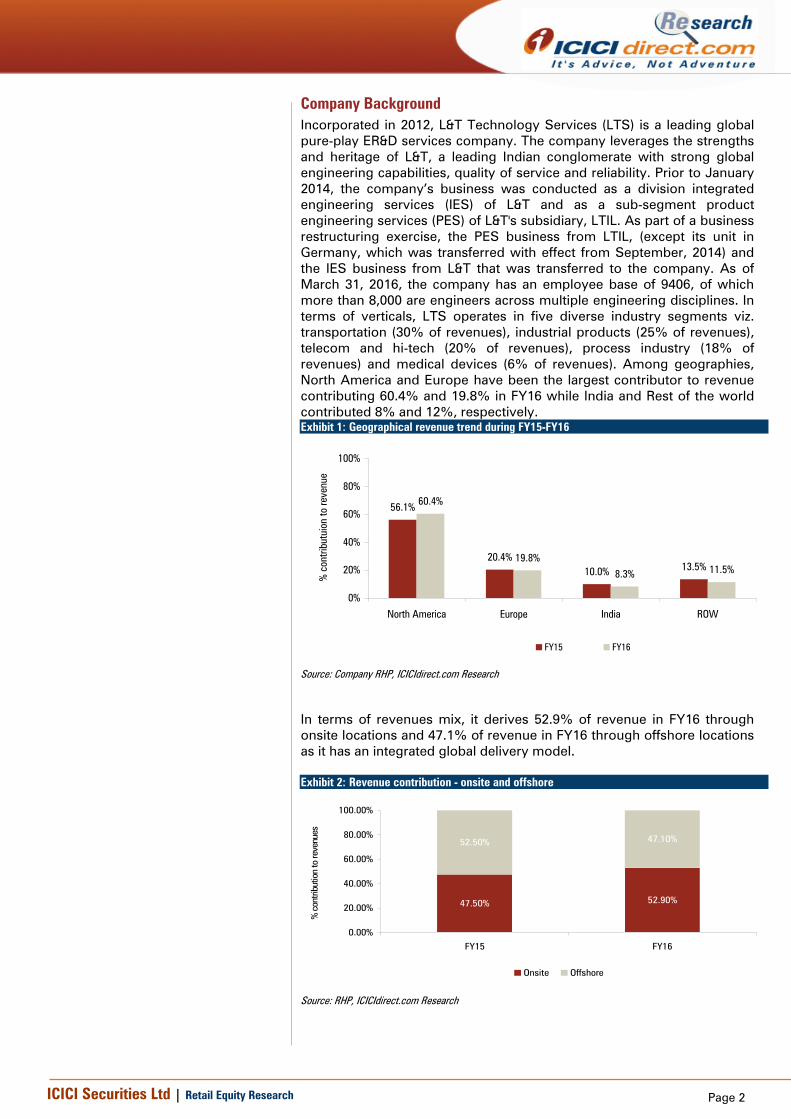
Company Background Incorporated in 2012, L&T Technology Services (LTS) is a leading global pure-play ER&D services company. The company leverages the strengths and heritage of L&T, a leading Indian conglomerate with strong global engineering capabilities, quality of service and reliability. Prior to January 2014, the company’s business was conducted as a division integrated engineering services (IES) of L&T and as a sub-segment product engineering services (PES) of L&T's subsidiary, LTIL. As part of a business restructuring exercise, the PES business from LTIL, (except its unit in Germany, which was transferred with effect from September, 2014) and the IES business from L&T that was transferred to the company. As of March 31, 2016, the company has an employee base of 9406, of which more than 8,000 are engineers across multiple engineering disciplines. In terms of verticals, LTS operates in five diverse industry segments viz. transportation (30% of revenues), industrial products (25% of revenues), telecom and hi-tech (20% of revenues), process industry (18% of revenues) and medical devices (6% of revenues). Among geographies, North America and Europe have been the largest contributor to revenue contributing 60.4% and 19.8% in FY16 while India and Rest of the world contributed 8% and 12%, respectively. Exhibit 1: Geographical revenue trend during FY15-FY16
56.1%
20.4%10.0% 13.5%
60.4%
19.8%
8.3% 11.5%
0%
20%
40%
60%
80%
100%
North America Europe India ROW
% c
ontri
butu
ion
to re
venu
e
FY15 FY16
Source: Company RHP, ICICIdirect.com Research
In terms of revenues mix, it derives 52.9% of revenue in FY16 through onsite locations and 47.1% of revenue in FY16 through offshore locations as it has an integrated global delivery model. Exhibit 2: Revenue contribution - onsite and offshore
47.50% 52.90%
52.50% 47.10%
0.00%
20.00%
40.00%
60.00%
80.00%
100.00%
FY15 FY16
% c
ontri
butio
n to
reve
nues
Onsite Offshore
Source: RHP, ICICIdirect.com Research

Page 3ICICI Securities Ltd | Retail Equity Research
Industry Dynamics… Given IoT is gaining momentum, regulatory and growing customer demand for innovation to increase energy efficiency & lower emission, personalised product experience, engineering R&D is witnessing strong momentum in spending. According to Zinnov, $1007 billion was spent by corporations on ER&D activities in FY15 According to Nasscom, global ER&D spend grew at a CAGR of over 7% since 2009. Out of $1007 billion, the addressable engineering outsourcing market is $365 billion. However, only $67 billion outsourcing market has been addressed so far. Even out of $67 billion, the ER&D market addressed by India was only $20 billion indicating huge opportunities to be tapped in future. Exhibit 3: ER&D spend
Source: Company RHP, ICICIdirect.com Research
According to Zinnov, revenue from the India addressed market may grow at a CAGR of 13.7% to $38 billion in FY15-20E. Out of this, while in-house ER&D centres are expected to grow at a CAGR of 13.3% to $22.9 billion, revenues from third-party ER&D service are anticipated to grow at a CAGR of ~14% to $14.9 in FY15-20E. In 2015, in-house & third party ER&D market size was $12.2 billion & $7.8 billion, respectively. Exhibit 4: ER&D market from India to grow at 13.7% CAGR in FY15-20E
Source: Company RHP, ICICIdirect.com Research

Page 4ICICI Securities Ltd | Retail Equity Research
In 2015, segments of telecom & hi-tech and transportation contributed 26.9% and 22.5% to G500 ER&D spend, respectively, while process industry contributed 21.3%, industrial products (7.0%) and medical devices (5.0%). Exhibit 5: Global 500 ER&D spend in business segments
Source: Company RHP, ICICIdirect.com Research

Page 5ICICI Securities Ltd | Retail Equity Research
Key strength… Pure-play on ER&D services with strong heritage… L&T Technology Services’ (LTS) focuses on the ER&D space and acts as a “one-stop shop” for customers in ER&D space, covering phases from conceptualisation to implementation within the product and manufacturing engineering life cycles. LTS also leverages strengths and heritages of L&T, providing it deep domain expertise in product and process engineering. Furthermore, LTS have been also recognised by Zinnov in the “leadership zone”, its highest ranking category in eight industry verticals. With the leadership position, company is likely to be key beneficiary from growing ER&D market. According to Zinnov, Indian market contributed revenue of $20 billion in FY15 and is expected to grow at CAGR of 13.7% to $38 billion during FY15-20E. Exhibit 6: LTS in leadership zone, highest ranking category by Zinnov
Source: Company RHP, ICICIdirect.com Research
Well-diversified across verticals with focus on growth… LTS had diversified very well across five verticals viz. transportation, industrial products, telecom and hi-tech, process industry and medical devices. The company have long-standing relationships with customers, which includes more than 50 leading Fortune 500 companies and 43 of company’s customers are amongst the top 100 global ER&D spenders. Top 20 customers contribute ~ 54% to revenues and ~ 95% business was from repeat customers in FY16. Exhibit 7: Revenue contribution by business segments
27.3 29.9 32.2
27.8 25.3 25.9
21.3 19.8 18.6
18.3 18.7 16.3
5.3 6.3 7
0102030405060708090
100
FY15 FY16 Q1FY17
% o
f rev
enue
Transportation Industrial Products Telecom and Hi-Tech Process Industry Medical Devices
Source: Company RHP, ICICIdirect.com Research

Page 6ICICI Securities Ltd | Retail Equity Research
Strategy Driving higher growth in key segments, verticals and geographies … LTS is pursuing growth strategies to expand market share across key segments, verticals and geographies. Vertical wise, the company’s key priority areas are currently automotive, industrial products segment, consumer electronics and product software (both of which forms part of our telecom and hi-tech segment). In the automotive vertical, LTS aim to focus on software-based engineering solutions, which will supplement traditional strengths in auto-mechanics. In the industrial products segment, the company intends to expand its offerings in IoT-enabled smart products and the renewable energy. In the customer electronics vertical, LTS tend to focus on wearables, smart homes and camera and security devices. The company intend to pursue both organic and inorganic strategies to enhance its service offerings in the product software space. Geography wise, the company will continue to focus on North America and Europe, particularly by setting up labs or development centres in close proximity to customers' offices. The company also intends to focus on Austria, Switzerland, Japan and establishing delivery centres in Eastern Europe. Maintain existing & acquire new customer relationships… LTS’ record of delivering an extensive range of solutions through integrated global delivery model, industry specific expertise have led to strong client relationships over the years. Top 20 customers contributed 53.8% of revenues in FY16 (vs. 56.3% in FY15). Total 43 of the top 100 global ER&D spenders are the company’s key global customers. According to the management, these top 100 ER&D spending represents a large market opportunity for the company to grow and develop. The company will focus on driving the growth through our “T30:A3” model, whereby LTS is looking to prioritise T30 accounts that are in the range of $5-30 million and are scalable to $50 million over the next few years. Exhibit 8: Number of million dollar clients contribution to revenue Revenues FY15 FY16> $ 1-5 million 41 44
> $ 5-10 million 16 17
> $ 10-20 million 8 8
> $ 20 million 2 3
Source: Company RHP, ICICIdirect.com Research
Delivering solutions-oriented engineering applicable across verticals … Digitisation would increasingly become systematically critical in near future, for which LTS plans to focus on key technology areas as digital engineering, mobile internet, internet-of-things (IoT), advanced robotics, automation of knowledge, autonomous and near-autonomous vehicles, energy efficiency and imaging and video. To bring business process efficiency to clients, company is building cross-domain solutions that can be applied to the businesses of existing and prospective customers across verticals. Company is also building and strengthening alliances with technology companies. Increased investment in emerging technology & innovation labs… Currently, the company has 31 labs in India. The company will continue to drive growth by focusing towards digital transformation and have invested significantly in smart manufacturing infrastructure to align its existing areas of expertise with new business trends.
Page 7ICICI Securities Ltd | Retail Equity Research
Expanding footprint through selective acquisitions… LTS plans to expand organic growth by pursuing selective acquisitions and strategic alliances to expand vertical offerings and customer base. The company also plans to pursue acquisitions of companies outside India to expand global footprint by leveraging low cost offshore delivery model to move a greater portion of the work offshore to India. Attract, develop and retain highly-skilled employees… Employees are one of the important assets for the company. Thus, the company has certain talent development strategies and training framework which aid company to deliver quality services to customers.
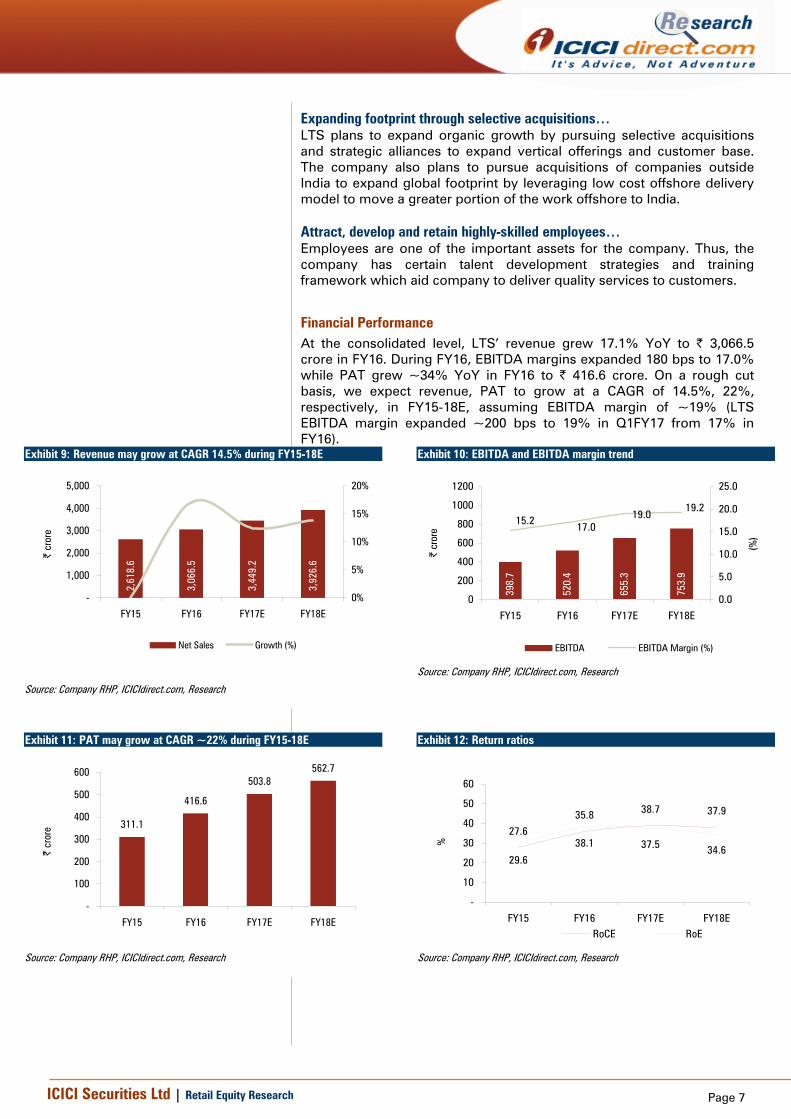
Financial Performance At the consolidated level, LTS’ revenue grew 17.1% YoY to | 3,066.5 crore in FY16. During FY16, EBITDA margins expanded 180 bps to 17.0% while PAT grew ~34% YoY in FY16 to | 416.6 crore. On a rough cut basis, we expect revenue, PAT to grow at a CAGR of 14.5%, 22%, respectively, in FY15-18E, assuming EBITDA margin of ~19% (LTS EBITDA margin expanded ~200 bps to 19% in Q1FY17 from 17% in FY16).
Exhibit 9: Revenue may grow at CAGR 14.5% during FY15-18E
2,61
8.6
3,06
6.5
3,44
9.2
3,92
6.6
-
1,000
2,000
3,000
4,000
5,000
FY15 FY16 FY17E FY18E
| cr
ore
0%
5%
10%
15%
20%
Net Sales Growth (%)
Source: Company RHP, ICICIdirect.com, Research
Exhibit 10: EBITDA and EBITDA margin trend
398.
7
520.
4
655.
3
753.
9
15.217.0
19.019.2
0
200
400
600
800
1000
1200
FY15 FY16 FY17E FY18E
| cr
ore
0.0
5.0
10.0
15.0
20.0
25.0
(%)
EBITDA EBITDA Margin (%)
Source: Company RHP, ICICIdirect.com, Research
Exhibit 11: PAT may grow at CAGR ~22% during FY15-18E
311.1
416.6
503.8562.7
-
100
200
300
400
500
600
FY15 FY16 FY17E FY18E
| cr
ore
Source: Company RHP, ICICIdirect.com, Research
Exhibit 12: Return ratios
27.6
35.8 38.7 37.9
29.6
38.1 37.5 34.6
-
10
20
30
40
50
60
FY15 FY16 FY17E FY18E
%
RoCE RoE
Source: Company RHP, ICICIdirect.com, Research
Page 8ICICI Securities Ltd | Retail Equity Research
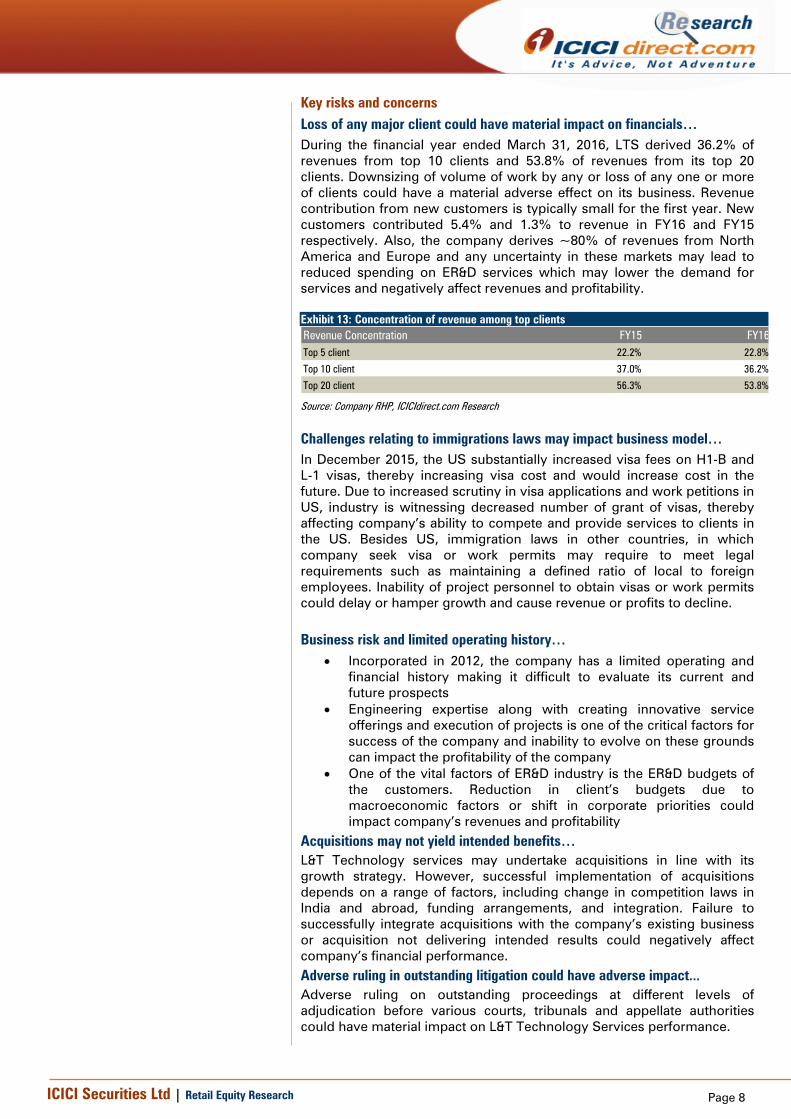
Key risks and concerns Loss of any major client could have material impact on financials… During the financial year ended March 31, 2016, LTS derived 36.2% of revenues from top 10 clients and 53.8% of revenues from its top 20 clients. Downsizing of volume of work by any or loss of any one or more of clients could have a material adverse effect on its business. Revenue contribution from new customers is typically small for the first year. New customers contributed 5.4% and 1.3% to revenue in FY16 and FY15 respectively. Also, the company derives ~80% of revenues from North America and Europe and any uncertainty in these markets may lead to reduced spending on ER&D services which may lower the demand for services and negatively affect revenues and profitability. Exhibit 13: Concentration of revenue among top clients Revenue Concentration FY15 FY16Top 5 client 22.2% 22.8%
Top 10 client 37.0% 36.2%
Top 20 client 56.3% 53.8%
Source: Company RHP, ICICIdirect.com Research
Challenges relating to immigrations laws may impact business model… In December 2015, the US substantially increased visa fees on H1-B and L-1 visas, thereby increasing visa cost and would increase cost in the future. Due to increased scrutiny in visa applications and work petitions in US, industry is witnessing decreased number of grant of visas, thereby affecting company’s ability to compete and provide services to clients in the US. Besides US, immigration laws in other countries, in which company seek visa or work permits may require to meet legal requirements such as maintaining a defined ratio of local to foreign employees. Inability of project personnel to obtain visas or work permits could delay or hamper growth and cause revenue or profits to decline.
Business risk and limited operating history… • Incorporated in 2012, the company has a limited operating and
financial history making it difficult to evaluate its current and future prospects
• Engineering expertise along with creating innovative service offerings and execution of projects is one of the critical factors for success of the company and inability to evolve on these grounds can impact the profitability of the company
• One of the vital factors of ER&D industry is the ER&D budgets of the customers. Reduction in client’s budgets due to macroeconomic factors or shift in corporate priorities could impact company’s revenues and profitability
Acquisitions may not yield intended benefits… L&T Technology services may undertake acquisitions in line with its growth strategy. However, successful implementation of acquisitions depends on a range of factors, including change in competition laws in India and abroad, funding arrangements, and integration. Failure to successfully integrate acquisitions with the company’s existing business or acquisition not delivering intended results could negatively affect company’s financial performance. Adverse ruling in outstanding litigation could have adverse impact... Adverse ruling on outstanding proceedings at different levels of adjudication before various courts, tribunals and appellate authorities could have material impact on L&T Technology Services performance.

Page 9ICICI Securities Ltd | Retail Equity Research
Valuation LTS is one of the leading players in the growing ER&D space. However, the stock is available at 15.5x FY18E EPS, which is at a premium to other IT players who has presence in ER&D space such as HCL Tech (12.3x FY18E EPS) and Cyient Technologies (11.9x FY18E EPS). Hence, we believe current valuations leaves limited upside. We recommend that investors AVOID the issue.
Exhibit 14: Valuation comparison with peers CMP M Cap
(|) (| Cr) FY16 FY17E FY18E FY15 FY16 FY17E FY18E FY15 FY16 FY17E FY18E FY15 FY16 FY17E FY18E FY15 FY16 FY17E FY18EL&T Tech Services (L) 850 8,644 41.0 51.4 58.8 27.8 20.7 17.2 15.4 0.3 16.8 13.1 11.2 27.6 35.8 39.3 38.7 29.6 38.1 38.6 36.2L&T Tech Services (U) 860 8,745 41.0 49.5 55.3 28.1 21.0 17.4 15.5 0.3 17.0 13.3 11.3 27.6 35.8 38.7 37.9 29.6 38.1 37.5 34.6HCL Technology 777 109,625 40.1 57.2 63.2 14.0 19.4 13.6 12.3 10.7 14.8 9.5 8.3 35.8 24.2 28.7 28.2 29.3 20.8 24.7 23.6Cyient 461 5,190 29.0 33.3 38.6 0.0 15.9 13.8 11.9 12.2 10.1 8.7 7.1 22.2 18.6 19.0 20.1 19.2 15.0 15.6 16.2
RoE (%)EPS (|) P/E (x) RoCE(%)EV/EBITDA (x)
Source: Company RHP, ICICIdirect.com Research

Page 10ICICI Securities Ltd | Retail Equity Research
Financial Summary
Exhibit 15: Profit and Loss Statement (| Crore) FY15 FY16 FY17E FY18ENet Sales 2,618.6 3,066.5 3,449.2 3,926.6 Growth (%) - 17.1% 12.5% 13.8%
Employee benefits expense 1,486.6 1,723.1 1,935.0 2,195.0 Operating expenses 230.1 265.6 282.8 322.0 Other expenses 503.2 557.4 576.0 655.7 Total Operating Expenditure 2,219.9 2,546.1 2,793.8 3,172.7
EBITDA 398.7 520.4 655.3 753.9 Growth (%) - 30.5% 25.9% 15.0%
Depreciation & Ammortization 48.5 58.9 69.0 82.5 EBIT 350.3 461.5 586.4 671.5 Growth (%) - 31.8% 27.1% 14.5%
Finance Cost 3.4 2.5 2.0 2.0 Other Income 25.3 76.2 96.5 101.3 PBT 372.1 535.2 680.9 770.8 Tax 61.0 118.6 177.0 208.1 PAT 311.1 416.6 503.8 562.7 Growth (%) - 33.9% 20.9% 11.7%
EPS 30.6 41.0 49.5 55.3 Growth (%) - 33.9% 20.9% 11.7%
Source: Company RHP, ICICIdirect.com, Research
Exhibit 16: Cash Flow Statement (Year-end March) FY15 FY16 FY17E FY18EProfit before Tax 372.1 535.2 680.9 770.8 Depreciation 48.5 58.9 69.0 82.5 Interest (net) 2.2 (0.7) (1.2) (1.2) (Profit)/Loss on sale of fixed assets (0.2) 0.0 - - Cash Flow before WC changes 420.2 527.2 748.7 852.1 (Increase)/Decrease in Trade Receivables (93.1) (11.9) (90.7) (113.2) (Increase)/Decrease in Other Receivables (96.4) 89.9 (56.5) (60.6) (Increase)/Decrease in Trade & other Payables 125.2 73.4 78.3 97.7 Cash generated from operations 355.9 678.5 679.7 776.0 Direct Taxes Paid (67.0) (144.8) (177.0) (208.1) Net CF from Operating Activities 288.9 533.7 502.7 567.8 (Purchase)/Sale of Fixed Assets (52.7) (126.9) (100.0) (100.0) (Purchase)/Sale in current Investments - (55.5) - - Consideration paid towards businesses purchased (609.6) - - - Interest Received 1.2 3.2 3.2 3.2 Net CF from Investing Activities (667.1) (179.3) (96.8) (96.8) Share Capital Issued 547.3 - - - Proceeds from/(Repayment of) borrowings 170.1 (23.3) (25.0) (25.0) Interest Paid (3.4) (2.5) (2.0) (2.0) Dividend Paid (219.9) (302.0) (201.5) (225.1) Dividend Tax (30.0) (55.6) (50.4) (56.3) Net CF from Financing activites 464.0 (383.4) (278.9) (308.3) Net increase in cash & cash equivalents 85.8 (28.9) 126.9 162.7 Cash & Cash equivalents at beginning of year 29.5 115.3 86.4 213.4 Cash & Cash equivalents at end of year 115.3 86.4 213.4 376.0
Source: Company RHP, ICICIdirect.com, Research

Page 11ICICI Securities Ltd | Retail Equity Research
Exhibit 17: Balance Sheet (| Crore) FY15 FY16 FY17E FY18EEquity Capital 1,050.0 1,050.0 1,050.0 1,050.0 Reserve and Surplus 2.1 42.5 294.4 575.8 Total Shareholders funds 1,052.1 1,092.5 1,344.4 1,625.8 Short term borrowings 218.8 195.5 170.5 145.5 Other long term liabilities 5.0 6.0 6.0 6.0 Long term provisions 2.0 13.2 14.9 16.9 Total Liabilities 1,277.8 1,307.2 1,535.8 1,794.2 Fixed Assets 569.6 635.2 666.2 683.8 Tangible 83.2 107.1 113.3 116.8 Intangible 478.4 506.2 531.1 545.1 Capital WIP 0.4 14.3 14.3 14.3 Goodwill on consolidatiom 7.6 7.6 7.6 7.6 Deferred tax asset 36.7 35.8 35.8 35.8 Long term loans & advances 72.0 34.1 47.2 53.8 Total Non Current Assets 678.3 705.1 817.8 931.0 Current investments - 55.5 55.5 55.5 Trade receivables 685.3 727.1 817.8 931.0 Unbilled revenue 175.3 147.0 165.4 188.3 Cash and Bank 115.3 86.4 213.4 376.0 Short term loans & advances 160.0 200.2 225.2 256.4 Total Current Assets 1,136.0 1,216.3 1,477.3 1,807.2 Trade Payables 168.9 173.9 195.6 222.7 Other current liabilities 72.4 104.2 117.2 133.4 Short term provisions 295.2 336.1 378.0 430.3 Total Current Liabilities 536.5 614.2 690.8 786.4 Net Current Assets 599.5 602.1 786.5 1,020.8 Total Assets 1,277.8 1,307.2 1,535.8 1,794.2
Source: Company RHP, ICICIdirect.com, Research
Exhibit 18: Key Ratios (Year-end March) FY15 FY16 FY17E FY18EPer share data (|)EPS 30.6 41.0 49.5 55.3 BV 103.5 107.4 132.2 159.9 DPSCash Per Share 11.3 8.5 21.0 37.0
Operating Ratios (%)EBIT Margin 13.4 15.0 17.0 17.1 PBT Margin 14.2 17.5 19.7 19.6 PAT Margin 11.9 13.6 14.6 14.3 Debtor days 96 87 87 87 Creditor days 24 21 21 21
Return Ratios (%)RoE 29.6 38.1 37.5 34.6 RoCE 27.6 35.8 38.7 37.9
Valuation Ratios (x)P/E 28.1 21.0 17.4 15.5 EV / EBITDA 0.3 17.0 13.3 11.3 EV / Net Sales 0.0 2.9 2.5 2.2 Market Cap / Sales 3.3 2.9 2.5 2.2 Price to Book Value 8.3 8.0 6.5 5.4
Solvency RatiosDebt/EBITDA 0.5 0.4 0.3 0.2 Debt / Equity 0.2 0.2 0.1 0.1 Current Ratio 2.1 2.0 2.1 2.3
Source: Company RHP, ICICIdirect.com, Research

Page 12ICICI Securities Ltd | Retail Equity Research
RATING RATIONALE ICICIdirect.com endeavours to provide objective opinions and recommendations. ICICIdirect.com assigns ratings to its stocks according to their notional target price vs. current market price and then categorises them as Strong Buy, Buy, Hold and Sell. The performance horizon is two years unless specified and the notional target price is defined as the analysts' valuation for a stock. Strong Buy: >15%/20% for large caps/midcaps, respectively, with high conviction; Buy: >10%/15% for large caps/midcaps, respectively; Hold: Up to +/-10%; Sell: -10% or more;
Pankaj Pandey Head – Research [email protected]
ICICIdirect.com Research Desk, ICICI Securities Limited, 1st Floor, Akruti Trade Centre, Road No 7, MIDC, Andheri (East) Mumbai – 400 093

Page 13ICICI Securities Ltd | Retail Equity Research
ANALYST CERTIFICATION We /I, Deepak Purswani, CFA MBA (Finance), Tushar Wavhal, MBA, Deepti Tayal, MBA, Research Analysts, authors and the names subscribed to this report, hereby certify that all of the views expressed in this research report accurately reflect our views about the subject issuer(s) or securities. We also certify that no part of our compensation was, is, or will be directly or indirectly related to the specific recommendation(s) or view(s) in this report.
Terms & conditions and other disclosures: ICICI Securities Limited is a Sebi registered Research Analyst having registration no. INH000000990. ICICI Securities Limited (ICICI Securities) is full-service, integrated investment banking and is, inter alia, engaged in the business of stock brokering and distribution of financial products. ICICI Securities is a wholly-owned subsidiary of ICICI Bank which is India’s largest private sector bank and has its various subsidiaries engaged in businesses of housing finance, asset management, life insurance, general insurance, venture capital fund management, etc. (“associates”), the details in respect of which are available on www.icicibank.com ICICI Securities is one of the leading merchant bankers/ underwriters of securities and participate in virtually all securities trading markets in India. We and our associates might have investment banking and other business relationship with a significant percentage of companies covered by our Investment Research Department. ICICI Securities generally prohibits its analysts, persons reporting to analysts and their relatives from maintaining a financial interest in the securities or derivatives of any companies that the analysts cover. The information and opinions in this report have been prepared by ICICI Securities and are subject to change without any notice. The report and information contained herein is strictly confidential and meant solely for the selected recipient and may not be altered in any way, transmitted to, copied or distributed, in part or in whole, to any other person or to the media or reproduced in any form, without prior written consent of ICICI Securities. While we would endeavour to update the information herein on a reasonable basis, ICICI Securities is under no obligation to update or keep the information current. Also, there may be regulatory, compliance or other reasons that may prevent ICICI Securities from doing so. Non-rated securities indicate that rating on a particular security has been suspended temporarily and such suspension is in compliance with applicable regulations and/or ICICI Securities policies, in circumstances where ICICI Securities might be acting in an advisory capacity to this company, or in certain other circumstances. This report is based on information obtained from public sources and sources believed to be reliable, but no independent verification has been made nor is its accuracy or completeness guaranteed. This report and information herein is solely for informational purpose and shall not be used or considered as an offer document or solicitation of offer to buy or sell or subscribe for securities or other financial instruments. Though disseminated to all the customers simultaneously, not all customers may receive this report at the same time. ICICI Securities will not treat recipients as customers by virtue of their receiving this report. Nothing in this report constitutes investment, legal, accounting and tax advice or a representation that any investment or strategy is suitable or appropriate to your specific circumstances. The securities discussed and opinions expressed in this report may not be suitable for all investors, who must make their own investment decisions, based on their own investment objectives, financial positions and needs of specific recipient. This may not be taken in substitution for the exercise of independent judgment by any recipient. The recipient should independently evaluate the investment risks. The value and return on investment may vary because of changes in interest rates, foreign exchange rates or any other reason. ICICI Securities accepts no liabilities whatsoever for any loss or damage of any kind arising out of the use of this report. Past performance is not necessarily a guide to future performance. Investors are advised to see Risk Disclosure Document to understand the risks associated before investing in the securities markets. Actual results may differ materially from those set forth in projections. Forward-looking statements are not predictions and may be subject to change without notice. ICICI Securities or its associates might have managed or co-managed public offering of securities for the subject company or might have been mandated by the subject company for any other assignment in the past twelve months. ICICI Securities or its associates might have received any compensation from the companies mentioned in the report during the period preceding twelve months from the date of this report for services in respect of managing or co-managing public offerings, corporate finance, investment banking or merchant banking, brokerage services or other advisory service in a merger or specific transaction. ICICI Securities or its associates might have received any compensation for products or services other than investment banking or merchant banking or brokerage services from the companies mentioned in the report in the past twelve months. ICICI Securities encourages independence in research report preparation and strives to minimize conflict in preparation of research report. ICICI Securities or its analysts did not receive any compensation or other benefits from the companies mentioned in the report or third party in connection with preparation of the research report. Accordingly, neither ICICI Securities nor Research Analysts have any material conflict of interest at the time of publication of this report. It is confirmed that Deepak Purswani, CFA MBA (Finance), Tushar Wavhal, MBA, Deepti Tayal, MBA, Research Analysts of this report have not received any compensation from the companies mentioned in the report in the preceding twelve months. Compensation of our Research Analysts is not based on any specific merchant banking, investment banking or brokerage service transactions. ICICI Securities or its subsidiaries collectively or Research Analysts do not own 1% or more of the equity securities of the Company mentioned in the report as of the last day of the month preceding the publication of the research report. Since associates of ICICI Securities are engaged in various financial service businesses, they might have financial interests or beneficial ownership in various companies including the subject company/companies mentioned in this report. It is confirmed that Deepak Purswani, CFA MBA (Finance), Tushar Wavhal, MBA, Deepti Tayal, MBA, Research Analysts do not serve as an officer, director or employee of the companies mentioned in the report. ICICI Securities may have issued other reports that are inconsistent with and reach different conclusion from the information presented in this report. Neither the Research Analysts nor ICICI Securities have been engaged in market making activity for the companies mentioned in the report. We submit that no material disciplinary action has been taken on ICICI Securities by any Regulatory Authority impacting Equity Research Analysis activities. This report is not directed or intended for distribution to, or use by, any person or entity who is a citizen or resident of or located in any locality, state, country or other jurisdiction, where such distribution, publication, availability or use would be contrary to law, regulation or which would subject ICICI Securities and affiliates to any registration or licensing requirement within such jurisdiction. The securities described herein may or may not be eligible for sale in all jurisdictions or to certain category of investors. Persons in whose possession this document may come are required to inform themselves of and to observe such restriction.