Embed Size (px)
Citation preview
Separation TrainsAzeotropes
Chapt. 8

What is an Azeotrope?
Introduction Separation sequences are complicated by the presence of
azeotropes, often involving mixtures of oxygenated organic compounds:AlcoholsKetonesEthersAcidsWater
In these cases, distillation boundariesdistillation boundaries limit the product compositions of a column to lie within a bounded regionPrevents the removal of certain species in high
concentrations

Binary Distillation
IPA/IPE
x
x
x
IPA-IPE
Mininum-boiling orMaximum-boilingAzeotropes
Can multi-component Distillations have Azeotropes?
•Yes!

Azeotrope Conditions
• Conditions on the Activity Coefficient
• Minimum Boiling, γjL> 1
• Maximum Boiling, γjL< 1
• xj=yj, j=,1,2,…C
Law sRaoult' from Deviations Negative,...2,1,1
Law sRaoult' from Deviations Positive,...2,1,1
)1( 221111
Cj
Cj
PxPxP
Lj
Lj
sLsLT
Raoult’s Law
satii PxP
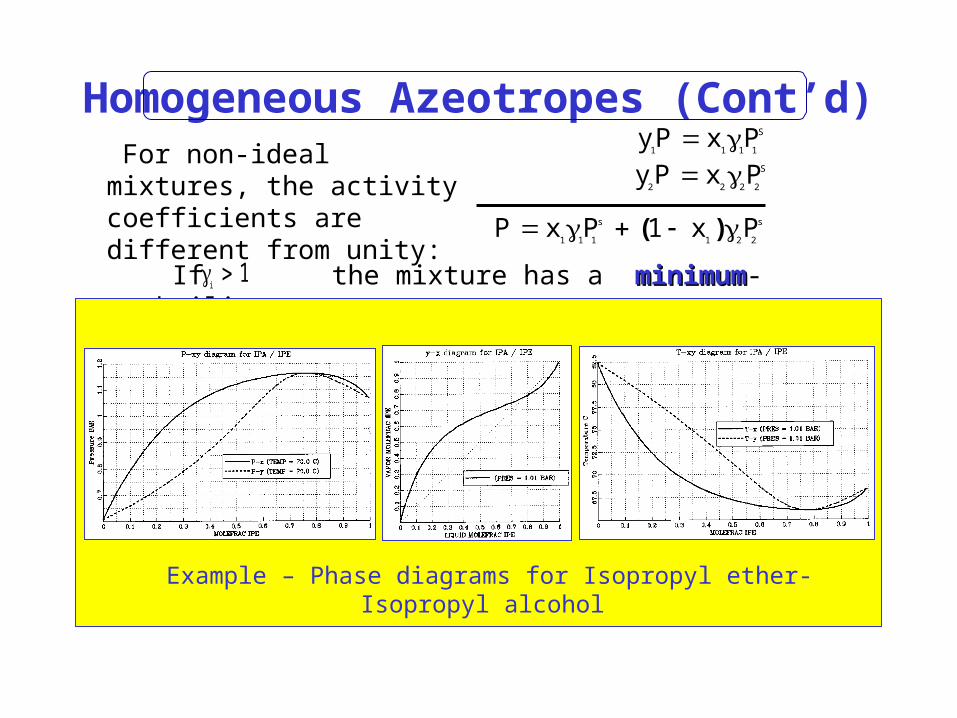
Homogeneous Azeotropes (Cont’d) For non-ideal mixtures, the activity coefficients are different from unity:
S
1 1 1 1yP x P
S
2 2 2 2yP x P
s s
1 1 1 1 2 2P x P 1 x P( )
If the mixture has a minimumminimum-boiling azeotrope
i1
Example – Phase diagrams for Isopropyl ether-Isopropyl alcohol

Homogeneous Azeotropes (Cont’d) For non-ideal mixtures, the activity coefficients are different from unity:
S
1 1 1 1yP x P
S
2 2 2 2yP x P
s s
1 1 1 1 2 2P x P 1 x P( )
If the mixture has a maximummaximum-boiling azeotrope
i1
Example – Phase diagrams for Acetone-Chloroform

Importance of Physical Property Data Set
• In all cases– Need sophisticated liquid phase model to
accurately predict the activity coefficient for the liquid.
• For High Pressure Cases Only– Also need sophisticated (non-ideal) gas phase
fugacity model

Two Types of Min. Boiling Azeotropes
• Homogeneous Azeotrope • Heterogeneous Azeotrope
Overlay withLiquid/Liquid Separation which is sometimes best separation method

Instructional Objectives
Be able to sketch the residue curves on a tertiary phase diagram
Be able to define the range of possible product compositions using distillation, given the feed composition and the tertiary phase diagram
Be able to define the PFD for a heterogeneous azeotropic distillation system
Be able to define the PFD for a pressure swing distillation system
When you have finished studying this unit, you should:

Concepts Needed
• Phase Diagram for 3 phases
• Lever Rule on Phase Diagram
• Residue Curves

0.15 H2O
0.65 DTBP
0.2 TBA
0.2 DTBP
Basics: 3-Phase Diagrams
TBA = Tertiary-butyl alcoholDTBP = Di-tertiary-butyl peroxide
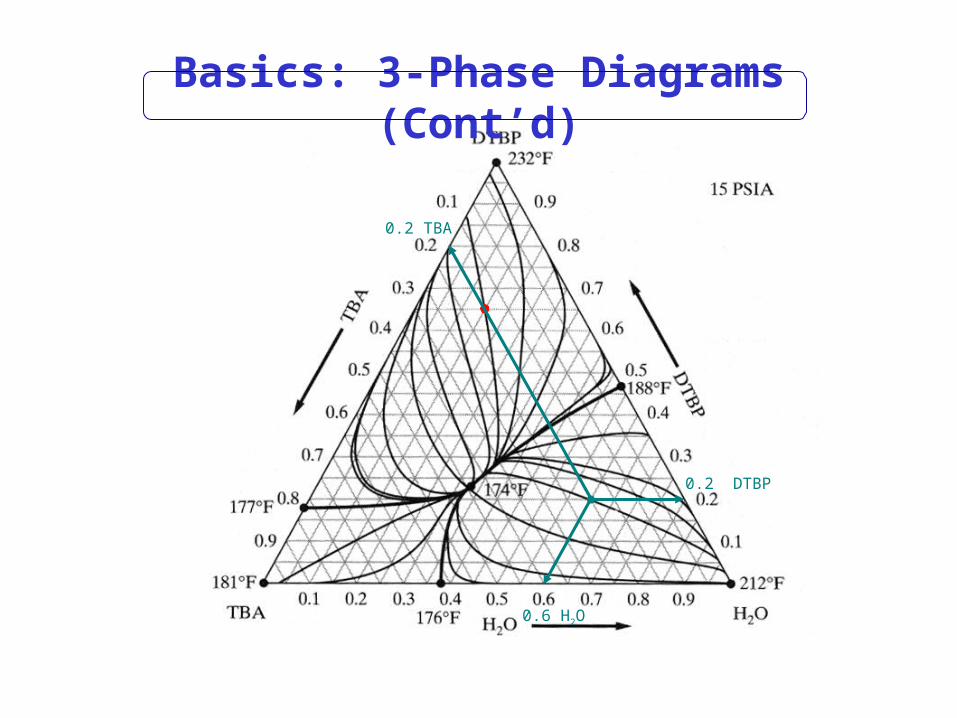
0.6 H2O
0.2 DTBP
0.2 TBA
Basics: 3-Phase Diagrams (Cont’d)

Basics: The Lever Rule

j j j j j jLx ydL Lx Ldx xdL dLdx j 1 C 1, , ,
Residue Curves
Mass balance on species j:
j j j jLx L y L L x x j 1 C 1( ) ( )( ), , ,
As L 0:
Distillation still
j
j j j j
dxx y x 1 K T P x y
dL L( { , , , })
/
Rearranging:
j
j j
dxx y
dt

Multi-component Azeotropes
• Residue Curve Map– dxj /dť = dxj /d ln(L) = xj – yj
• Integrate from various starting points
Arrows from low to High TempPath of the residue composition

Sketching Residue Curves (Exercise)j
j j
dxx y
dt

Distillation
• XB, XF and YD form a line for a Distillation Column
• Line can not cross Feasible Region line
For Partial Condenser
For TotalCondenser
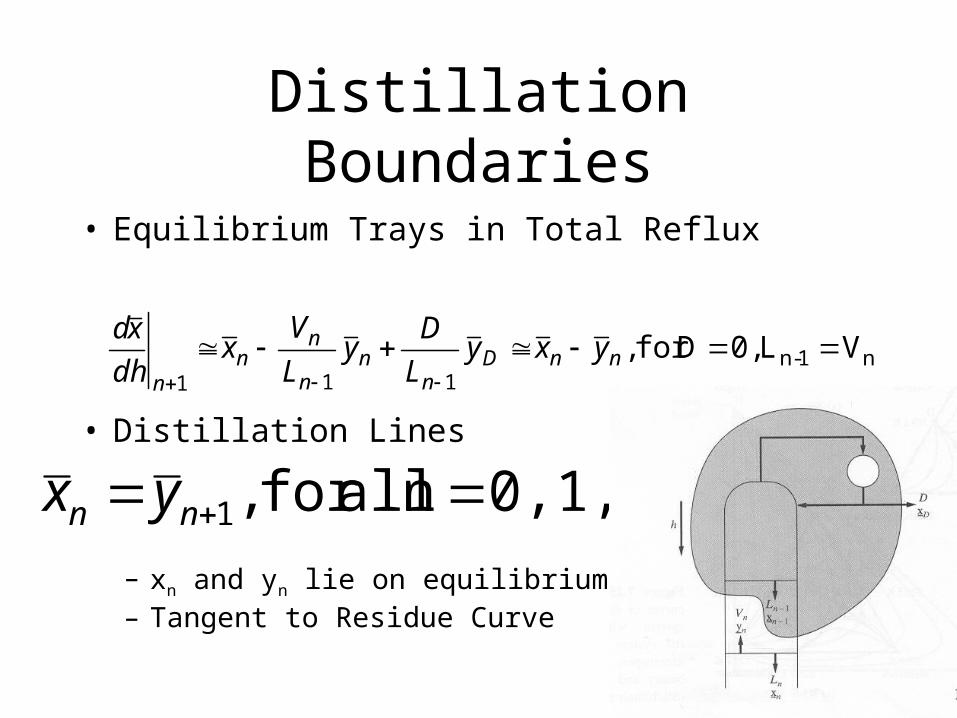
Distillation Boundaries
• Equilibrium Trays in Total Reflux
• Distillation Lines
– xn and yn lie on equilibrium tie lines– Tangent to Residue Curve
n1-n111
VL 0,Dfor ,
nnDn
nn
nn
n
yxyL
Dy
L
Vx
dh
xd
0,1,...n allfor ,1 nn yx

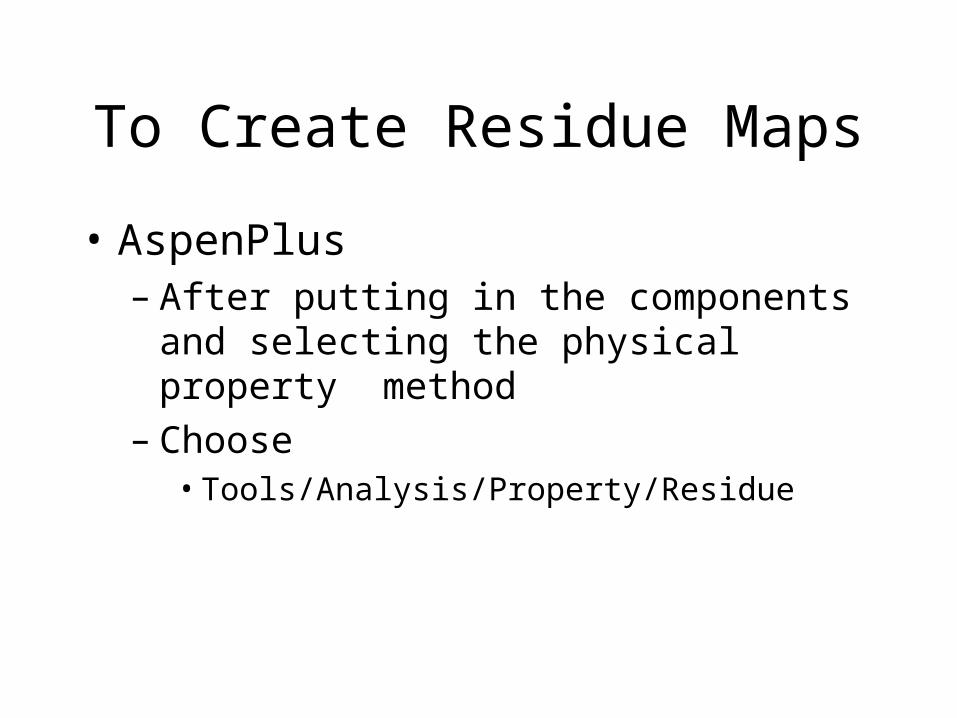
To Create Residue Maps
• AspenPlus– After putting in the components and selecting
the physical property method– Choose
• Tools/Analysis/Property/Residue

Residue Curves Liquid Compositions at Total Reflux
Species balance on top n-1 trays:
n
n n 1
dxx x
dh
n 1 n 1 n nDL x Dx Vy
Approximation for liquid phase:
Substituting:
n n
n n D
n 1 n 1
dx V Dx y x
dh L L
At total reflux, D = 0 and Vn = Ln-1
n
n n
dxx y
dh
Stripping section of distillation column
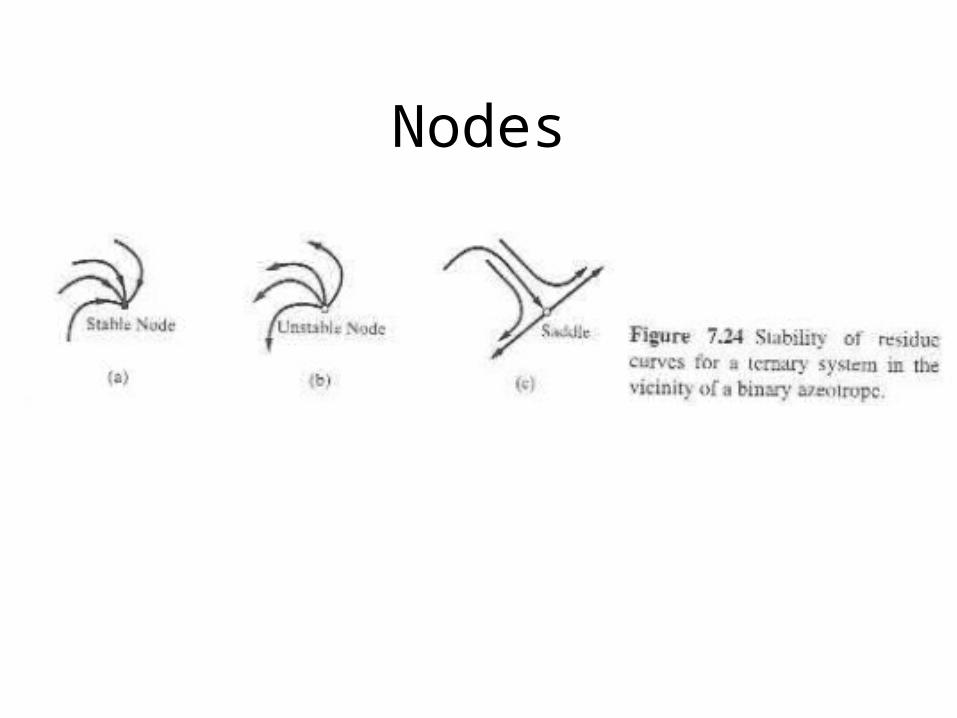
Nodes
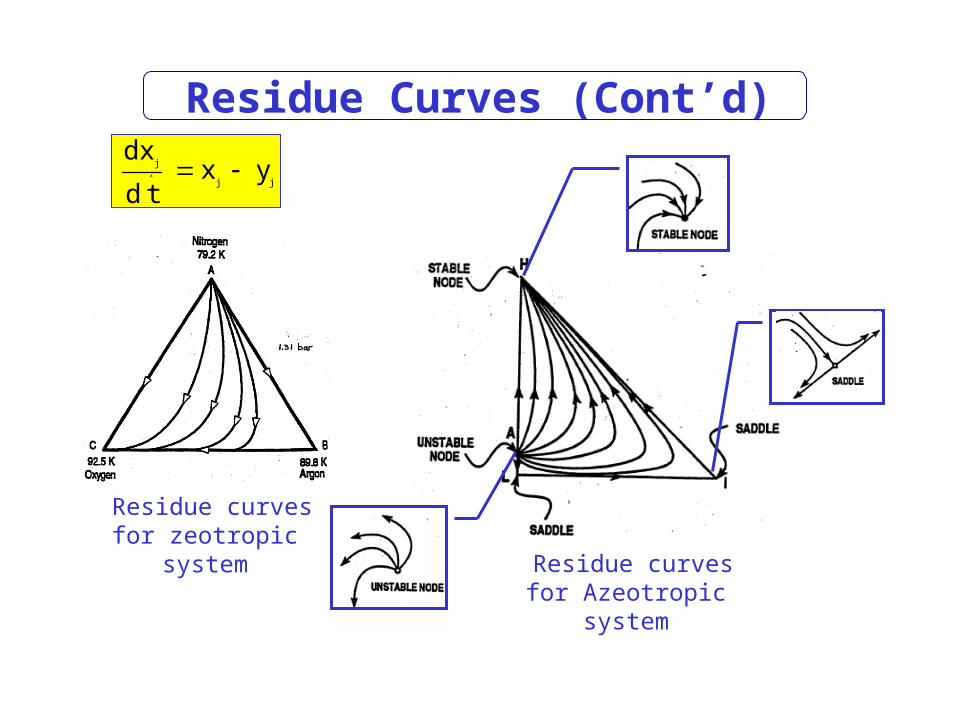
Residue curves for Azeotropic
system
Residue Curves (Cont’d)j
j j
dxx y
dt
Residue curves for zeotropic
system

Defining Conditions for Multi-component Azeotrope
t goes from 0 to 1, ideal to non-ideal to find Azeotrope

Product Composition Regions for Zeotropic Systems

Product Composition Regions for Azeotropic Systems

Example: Dehydration of Ethanol
Heterogeneous Azeotropic Distillation
Try toluene as an entrainer
What are the zones of exclusion?

Ethanol/Water Distillation with Toluene to Break
Azeotrope
Distillation LineTie LineS1
S2
M1M2
D1
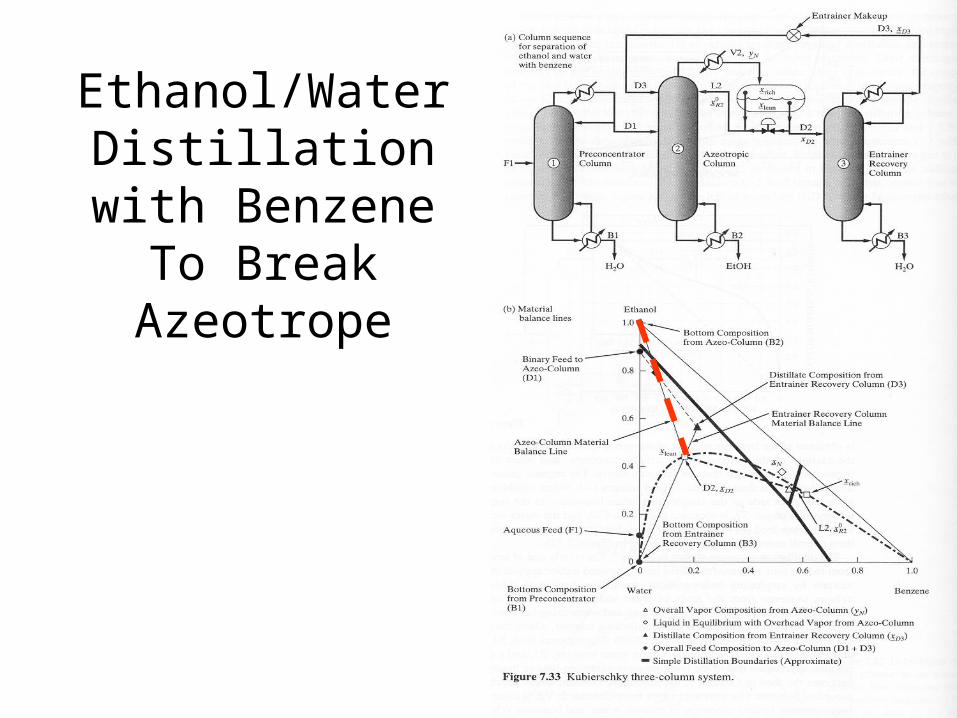
Ethanol/Water Distillation with
BenzeneTo Break Azeotrope

How To Break Azeotropes with Entrainer
• Separation Train Synthesis– Identify Azeotropes– Identify alternative separators
• Some distillations are not Azeotropic and can be accomplished relatively easily
– Select Mass Separating Agent or Entrainer– Identify feasible distillate and bottoms product
compositions• Residue Curve Analysis

Pressure Swing to Break Azeotrope
Temp. of Azeotropevs. Pressure
Mole Fraction of Azeotrope

T-x-y diagrams for THF and water
Example: Dehydration of Tetrahydrofuran (THF)
Pressure-swing Distillation (Cont’d)

Other Multi-component Distillation Problems
• Multiple Steady States – Run same distillation column with same set
points but different computational starting point
• Get Two or More Different Results– Top or bottom compositions– This is real in that the column will have two
different operating conditions!– Happens most often with multi component
distillation