Embed Size (px)
Citation preview

IWPR C377 September 2010
1200 18th Street, NW ♦ Suite 301 ♦ Washington, DC 20036 ♦ (202) 785-5100 ♦ www.iwpr.org
Occupational gender segregation is astrong feature of the US labor market.While some occupations have become in-creasingly integrated over time, others re-main highly dominated by either men orwomen. Our analysis of trends in overallgender segregation shows that, after a con-siderable move towards more integratedoccupations in the 1970s and 1980s,progress has completely stalled since themid 1990s. Occupational segregation is aconcern to policy makers for two reasons:it is inefficient economically, preventingable people from moving into occupationswhere they could perform well and thatwould satisfy them more than the onesopen to them. And occupational segrega-tion is a major cause for the persistentwage gap. Our analysis confirms that av-
erage earnings tend to be lower the higher the percentage of female workers in an occupation, and that this relation-ship is strongest for the most highly skilled occupations, such as medicine or law. Yet this is also a strong feature of jobsrequiring little formal education and experience, increasing the likelihood of very low earnings for women working infemale-dominated, low-skilled occupations such as childcare.
Separate and Not Equal? Gender Segregation in the Labor Market and the Gender Wage Gap
Ariane Hegewisch, Hannah Liepmann, Jeffrey Hayes, and Heidi Hartmann
IntroductionIn 2009, occupational gender segregation continued to be a strong feature of the US labor market. Among the 502 occupa-
tions identified by the Census Bureau, and covering the entire US civilian labor force, four of ten women (39.7 percent) workedin female-dominated occupations (those where incumbents are at least 75 percent female); these occupations employ fewerthan one in twenty men (4.5 percent; IWPR 2010a).1 Slightly more than four of ten men (43.6 percent) and only 5.5 percentof all women worked in male-dominated occupations (those where incumbents are at least 75 percent male). Our analysis forthis Briefing Paper of trends in overall occupational gender segregation suggests that progress towards integration was madein the 1970s and 1980s, but that virtually no more progress can be observed since the mid 1990s (precisely 1996).
There are two reasons why such stark occupational segregation should be of concern to policy makers. Even though someof these patterns may be due to gendered preferences—a substantial body of social science research suggests that socializationin relation to gender norms continues to influence men’s and women’s average preferences and behavior (e.g., England 2005;Hulett, Bendick, Thomas and Moccio 2008)—much of these patterns reflects barriers to entry to occupations, ranging from lack
INSTITUTE FOR WOMEN’S POLICY RESEARCH
Brief ing Paper

2Separate and Not Equal? Gender Segregation in the Labor Market and the Gender Wage Gap
of information about alternative job options to active discouragement and harassment.Such barriers artificially restrict the movement of the most qualified and motivatedpeople into occupations that would suit them best, exacerbate skill shortages, and re-duce economic growth (Hill, Corbett, and Rose 2010).
A second reason for concern is the link between occupational segregation and gen-der inequality in earnings. In 2009, the median weekly earnings of full-time, femaleworkers were 80.2 percent of what full-time male workers earned. Full-time, employedwomen on average earned less than their male counterparts in 104 of 108 occupationsfor which the Bureau of Labor Statistics (BLS) provides earnings data for both maleand female workers (IWPR 2010a).2 This suggests that the gender wage gap is an al-most universal feature of the labor market, regardless of where women work. At thesame time, female-dominated occupations have been shown to pay less than male-dom-inated occupations at the same skill levels (England, Allison, and Wu 2006). This im-plies that even if there is a gender wage gap within almost all occupations, women might be able to increase their absoluteearnings by choosing to train for and work in occupations with higher shares of male workers. This link between occupationalsegregation and the gender wage gap makes occupational segregation relevant to the economic security of women and their fam-ilies.
This Briefing Paper presents original data analyses of trends in occupational segregation over time and of the link betweenoccupational segregation and the gender pay gap. First, trends in the gender composition of selected occupations are illus-trated. Second, based on the Index of Dissimilarity, general trends in the occupational segregation of the labor market are an-alyzed. This analysis is conducted for the civilian labor force as a whole, for different educational levels, for different agegroups, and for different race and ethnic groups. It is based on Current Population Survey data as provided by the IntegratedPublic Use Microdata Series and includes all workers aged 25 to 64. Third, the relationship between the percentage of femaleworkers and the median earnings in occupations is explored. The analysis is based on 2009 earnings data for full-time work-ers aged 16 and older as provided by the BLS and on the BLS’ classification of skill levels required for each occupation as ad-justed by IWPR. Low-skilled, medium-skilled, and high-skilled occupations are distinguished.
Trends in Gender Segregation in Selected OccupationsDuring the last few decades the face of the American workforce has changed dra-
matically as more and more women entered the workforce and sought work in occupa-tions in which women were previously only a tiny minority of workers. Figure 1 showstrends in women’s share in selected occupations that were male- or female-dominatedin 1972 and require less than a four-year college degree, while Figure 2 illustrateswomen’s share in selected occupations requiring at least four years of college. Bothshow significant change in some occupations but not others. Women were only 6.7 per-cent of mail carriers in 1972, but their share had risen to 34.9 percent of this occupa-tion by 2009 (Figure 1). Likewise, the share of women photographers has increased markedly, from about one in six (15.6percent) in 1972 to close to half of all photographers (44.7 percent; Figure 1). The share of women dentists increased from only1.9 percent in 1972 to 30.5 percent in 2009 (Figure 2) and for women lawyers from 4.0 percent of the profession in 1972 to32.2 percent in 2009 (Figure 2). Change has also occurred in some occupations, such as ‘cashiers,’ which, in 1972, were clas-sified as ‘female-dominated’ but no longer were so in 2009; ‘cashiers’ were 86.4 percent female in 1972, compared with 74.4percent in 2009 (Figure 1).
Yet other occupations have seen very little change in their gender composition and remain highly dominated by either menor women. Of those occupations requiring less than a four-year college degree 97.6 percent of all dental assistants were femalein 2009, compared with 97.9 percent in 1972, and 90.4 percent of all hairdressers, hairstylists and cosmetologists, comparedwith 91.2 percent in 1972 (Figure 1). Among those occupations requiring at least a four-year college degree, 96.8 percent ofall prekindergarten and kindergarten teachers were female in 1972, compared with 97.8 percent in 2009; 82.7 percent of all li-brarians were female in 1972, compared with 81.6 percent in 2009; and 97.6 percent of ‘registered nurses’ in 1972 comparedwith 92 percent in 2009 (Figure 2).
The link between occupational segregation
and the gender wage gap makes occupational
segregation relevant to the economic security of
women and their families.
Women have gained insuch occupations as mail
carrier, photographer, physician, lawyer,
and dentist.

3Separate and Not Equal? Gender Segregation in the Labor Market and the Gender Wage Gap
Likewise, change has been at most marginal in some male-dominated occupations. In 1972 women were 0.5 percent of ma-chinists, 0.6 percent of electricians and 0.5 percent of carpenters, and in 2009 only 5.4 percent of all machinists, 2.2 percentof all electricians, and 1.6 percent of all carpenters were female.
The data also show that change does not occur only towards greater gender integration. Taking ‘computer programmers’ asan example, it is not only that proportionately in 2009 there were only marginally more female ‘computer programmers’ thanin 1972 (20.3 percent now compared to 19.9 percent then), but also that after an initial increase in women’s share of the occu-pation to more than one-third of programmers in the late 1980s, their share has fallen consistently since 1989. Civil engineer-ing is another occupation that has seen a marked fall in women’s share of the profession after initial progress; the share ofwomen among ‘civil engineers’ has almost halved in recent years, falling from its highest level of 13.2 percent in 2005 to only7.1 percent in 2009 (Figure 2).
Figure 1: Share of Women in Selected Occupations Requiring Less than Four Years of College, 1972-2009
0
10
20
30
40
50
60
70
80
90
100
1972 1974 1976 1978 1980 1982 1984 1986 1988 1990 1992 1994 1996 1998 2000 2002 2004 2006 2008 2009
Shar
e of
wom
en in
occ
upat
ion
(%) Dental assistants
Hairdressers and cosmetologists
Cashiers
Photographers
Mail carriers, post office
Machinists
Carpenters
Electricians
Notes: Data refer to annual averages and to all employed persons 16 years and older. From 2003 on, the category of ‘hairdressers and cosmetologists’ includes‘hair stylists’ explicitly.
Source: IWPR compilation of data from the U.S. Department of Labor, Bureau of Labor Statistics, “B-20. Employed persons by detailed occupation, sex, andrace, 1972-81;” “Employed persons by detailed occupation, sex, and race (1982);” “Employed persons by detailed occupation and sex, 1983-2002 annualaverages;” “Employed persons by detailed occupation and sex, annual averages 2000-09.” Data are from the Current Population Survey.

4Separate and Not Equal? Gender Segregation in the Labor Market and the Gender Wage Gap
Figure 2: Share of Women in Selected Occupations Requiring Four Years of College or more, 1972 to 2009
1972 1974 1976 1978 1980 1982 1984 1986 1988 1990 1992 1994 1996 1998 2000 2002 2004 2006 2008 2009
Shar
e of
wom
en in
occ
upat
ion
(%)
0
10
20
30
40
50
60
70
80
90
100
Teachers, pre-kindergarten and kindergarten
Registered nurses
Librarians
Pharmacists
Physicians and surgeons
Lawyers
Dentists
Computer programmers
Civil engineers
Notes: Data refer to all employed persons aged 16 and older. Between 1975 and 1982, ‘physicians and surgeons’ were described as ‘physicians, medical and os-teopathic’ and between 1983 and 2002 as ‘physicians.’ The most common level of education for preschool teachers is a postsecondary vocational award,while it is a Bachelor’s degree for kindergarten teachers. After 2003, ‘teachers, prekindergarten and kindergarten’ were accounted for as ‘preschool andkindergarten teachers.’
Source: IWPR compilation based on same data sources as Figure 1.
Trends in Overall Occupational Gender Segregation The data on changes in selected occupations suggest a differentiated picture, with some occupations becoming increasingly inte-
grated over time, other occupations showing little movement towards a greater gender balance, and others showing increased segre-gation. The ‘Index of Dissimilarity’ provides an analytical tool for assessing which occupational trends are typical for the labor marketas a whole. The Index measures how many women or men would have to change occupations to achieve the same gender composi-tion in each occupation as in the civilian labor force overall. Each person is given equal weight, so that changes in larger occupationsaffect the index more than smaller ones; changes in the size of occupations also affectthe level of the index even when no change in the gender composition of occupationsoccurs. The index ranges from 0 (complete integration) to 1 (maximal segregation;Duncan and Duncan 1955).3
Tracking change in the Index of Dissimilarity between 1972 and 2009, Figure 3shows that during the first 25 years of that period there was significant reduction inoccupational gender segregation of the civilian labor force. The Index for all workersfell from 0.68 in 1972 to 0.50 in 2002, when it was at its lowest point, a dip of 26 per-cent. Yet, in 2009 and most of the years since 1996, the index has hovered around0.51. The trend towards integration appears to have stalled; there has been no furtherprogress towards occupational gender balance.
After initial gains for womencomputer programmers, their
share of the occupation hasfallen consistently since 1989,
and women’s share of civil engineers peaked in 2005.
5Separate and Not Equal? Gender Segregation in the Labor Market and the Gender Wage Gap
There are two different factors that contribute to change in the Index of Dissimilarity: a ‘composition’ effect’ and an occupational‘mix’ effect. The ‘composition’ effect refers to the gender balance in individual occupations: the Index of Dissimilarity falls whenmore women work in previously male-dominated occupations, such as has been the case for lawyers, dentists and mail carriers; al-ternatively, the Index rises when women’s share of such occupations falls, such as recently in computer programming and civil en-gineering ( Figures 1 and 2). The occupational ‘mix’ effect refers to the impact of different employment growth rates for differentoccupations: the Index falls if more gender-integrated occupations (such as legal or accounting occupations) grow faster than moregender-segregated occupations (such as many manufacturing occupations; data not shown); alternatively, when highly segregatedoccupations (such as nursing and other healthcare occupations; data not shown) grow faster than more integrated occupations, theIndex will rise (showing greater segregation), even if the gender balance within individual occupations stays constant.
Following Blau and Hendricks (1979), we analyze the effect on the Index of each of these two factors separately, in each of thelast four decades.4 Our analysis suggests that during the first two decades the fall in gender segregation was due to the compositioneffect, while the mix effect, although overall of lower magnitude, went in the opposite direction. This changed during the 1990s whenboth the composition and the mix effects led to a further reduction in occupational gender segregation, albeit to a smaller extent thanin the previous decades. Finally, in the current decade, change in the composition of occupations has become almost insignificant,while the mix effect is resulting in a small overall increase in gender occupational segregation. In other words, during previousdecades the main driver of change in occupational gender segregation was greater gender balance within individual occupations;during the current decade, the gender balance within occupations has hardly changed at all, while overall segregation has slightlyincreased because more segregated occupations have seen higher employment growth than more integrated ones.
Occupational Segregation Among Workers at Different Educational LevelsThe Index of Dissimilarity is typically lower for workers with at least four years of college and higher for workers with lower
levels of education; until the late 1990s segregation fell faster for highly educated workers than for other workers (Figure 3).5 Yet,just as for workers with lower levels of education, further progress towards gender integration has stalled for all workers, includ-ing the college-educated, in recent years.
0.40
0.45
0.50
0.55
0.60
0.65
0.70
0.75
1972 1974 1976 1978 1980 1982 1984 1986 1988 1990 1992 1994 1996 1998 2000 2002 2004 2006 2008 2009
Less than 4 years of college
Civilian labor force
4 years of college or more
Inde
x of
Dis
sim
ilarit
y
Figure 3. Trends in Occupational Segregation by Gender: The Index of Dissimilarity, 1972-2009
Notes: Occupations are consistently classified according to the 1990 Census occupational classification. The analysis is restricted to the civilian labor force, and toworkers aged 25 to 64, as it is reasonable to expect that persons in this age group have generally completed their schooling and have not yet retired.
Source: IWPR compilations are based on the Current Population Survey, March/Annual Social and Economic Supplement (ASEC), as provided by Miriam King,Steven Ruggles, Trent Alexander, Donna Leicack, and Matthew Sobek (2009).
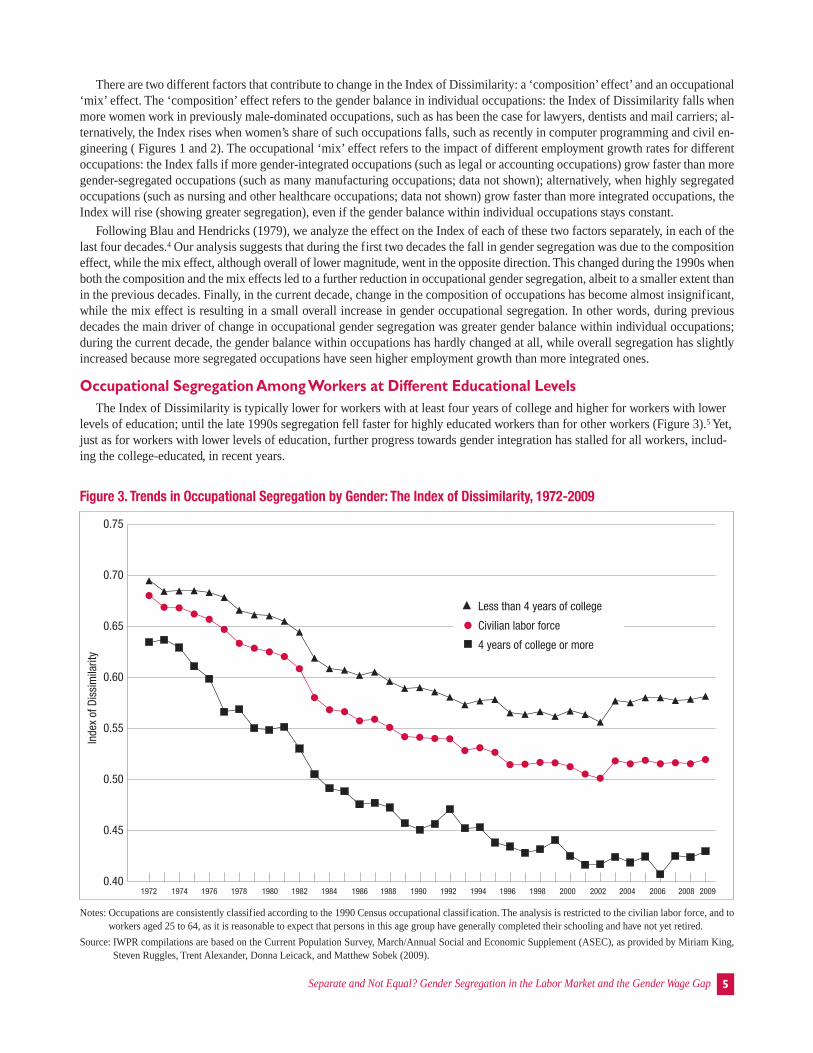
Occupational Segregation Among Different Age GroupsPerhaps even more disconcerting is the stalled progress towards integration for
younger women. It seems reasonable to expect that occupational segregation diminishesfor each generation of young men and women entering the labor market. To examine thechange for different age groups, we look separately at trends for four different agegroups: ages 25 to 34, ages 35 to 44, ages 45 to 54, and ages 55 to 64 (Figure 4). In theearly 1970s, there was little difference in the level of occupational segregation betweendifferent age groups. Over the next 25 years, even though all age groups experiencedfalling levels of occupational segregation, the change was strongest for the youngest agegroup, as both younger men and women were more likely to work in more integrated oc-
cupations than older workers. This changewas accompanied by changes in educational achievement, with younger women movinginto occupations requiring higher levels of education. Yet, this trend of increasing inte-gration stalled in the late 1990s and indeed, since 2002, has reversed for the youngest agegroup. In 2009, levels of gender segregations in the youngest age group have convergedwith those for workers aged 35 to 44, and differences between these and the older twogroups are once again small.
6Separate and Not Equal? Gender Segregation in the Labor Market and the Gender Wage Gap
Between 1972 and 1996,there was significant
reduction in occupationalgender segregation, but therehas been no further progress
towards gender balance in occupations since 1996.
0.40
0.45
0.50
0.55
0.60
0.65
0.70
0.75
1972 1974 1976 1978 1980 1982 1984 1986 1988 1990 1992 1994 1996 1998 2000 2002 2004 2006 2008 2009
Ages 55 to 64
Ages 45 to 54
Ages 35 to 44
Ages 25 to 34
Inde
x of
dis
sim
ilarit
y
Figure 4. Occupational Gender Segregation and Age: Index of Dissimilarity, 1972 – 2009, by Age Groups (in a Given Year)
Notes: Occupations are consistently classified according to the 1990 Census occupational classification. The analysis is restricted to the civilian labor force and toworkers aged 25 to 64.
Source: IWPR compilation; same data source as Figure 3.
Younger women are notmuch more likely to work inintegrated occupations thanolder women.

7Separate and Not Equal? Gender Segregation in the Labor Market and the Gender Wage Gap
Occupational Segregation by Race and Ethnic BackgroundWe also examine trends in gender segregation for each major race and ethnic group. First, we look at change in occupational
gender segregation across time within each major race and ethnic group (Figure 5). Across time, the likelihood of men and womenof the same racial/ethnic group working in the same occupation has increased for all groups; that is, the Index of gender segrega-tion has fallen for each racial/ethnic group. There are marked differences between groups in the level of segregation. In 2009, oc-cupational gender segregation was highest among Hispanics (with an Index of Dissimilarity value of 0.55). Occupational gendersegregation was lowest among Asian Americans and Pacific Islanders (with an Index value of 0.45), likely a reflection of the com-paratively high levels of occupational attainment for both men and women in this group. Segregation continues to be higher amongwhites and among African Americans (with Index values of 0.53 and 0.51, respectively) than it is among Asian Americans and Pa-cific Islanders.
0.40
0.45
0.50
0.55
0.60
0.65
0.70
0.75
1972 1974 1976 1978 1980 1982 1984 1986 1988 1990 1992 1994 1996 1998 2000 2002 2004 2006 2008 2009
Hispanic men vs Hispanic women
White men vs white women
Black men vs black women
Asian men vs Asian women
Inde
x of
dis
sim
ilarit
y
Figure 5. Occupational Gender Segregation among Race and Ethnic Groups: Index of Dissimilarity, 1972 – 2009, Comparisons Between Men and Women Within Race/Ethnicity Groups
Notes: Occupations are consistently classified according to the 1990 Census occupational classification. The analysis is restricted to the civilian labor force, and toworkers aged 25 to 64. Whites, blacks and Asian groups are non-Hispanic. “Asians” include “Asian only” as well as “Hawaiian/Pacific Islander” (data avail-able only from 1988 onward).
Source: IWPR compilation; same data source as Figures 3
Occupational segregation is also present among women (and men) of different race and ethnic groups; that is, for example, whitewomen and Hispanic women have different occupational profiles (Table 1). In 2009, the Index of Dissimilarity was 0.28 for whiteversus black women, 0.31 for white versus Asian women, and 0.31 for white versus Hispanic women. Among men, the Index of Dis-similarity for different race and ethnic groups is slightly higher than for women (Table 1). Yet for both women and men, segrega-tion by race or ethnic background is considerably less pronounced than gender segregation.

8Separate and Not Equal? Gender Segregation in the Labor Market and the Gender Wage Gap
Table 1: Race and Ethnic Occupational Segregation among Men and Women: Index of Dissimilarity, 2009White vs Black White vs Asian White vs Hispanic
Women 0.28 0.31 0.31Men 0.33 0.33 0.37
Notes: Occupations are consistently classified according to the 1990 Census occupational classification. The analysis is restricted to the civilian labor force and to workers aged 25 to 64. Whites, blacks and Asian groups are non-Hispanic. “Asians” include“Asian only” and “Hawaiian/Pacific Islander.”
Source: IWPR compilation; same data source as Figures 3.
The Link between Occupational Segregation and the Gender Wage GapPrevious research suggests that a significant share of the gender wage gap is accounted for by differences in the occupations where
men and women work (Blau and Kahn 2006, 2007).6 To examine the link between occupational segregation and differences in me-dian earnings, we analyze the relationship between the percentage of female workers and earnings in occupations separately for threebroad groupings: ‘low-skilled’, ‘medium-skilled’ and ‘high-skilled’ occupations. These groupings are based on the BLS’ 11-groupclassification of occupations according to educational and training requirements (U.S. Department of Labor, Bureau of Labor Sta-tistics 2010). ‘Low-skilled’ occupations are occupations which, according to the BLS, require short-term, on-the-job training of nomore than one month; ‘medium-skilled’ occupations are defined as those requiring more than one month of on-the-job training, butless than a Bachelor’s degree, and include occupations that require postsecondary vocational awards or associate degrees; and ‘high-skilled’ occupations are those requiring at least a Bachelor’s degree. Because the BLS classification is designed to provide adviceon career entry, not to provide a description of prevailing skill or educational levels, we add an addi-tional criterion for allocating an occupation to a specific skill level: an occupation is reclassified fromlow-skilled to medium-skilled if more than 50 percent of the workforce has at least some college. Oc-cupations that are reclassified in this manner for example include teacher assistants, file clerks, andpostal service mail carriers. Other occupations, such as childcare workers, remain in the low-skill groupbecause fewer than 50 percent of childcare workers have a qualification beyond a high school diploma.7
In the medium-skilled category, an occupation is reclassified as high-skilled where more than 50 per-cent of the workforce of an occupation has at least a Bachelor’s degree; registered nurses are an exampleof an occupation reclassified from medium- to high-skilled (see Appendix for methodological details).
Next for each of these broad skill groupings, we classified occupations separately by their genderbalance, differentiating between male-dominated occupations (where at least 75 percent of workersare male), female-dominated occupations (where at least 75 percent of workers are female) and a re-maining mixed group with a more balanced gender distribution, resulting in nine subgroups altogether(see Table 2 for the three largest occupations in each of these subgroups). All data discussed in this sec-tion refer to full-time workers aged 16 and older.
Before examining differences in median earnings, we first look at the distribution of the workforceamong these broad groupings. Low-skill occupations employ more than 16 million full-time workers,17.6 percent of all male workers and 14.7 percent of all female workers (Table 3). Compared with the other skill groups, a partic-ularly high proportion of low-skilled workers (38.9 percent of all workers in this group) works in male-dominated occupations(such as ‘driver/sales workers and truck drivers’ and ‘laborers and freight, stock and material moving, hand’). Female-dominated,low-skilled occupations, including for example ‘nursing, psychiatric, and home health aides’ and ‘maids and housekeeping clean-ers,’ employ half as many workers as low-skilled, male-dominated occupations, and account for 19.7 percent of all workers in thelow-skilled group. The remaining group of low-skilled occupations, those with a more balanced gender mix (including, for exam-ple, ‘janitors and building cleaners’ and ‘cashiers’) accounts for 41.4 percent of all workers in the low-skilled group, and for closeto half of low-skilled female workers (49.5 percent; Table 3).
Occupational segregation by race or ethnic background is
considerably less pronounced than
occupational segregation
by gender.

9Separate and Not Equal? Gender Segregation in the Labor Market and the Gender Wage Gap
Note: Data refer to full-time workers aged 16 and older.
Source: IWPR compilation based on U.S. Department of Labor, Bureau of Labor Statistics. 2009. “Household Data Annual Averages. Table 39.”
Table 2: The Three Largest Occupations for Each Broad Skill Level and Type of Gender Composition, 2009
Table 3: Distribution of Full-Time Workers Across Occupations, According to Skill Level and Gender Composition, 2009Male-dominated Mixed occupations Female-dominated
occupations (25.1 to 74.9 occupations(25 percent or less percent female) more female)
female) (in’000) (in ‘000) (in ‘000) Sum
Low-skilled All workers 6,341 (38.9%) 6,740 (41.4%) 3,202 (19.7%) 16,283 (100%)Percent of all workers 6.4% 6.8% 3.2% 16.3%Men 5,821 (60.1%) 3,481 (35.9%) 391 (4.0%) 9,693 (100%)Percent of all men 10.6% 6.3% 0.7% 17.6%Women 518 (7.9%) 3,256 (49.5%) 2,810 (42.7%) 6,584 (100%)Percent of all women 1.2% 7.3% 6.3% 14.7%
Medium-skilled All workers 17,940 (33.7%) 23,730 (44.6%) 11,547 (21.7%) 53,217 (100%)Percent of all workers 18.0% 23.8% 11.6% 53.4%Men 16,411 (54.1%) 12,655 (41.8%) 1,244 (4.1%) 30,310 (100%)Percent of all men 29.9% 23.0% 2.3% 55.1%Women 1,526 (6.7%) 11,079 (48.4%) 10,303 (45.0%) 22,908 (100%)Percent of all women 3.4% 24.8% 23.0% 51.2%
High-skilled All workers 6,186 (20.5%) 17,899 (59.3%) 6,098 (20.2%) 30,183 (100%)Percent of all workers 6.2% 18.0% 6.1% 30.3%Men 5,153 (34.4%) 8,876 (59.3%) 933 (6.2%) 14,962 (100%)Percent of all men 9.4% 16.1% 1.7% 27.2%Women 1,030 (6.8%) 9,025 (59.3%) 5,163 (33.9%) 15,218 (100%)Percent of all women 2.3% 20.2% 11.5% 34.0%
Notes: Data refer to full-time workers aged 16 and older. Data are made available by the BLS only where there are an estimated minimum of 50,000 workers inan occupation, and are rounded to the closest integer. ‘Motion picture projectionists,’ ‘nuclear technicians,’ ‘fishers and related fishing workers,’ ‘automo-tive body and related repairers,’ and ‘model makers and patternmakers, wood’ could not be included because the data do not allow to identify the percent-age of female workers in these occupations. Together these occupations account for 143,000 workers, and all of them are classified as requiring mediumskills. All other 498 occupations are included. Skill levels are defined and assigned to occupations according to U.S. Department of Labor, Bureau ofLabor Statistics, 2008, “Table 1.11. Education and training measurements by detailed occupation, 2008” as adjusted by IWPR (see the Appendix formethodological details).
Source: IWPR compilation based on U.S. Department of Labor, Bureau of Labor Statistics, 2009, “Household Data Annual Averages. Table 39.”
Male-dominated occupations (25 percent or less female)
Mixed occupations (25.1 to 74.9 percent female)
Female-dominated occupations (75 percent or more female)
Low-skilled Driver/sales workers and truckdrivers
Janitors and building cleaners Nursing, psychiatric, and home health aides
Grounds maintenance workers Stock clerks and other fillers Personal and home care aides
Medium-skilled Construction laborers First-line supervisors/managers of retail
Secretaries and administrative assistants
Security guards and gaming surveillance officers
Managers, all other Bookkeeping, accounting, andauditing clerks
High-skilled Chief executives Accountants and auditors Elementary and middle schoolteachers
Computer software engineers Secondary school teachers Registered nurses
Construction managers Financial managers Social workers

10Separate and Not Equal? Gender Segregation in the Labor Market and the Gender Wage Gap
Medium-skilled occupations account for more than 53 million full-time workers, 55.1 percent of all men and 51.2 percent of allwomen (Table 3). As it is the case at the low-skill level, more workers in this group work in occupations that are dominated by onegender than in the more balanced mixed occupations, but, unlike in the low-skilled group, the difference between the shares ofwomen and of men in the mixed group is not large. Male-dominated occupations (including,for example, occupations such as ‘electricians’ and ‘carpenters,’ ‘construction laborers,’ and‘security guards and gaming surveillance officers;’ see Table 2) employ a third of all work-ers in medium-skilled occupations (33.7 percent). Female-dominated, medium-skilled oc-cupations (for example, ‘secretaries and administrative assistants’ and ‘bookkeeping,accounting and auditing clerks’) employ slightly more than a fifth of all workers in this group(21.7 percent). The mixed occupations that are not dominated by either men or women, ac-count for the remaining 44.6 percent of workers employed at the medium-skill level. Theseoccupations include ‘first-line supervisors/managers of retail sales workers’ and ‘managers, all other’ (Table 2).
Finally, more than 30 million full-time workers are employed in high-skilled occupations. At 34.0 percent, a higher share of allwomen than men (27.2 percent) works in high-skilled occupations (Table 3). This skill level has the largest share of workers inmixed occupations, and the smallest share of workers in male-dominated occupations. Male-dominated occupations (such as ‘chiefexecutives’ for example, and ‘computer software engineers’) account for only a fifth of high skilled workers (20.5 percent). Mixedoccupations (such as ‘accountants and auditors’ and ‘secondary school teachers’) account for almost six of ten workers (59.3 per-cent). One in five high-skilled workers (20.2 percent) work in female-dominated occupations such as ‘elementary and middle schoolteachers’ and ‘registered nurses’ (Table 3).
Median Earnings are Highest in Male-Dominated Occupations at Each Broad Skill LevelNext we calculate the median weekly earnings at each skill level separately for male-dominated, mixed and female-dominated
occupations (Table 4). At each skill level, median earnings are highest in male-dominated occupations and lowest in female-dom-inated occupations.
For each broad skill level, median earnings
are highest in male-dominated occupations.
Table 4: Median Weekly Earnings in Occupations by Skill Level and Gender Composition, 2009
Male-dominated Female-dominated Earnings in female-occupations Mixed occupations occupations (75 dominated occupations
(25 percent or (25.1 to 74.9 percent or as percent of earnings inless female) percent female) more female) male-dominated occupations
Low- skilled occupations $553 $435 $408 73.8%Medium- skilled occupations $752 $735 $600 79.8%High- skilled occupations $1,424 $1,160 $953 66.9%
Notes: Data refer to full-time workers aged 16 and older. Earnings data represent weighted averages of median weekly earnings in occupations; data are madeavailable by the BLS only for occupations with an estimated minimum of 50,000 workers.
Source: IWPR compilation, data sources are the same as in Table 2.
This negative relationship between the percentage of female workers and the level of earnings at each skill level is also con-firmed when we perform a more precise statistical analysis (for full results of the analysis and a methodological explanation seethe Appendix). Figure 6 presents the results of the statistical analysis and illustrates for occupations that at each of the three skilllevels, a higher percentage of female workers in an occupation is associated with lower earnings. This negative relationship isclearly most pronounced among high-skilled occupations. Among low- and medium-skilled occupations, this relationship is lesspronounced, but nonetheless negative.
The statistical relationship between earnings and gender composition identified by our model suggests that a high-skilled oc-cupation that is 0 percent female would pay $1,555 per week while one that is 100 percent female would pay only $840 per week,or 46 percent less.

11Separate and Not Equal? Gender Segregation in the Labor Market and the Gender Wage Gap
0
200
400
600
800
1000
1200
1400
1600
$1800
Wee
kly
earn
ings
in U
S $
Share of female workers
0% 10% 20% 30% 40% 50% 60% 70% 80% 90% 100%
High-skilled occupations
Medium-skilled occupations
Low-skilled occupations
Figure 6: The Relationship between the Share of Female Workers and Earnings for Occupations at Different Skill Levels, 2009
Notes: Data refer to full-time workers aged 16 and older. Data are made available by the BLS only where there are an estimated minimum of 50,000 workers in anoccupation. Occupations have been weighted by total occupation size, i.e., bigger occupations count more than smaller ones. See Appendix Table 1 for de-tails of the regression analysis.
Source: Illustration of IWPR regression analysis based on the same data sources as Tables 2 and 3.
The fact that differences in earnings between male- and female-dominated occupationsare most marked for workers in the highest skilled occupations is not least due to the grow-ing general inequality in the U.S. labor market during the past several decades. In real terms,average male earnings are now approximately at the same level as they were thirty years ago(IWPR 2010b: Table 2). This general stagnation in real earnings reflects an increasing po-larization in the labor market, with some highly skilled employees having seen substantialincreases, and others, particularly in lower skilled typically male jobs, having seen actualreductions in their real wages. This is at least partly a result of the decline in the power ofunions (Levy and Temin 2007). Yet, even though on average women’s real earnings grewover this same period, because women started from a much lower base, in absolute terms theirearnings remain below those of men, including in the lowest paid jobs.
Because of the negative relationship between the share of women and earnings, eventhough low-skilled occupations typically pay low wages in general, wage levels are partic-ularly low for workers in the occupations predominantly done by women. Across occupa-tions, the median earnings of all full-time workers in female-dominated, low-skilledoccupations are only $408 per week, 73.8 percent of the median weekly earnings paid inmale-dominated, low-skilled occupations ($553). Take childcare workers, for example. In2009, the median earnings of childcare workers were $367 per week (female full-time childcare workers earn $364 per week andfor male childcare workers no separate earnings data are available because there are so few of them).8 For a single parent with twochildren who is lucky enough to have full-time work every week of the year, this would be just enough to push earnings above theofficial poverty line for a family of three ($18,310).9
Because of the negativerelationship between the
share of women and earnings in an
occupation, wage levels are particularly
low for workers in low-skilled occupations
predominantly done by women.

12Separate and Not Equal? Gender Segregation in the Labor Market and the Gender Wage Gap
Some male-dominated occupations are also very low paid. Indeed, the occupation withthe lowest median earnings for full-time work is ‘dish washers,’ at only $334 (male dish-washers have median weekly earnings of $339, but there are too few female dish wash-ers to calculate median female earnings). But, the earnings spectrum for male-dominated,low-skilled occupations is broader than for female-dominated occupations, reaching $685as the median weekly earnings of full-time ‘driver/sales workers and truck drivers.’ The‘highest’ paid female-dominated, low-skilled occupation, with median earnings of $438,is ‘nursing, psychiatric and home health aides.’
The same general negative relationship between the share of women in an occupationand median earnings of all full-time workers is found for those occupations classified asmedium-skilled. As discussed previously, this group includes the majority of workers andencompasses occupations requiring high school completion, some college or a vocationalcertificate, or an associate degree. This group also includes many (predominantly male)occupations that do not necessarily require formal qualifications but do require long-term, on-the-job training. At the medium-skill level, male-dominated occupations havemedian weekly earnings of $752, compared with $600 paid by female-dominated, medium-skilled occupations (Table 4). Themedian earnings in female-dominated, medium-skilled occupations are 79.8 percent of the median earnings in male-dominatedoccupations, a considerable earnings gap but smaller than for the other two skill levels (66.9 and 73.8 percent for high- and low-skilled occupations, respectively; Table 4).
The medium-skilled group includes a broad spectrum of workers, including substantial numbers of supervisory and other low-level managers. Among female-dominated, medium-skilled occupations, ‘dental hygienists’ have the highest median weeklyearnings of $956. Among male-dominated, medium-skilled occupations, the highest median weekly earnings are those of ‘first-line supervisors/managers of fire fighting and prevention workers’ at $1,345. Earnings in many of the male-dominated occupa-tions in this medium-skill grouping, however, are not so high: ‘carpenters’ have median weekly earnings for all workers at $662($665 for male full-time workers; for women no separate data are available) and ‘electricians’ have median weekly earnings forall workers at $856 ($858 for male full-time workers; for women no separate data are available). Both electricians and carpen-ters typically require long-term, on-the-job training through apprenticeships and post-apprenticeship training. A second exam-
ple of a female-dominated occupation with relatively high median weekly earnings is‘paralegals and legal assistants’ ($846 for all workers). Female-dominated occupations withdecent earnings almost invariably require at least some college education, whereas equiv-alent male occupations are much less likely to have similar requirements. The hostile en-vironment in many of the male-dominated trades severely limits access to decent earningsfor those women who are less inclined or able to pursue college education (BergmannForthcoming).
Finally, for high-skilled occupations, i.e., those requiring at least a four-year college de-gree, earnings overall are significantly higher compared with earnings at the two lowerskill levels. At the same time, the gap between median weekly earnings paid in male-dom-inated occupations and median weekly earnings paid in female-dominated occupations islargest at the high-skill level. Across all female-dominated occupations, median weeklyearnings of all full-time workers are $953, only 66.9 percent of the median weekly earn-ings of all full-time workers employed in male-dominated occupations ($1,424; Table 4).
At the high-skilled level, the median weekly earnings spectrum of all full-time workers in the female-dominated occupationsranges from $759 earned by ‘dietitians and nutritionists,’ to $1,153, earned by full-time ‘speech language pathologists.’ Work-ers in the highest-earning, male-dominated occupation, ‘chief executives,’ have median weekly earnings of $1,916. Median earn-ings are also clearly higher in high-skilled, mixed occupations than in high-skilled, female-dominated occupations (with someimportant exceptions such as nursing, for example). Illustrating this with just one example, ‘pharmacists’ have the highest me-dian weekly earnings, at $1,841, of all the high-skilled, mixed occupations; these are significantly higher than median weeklyearnings of speech language pathologists, the highest paid occupation among the female-dominated, high-skilled occupations.
The gap in median weeklyearnings between male-
dominated and female-dominated
occupations is largest atthe high-skill level.
Occupational gender segregation for youngwomen, aged 25 to 34, is now stronger than it was at the beginning of this millennium.

13Separate and Not Equal? Gender Segregation in the Labor Market and the Gender Wage Gap
Summary and Policy ImplicationsThis Briefing Paper provides evidence on two related features of the American labor
market: gender segregation in occupations and the gender wage gap. Our analysis of oc-cupational data shows that, after a steady trend towards a more even distribution of menand women across occupations during the 1970s and 1980s, there has been no furtherprogress since the late 1990s, amounting to more than a decade of stalled progress. Thisis true both for occupations requiring at least a four-year college degree and for occupa-tions requiring lower levels of educational attainment (even though the former tend tohave a more even gender mix than the latter). Indeed, occupational gender segregation foryoung women, aged 25 – 34 years, is now stronger than it was at the beginning of this mil-lennium. Our analysis shows that race and ethnic background are significant factors in ex-plaining occupational patterns when considering women and men separately. That is,women of different race and ethnic backgrounds have different occupational patterns (asdo men). Yet the data clearly confirm that gender is the predominant factor in occupationalsegregation in all major race and ethnic groups.
Occupational segregation matters because there is considerable research suggestingthat occupational choice is often constrained, by socialization, lack of information, ormore direct barriers to entry to training or work in occupations where one sex is a smallminority of the workforce. This leads not only to sub-optimal outcomes for individualworkers, but also reduces overall productivity and economic growth as employers haveto select workers from a smaller and less motivated pool of workers.
Occupational segregation also matters because our analysis shows that there is a systematic link between the share of womenworking in an occupation and median weekly earnings: the higher the share of women, the lower the median earnings at each ofthree broad skill levels. This gender wage gap between occupations comes on top of the gender wage gap within occupations(IWPR 2010a), providing women who work in female-dominated occupations a double disadvantage: lower earnings becausethey are working in an occupation that is mostly done by women, and lower earnings because within each occupation womenare likely to earn less than men. In absolute dollar terms the highest educated workers lose out most if they work in an occupa-tion predominantly done by women, rather than in a more mixed or male-dominated college-degree level occupation. Yet, the im-plications are perhaps starkest for workers in the least skilled jobs. Here, working in a female- rather than a male-dominatedoccupation may make the difference between wages close to poverty and wages that can support a family at a decent level. Forthe many families who rely on a single female bread winner, the potential consequences are particularly harsh.
Our analysis further confirms the different role of educational attainment and vocational qualifications for male- and female-dominated jobs. While, even in the medium-skill category, there are several male-dominated occupations where the majority ofworkers have no more than a high school diploma, this is rare in female-dominated occupations. In female-dominated occupa-tions and those with a more even gender balance, educational achievement is key for advancement along the earnings scale; inmale-dominated jobs, on-the-job training continues to play a much greater role. The labor market for workers without formal qual-ifications has become much more hostile in recent decades for both men and women. Yet, while the male-dominated trades con-tinue to offer some path to decent earnings for men without formal post-secondary education, the lack of access to such jobs forsimilarly educated women bars them from those opportunities.
A number of policy approaches are required to address occupational gender segrega-tion and the wage gap. Girls and women need better advice when they embark on a careerto allow them to make informed choices, not least in relation to the relative earning poten-tial of different occupations. More targeted training and employment programs are neededto reduce the barriers for women interested in entering non-traditional trades. Both train-ing providers and employers need to be held accountable for the efforts they make in re-cruiting and retaining women, particularly where they are in receipt of federal funds.Low-income mothers in particular need to be encouraged to pursue training and education,and given supports that will allow them to succeed. Last but not least, there needs to bebetter enforcement of both equal pay and equal employment opportunity laws to ensurethat women are not short changed in pay for the work that they do and that they are not dis-criminated against in hiring (and promotion) when they appear with all the same skills andabilities as their male counterparts.
In the least-skilled jobs,working in a female-
rather than male-dominated occupation
may make the differencebetween wages close to poverty and wages
that can support a family.
Last but not least, there needs to be better enforcement of both equal pay and equal opportunity laws.
14Separate and Not Equal? Gender Segregation in the Labor Market and the Gender Wage Gap
APPENDIX
Methodological Note on the Classification of Skill LevelsTo identify for each occupation whether it should be classified as requiring low, medium, or high skills, we use the category sys-
tem of the BLS that assigns the “most significant source of education or training” to detailed occupations (U.S. Department ofLabor, Bureau of Labor Statistics. 2008, 2010). The Bureau of Labor Statistics considers eleven different categories that we com-bined into three broader ones. ‘Short-term on-the-job training’ we defined as ‘low-skilled’ requirements. ‘Moderate-term on-the-job training,’ ‘long-term on-the-job training,’ ‘work experience in a related occupation,’ ‘postsecondary vocational awards,’ and‘associate degrees’ we defined as ‘medium-skilled’ requirements. Finally, ‘Bachelor’s degree,’ ‘Bachelor’s or higher degrees pluswork experience,’ ‘Master’s degrees,’ ‘Doctoral degrees,’ and ‘first professional degrees’ we defined as ‘high-skilled’ requirements.
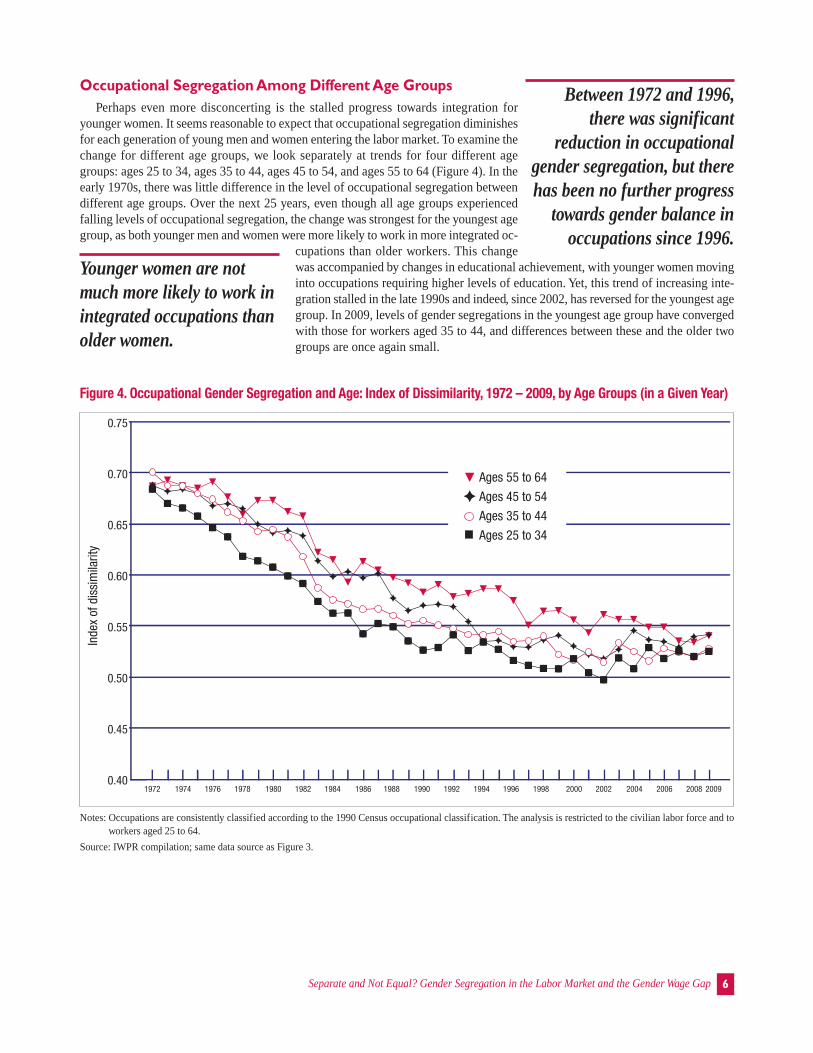
We adjust the skill requirements data in three systematic ways. First, if 50 percent or more of the workers of an occupation havesome college, that occupation is moved from the ‘low-skilled’ to the ‘medium-skilled’ category. We do not, however, reclassify anyoccupation from ‘medium-’ to ‘low- skilled’ for lack of education if the BLS identifies that occupation as requiring more than short-term on-the-job training. Second, if more than 50 percent in an occupation hold a Bachelor’s degree or a degree higher than that,we move that occupation up from ‘medium-skilled’ to ‘high-skilled.’ In 2009, of workers in the civilian labor force aged 25 yearsand older, 9.1 percent had not completed high school (10.9 percent of men, 7.2 percent of women); 28.8 percent had only a highschool diploma (30.2 percent of men, 27.1 percent of women); 27.7 percent had some college, including associate degrees (25.7percent of men, 30.1 percent of women); and 34.4 percent had a Bachelor’s degree or higher (33.3 percent of men and 35.6 percentof women; U.S. Department of Labor, Bureau of Labor Statistics 2010c). Third and last, the BLS earnings data we use refer to 503occupations in total. This is a slightly less detailed classification system than the education and training category system of theBLS. When several categories must be combined to match one occupation in the earnings data, we use the skill requirement thatthe majority of the smaller categories has.
Methodological Note and Results for the Statistical Analysis of the Relationship between Skill Levels, Earnings, and the Gender Composition Occupations
We use regression analysis to assess how the percentage of female workers in occupations is correlated with the level of earn-ings at different skill levels. ‘Low-skilled’ is the omitted skill level. ‘Medium-skilled’ and ‘High-skilled’ are dummy variables formedium- and high-skilled levels, respectively, and ‘Medium-skilled * Percent female’ and ‘High-skilled * Percent female’ are in-teraction terms with the percentage of female workers at the medium- and the high-skilled levels, respectively. The explained vari-able is the logarithm of median weekly earnings of full-time workers of both sexes. Occupations have been weighted by the numberof workers (both sexes) employed in them (Table 4).
Appendix Table 1: The Relationship between the Share of Female Workers and Earnings for Occupations Grouped bySkill Level (Regression Analysis)
Coefficient Standard ErrorPercent female -0.4390*** 0.005256Medium-skilled 0.3337*** 0.003164Medium-skilled * Percent female 0.1564*** 0.006063High-skilled 1.0271*** 0.003925High-skilled * Percent female -0.1768*** 0.007278Constant 6.3221*** 0.002711p-value/F-test <.0001R-squared/adj. R-squared 0.7101/0.7101*** Significant at the 1% level.
Notes: Data refer to full-time workers aged 16 and older. Data are made available only where there are an estimated minimum of 50,000 workers in an occupa-tion. The total numbers of workers in each occupation are used as frequency weights. The model is specified as: In(median weekly earnings, all work-ers)=Constant + b1 *Percent female=b2*Medium-skilled+ b3 Medium-skilled* Percent female+b4*High-skilled*Percent female +ε
Source: IWPR analysis, same data source as Tables 2 and 3 and Figure 6.

15Separate and Not Equal? Gender Segregation in the Labor Market and the Gender Wage Gap
ReferencesBabcock, Linda and Sara Lachever. 2003. Women Don’t Ask: Negotiation and the Gender Divide. Princeton and Oxford: Princeton Univer-
sity Press.
Bergmann, Barbara. Forthcoming. “Comment on Paula England, “The Gender Revolution: Uneven and Stalled” Gender and Society.
Blau, Francine D. and Wallace E. Hendricks. 1979. “Occupational Segregation by Sex: Trends and Prospects.” The Journal of Human Resources 14(2): 197-210
Blau, Francine D. and Lawrence M. Kahn. 2006. “The U.S. Gender Wage Gap in the 1990s: Slowing Convergence.” Industrial and Labor RelationsReview 60 (1): 45-66.
Blau, Francine D. and Lawrence M. Kahn. 2007. “The Gender Pay Gap.” The Economists’Voice 4 (4): Article 5.
Duncan, Otis D. and Beverly Duncan. 1955. “A Methodological Analysis of Segregation Indexes.” American Sociological Review 20 (2): 210-217.
England, Paula. 2005. “Gender Inequality in Labor Markets: The Role of Motherhood and Segregation.” Social Politics 12 (2): 264-288.
England, Paula, Paul Allison, and Yuxiao Wu. 2006. “Does bad pay cause occupations to feminize, Does feminization reduce pay, and How can wetell with longitudinal data?” Social Science Research 36 (2007): 1237-1256.
Goldin, Claudia and Cecilia Rouse. 2000. “Orchestrating Impartiality: The Impact of ‘Blind’ Auditions on Female Musicians.” American EconomicReview 90: 715-41.
Hill, Catherine, Christianne Corbett, and Andresse St. Rose. 2010. Why so few? Women in Science, Technology, Engineering, and Mathematics.Wash-ington, DC: AAUW Research Report.
Hulett, Denise M., Marc Bendick Jr, Sheila Y. Thomas, Francine Moccio. 2008. “Enhancing Women’s Inclusion in Firefighting in the USA.” Inter-national Journal of Diversity in organizations, Communities and Nations 8 (2): 189-207.
Institute for Women’s Policy Research. 2010a. The Gender Wage Gap by Occupation. Washington, DC: IWPR Fact Sheet. < http://www.iwpr.org/pdf/C350a.pdf>
Institute for Women’s Policy Research. 2010b. The Gender Wage Gap: 2009.Washington, DC: IWPR Fact Sheet. < http://www.iwpr.org/pdf/C350.pdf>
King, Miriam, Steven Ruggles, Trent Alexander, Donna Leicack, and Matthew Sobek. 2009. Integrated Public Use Microdata Series, Current Pop-ulation Survey: Version 2.0. Minneapolis, MN: Minnesota Population Center; <http://cps.ipums.org> (retrieved March 22, 2010).
Levy, Frank and Peter Temin. 2007. “Inequality and Institutions in 20th Century America.” NBER Working Papers 13106, National Bureau of Eco-nomic Research, Inc.
Neumark, David. 1996. “Sex Discrimination in Restaurant Hiring: An Audit Study.” Quarterly Journal of Economics 111: 915-41.
U.S. Department of Health and Human Services. 2010. The 2009 HHS Poverty Guidelines. <http://aspe.hhs.gov/poverty/09poverty.shtml> (retrievedJuly 25, 2010).
U.S. Department of Labor, Bureau of Labor Statistics. 2008. Table 1.11. Education and training measurements by detailed occupation, 2008.<http://www.bls.gov/emp/ep_table_111.htm> (retrieved June 11, 2010).
U.S. Department of Labor, Bureau of Labor Statistics. Occupational Variable Data Definitions. 2010. <http://www.bls.gov/emp/ep_nem_defini-tions.htm#education> (retrieved June 11, 2010).
U.S. Department of Labor U.S. Bureau of Labor Statistics. 2010b. “Highlights of Women’s Earnings in 2009”. Report 1025. June. < http://www.bls.gov/cps/cpswom2009.pdf> (retrieved February 2, 2010)
U.S. Department of Labor U.S. Bureau of Labor Statistics. 2010c. Household Data Annual Averages 7: Employment Status of the CivilianNoninstitutional Population 25 Years and Over by Educational Attainment, Sex, Race, and Hispanic or Latino Ethnicity.<http://www.bls.gov/cps/cpsaat7.pdf> (retrieved June 11, 2010).

Notes1 The 1998 Carl D. Perkins Vocational and Technical Education Act defines an occupation as non-traditional for one sex if at least
75 percent of the workers in the occupation are of the other sex. “All workers” include full-time as well as part-time workers. Fig-ures are based on IWPR compilation of data from the U.S. Department of Labor, Bureau of Labor Statistics. 2009. “HouseholdData Annual Averages. Table 11.” <http://www.bls.gov/cps/cpsaat11.pdf.> (retrieved March 2010); see also IWPR 2010a.
2 IWPR compilation of data from the U.S. Department of Labor, Bureau of Labor Statistics. 2009. “Household Data Annual Aver-ages. Table 39.” <http://www.bls.gov/cps/cpsaat39.pdf> (retrieved March 2010).
3 The Index of Dissimilarity formula is , where: , . stands for the number of female workers in occupations i, stands for the numberof female workers in the labor force, for the number of male workers in occupation i, for the number of male workers in the laborforce, and is the total number of occupations.
4 Following Blau and Hendricks (1979), we conduct a decomposition analysis of change in the Index of Dissimilarity (for workersaged 25 to 64). The first column (‘Total’) shows the change in the value of the Index during each time period. The value of theIndex in 1972 was 0.6821; in 1980 was 0.6186; in 1990was 0.5292; in 2000 was 0.5070; and in 2009 was 0.5131.See Blau and Hendricks (1979) for an analysis of change inearlier decades; they found that during the 1960s, as wefind for the 1990s, both the composition effect and the mixeffect reduced occupational gender segregation.
5 Data for occupational segregation for workers with less than four years of college is shown in an aggregated manner because dif-ferences between sub-groups are not very marked.
6 Other factors found to contribute to the gender wage gap were coverage by collective bargaining, industry, education, experienceand race composition of male versus female workers (Blau and Kahn 2006, 2007). Women still tend to work fewer hours due totheir child care responsibilities. At the same time women on average have high levels of education compared with men. These twoeffects counterbalance each other and explain why the joint impact of education and work experience on the gender wage gap isrelatively small. A relatively high percentage of the gap remains unexplained and results from either discrimination or unobserv-able differences in the characteristics of men and women. A few studies are based on experiments instead and show that genderdiscrimination does exist when it comes to determine wages. Two experimental studies have identified discrimination againstwomen in the hiring process. Neumark (1996) finds that female applicants are less likely to receive job interviews and offers inhigh-paying restaurants in Philadelphia. Goldin and Rouse (2000) find that in ‘blind’ auditions more women are hired for US sym-phony orchestras. Another study by Babcock and Lachever (2003) points out that part of the wage gap results from the fact thatwomen negotiate their earnings less than men. This could be taken as evidence for an immeasurable difference in the characteris-tics of men and women. But, Babcock and Lachever (2003) also find that when women do negotiate, they experience higher penal-ties and harsher treatment by employers than do men.
7 A full list of (re)classifications is available on request; please contact Ariane Hegewisch ([email protected]).8 All earnings data for specific occupations are based on U.S. Department of Labor, Bureau of Labor Statistics. 2009. “Household
Data Annual Averages. Table 39.” This is the same data source that is used in Tables 2, 3, 4, and 5 and for Figure 6.9 See U.S. Department of Health and Human Services (2010) for poverty guidelines for different sizes of families.
16Separate and Not Equal? Gender Segregation in the Labor Market and the Gender Wage Gap
Total Mix Composition Interaction1972-1980 -0.0563 0.0395 -0.1052 0.00941980-1990 -0.0857 0.0059 -0.0604 -0.03131990-2000 -0.0274 -0.0087 -0.0146 -0.00402000-2009 0.0045 0.0093 -0.0005 -0.0043
The Briefing Paper was prepared with support from the Annie E. Casey Foundation, the Ford Foundation, and the Rockefeller Foundation.
For more information on IWPR reports or membership, please call (202) 785-5100, email [email protected], or visit www.iwpr.org.
The Institute for Women’s Policy Research (IWPR) conducts rigorous research and disseminates its findings to address theneeds of women and their families, promote public dialogue, and strengthen communities and societies. The Institute workswith policymakers, scholars, and public interest groups to design, execute, and disseminate research that illuminates eco-nomic and social policy issues affecting women and their families, and to build a network of individuals and organizationsthat conduct and use women-oriented policy research. IWPR’s work is supported by foundation grants, government grantsand contracts, donations from individuals, and contributions from organizations and corporations. IWPR is a 501 (c) (3) tax-exempt organization that also works in affiliation with the women’s studies and public policy programs at The George Wash-ington University.