Embed Size (px)
Citation preview
Separate and Consolidated Annual Report 2013
52nd Financial Year
Shareholders’ Meeting 16 April 2014

DIRECTORS’ REPORT ON OPERATIONS
FINANCIAL AND OPERATING HIGHLIGHTS
GE Capital Interbanca S.p.A. 2013 2012
Balance Sheet and Income Statement – in millions of Euros
Due from banks and loans to customers 2,341 2,942
Equity investments (including other equity interests) 70 75
Equity investments 368 384
Funding 2,518 2,966
Net interest margin 44 49
Net fee and commission income 6 9
Net interest and other banking income 39 54
Net impairment losses (153) (189)
Operating costs (58) (75)
Net income (loss) for the period (128) (169)
Financial ratios - in %
Net interest margin / Net interest and other banking income 114.5 90.9
Net fee and commission income / Net interest and other banking income 14.6 17.0
Operating costs / Net interest and other banking income 150.1 138.9
In millions of Euros
Equity 545 669
Regulatory Tier 1 Capital 498 627
Total regulatory capital 648 814
Capital ratios - in %
Regulatory Tier 1 Capital / Risk-weighted assets (*) 15.4 16.1
Total regulatory capital / Risk-weighted assets (*) 20.0 21.0
Credit risk ratios %
Net impaired loans / Total net loans 23.3 17.6
Net impaired loans / Equity 100.0 77.4
Net non-performing loans / Total net loans 5.6
5.0
In absolute terms
Headcount at year end 256 286
(*) these figures do not include the 25% reduction in regulatory capital requirements for banks belonging to a banking group, as GE
Capital Interbanca S.p.A is also Parent Company of the GE Capital Interbanca Banking Group.

DIRECTORS’ REPORT ON OPERATIONS
1
OFFICERS AND GOVERNANCE BODIES
Board of Directors
Chairman Richard Alan Laxer
Chief Executive Officer Paolo Braghieri
Directors Enrico Maria Luigi Fagioli Marzocchi (1) (*)
Mario Garraffo (*)
Patricia Marie Halliday
Giuseppe Recchi
Todd Lamar Smith (2)
Board of Statutory Auditors
Chairman Paolo Andrea Colombo
Standing Auditors Alberto Dalla Libera
Marco Giorgino
Alternate Auditors Piera Vitali
Guido Sazbon
Senior Management
General Manager Paolo Braghieri
Executive charged with
preparing the company’s
financial reports
Ettore Colombo
(1) effective 17 December 2013
(2) effective 25 July 2013
(*) Independent director

DIRECTORS’ REPORT ON OPERATIONS
2
(empty page)

DIRECTORS’ REPORT ON OPERATIONS
3
2013 SEPARATE
ANNUAL REPORT
GE CAPITAL INTERBANCA S.p.A.
52nd Financial Year

DIRECTORS’ REPORT ON OPERATIONS
4
ANNUAL REPORT 2013
� Directors’ Report on Operations 7
� Separate Financial Statements 57
� Notes to the Separate Financial Statements 67
� Report of the Board of Statutory Auditors 213
� Certification of the Financial Statements pursuant to Article 154-bis of Legislative Decree No. 58 of 24 February 1998
219
� Report of the Accounting Audit Firm 221
CONSOLIDATED FINANCIAL STATEMENTS 2013
� Directors’ Report on Consolidated Operations 229
� Consolidated Financial Statements 265
� Notes to the Consolidated Financial Statements 275
� Certification of the Consolidated Financial Statements pursuant to Article
154-bis of Legislative Decree No. 58 of 24 February 1998
425
� Report of the Accounting Audit Firm 427
OFFICES
429
DIRECTORS’ REPORT ON OPERATIONS
5
DIRECTORS’ REPORT ON OPERATIONS 7
SUMMARY OF THE BANK’S ACTIVITIES 11
2013 FINANCIAL RESULTS 28
ADDITIONAL INFORMATION 36
PROPOSED ALLOCATION OF LOSSES 53
OUTLOOK FOR 2014 54
SEPARATE FINANCIAL STATEMENTS 57
NOTES TO THE SEPARATE FINANCIAL STATEMENTS
67
� Part A – Accounting policies 69
� Part B – Information on the Balance Sheet 91
� Part C – Information on the Income Statement 127
� Part D – Statement of Comprehensive Income 147
� Part E – Information on risks and risk management policies 149
� Part F – Information on capital 191
� Part G – Business combinations 199
� Part H – Related-party transactions 201
� Part I – Share-based payments 205
� Part L – Segment reporting 207
ADDITIONAL INFORMATION 209
� Disclosure pursuant to Article 2427-16 bis of the Italian Civil Code 210
� Disclosure pursuant to Article 2497 bis of the Italian Civil Code 211
REPORT OF THE BOARD OF STATUTORY AUDITORS 213
CERTIFICATION OF THE FINANCIAL STATEMENTS PURSUANT TO ARTICLE 154
BIS OF LEGISLATIVE DECREE NO. 58 OF 24 FEBRUARY 1998
219
REPORT OF THE ACCOUNTING AUDIT FIRM 221

DIRECTORS’ REPORT ON OPERATIONS
6
(empty page)

DIRECTORS’ REPORT ON OPERATIONS
7
DIRECTORS’
REPORT
ON OPERATIONS

DIRECTORS’ REPORT ON OPERATIONS
8
(empty page)

DIRECTORS’ REPORT ON OPERATIONS
9
OVERVIEW OF BUSINESS ACTIVITIES
Dear Shareholders,
In 2013, the Italian economy continued to deteriorate and the difficult context was reflected heavily
in businesses’ demand for financing, particularly from SMEs. An important factor in the state of the
crisis for Italian businesses was confirmed by bankruptcy data, which is continually increasing,
posting a 12.1% annual increase over 2013.
The difficult economic and financial situation for businesses had the inevitable result of a decline in
credit quality, with the latest data showing non-performing bank loans and the risk of loans in Italy
growing 24.7% in 2013 (Source: ABI).
Italian GDP was down for the entire year, with an interruption only in the third quarter of 2013,
supported by exports and changes in inventories, although still showing low levels of internal
consumption and investment.
Finally, despite initial signs of stabilisation, the unemployment rate continued to grow, reaching
12.3% in the third quarter of 2013.
As regards the Euro zone, there was a slight and fragile recovery, although the general financial
conditions in the area became more favourable. Industrial production for the Euro zone showed
positive results, starting to recover lost ground in September 2013 and posting an increase in the
trend of 2.8% in November.
This economic context has clearly affected the Bank’s results, operating plans and growth forecasts,
with the latter being reconsidered with a forecast for returns in the medium/long term.
As planned, during 2013 the Bank maintained its prudent risk management, with the shared
objective of rebalancing the portfolio mix through integrated customer service and the expansion of
cross selling among the various businesses.
Profitable organic growth was prioritised, not only for the core product lines - leasing and factoring -
of traditional medium and long-term lending activities and, due to the Bank’s equity solidity
(consolidated Total Capital ratio of 17%), commercial activities continued to grow, posting higher
volumes.
Total disbursements in 2013 were € 336 million, a 7.7% increase from the € 312 million disbursed in
2012.
Along with intensive monitoring and managing of the loan portfolio, considerable progress was
made in containing structural operating costs, by reviewing supply and service contracts.
DIRECTORS’ REPORT ON OPERATIONS
10
In light of continued deterioration in loans to customers, the uncertainty in the overall economic
scenario in which the Bank operates affected the valuation of the non-performing portfolio, which
was reflected in the income statement for € 133 million.
The various factors highlighted above resulted in a net loss for 2013 for the Bank amounting to €
128.3 million.

DIRECTORS’ REPORT ON OPERATIONS
11
SUMMARY OF THE BANK’S ACTIVITIES
LOANS
Total loans to customers and due from banks declined 20% compared to the end of 2012.
In thousands of Euros 31.12.2013 % 31.12.2012 %
Due from banks 226,274 9.7 324,649 11.0
Loans to customers 2,114,951 90.3 2,617,823 89.0
Total 2,341,225 100.0 2,942,472 100.0
LOANS TO CUSTOMERS
Loans to customers declined 19.2% as a result of lower disbursements with respect to loans reaching
maturity and further write-downs.
Total disbursements in 2013 were € 335 million, a 7.7% increase from the € 312 million disbursed in
2012, and counter to the trend for the banking system1 which posted a decline of 5.3% on an annual
basis for loans to non-financial companies.
In particular, new volumes in 2013 consisted of corporate lending activities for € 198 million and
structured finance activities for € 122 million.
The lower weight of the corporate lending component compared to the prior year is mainly due to
the trend in the reference market, which, in an increasingly competitive market, is characterised by
the propensity of potential customers of the Bank to carry out unsecured transactions at conditions
that are not compatible with the Bank’s profitability objectives.
As regards the type of lending activities, the portfolio as at 31 December 2013 is comprised as
follows:
� in the Corporate Finance Sector by:
• Acquisition Finance for € 476 million;
• Real Estate for € 346 million;
• Project Finance for € 295 million;
• Shipping for € 216 million;
� in the Corporate Banking sector by:
• Corporate Lending for € 665 million;
• Corporate Acquisition for € 58 million.
1 Source: Bank of Italy
DIRECTORS’ REPORT ON OPERATIONS
12
DUE FROM BANKS
Due from banks, equivalent to € 226 million, decreased 30.3% compared to 2012. This item primarily
consists of deposits, mostly those held as collateral for syndicated loans (IBLOR) for € 98 million, bank
demand deposits of € 100 million, and, to a lesser extent, collateral relationships associated with
derivative transactions. The decrease is primarily due to the effect of a temporary liquidity surplus
related to early repayments by customers, which was also seen in 2012.
ENDORSEMENTS AND GUARANTEES
Endorsements and guarantees are € 158 million, a decrease of 26.8%, and consist of sureties issued
for € 105 million (of which € 98 million for related IBLOR loan transactions where the collateral
deposit is included under Due from banks) and € 53 million for a pledge on shares in the Bank’s
equity portfolio.

DIRECTORS’ REPORT ON OPERATIONS
13
CREDIT REVIEW
Performing loans to customers
During 2013, performing loans were affected by new disbursements of € 335 million and maturing
loans of € 940 million.
The continued worsening in bank credit quality, principally attributable to the economic recession
and weakness in loan demand by businesses, resulted in a reclassification of 33 new defaults to the
category of impaired loans, generating a flow of volumes to the “doubtful” category for € 241 million.
These new positions are lower than the 52 defaults in the previous year and are entirely related to
the loan portfolio prior to the acquisition by GE Capital Corporation Inc.
The 2013 default rate is 4.1%, compared to 4.6% in 2012 and 2.9% in 2011. The LGD rate was 59.2%,
a decline from 60.1% in the previous year, and was influenced by the presence of unsecured
transactions.
Default rate and LGD are parameters used by the calculation model to determine collective
impairment write-downs on the portfolio of performing loans to customers. These parameters,
applied to the categories considered to be at greatest risk, based on statistical results over the last
three years for similar rating groups, resulted in a collective impairment write-down for the portfolio
of 2.81%, against 2.60% for 2012.
In order to calculate the collective impairment write-down, the same criterion adopted by the Parent
Company for performing cash loans is used; the coverage amounts to € 2.3 million, corresponding to
2.83%, compared with 2.65% recorded at the end of 2012.

DIRECTORS’ REPORT ON OPERATIONS
14
Impaired loans
The systematic assessment of “doubtful” loans, through the use of valuation techniques
differentiated based on the type and condition of the position under consideration, results in
collection estimates made on a “case-by-case” basis, with the corresponding proposals for charge-
offs or recoveries. Additionally, impaired loans for which the case-by-case assessment did not
determine any adjustment are written down on a collective basis.
The following table shows gross and net on-balance sheet loans due from banks and customers,
divided by risk class.
Impaired loans 1,192,930 648,101 544,829 23.3 54.3 1,085,015 517,213 5.3
Non-performing 524,035 392,584 131,451 5.6 74.9 526,781 147,994 -11.2
Sub-standard 517,468 204,059 313,409 13.4 39.4 431,014 261,828 19.7
Restructured 103,303 50,301 53,002 2.3 48.7 63,201 44,107 20.2
Past due 48,124 1,157 46,967 2.0 2.4 64,019 63,284 -25.8
Performing loans 1,852,040 55,644 1,796,396 76.7 3.0 2,484,498 2,425,259 -25.9
Total loans 3,044,970 703,745 2,341,225 100.0 23.1 3,569,513 2,942,472 -20.4
In thousands
of Euros
% Coverage
ratio (B/A)
Net exposure
31.12.2012
(D)
% Chg
(C/D)
Gross
exposure
31.12.2013
(A)
Total
impairment
losses
31.12.2013
(B)
Net exposure
31.12.2013
(C)
%
(C)
Gross
exposure
31.12.2012
In valuing the trend in impaired loans during 2013, it was necessary to consider that on 27
December, the Bank sold, without recourse, non-performing loans related to 72 positions for a total
gross value of € 36.4 million, which had been completely written off. This sale took place with the
verified bankruptcy of the customers, all in bankruptcy proceedings, as well as the inclusion of the
loans as unsecured receivables as liabilities in the respective bankruptcy proceedings, for which the
Bank verified the non-recoverability of the receivable based on the results of actions taken and the
status of various procedures.
In terms of overall exposure, the gross impaired loans increased by 9.9% on an annual basis (+13.3%
excluding the effects of the aforementioned sale). This increase is, for the most part, related to the
“Restructured” (+63.5%) and “Sub-standard” (+20.1%) categories, as opposed to the “Non-
performing” category that decreased 0.5% (+6.4% excluding the effects of the sale) and the “Past
due” category, which declined by 24.8%.
2013 figures for the increase in the “Non-performing” category are better than those for the Italian
banking system2 (+24.7%), and specifically in the corporate segment (+29.8%).
New defaults, entirely related to disbursements prior to the acquisition of the controlling interest by
GE Capital Corporation Inc., generated increases of € 242 million, partially offset by reductions,
mainly due to collections of € 65 million, cancellations and sales of € 92 million and transfers to the
performing category of € 17 million.
2 Source: ABI Economic Analysis Department

DIRECTORS’ REPORT ON OPERATIONS
15
Following the trend in gross amounts explained above and the related trends in impairments, net
exposures increased 5.3% over the 2012 year-end figure.
The change in the coverage percentage on total impaired loans, currently at 54.3% compared to
52.3% at the end of the prior year and at 46% in 2011, is related to the growth in exposures at
greater risk.
The Bank’s coverage level in recent years continues to be higher than the system's average. In fact,
for the non-performing category only, the risk data for the Italian banking system showed an
increasing trend, with a coverage percentage was 39.1% in 2009 that reached 48.4% in December
2013, while the Bank’s figures during the same period showed an increasing trend from 60.3% in
2009, reaching 74.9% at the end of 2013.
The following table shows a breakdown of endorsements by risk category.
Impaired exposures 24,312 15,763 8,549 0.4 64.8 53,408 9,069 -5.7
Performing exposures 80,310 2,273 78,037 3.3 2.8 108,864 105,979 -26.4
Total endorsements 104,622 18,036 86,586 3.7 17.2 162,272 115,048 -24.7
Endorsements
In thousands
of Euros
Net exposure
31.12.2012
(D)
% Chg
(C/D)
Gross
exposure
31.12.2013
(A)
Total
impairment
losses
31.12.2013
(B)
Net exposure
31.12.2013
(C)
%
(C)
% Coverage
ratio (B/A)
Gross
exposure
31.12.2012
Gross impaired positions amounted to € 24.3 million and have a coverage percentage of 64.8%.
The total reserve for endorsements amounts to € 18 million and is recognised in the item "Other
liabilities".

DIRECTORS’ REPORT ON OPERATIONS
16
Principal loan ratios
Impaired loans
In % 31.12.2013 31.12.2012
Gross impaired loans / Total gross loans 39.2 30.4
Net impaired loans / Total net loans 23.3 17.6
Net impaired loans / Equity 100.0 77.4
Non-performing
In % 31.12.2013 31.12.2012
Gross non-performing loans / Total gross loans 17.2 14.8
Net non-performing loans / Total net loans 5.6 5.0
Net non-performing loans / Equity 24.1 22.1
Sub-standard
In % 31.12.2013 31.12.2012
Gross sub-standard loans / Total gross loans 17.0 12.1
Net sub-standard loans / Total net loans 13.4 8.9
Net sub-standard loans / Equity 57.5 39.2
Restructured
In % 31.12.2013 31.12.2012
Gross restructured loans / Total gross loans 3.4 1.8
Net restructured loans / Total net loans 2.3 1.5
Net restructured loans / Equity 9.7 6.6
Loans past due by 90 days or more
In % 31.12.2013 31.12.2012
Past due by 90 days or more gross / Total gross loans 1.6 1.8
Past due by 90 days or more net / Total net loans 2.0 2.1
Past due by 90 days or more net / Equity 8.6 9.5

DIRECTORS’ REPORT ON OPERATIONS
17
EQUITY INVESTMENTS
This item includes the following equity interests:
� GE Capital Servizi Finanziari S.p.A.: 100% of share capital;
� GE Capital Finance S.r.l.: 60% of share capital; the remaining 40% indirectly through GE
Capital Servizi Finanziari S.p.A.;
� GE Capital Services S.r.l.: 79% of share capital; the remaining 21% indirectly through GE
Capital Servizi Finanziari S.p.A.;
In addition, the Bank has:
� 100% indirect control of GE SPV S.r.l., a securitisation company, established in accordance
with art. 3 of Italian Law no. 130 of 30 April 1999, through its subsidiary GE Capital Servizi
Finanziari S.p.A.;
� an interest in Renting Italease S.r.l., which represents a joint venture with Italease Gestione
Beni S.p.A., through its subsidiary GE Capital Services S.r.l.
Furthermore, as part of the larger corporate simplification project of the GE Capital Interbanca
Banking Group:
� the direct subsidiaries GE Leasing S.p.A. and Bios Interbanca S.r.l. were merged into GE
Capital Servizi Finanziari S.p.A, effective 1 May 2013;
� the indirect subsidiary GE Commercial Distribution Finance S.r.l. was merged into GE Capital
Finance S.r.l. effective 1 May 2013;
� the indirect subsidiary GE Noleggi S.p.A. was merged into GE Capital Services S.r.l. effective 8
November 2013;
The equity investments in GE Capital Servizi Finanziari S.p.A. and GE Capital Finance S.r.l were
acquired following the authorisation issued by Bank of Italy on 31 December 2010 through a transfer
in kind by the controlling shareholder GE Capital Corporation.
This transfer in kind was recorded directly to a specific net equity reserve with the Bank using the
relevant equity values, totalling € 275 million, representing the fair value at the transfer date.
This figure, attributed to the equity investments at recognition and equivalent to the net equity of the
subsidiaries, was subsequently adjusted for a total of € 38.3 million, corresponding to the losses
incurred by said subsidiaries in recent years, and deemed representative of their impairment.
The equity investment in GE Capital Services S.r.l., a non-financial company that is not included in the
GE Capital Interbanca Banking Group and operates in the market of long-term rentals of vehicles and
operating assets, was acquired on 31 December 2012, again through the transfer in kind by the
controlling shareholder GE Capital Corporation.
This transfer, equivalent to 79% of the share capital of the transferred company, or € 55.8 million,
was made at the fair value calculated based on an appraisal by independent experts, which the Bank
recognised in a specific net equity reserve.

DIRECTORS’ REPORT ON OPERATIONS
18
� Direct subsidiaries belonging to the GE Capital Interbanca Banking Group
GE Capital Servizi Finanziari S.p.A.
The Company, enrolled in the Special Register pursuant to art. 107 of the Consolidated Banking Act,
belongs to the GE Capital Interbanca Banking Group and is subject to the management and
coordination of GE Capital Interbanca S.p.A. The Company is specialised in vehicle leasing and
equipment leasing and operates via a selected network of single-mandate financial asset agents
throughout Italy.
In addition, the Company has:
• 100% of the shares of GE SPV S.r.l.;
• 40% of the shares of GE Capital Finance S.r.l.;
• 21% of the shares of GE Capital Services S.r.l.;
The Shareholders’ Meetings of the companies concerned, held on 5 February 2013, approved the
planned merger by incorporation of GE Leasing Italia S.p.A. and Bios Interbanca S.r.l. into GE Capital
Servizi Finanziari S.p.A. The effective date of the merger is 1 May 2013, with retroactive application
for accounting and tax purposes from 1 January 2013.
Hence, the comments below regarding the balance sheet and income statement results as at 31
December 2013 include the results of the merged companies, while the comparative data as at 31
December 2012 reflects the pre-merger situation.
The key financial data show loans to customers increasing by € 990 million, or 3.7%, compared to the
end of 2012, primarily due to the transfer of the equipment lease portfolio following the merger (€
81.5 million). In the remaining portfolios, there was growth of 1.3% in the core business segment of
auto leasing, and declines in the run-off portfolios related to salary-backed loans (-29.2%), mortgages
to private customers (-8.4%) and auto instalment loans and personal loans (-66.2%).
Disbursement volumes in the core business of auto leasing for the year, equivalent to € 255 million,
were down 18.8% compared to 2012, due to the prolonged crisis in the automotive sector, although
the Company remains the market leader with a share of 14%. For the equipment lease portfolio
resulting from the merger, disbursement volumes amounted to € 42 million compared to € 31 million
in the prior year.
With regard to portfolio quality, the ratio of net non-performing loans to total net loans shows a
decline from the previous year, from 9% to 7.9%, mainly due to the effect of the transfer of the
equipment lease portfolio. The transfer also explains the level of cover on the portfolio, which is
currently 64.3% compared to 58.1% as at 31 December 2012.
Funding from financial institutions primarily consists of variable-rate lines for € 663 million, a fixed-
rate line for € 124 million and funds obtained by securitising the leasing portfolio for € 36 million.
The 2013 income statement shows the net interest margin down € 0.5 million (-1.9%), due to
contrasting factors: on one hand, higher cost of funding on lines renewed at the end of 2012 and, on

DIRECTORS’ REPORT ON OPERATIONS
19
the other, the positive contribution of the transfer of the equipment lease portfolio following the
merger.
Net impairment losses on loans were € 27.6 million, an increase of 27% from the figure at the end of
the previous year.
This increase is chiefly due to the portfolios in run-off, in particular, the mortgage portfolio, to which it
was necessary to apply a Discounted Cash Flow model, as well as the equipment lease portfolio for €
2.1 million.
Operating costs increased by € 3.2 million (+19.6%), principally as a result of increased personnel
expenses, for € 2.3 million, together with the increase in “Other administrative expenses” related to
the aforementioned merger transaction.
Net of the impairment on the value of the equity investment in GE Capital Finance S.r.l. for € 1.4
million, the pre-tax result was a loss of € 20.9 million, an increase from the pre-tax loss of € 11.8
million in the previous year.
The income tax component was positive for € 6.1 million following tax provisions for the option of
converting deferred tax assets for loan write-downs into tax credits, as well as participation in the tax
consolidation with specific agreements among the companies belonging to the Bank’s statutory
scope of consolidation.
Net of income taxes, the result for the year was a loss of € 14.8 million, a deterioration from the € 6.3
million loss suffered in 2012.
GE Capital Finance S.r.l.
The Company, enrolled in the Register pursuant to art. 107 of the Consolidated Banking Act, belongs
to the GE Capital Interbanca Banking Group and is subject to the management and coordination of
GE Capital Interbanca S.p.A. It operates in the factoring sector, offering financing services and
managing business loans. Over the years, the business has gradually begun to focus on the
components of service, creating internal competencies in offering a vast array of products designed
for the Italian market and, specifically, for medium to large businesses that are seeking to optimise
their credit risk profile, administrative management and working capital.
The Shareholders’ Meetings of the companies concerned, held on 26 October 2012, approved the
planned merger by incorporation of GE Commercial Distribution Finance S.r.l. into GE Capital Finance
S.r.l. The effective date of the merger is 1 May 2013, with retroactive application for accounting and
tax purposes from 1 January 2013.
Hence, the comments below regarding the balance sheet and income statement results as at 31
December 2013 include the results of the merged company, while the comparative data as at 31
December 2012 reflects the pre-merger situation.
With regard to operating management, in 2013, the Company’s total turnover increased 111% from
the previous year, from € 557 million in 2012 to € 1,177 million disbursed during the year.
Net loans to customers were € 231 million compared to € 87 million at the end of 2012, an increase
of 165%, thereby allowing the Company to obtain higher market share.

DIRECTORS’ REPORT ON OPERATIONS
20
In terms of portfolio quality, the ratio of net non-performing loans to total net loans showed further
improvement over the previous year, from 2.0% to 0.6%, due to the increase in loan volumes in 2013.
In reference to the key income statement items, note the significant improvement in net banking and
other income, to € 4.6 million, an increase of 51% over 31 December 2012, mainly due to higher
turnover.
Administrative expenses (including personnel expenses) were down 8.7% from 2012, chiefly as a
result of the reduction in cost for services received from GE Capital Group companies.
The valuation components related to loans and other risks and charges generated an impairment of
€ 0.4 million in 2013, compared to the write-back of € 1.8 million in 2012. This change is due to the
collective impairment on the performing portfolio following the increase in volume.
The pre-tax result was a loss of € 3.8 million, an improvement over the pre-tax loss of € 4.4 million in
the previous year.
The income tax component was positive for € 0.4 million following tax provisions for the option of
converting deferred tax assets for loan write-downs into tax credits, as well as participation in the tax
consolidation with specific agreements among the companies belonging to the Bank’s statutory
scope of consolidation.
Net of income taxes, the loss for the year amounts to € 3.4 million, an improvement over the loss of
€ 4.4 million in the previous year.
� Subsidiaries not belonging to the GE Capital Interbanca Banking Group
GE Capital Services S.r.l.
Effective 31 December 2012, the Company is fully owned by the Bank, with 79% direct ownership
and the remaining 21% through GE Capital Servizi Finanziari S.p.A., and is subject to management
and coordination of the Bank.
GE Capital Services S.r.l., classified as a “non-financial company”, operates primarily in the market of
long-term rentals of vehicles and operating assets.
The Shareholders’ Meetings of the companies concerned, held on 11 October 2013, approved the
planned merger by incorporation of GE Noleggi S.p.A. into GE Capital Services S.r.l. The effective date
of the merger is 8 November 2013, with retroactive application for accounting and tax purposes from
1 January 2013.
Hence, the comments below regarding the balance sheet and income statement results as at 31
December 2013 include the results of the merged company, while the comparative data as at 31
December 2012 reflects the pre-merger situation.
The Company has an interest in Renting Italease S.r.l., which represents a joint venture with Italease
Gestione Beni S.p.A.

DIRECTORS’ REPORT ON OPERATIONS
21
The key financial data show loans to customers increasing by € 332 million, or 14.7%, compared to
the end of 2012, primarily due to the transfer of the portfolio following the merger with GE Noleggi
S.p.A.
As regards operating management during 2013, the total volume disbursed by the Company
amounts to € 231 million, a 7.2% decrease from the previous year.
Under operating costs, charges were incurred of € 3.3 million for the collective personnel reduction
procedure, as per Law no. 223/91, for which the agreement was signed on 18 June 2013.
The pre-tax profit is equivalent to € 2.9 million. The income tax component was positive for € 6.4
million, characterised by the effects of participation in the tax consolidation with specific agreements
among the companies belonging to the scope of consolidation, as the taxes on the current IRES
profit, equivalent to € 7.2 million, were completely absorbed by the tax losses of the companies
belonging to the tax consolidation and, as a result, were not recognised in the separate financial
statements, as they were paid to the Parent Company in accordance with the tax consolidation
system in effect.
Net of income taxes, the profit for the year amounts to € 9.3 million, an improvement over the profit
of € 3.2 million in the previous year.
� Indirect subsidiaries belonging to the GE Capital Interbanca Banking Group
GE SPV S.r.l.
The Company, a fully-owned subsidiary of GE Capital Servizi Finanziari S.p.A, was established in March
2008 pursuant to art. 3 of Law no. 130 of 30 April 1999, to carry out a securitisation of performing
loans originated by said Parent Company, for 70% of the auto leasing portfolio volume, or € 400
million, with the objective of diversifying funding sources necessary to finance the growth of business
activities.
The run-off phase of the securitisation transaction began in June 2012, which envisages the
repayment of the Senior Notes consistent with the amortisation of the underlying portfolio, which will
presumably conclude during 2014. The Company closed its financial statements as at 31 December
2013 at breakeven.

DIRECTORS’ REPORT ON OPERATIONS
22
CORPORATE FINANCE
Equity investments
The subsidiaries confirm the strength of their fundamentals, supported in these dynamics by critical
factors such as geographic diversification of their customer portfolios outside the EU, manageable
levels of indebtedness, historical presence in their respective business sectors and careful control of
costs.
As at 31 December 2013, the equity investments portfolio consisted of 7 active positions, for a total
exposure of € 60.3 million. During the year, the equity investment in Roal Electronics S.p.A. was sold
and the Almeco S.p.A bond was fully repaid.
Other equity interests
At the end of 2013, the “Other equity interests” portfolio amounted to approximately € 9.5 million,
and consisted of 8 positions mainly resulting from restructuring transactions for customers in
temporary financial difficulty, which resulted in part of the debt being converted to capital or similar
equity instruments.

DIRECTORS’ REPORT ON OPERATIONS
23
FUNDING
MAIN FUNDING ITEMS
Total funding (including subordinated loans) decreased by 15.1%, consistent with the decline in loan
volumes over the course of 2013.
In thousands of Euros 31.12.2013 % 31.12.2012 %
Due to banks 11,107 0.5 16,054 0.5
Due to customers 2,287,141 90.8 2,623,863 88.5
Securities in issue 219,705 8.7 325,999 11.0
Total 2,517,953 100.0 2,965,916 100.0
Due to banks
In thousands of Euros 31.12.2013 % 31.12.2012 %
Deposits and loans 11,092 99.9 11,891 74.1
Funding from international organisations 15 0.1 1,663 10.3
Balances in deposits and demand deposits - 0.0 2,500 15.6
Total 11,107 100.0 16,054 100.0
Due to banks is essentially made up of short-term funding on the MID. The Bank did not take
advantage of the sources of financing made available by the ECB.
Due to customers
In thousands of Euros 31.12.2013 % 31.12.2012 %
Group loans 2,175,459 95.1 2,420,230 92.2
Deposits and demand deposits - Corporate 110,791 4.9 67,897 2.6
Deposits and demand deposits - Banking Group 681 0.0 135,345 5.2
Other funding 209 0.0 391 0.0
Total 2,287,140 100.0 2,623,863 100.0
Beginning in 2009, financing lines consisted of intercompany funding granted by General Electric
Group companies.
The Bank’s lines are currently guaranteed by the following companies: GE Capital Eireann Funding I
(with headquarters in Ireland), GE Financial Markets Funding I (with headquarters in the United
Kingdom), GE Capital Finance III GmbH & Co KG (with headquarters in Germany) and GE Hungary Kft
(with headquarters in Hungary).
The item “Intercompany deposits and demand deposits” consists of deposits with the Bank’s
subsidiaries. The reduction over the course of 2013 is attributable to higher liquidity needs of
subsidiaries to cover disbursements during the year.
Liquidity generated from corporate customers – a service to support businesses in managing excess
liquidity and optimising yields through time deposits – increased during 2013 with respect to the
previous year, caused by dynamics in liquidity management on the part of said customers.
DIRECTORS’ REPORT ON OPERATIONS
24
Subordinated loan
In 2006, the Bank received from ABN Amro Bank NV (which subsequently changed ownership, first to
Santander and currently to GE Hungary Kft) a ten-year subordinated loan of € 200 million, maturing
10 October 2016, which qualifies as lower Tier Two capital, carrying a 3-month Euribor interest rate
plus a spread of 0.28%. The loan agreement does not have any change-of-control clauses.
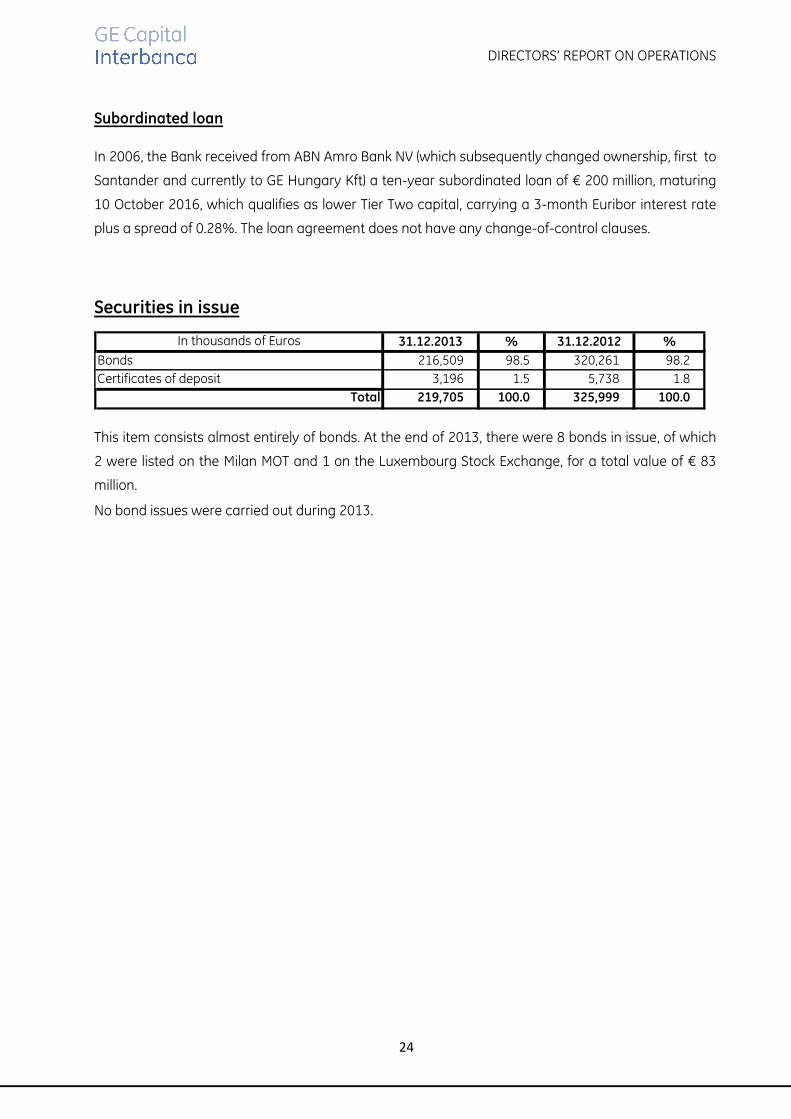
Securities in issue
In thousands of Euros 31.12.2013 % 31.12.2012 %
Bonds 216,509 98.5 320,261 98.2
Certificates of deposit 3,196 1.5 5,738 1.8
Total 219,705 100.0 325,999 100.0
This item consists almost entirely of bonds. At the end of 2013, there were 8 bonds in issue, of which
2 were listed on the Milan MOT and 1 on the Luxembourg Stock Exchange, for a total value of € 83
million.
No bond issues were carried out during 2013.
DIRECTORS’ REPORT ON OPERATIONS
25
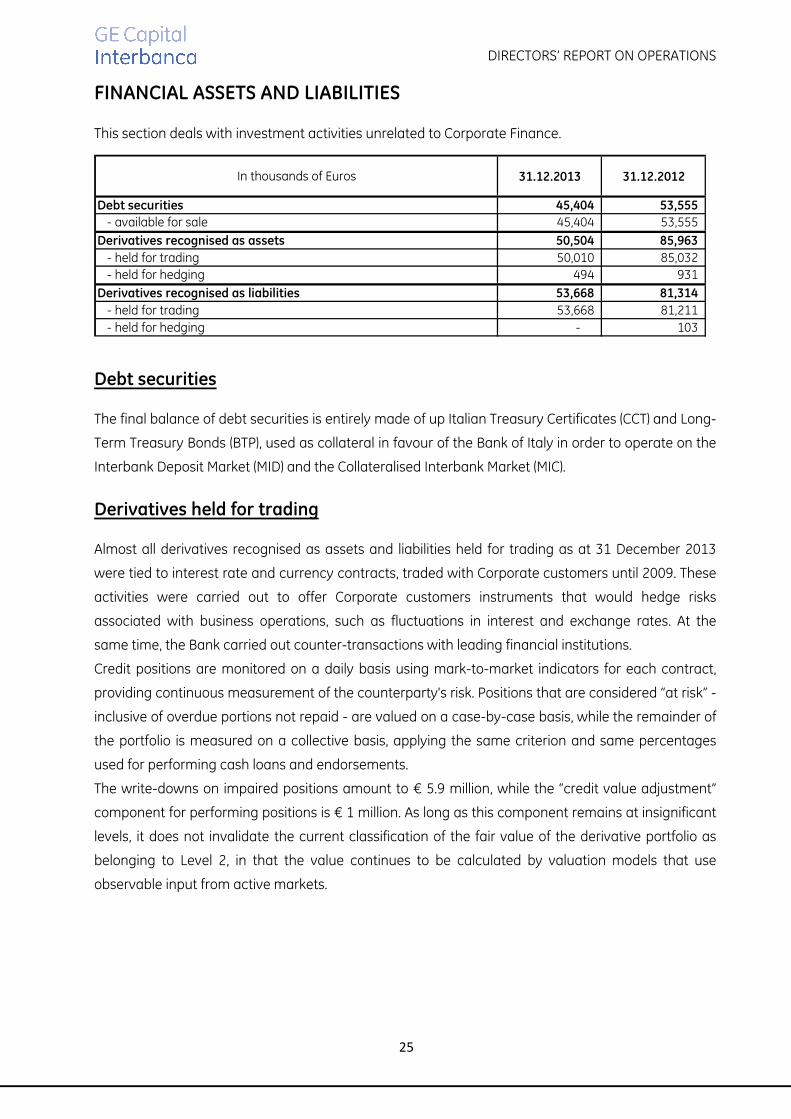
FINANCIAL ASSETS AND LIABILITIES
This section deals with investment activities unrelated to Corporate Finance.
In thousands of Euros 31.12.2013 31.12.2012
Debt securities 45,404 53,555
- available for sale 45,404 53,555
Derivatives recognised as assets 50,504 85,963
- held for trading 50,010 85,032
- held for hedging 494 931
Derivatives recognised as liabilities 53,668 81,314
- held for trading 53,668 81,211
- held for hedging - 103
Debt securities
The final balance of debt securities is entirely made of up Italian Treasury Certificates (CCT) and Long-
Term Treasury Bonds (BTP), used as collateral in favour of the Bank of Italy in order to operate on the
Interbank Deposit Market (MID) and the Collateralised Interbank Market (MIC).
Derivatives held for trading
Almost all derivatives recognised as assets and liabilities held for trading as at 31 December 2013
were tied to interest rate and currency contracts, traded with Corporate customers until 2009. These
activities were carried out to offer Corporate customers instruments that would hedge risks
associated with business operations, such as fluctuations in interest and exchange rates. At the
same time, the Bank carried out counter-transactions with leading financial institutions.
Credit positions are monitored on a daily basis using mark-to-market indicators for each contract,
providing continuous measurement of the counterparty's risk. Positions that are considered “at risk” -
inclusive of overdue portions not repaid - are valued on a case-by-case basis, while the remainder of
the portfolio is measured on a collective basis, applying the same criterion and same percentages
used for performing cash loans and endorsements.
The write-downs on impaired positions amount to € 5.9 million, while the “credit value adjustment”
component for performing positions is € 1 million. As long as this component remains at insignificant
levels, it does not invalidate the current classification of the fair value of the derivative portfolio as
belonging to Level 2, in that the value continues to be calculated by valuation models that use
observable input from active markets.
DIRECTORS’ REPORT ON OPERATIONS
26
Hedging derivatives
Operations in place involve solely rate risk hedges for 2 of our bond issues and consist of swaps
featuring characteristics (such as expiry and indexing) identical to those of the items hedged, trading
with leading Italian and international banks.
Hedging effectiveness is measured by “prospective” assessments, which involve stress testing
(+/- 1%) the yield curve, as well as “retrospective” assessments, both of which are conducted
quarterly.
DEFERRED TAX ASSETS
The balance of this item, equivalent to € 199.3 million, decreased by € 8.0 million compared to 31
December 2012. This decrease is principally due to the conversion of deferred tax assets, existing as
at 31 December 2012 associated with loan impairments deductible over 18 years for € 50.4 million,
into tax credits in accordance with Law no. 214/2011, net of the recognition of new deferred tax
assets for the year of € 42.8 million for losses and write-down on loans for the year and deductible
at a fixed rate over 5 years for both IRES and IRAP purposes.

DIRECTORS’ REPORT ON OPERATIONS
27
EQUITY
As at 31 December 2013, share capital and reserves – inclusive of the loss for the year – amounted to
€ 544.8 million, down € 123.8 million (-18.5%) with respect to the same figure recorded at the end of
2012.
The principal changes relate to:
• positively, valuation reserves, with a balance of € 4.5 million, in relation to the adjustment of
the fair value on available-for-sale financial instruments and actuarial changes for the
severance indemnity;
• negatively, the loss for the year of € 128.3 million.
Additionally, note that the Shareholders’ Meeting held on 18 April 2013 resolved the following
allocation of the 2012 loss of € 169,275,077.92:
• use of Extraordinary Reserve for € 113,501,077.92;
• use of the reserve that resulted from the transfer in kind of GE Capital Services S.r.l. by GE
Capital Corporation Inc. for € 55,774,000.00.
REGULATORY CAPITAL AND CAPITAL REQUIREMENTS
Tier 1 Capital amounts to € 498.3 million, down 20.5% compared to 31 December 2012, primarily
attributable to the loss for the year of € 128.3 million.
Tier 2 Capital is also lower due to the figurative amortisation of € 40 million from the inclusion of the
subordinated loan for € 200 million expiring in 2016, only partially offset by the positive change in the
valuation reserves for available-for-sale financial instruments of € 1.9 million.
Against these changes, total regulatory capital amounts to € 648.8 million, down 20.5% compared to
the end of 2012.
With regard to capital requirements, note that risk assets decreased, despite the drop in regulatory
capital in all of its components, which helps maintain the consolidated coefficients at higher levels
than those calculated and required by Bank of Italy, following its Supervisory Review and Evaluation
Process (SREP) carried out in 2013, for the Bank as Parent Company, both in terms of the Common
Equity Tier 1 ratio (13.2%) and the Total Capital ratio (17.0%).
DIRECTORS’ REPORT ON OPERATIONS
28
2013 FINANCIAL RESULTS
During 2013, global economic activity and international trade continued to grow at moderate levels.
In particular, in the Euro zone, a modest recovery began, which remains fragile as a result of weak
manufacturing activity and slow and uncertain growth in internal demand. The weakness in the
economy is reflected in the extremely moderate trend in consumer prices, resulting in interest rates
that are higher in real terms and a slower reduction of private and public debt.
The forecasts for recovery, a favourable monetary policy, progress in corporate governance within
the Euro zone and the stabilisation of Italy’s domestic situation have contributed to improving the
conditions in European and Italian financial markets.
In this macro-economic context, the Italian credit system in 2013 posted a drop in loan volumes of
more than 5.3%3, due, on one hand, to the downturn in production and investments, reflected in
lower demand from customers, and on the other, continued growth in non-performing loans,
increasing risks for the entire banking system and thereby limiting its traditional business activities.
Therefore, the GE Capital Interbanca S.p.A. 2013 Income Statement was affected both by the lower
contribution of the interest margin as the primary consequence of the drop in loan volumes, as well
as by the valuation component of the non-performing loan portfolio, generated prior to the
acquisition of the controlling interest by GE Capital Corporation Inc., whose results led to additional
provisions of € 138 million.
Excluding the write-downs to the equity investments in subsidiaries totalling € 16.9 million, as well as
the positive tax component, the net result was a loss of € 128.3 million, an improvement over the loss
of € 169.3 million in 2012.
3 Source: Bank of Italy - figure for non-financial companies
DIRECTORS’ REPORT ON OPERATIONS
29
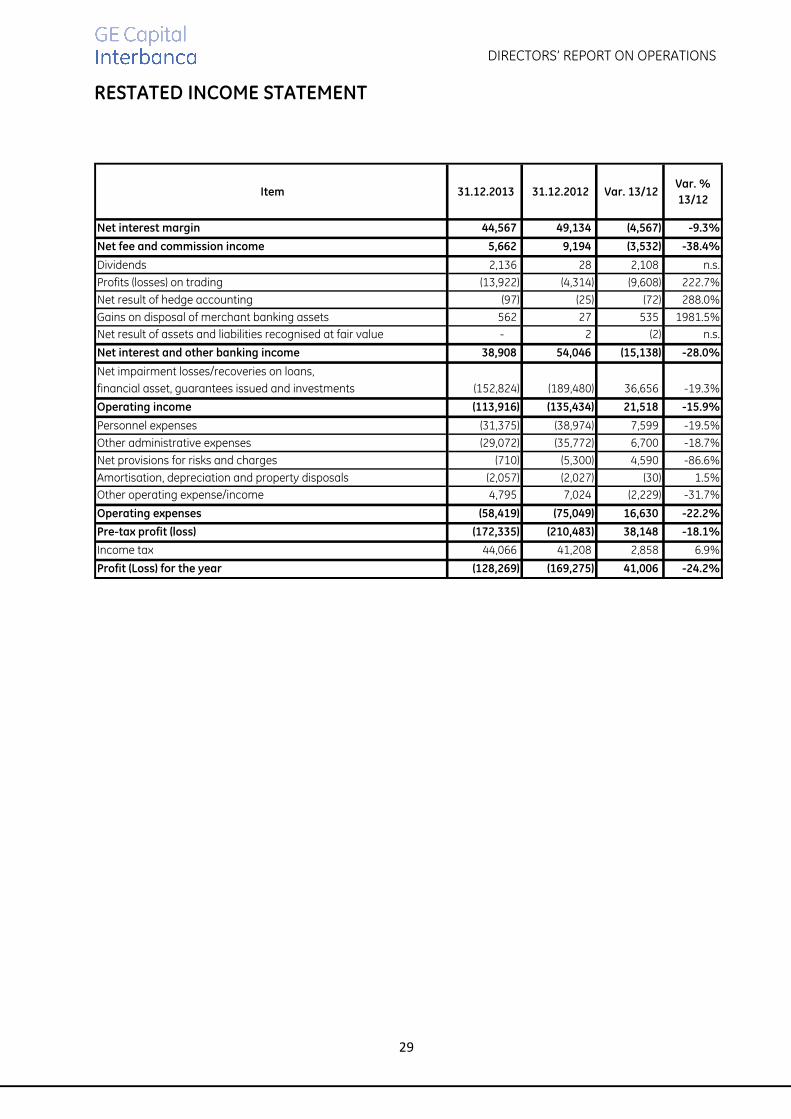
RESTATED INCOME STATEMENT
Item 31.12.2013 31.12.2012 Var. 13/12 Var. %
13/12
Net interest margin 44,567 49,134 (4,567) -9.3%
Net fee and commission income 5,662 9,194 (3,532) -38.4%
Dividends 2,136 28 2,108 n.s.
Profits (losses) on trading (13,922) (4,314) (9,608) 222.7%
Net result of hedge accounting (97) (25) (72) 288.0%
Gains on disposal of merchant banking assets 562 27 535 1981.5%
Net result of assets and liabilities recognised at fair value - 2 (2) n.s.
Net interest and other banking income 38,908 54,046 (15,138) -28.0%
Net impairment losses/recoveries on loans,
financial asset, guarantees issued and investments (152,824) (189,480) 36,656 -19.3%
Operating income (113,916) (135,434) 21,518 -15.9%
Personnel expenses (31,375) (38,974) 7,599 -19.5%
Other administrative expenses (29,072) (35,772) 6,700 -18.7%
Net provisions for risks and charges (710) (5,300) 4,590 -86.6%
Amortisation, depreciation and property disposals (2,057) (2,027) (30) 1.5%
Other operating expense/income 4,795 7,024 (2,229) -31.7%
Operating expenses (58,419) (75,049) 16,630 -22.2%
Pre-tax profit (loss) (172,335) (210,483) 38,148 -18.1%
Income tax 44,066 41,208 2,858 6.9%
Profit (Loss) for the year (128,269) (169,275) 41,006 -24.2%

DIRECTORS’ REPORT ON OPERATIONS
30
Net interest margin
The net contribution of the interest margin amounted to € 44.6 million, a 9.3% decrease from the
€ 49.1 million recorded in 2012.
The year-over-year change reflects the continued contraction of the portfolio for € 340 million in
average volumes, partially offset by the higher spread applied to new loans.
Net fee and commission income
The net result deriving from the provision of services amounts to € 5.7 million, compared to € 9.2
million in the prior year. This decrease is primarily due to non-recurring commissions recognised in
2012 for debt restructuring and settlements for € 1.5 million, as well as the lower contribution from
Corporate Finance activities and leader transactions.
The income component amounts to € 6.5 million and mainly refers to lending activities such as
leader transactions and agency fees (€ 1.8 million), debt revisions and settlements (€ 1.5 million),
guarantees issued (€ 1.6 million), and early repayments and settlements (€ 0.5 million).
The fees component of € 0.8 million is represented almost entirely by non-use commissions paid on
financing lines guaranteed by GE Capital Group.
Dividends
Dividends collected during the year of € 2.1 million are essentially attributable to the equity
investment in Dayco LCC.
Profits (losses) on trading
Trading consists of derivative transactions carried out for corporate customers until 2009, in order to
provide them with hedges for business operating risks, while the Bank carried out a counter-
transaction with leading financial institutions.
The period result revealed a negative balance of € 13.9 million, an increase from the figure as at 31
December 2012 and amounting to a loss of € 4.3 million; in particular, this figure was affected by the
analytic write-downs of certain impaired positions.
DIRECTORS’ REPORT ON OPERATIONS
31
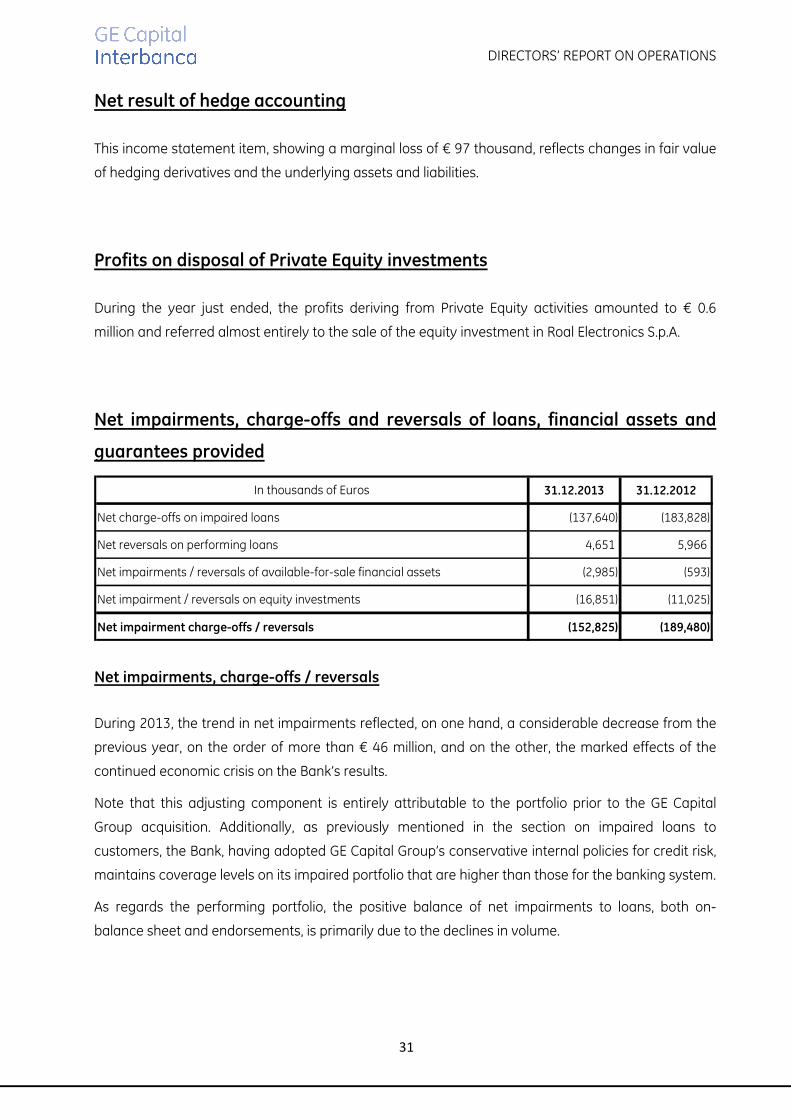
Net result of hedge accounting
This income statement item, showing a marginal loss of € 97 thousand, reflects changes in fair value
of hedging derivatives and the underlying assets and liabilities.
Profits on disposal of Private Equity investments
During the year just ended, the profits deriving from Private Equity activities amounted to € 0.6
million and referred almost entirely to the sale of the equity investment in Roal Electronics S.p.A.
Net impairments, charge-offs and reversals of loans, financial assets and
guarantees provided
In thousands of Euros 31.12.2013 31.12.2012
Net charge-offs on impaired loans (137,640) (183,828)
Net reversals on performing loans 4,651 5,966
Net impairments / reversals of available-for-sale financial assets (2,985) (593)
Net impairment / reversals on equity investments (16,851) (11,025)
Net impairment charge-offs / reversals (152,825) (189,480)
Net impairments, charge-offs / reversals
During 2013, the trend in net impairments reflected, on one hand, a considerable decrease from the
previous year, on the order of more than € 46 million, and on the other, the marked effects of the
continued economic crisis on the Bank’s results.
Note that this adjusting component is entirely attributable to the portfolio prior to the GE Capital
Group acquisition. Additionally, as previously mentioned in the section on impaired loans to
customers, the Bank, having adopted GE Capital Group’s conservative internal policies for credit risk,
maintains coverage levels on its impaired portfolio that are higher than those for the banking system.
As regards the performing portfolio, the positive balance of net impairments to loans, both on-
balance sheet and endorsements, is primarily due to the declines in volume.
DIRECTORS’ REPORT ON OPERATIONS
32
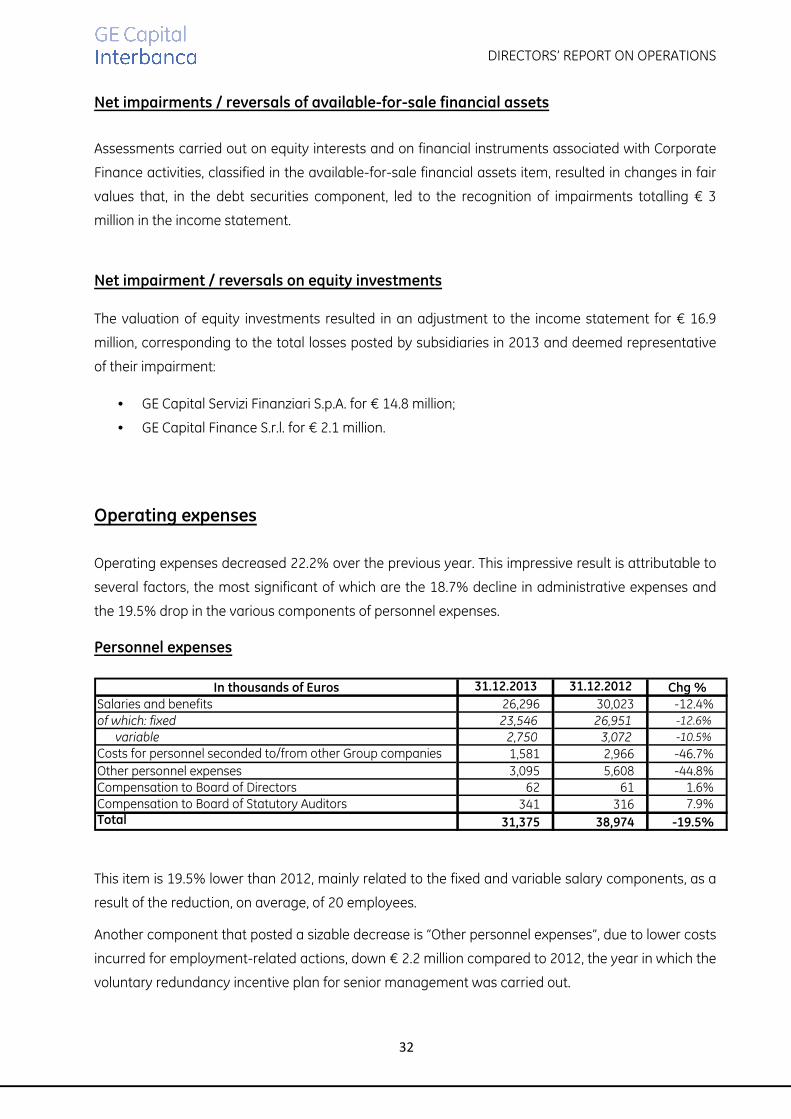
Net impairments / reversals of available-for-sale financial assets
Assessments carried out on equity interests and on financial instruments associated with Corporate
Finance activities, classified in the available-for-sale financial assets item, resulted in changes in fair
values that, in the debt securities component, led to the recognition of impairments totalling € 3
million in the income statement.
Net impairment / reversals on equity investments
The valuation of equity investments resulted in an adjustment to the income statement for € 16.9
million, corresponding to the total losses posted by subsidiaries in 2013 and deemed representative
of their impairment:
• GE Capital Servizi Finanziari S.p.A. for € 14.8 million;
• GE Capital Finance S.r.l. for € 2.1 million.
Operating expenses
Operating expenses decreased 22.2% over the previous year. This impressive result is attributable to
several factors, the most significant of which are the 18.7% decline in administrative expenses and
the 19.5% drop in the various components of personnel expenses.
Personnel expenses
In thousands of Euros 31.12.2013 31.12.2012 Chg %
Salaries and benefits 26,296 30,023 -12.4%of which: fixed 23,546 26,951 -12.6%
variable 2,750 3,072 -10.5%
Costs for personnel seconded to/from other Group companies 1,581 2,966 -46.7%
Other personnel expenses 3,095 5,608 -44.8%Compensation to Board of Directors 62 61 1.6%Compensation to Board of Statutory Auditors 341 316 7.9%Total 31,375 38,974 -19.5%
This item is 19.5% lower than 2012, mainly related to the fixed and variable salary components, as a
result of the reduction, on average, of 20 employees.
Another component that posted a sizable decrease is “Other personnel expenses”, due to lower costs
incurred for employment-related actions, down € 2.2 million compared to 2012, the year in which the
voluntary redundancy incentive plan for senior management was carried out.

DIRECTORS’ REPORT ON OPERATIONS
33
Finally, note that additional charges of € 0.9 million were incurred compared to the prior year for
adjustments to the 2009 redundancy programme, for the extension of the inclusion in the Banking
Sector Solidarity Fund, pursuant to art. 24, para. 14 of Law 214/2011.
Other administrative expenses
In thousands of Euros 31.12.2013 31.12.2012 Chg %
Costs for services from Group companies 9,805 14,391 -31.9%
External consulting and professional services 6,012 7,727 -22.2%
Leasing of equipment and software 4,788 4,024 19.0%
Outsourcing 2,687 2,800 -4.0%
Rental and office expenses 1,373 1,514 -9.3%
Indirect taxes and duties 1,296 1,223 6.0%
Information expenses 981 985 -0.4%
Maintenance expenses 467 1,005 -53.5%
Advertising and other promotional expenses 298 474 -37.1%
Other expenses 1,365 1,629 -16.2%
Total 29,072 35,772 -18.7%
“Other administrative expenses” posted a marked reduction, down 18.7% from 2012.
The expenditure components that had the most influence on the drop in administrative expenses are
those relating to the Master Service Agreement entered into with the General Electric Group and also
includes royalties for use of the GE name and brand, which together decreased € 4.6 million, following
both a redefinition of the contractual base for the royalties, as well as a different division of costs in
the Master Service Agreement on local platforms.
In addition, the decrease in this item is the result of the first year under the costs savings project,
which seeks to reduce costs by renegotiating the existing service contracts and from a general cost
containment policy.
The growth in the item “Leasing of equipment and software” of € 0.8 million is due to the IT Data
Centre Consolidation project, whose objective is to completely reorganise the technology
infrastructure (servers, communication lines, and logistics) within the Group.
DIRECTORS’ REPORT ON OPERATIONS
34
Net provisions for risks and charges
The negative balance of € 0.7 million for this item is mainly attributable to the allocations made
against positions defined as “at risk” associated with legal disputes for € 2.7 million and other risks of
€ 1.2 million, net of releases for transactions completed for € 1.8 million and the surplus recognised
on said transactions for € 1.4 million.
Amortisation, depreciation and property disposals
This item, which includes income statement items 180, 190 and 250, related to amortisation,
depreciation and property disposals, increased by 1.5% mainly as a result of marginal investments
and the natural amortisation process.
Other operating expense/income
The positive result in this item for the year, equivalent to € 4.8 million, represents a drop of 31.7%
from the previous year, or € +7.0 million.
The most relevant components of this decrease include income of € 5 million related to the Master
Service Agreement (€ 5.6 million in 2012), following the decision to centralise within the Bank the
majority of the organisational departments that render services to the Italian companies of GE
Capital Group included in the Bank’s scope of consolidation.
The negative components include the charge incurred for the conclusion of the tax dispute with the
Revenue Agency for € 1.4 million (amount that had been fully allocated to the provision for risks and
charges in previous years). The dispute concerned 2006 tax year, prior to the acquisition of the
controlling interest by GE Capital Corporation Inc., and in agreement with the previous controlling
shareholder.

DIRECTORS’ REPORT ON OPERATIONS
35
Income tax and net profit (loss) for the period
The pre-tax result was a loss of € 172.3 million, an improvement over the pre-tax loss of € 210.5
million in the previous year.
The income tax component was positive for € 44.1 million following tax provisions for the option of
converting deferred tax assets for loan write-downs into tax credits, as well as participation in the tax
consolidation with specific agreements among the companies belonging to the Bank’s statutory
scope of consolidation.
Specifically, the Bank:
• Recognised the amount of the deferred tax assets associated with write-downs and
impairments on loans deductible over 5 years, net of uses for releases of impairments on loans
deductible over 18 years, allocated in previous years and converted into tax credits, increasing
the balance as at 31 December 2012 from € 195.6 million to € 199.0 million; with the approval
of the 2013 Financial Statements and, at the same time, recognising a statutory loss, it will be
possible to continue with the conversion of deferred tax assets into tax credits for € 40.5
million;
• With the approval of the 2012 Financial Statements, converted into tax credits the deferred tax
assets for loan impairments deductible over 18 years, recognised as at 31 December 2012 for
€ 39.5 million, in relation to the 2012 Italian statutory loss;
• During September 2013, converted into tax credits the deferred tax assets for loan
impairments deductible over 18 years, recognised as at 31 December 2012 for € 10.9 million,
in relation to the 2012 Italian tax loss;
• Did not recognise deferred tax assets on previous losses and on estimated losses for the year,
or on other temporary differences, of a lower amount, for a total of € 50.3 million, as,
consistent with IAS 12, general market conditions give rise to substantial uncertainty on the
timing and amount of future taxable profit that the Group may generate.
Net of income taxes, the result for the year was a loss of € 128.3 million, a 24.2% improvement over
the € 169.3 million loss suffered in 2012.
DIRECTORS’ REPORT ON OPERATIONS
36
ADDITIONAL INFORMATION
RESEARCH AND DEVELOPMENT
The Bank does not perform any research and development activities.
INVESTMENTS
Information Technology
During 2013, information technology investments were focused on completing the modernisation
and simplification of the infrastructure:
• The Data Centre Consolidation project was completed with the closing of 5 Data Centres and
the concentration of production equipment in a single site in Milan, which meets the
conservative security policies of GE Capital Group;
• The Disaster Recovery environment was renewed to ensure operations continuity consistent
with the business requirements;
• The summary systems used for Supervisory and Anti-Money Laundering reporting were
updated for new regulations;
• A system for producing reports required by the Federal Reserve was developed and
consolidated.
Tangible assets
During 2013, projects to restructure office space were completed, improving operating efficiency; in
particular:
• Extraordinary maintenance was performed on the Bank’s premises in Corso Venezia 56 and
Via Borghetto 5 in Milan. The work on the systems mainly involved extraordinary
maintenance on lifts, installing a system to automatically return the lift to the ground floor in
an emergency, heating and air-conditioning systems and emergency lighting systems;
• Rental contracts were cancelled on offices used for hard copy archives and archiving
services were outsourced to an external supplier;
• The Rome branch in Via Principessa Clotilde 7 was relocated to Via F. Cesi 72, bringing about
a reduction in operating costs and a better use of office space.

DIRECTORS’ REPORT ON OPERATIONS
37
HUMAN RESOURCES
Breakdown of Personnel
Of the 256 employees as at 31 December 2013 (286 in 2012), 17 had part-time contracts (18 in 2012).
3 employees are working for other General Electric Group companies, while 14 employees of other
subsidiaries of the Bank are working for the Bank.
Solidarity Fund
Following the recognition by INPS of the Bank’s compliance with requirements for accessing the
safeguard measures referred to in art. 24, para. 14 of Law no. 214/2011, during 2013, 16 employees
terminated their employment relationship with the Bank to have access to the extraordinary benefits
of the Solidarity Fund, as they were already participating in the Agreement of 14 January 2010 and
indicated as participants in the Agreement of 22 December 2011.
The financial impact of access to the Solidarity Fund for these 16 employees had already been
allocated in previous years; the cost difference of € 0.9 million was allocated during the year, to
extend participation in the Solidarity Fund for eligible employees until they reach 62 years of age.
Stock options
General Electric Company granted options for its stock to certain Bank employees. In the Notes to the
Financial Statements - Part A Accounting Policies - the accounting standards adopted in applying
IFRS 2 are explained. Under the section “Share-based payments”, the quantitative and qualitative
features of the plans are detailed.
“HealthAhead” Programme
HealthAhead is a General Electric Group global initiative with the objective of helping employees and
their families develop healthy lifestyles and is part of the broader General Electric Group programme,
"Healthymagination", which reflects the Group’s commitment to develop a culture that promotes
health through internal initiatives and investments.
The programme includes the creation of the internal Wellness Committee that organises activities
with health education content and makes tools and structures available to assist in realising these
activities. The Italian HealthAhead team organised activities in 2013 around the following topics:
• Physical activities - fitness classes at the office sites and outdoor running groups were
organised throughout the year; in addition, agreements were made with gyms near the
offices;
• Nutrition - meetings on a healthy diet and cooking classes for children were organised to
promote healthy eating habits;
DIRECTORS’ REPORT ON OPERATIONS
38
• Tobacco – the smoking prohibition has been confirmed in all buildings and external areas;
Professional psychological support was offer for smokers who have initiated a cessation
programme and reflexology sessions were offered to treat nicotine addition;
• Education and prevention - various sessions on prevention and body composition analysis
were offered:
• Stress management - a programme on stress management techniques was organised.
GENERAL REGULATION
The Bank has developed a General Regulation.
During 2013, the Board of Directors of GE Capital Interbanca S.p.A. resolved actions to simplify the
organisational structure, primarily through:
• Reorganisation of the Commercial Department activities, specifically:
- The separation of the Partnership and Commercial Excellence activities, which was
assigned to the primary Strategic Marketing Department;
- The separation of Insurance activities, which will be managed directly by the individual
Group platforms.
• Rationalisation of the activities of the Communications and Business Development
Departments, centralised under the responsibility of the Strategic Marketing Department.
Moreover, it was resolved to extend the participation of the Manager of Compliance and Anti-money
Laundering Department (a control department reporting to the Board of Directors) to meetings of the
Management Committee.
PRIVACY CODE
In accordance with Legislative Decree 196/2003 on personal data protection, the Bank upgraded its
Security Planning Document on 31 March 2013, for the technical regulations in Attachment B of
Legislative Decree no. 196 of 30 June 2003, “Privacy Code”, although rescinded by Conversion Law
no. 35 of 4 April 2012 governing “Urgent regulations for simplification and growth”.
DIRECTORS’ REPORT ON OPERATIONS
39
CORPORATE GOVERNANCE
The Bank’s overall corporate governance framework, intended as the system of rules and procedures
to which corporate bodies refer to guide their behaviour and fulfil their responsibilities, was defined in
consideration of governing legislation as well as regulations prescribed by Bank of Italy.
The Bank and all of the companies in the Banking Group use the “traditional” model that, in applying
the principle of organisational independence and proportionality, the Bank deems the most suitable
model to ensure management independence, operating efficiency and effectiveness of controls to
achieve sound and prudent management, allowing a clear distinction of roles and responsibilities, an
appropriate division of powers and balanced composition of bodies.
Corporate bodies
Corporate functions are delegated, according to their respective competencies, to the following
bodies: (i) Shareholders’ Meeting, (ii) Board of Directors, (iii) Chairman, (iv) Chief Executive Officer, (v)
General Manager and (vi) Board of Statutory Auditors.
The Shareholders’ Meeting may be held either in ordinary or extraordinary session, and must be
convened in ordinary session at least once per year to resolve on issues reserved to its competence
by law and in extraordinary session to resolve on issues reserved to its competence by law.
Participation and representation at Shareholders’ Meeting are governed by law; for the valid
constitution of the Shareholders’ Meeting, both in ordinary and extraordinary session, the quorum
requirements envisaged by governing regulation are applied. The Shareholders’ Meeting, both in
ordinary and extraordinary session, resolves with the voting quorum determined by governing
regulation. Participation and representation at Shareholders’ Meeting are governed by law.
The Board of Directors has the exclusive responsibility, which cannot be delegated, for the strategic
supervision and management of the Bank, which it exercises through the Chief Executive Officer. As
at 31 December 2013, the Bank’s Board of Directors consists of 7 Directors. The mandate of the
current Board of Directors will expire on the date of the Shareholders’ Meeting convened to approve
the 2014 Financial Statements.
The members of the Board of Directors must meet the requirements established by governing
legislation and regulations. Specifically, the Independent Directors must meet the independence
requirements set forth in art. 2399 of the Italian Civil Code.
The Board of Directors elects a Chairman from its members. Its meetings are normally held once per
month and any time the Chairman deems it necessary or if there is a reasoned request, indicating
the issues to be discussed, presented by the Chief Executive Officer or at least one third of the
members of the Board of Directors. For the Board of Directors’ meeting to be considered valid, a
majority of members in office must be present. The Board’s resolutions are made through an
absolute majority of the participants. The Board of Directors may establish an internal audit
committee, an investments committee and a compensation committee.

DIRECTORS’ REPORT ON OPERATIONS
40
The Chairman oversees the Bank’s performance and the effective functioning of the corporate
governance systems, ensuring balance of powers with respect to the Chief Executive Officer and
other Directors. In addition, the Chairman is the legal representative of the Company before third
parties and judicial authorities.
The Chief Executive Officer oversees the business management as part of the powers attributed to
him/her and according to the general guidelines established by the Board of Directors.
The General Manager implements the Board of Directors’ resolutions.
In the Bank, the roles of Chief Executive Officer and General Manager are performed by the same
individual.
The Board of Statutory Auditors consists of 3 Standing Auditors and 2 Alternate Auditors with the
powers assigned by law.
The Auditors must meet the requirements established by governing legislation and regulations. They
remain in office for 3 years and their term expires on the date of the Shareholders’ Meeting convened
to approve the financial statements for the third year of office. The Auditors are eligible for re-
election. The Board of Statutory Auditors meets as necessary, and normally, at least every 90 days.
Resolutions are taken with the presence and favourable vote of the majority of members.
The accounting audit is performed by an Accounting Audit Firm that meets the requirements and is
appointed according to law. As at 31 December 2013, Accounting Audit Firm assigned the
accounting audit is KPMG S.p.A.
***
On 19 December 2013, the Bank’s Board of Directors resolved to approve the establishment of the
Compensation Committee, setting the number of members at 3.
The Committee was assigned the task of making proposals, consulting, and monitoring issues related
to compensation and internal policies. The same Board of Directors has approved the relative
regulation for its functioning and appointed as Committee members: (i) Richard Laxer, Chairman of
the Board of Directors, who was also appointed Chairman of the Committee (ii) Mario Garraffo and (iii)
Enrico Fagioli Marzocchi, both Independent Directors of the Bank.

DIRECTORS’ REPORT ON OPERATIONS
41
Corporate governance, qualitative/quantitative composition of the Board of
Directors and the interlocking prohibition
With the favourable opinion of the Board of Statutory Auditors and the Board of Directors resolution
of 25 June 2009, GE Capital Interbanca S.p.A. adopted the Corporate Governance Project containing
the organisational and corporate governance solutions most appropriate for its structure in
compliance with the "oversight provisions for the organisation and corporate governance of banks”,
pursuant to Bank of Italy Communications no. 264010 of 4 March 2008 and no. 213623 of 27
February 2009.
As such, and in consideration of:
• Effective 31 December 2010, the “GE Capital Interbanca Banking Group” was established,
enrolled in the Banking Group register pursuant to art. 64 of Legislative Decree no. 385/1993;
• On 11 January 2012, Bank of Italy issued a measure governing “the application of supervisory
regulations regarding corporate governance and organisation of banks", which amended the
Bank of Italy Communications no. 264010 of 4 March 2008 and no. 213623 of 27 February
2009;
• On 31 January 2012, the Bank’s Shareholders’ Meeting approved the new Articles of
Association that include the new name of the Bank "GE Capital Interbanca S.p.A” replacing
“GE Capital S.p.A.” and the description of the circumstances under which the Bank is “subject
to management and coordination as defined by art. 2497 bis of the Italian Civil Code, of GE
Capital Corporation, with registered office in the United States of America”,
it was deemed appropriate to update the Corporate Governance Project.
For this purpose, on 22 March 2012, the Bank’s Board of Directors resolved to approve the changes
to the Project. The changes include the introduction of set criteria inherent in the
qualitative/quantitative composition of the Board of Directors that is considered appropriate and
suitable to ensure the best structure for the Bank’s Board of Directors given its complexities and
strategies, as well as those of the Banking Group.
In applying said criteria, the Board of Directors, in its meeting of 22 March 2012, also resolved the
correlation between the qualitative/quantitative composition of the Board of Directors established as
part of the Project, as modified and supplemented, and the composition of the Board of Directors as
at said date.
In December 2013, Bank of Italy issued a consultation document containing “Oversight provisions for
the organisation and corporate governance of banks”. In this document, certain amendments to the
aforementioned oversight provisions issued by Bank of Italy in 2008 were made available for public
consultation. The objective of these amendments was to implement changes introduced by Directive
2013/36/EU (so-called “CRD IV”), whose implementation deadline was set for 31 December 2013, and
to update the regulation in light of application experience. As part of the imminent effective date of

DIRECTORS’ REPORT ON OPERATIONS
42
the aforementioned new “Oversight provisions for the organisation and corporate governance of
banks”, the Corporate Governance Project was subjected to an appropriate revision.
On 23 May 2012, the Bank’s Shareholders’ Meeting, having acknowledged the expiry of the term in
office of members of the Board of Directors and the Board of Statutory Auditors pursuant to art. 2383
of the Italian Civil Code, resolved to appoint for 2012, 2013 and 2014, with expiry on the date of the
approval of the financial statements as at 31 December 2014, (i) a Board of Directors made up of six
members: Richard Alan Laxer (Chairman), Giuseppe Recchi, Paolo Braghieri, Patricia Marie Halliday,
Robert Charles Green and Mario Garraffo (Independent Director) and (ii) a Board of Statutory Auditors
consisting of: Paolo Andrea Colombo (Chairman), Marco Giorgino, Alberto Dalla Libera and as
Alternate Auditors, Piera Vitali and Guido Sazbon.
Following this appointment, on 24 May 2012 the Board of Directors of GE Capital Interbanca S.p.A.
resolved the correlation between the qualitative/quantitative composition as defined in the Project
and the composition of the Board of Directors resulting from the appointment process.
In its meeting of 24 May 2012, the Board verified that the individual members met the requirements
of reputation, professionalism, and independence by completing the necessary valuations, upon first
application, pursuant to art. 36 of Legislative Decree no. 201/2011 converted into Law no. 214/2011
regarding “protecting the intersection of competition and personal participation in credit and
financial markets”.
In its meeting of 25 July 2013, following the appointment by co-optation of Director Todd Lamar
Smith, the Bank’s Board of Directors verified the consistency between the qualitative/quantitative
composition requirements of the Project and the composition resulting from the appointment
process. Furthermore, the Board verified that the new Director (i) met the reputation and
professionalism requirements and (ii) did not have any situations that would be in contrast with the
provisions referred to in the aforementioned art. 36 of Legislative Decree no. 201/201 converted into
Law no. 214/2011.
The Bank’s Board of Directors resolved in its meeting of 17 December 2013 to: (i) increase the number
of Board members from 6 to 7, (ii) confirm Director Todd Lamar Smith in office and (iii) appoint Enrico
Maria Luigi Fagioli Marzocchi as Independent Director.
The verification that requirements were met (including independence requirements) were performed
by the Board of Directors on 19 December 2013, following the appointment of Enrico Maria Luigi
Fagioli Marzocchi as Independent Director.
That said, as at 31 December 2013, the Bank’s Board of Directors consists of the following 7
Directors: Richard Alan Laxer (Chairman), Giuseppe Recchi, Paolo Braghieri (Chief Executive Officer
and General Manager), Patricia Marie Halliday, Todd Lamar Smith, Mario Garraffo (Independent
Director) and Enrico Maria Luigi Fagioli Marzocchi (Independent Director).
DIRECTORS’ REPORT ON OPERATIONS
43
Related parties
On 28 June 2012, the Board of Directors resolved the approval of the Regulation governing
transactions with related parties and associated parties of individual companies belonging to the
Banking Group and the Banking Group itself, having received the positive opinions of the
Independent Director Mario Garraffo and the Board of Statutory Auditors and in compliance with
applicable regulations, particularly Bank of Italy Circular no. 263/2006.
In its meeting of 20 December 2012, the Board of Directors resolved (i) the approval of an updated
version of the aforementioned Regulation and (ii) the approval of the Regulation on controls related
to policies on risk assets and conflicts of interest in regards to related parties. These documents were
subsequently implemented by the individual companies, other than the Bank, that belong to the
Banking Group.
As required by Bank of Italy, the Bank’s Shareholders’ Meeting held 21 December 2012 was informed
regarding the Board approval of the document containing the internal control policies on related
parties.
Establishment of the Banking Group
GE Capital Interbanca S.p.A. is the Parent Company of the GE Capital Interbanca Banking Group,
enrolled in the Banking Group Register according to art. 64 of the Consolidated Banking Act.
The most significant steps in the evolution that resulted in the establishment of the Banking Group
are described below.
On 31 December 2010, GE Capital Interbanca S.p.A. acquired the equity investments in GE Capital
Finance S.r.l., GE Capital Servizi Finanziari S.p.A. and GE Leasing Italia S.p.A.
During 2011, the procedures to enrol the new Banking Group in the Banking Group Register were
completed, as well as the related amendments to the Articles of Association.
On 17 January 2011, Bank of Italy communicated to the Bank that the “GE Capital Interbanca
Banking Group” had been enrolled in the Banking Group Register effective 31 December 2010, in
accordance with art. 64 of Legislative Decree no. 385/1993.
In the letters of 7 and 10 March 2011, GE Capital Interbanca S.p.A. submitted requests to authorise
the acquisition of indirect full ownership stakes in the share capital of GE Commercial Distribution
Finance S.r.l. (through GE Capital Finance S.r.l.) and GE SPV S.r.l. (through GE Capital Servizi Finanziari
S.p.A.). Bank of Italy authorised said acquisition of indirect full ownership stakes in its letter of 6 July
2011. Based on GE Capital Interbanca S.p.A.’s petition as Parent Company, Bank of Italy authorised
the inclusion of GE Commercial Distribution Finance S.r.l. in the Banking Group, effective 5 August
2011.
DIRECTORS’ REPORT ON OPERATIONS
44
Corporate restructuring of the Banking Group
The Bank’s Board of Directors of 26 July 2012 resolved to approve the “Restructuring project of the
GE Capital Interbanca Banking Group”.
Bank of Italy was informed of the Project on 30 July 2012. The Project’s objectives are to simplify the
corporate structure and rationalise the costs basis of the Banking Group, as part of the 2012-2015
Business Plan.
The Project’s restructuring plan consists of the following transactions:
• The merger by incorporation of Bios Interbanca S.r.l. (not part of the Banking Group) and GE
Leasing Italia S.p.A. in GE Capital Servizi Finanziari S.p.A. (the latter two companies both
operating in the leasing sector); and
• The merger by incorporation of GE Commercial Distribution Finance S.r.l. in GE Capital
Finance S.r.l. (both companies operating in the factoring sector).
On 27 July 2012, the respective Boards of Directors of the aforementioned companies involved in the
extraordinary transactions resolved the approval of the relative merger plans. The Shareholders’
Meetings of GE Capital Finance S.r.l. and GE Commercial Distribution Finance S.r.l., both held on 26
October 2012, approved the merger by incorporation of GE Commercial Distribution Finance S.r.l. in
GE Capital Finance S.r.l. The Shareholders’ Meetings of GE Capital Servizi Finanziari S.p.A. and GE
Leasing Italia S.p.A., both held on 5 February 2013, approved the merger by incorporation of GE
Leasing Italia S.p.A. in GE Capital Servizi Finanziari S.p.A.
These mergers became legally effective on 1 May 2013, while the accounting and tax effects will
apply retrospectively from 1 January 2013.
As at 31 December 2013, the Banking Group consists of the following companies: GE Capital
Interbanca S.p.A., as Parent Company, GE Capital Servizi Finanziari S.p.A. (wholly owned directly by
the Bank), GE Capital Finance S.r.l. (owned by the Bank (i) directly, with a 60% stake in share capital
and (ii) indirectly, through GE Capital Servizi Finanziari S.p.A., with a 40% stake in share capital) and
GE SPV S.r.l. (securitisation company owned indirectly by the Bank, through GE Capital Servizi
Finanziari S.p.A., with a 100% stake in share capital).
DIRECTORS’ REPORT ON OPERATIONS
45
Articles of Incorporation
On 31 January 2012, the Bank’s Extraordinary Shareholders’ Meeting resolved to approve the new
text for the Articles of Incorporation. Following a process to evaluate its compliance, the Bank's new
Articles of Incorporation were enrolled in the Register of Companies at the Milan Chamber of
Commerce on 29 February 2012.
The most important changes are as follows:
• As indicated above, the name was changed to "GE Capital Interbanca S.p.A.";
• In art. 1 of the Articles of Incorporation, it was explicitly stated that the Bank is subject to the
management and coordination, pursuant to art. 2497 of the Italian Civil Code, of GE Capital
Corporation, a company based in the United States of America;
• More detailed controls were provided for the attribution of powers that are not the exclusive
competency of the Board of Directors by the Board in regards to third parties;
• The reporting requirements to the Board of Directors were strengthened compared to the
previous reporting structure, by identifying the holders of proxies in more detail. This also
supports the continual and adequate information flow between delegated and delegating
bodies, based on instructions in Bank of Italy provisions regarding corporate governance;
• The Board of Directors was given the right to set up internally, where necessary, any
committee for specific topics and subjects.
Administrative liability of legal entities – Legislative Decree no. 231/2001
On 28 February 2013, the Board of Directors approved the new Organisational Model pursuant to
Legislative Decree no. 231/2001 for the Company and its subsidiaries, updated to include new
regulation regarding environmental offences and concerning corruption between private individuals.
At the same time, the Board appointed as members of the new Supervisory Board: Salvatore Pino -
Chairman and external member, Paolo Rusconi – Manager of the Compliance and Anti-money
Laundering Department, and Amelia Travi – Manager of the Audit Department.

DIRECTORS’ REPORT ON OPERATIONS
46
MANAGEMENT AND COORDINATION ACTIVITIES
As at 31 December 2013, GE Capital Interbanca S.p.A. performs management and coordination
activities for the companies of the Banking Group, in accordance with art. 2497 and subsequent of
the Italian Civil Code. In performing these activities, GE Capital Interbanca S.p.A., as Parent Company
of the GE Capital Interbanca Banking Group, issues directives to Group members in carrying out
instructions issued by Bank of Italy to maintain the Banking Group stability in accordance with art. 61
of Italian Legislative Decree no. 385/93.
As Parent Company, the Bank decided not to have an ad-hoc department for the management and
coordination of the Banking Group and for the management of equity investments in the companies
belonging to the Group. This choice was justified by the Banking Group’s size and the current level of
organisational complexity.
However, it was deemed necessary to equip the Parent Company and the Banking Group with a
management and control structure based on two pillars: (i) the senior management of the Parent
Company and the Banking Group companies and (ii) an internal set of rules.
As previously noted, the Shareholders’ Meeting resolved on 31 January 2012 to approve the new
Articles of Association that included GE Capital Corporation, with headquarters in the United States of
America, performing activities of management and coordination for GE Capital Interbanca S.p.A., as
defined in art. 2497-bis of the Italian Civil Code.

DIRECTORS’ REPORT ON OPERATIONS
47
ADMINISTRATIVE-FINANCIAL GOVERNANCE
Pursuant to Law no. 262/2005 (and subsequent amendments) and disclosure pursuant to art.
123 bis paragraph 2 of Legislative Decree no. 58 of 24 February 1998
The existing internal risk management and control system is made up of a group of corporate rules
and procedures, adopted by the operating units, in order to guarantee the fairness, accuracy and
timeliness of financial information.
Law no. 262/2005 “Provisions for protecting savings and governing financial markets” introduced the
figure of “Executive charged with preparing the company’s financial reports” to the corporate
organisation.
On 6 February 2009, the Board of Directors appointed Ettore Colombo to this position and added to
the Company Regulations an appropriate internal control system, in accordance both with the
aforementioned Law no. 262/2005 as well as the Sarbanes-Oxley Act in America, as GE Capital
Interbanca S.p.A. is a subsidiary of a company listed on the NYSE.
The stated objective of ensuring the fairness, accuracy and timeliness of financial information
through said controls is achieved by:
• Strengthening the internal control processes related to the activities of financial reporting,
lending, external debt, purchasing processes, payment and collections, taxes and illegal
payments;
� Assigning responsibilities to certain roles:
� The CEO and the Executive charged with preparing the company’s financial reports must
certify the accuracy of the information in the financial statements as well as the
effectiveness of the entire internal control system;
� Functional managers must periodically verify and document the effectiveness of their
control system;
� The Finance department must oversee that all identified controls are present and
function effectively, by monitoring and carrying out tests, with the support of the audit
results from the Internal Audit department;
� Owners of individual processes must be responsible for the controls in their area,
complying with the established timing and documenting the controls in an appropriate
manner.
PUBLIC DISCLOSURE
On its internet site (www.gecapitalinterbanca.it), the Bank publishes both the 2013 Financial
Statements as well as "public disclosure" (Bank of Italy Circular no. 285), in which it provides
information regarding capital adequacy, risk exposure and the general characteristics of systems for
identifying, measuring and managing risk.
DIRECTORS’ REPORT ON OPERATIONS
48
RISKS, UNCERTAINTIES AND CONTINUITY
For a thorough examination of the methods for measuring and managing credit, financial and other
relevant risks, refer to the specific section of the Notes to the Financial Statements.
In reference to Bank of Italy/CONSOB/ISVAP Document no. 4 of 6 March 2010, in which Directors are
requested to provide information to clarify the impact of the economic and financial crisis,
operational and strategic options, and corrective actions to be taken to confront the contingencies of
the current market and business situation, it should be noted that GE Capital Interbanca S.p.A. will
continue to operate for the foreseeable future and that these financial statements are a reliable
representation of the economic and financial situation of the company and have been prepared
under the assumption of a going concern.
The main uncertainties to which the Bank is exposed are associated with trends in the real economy
and the resulting impacts on typical activities it performs, as well as the estimation processes for
financial assets, with particular reference to the loan portfolio.
The Bank is organised to handle these uncertainties, backed by an asset structure that demonstrates
the constant commitment by the controlling shareholder to ensure asset adequacy and compliance
with regulatory requirements.
Disclosure pursuant to the joint Bank of Italy/CONSOB/IVASS Document no. 6 of 8 March 2013.
The Bank does not hold any long-term investments financed through term-structured repos.

DIRECTORS’ REPORT ON OPERATIONS
49
INTERCOMPANY TRANSACTIONS
The table below shows the assets, liabilities, costs and revenues arising from transactions with
subsidiaries, parent companies and companies controlled by the latter.
The column “Total GE Capital Interbanca S.p.A.” shows only the items affected by intercompany
transactions.
Total
GE Capital
Interbanca S.p.A.
Total
intercompany
relationships
GE Group
companies
Consolidated
companies (A)
ASSETS
Loans to customers 2,114,951 4,396 4,396 -
Equity investments 367,520 367,520 - 367,520
Other assets 23,574 5,395 15 5,380
TOTAL ASSETS 2,506,045 377,311 4,411 372,900
LIABILITIES
Due to customers 2,287,141 2,176,107 2,175,459 648
Other liabilities 44,709 6,266 1,196 5,070
TOTAL LIABILITIES 2,331,850 2,182,373 2,176,655 5,718
INCOME STATEMENT
Interest income and similar revenues 62,342 19 19
Interest expense and similar charges (17,775) (7,174) (7,045) (129)
Fee and commission income 6,452 2 - 2
Fee and commission expense (790) (657) (657) -
Administrative expenses (60,447) (12,237) (10,887) (1,350)
Other operating expense/income 6,247 5,163 152 5,011
Gains (Losses) from investments (16,851) (16,851) - (16,851)
TOTAL REVENUES 75,041 5,184 171 5,013
TOTAL COSTS (95,863) (36,919) (18,589) (18,330)
(A) Subsidiaries of the Banking Group or fully consolidated
31.12.2013
In thousands of Euros
The item “Due to customers” primarily consists of:
� Loans received from GE Group companies: GE Hungary KFT (Hungary), GE Capital Eireann
Funding I (Ireland), GE Financial Markets Funding I (United Kingdom) and GE Capital Finance
III GmbH & Co KG (Germany) for a total of € 1,975,228 thousand, at market conditions as
previously indicated. Interest expense accrued on these loans during 2013 amounts to €
5,989 thousand;
� Subordinated loan granted by GE Hungary KFT for a total amount of € 200,231 thousand, at
market conditions; interest expense accrued in 2013 was € 996 thousand.
� Current accounts with the Bank held by subsidiaries for € 648 thousand, at market
conditions; interest expense accrued in 2013 amounts to € 130 thousand.
Administrative expenses of € 12,237 thousand mainly refer to expenses for services rendered by
other GE Capital Group companies as part of the Master Service Agreement and invoiced on an

DIRECTORS’ REPORT ON OPERATIONS
50
analytic cost allocation model. It also includes royalty fees of € 2 million for the use of the GE name
and brand, as part of the standard contractual agreement applicable within the GE Group. This
contract began on the date the Bank changed its name, thereby defining the commencement of the
use of the GE name and brand.
Intercompany transactions with General Electric Group companies are carried out at arm’s length.
GE Capital Interbanca S.p.A. does not hold treasury shares or shares in the direct Parent Company GE
Capital Corporation Inc.

DIRECTORS’ REPORT ON OPERATIONS
51
RELATIONS WITH SUPERVISORY BODIES
Following the Supervisory Review and Evaluation Process (SREP) conducted in 2013, the Bank of Italy,
in reviewing the capital objectives for the leading intermediaries in the banking system, requested
the Bank (in Protocol no. 144784/14 of 10 February 2014), as Parent Company, to maintain a
consolidated Common Equity Tier 1 ratio greater than 9.5% and a consolidated Total Capital ratio of
at least 11.5%. The Board of Directors and the Board of Statutory Auditors were informed of this
request by the competent internal departments on 27 February 2014.
During 2013, the Bank also worked directly with Bank of Italy on compensation policies and
strengthening the capital of the Bank.
RELATIONS WITH THE REVENUE AGENCY
On 10 May 2013, the Milan Provincial Tax Commission accepted the out-of-court settlement proposal
for a payment of € 1.4 million, thereby extinguishing the dispute with the Bank, which arose following
the tax audit for the 2006 tax year, which was prior to the acquisition by GE Group.
On 5 March 2014, the Bank received a letter from the Revenue Agency concerning the start of a tax
audit in relation to direct taxes, VAT and IRAP for 2010 and 2011.
TAX CONSOLIDATION
Beginning in the 2013 tax year, the National Tax Consolidation Scheme was extended to the
subsidiary GE Capital Services S.r.l, which is not part of the Banking Group.
Hence, considering the mergers with retrospective accounting and tax effective dates of 1 January
2013 of the already consolidated GE Leasing Italia S.p.A, Bios Interbanca S.r.l. and GE Distribution
Finance S.r.l., the current scope of the National Tax Consolidation Scheme includes GE Capital
Interbanca S.p.A. (as consolidating company), together with GE Capital Servizi Finanziari S.p.A., GE
Capital Finance S.r.l., GE SPV S.r.l. and GE Capital Services S.r.l. (as consolidated companies).
Consistent with adopted GE Group practices, the consolidation agreements in effect within the Italian
tax group envisage that any tax losses brought into the tax consolidation by individual companies
are not reimbursed to said companies. In addition, the agreements envisage that taxes on any
taxable income due from individual entities making up the national tax group are reimbursed only if,
and to the extent that, they are effectively paid to tax authorities by the consolidating body, on the
basis of the results of the Group’s national tax consolidation.
For more information on the accounting impact of these contractual terms, refer to the section of the
Notes to the Financial Statements regarding accounting policies.
The effects of these agreements on the income tax item are described in the Notes to the Financial
Statements section “Taxes on income from continuing operations”.

DIRECTORS’ REPORT ON OPERATIONS
52
NEW TAX LEGISLATION
The new items introduced by the Stability Law (Law no. 147 of 27 December 2013) include the
reformulation of the tax treatment of write-downs and impairments on loans to customers for credit
and financial institutions referred to in Legislative Decree no. 87/92, effective from the tax year
underway as at 31 December 2013.
The new measures envisage that:
• Write-downs and impairment on loans to customers, other than those realised through the sale
for consideration, are deductible, both for IRES and IRAP purposes, at a fixed rate in the current
year and the following four years;
• impairment on loans to customers realised through the sale for consideration are deductible in
full in the year in which they are recognised in the financial statements, both for IRES and IRAP
purposes
SHAREHOLDERS AND SHARES
As at 22 December 2009, GE Capital Corporation became the direct shareholder of GE Capital
Interbanca S.p.A., with a 99.99% shareholding as at 31 December 2013.
SIGNIFICANT EVENTS AFTER THE FINANCIAL YEAR END
Not applicable.
DIRECTORS’ REPORT ON OPERATIONS
53
PROPOSED ALLOCATION OF LOSSES
Dear Shareholders,
The 2013 loss amounts to € 128,269,192.31.
We propose that the entire amount of the loss be carried forward.

DIRECTORS’ REPORT ON OPERATIONS
54
OUTLOOK FOR 2014
Dear Shareholders,
Recent forecasts for the Italian economy indicate a return to moderate growth in the 2014-2015
period and a gradual recovery of the market. The recovery is expected to be driven by foreign
demand and a gradual increase in manufacturing investments, supported by improvements
in demand forecasts. Therefore, a contained improvement in consumption is expected,
which will, however, remain below the historical average. Unfortunately, the high
unemployment level is not expected to fall in the near future.
Although the economic scenario is expected to remain difficult, the Bank will continue to
implement its stated strategy of pursuing a balanced budget through the following
initiatives:
• Growth in lending volumes, with particular emphases on cross-selling activities of
subsidiaries’ products (factoring and leasing) to rebalance the weight of the Group’s
assets in favour of these two products;
• Active management of the loan portfolio, which envisages a reduction in impairments
in 2014 due to the careful selection of new disbursements and the rigorous allocation
policy followed in recent years;
• Additional cost reductions through operating efficiency actions.

DIRECTORS’ REPORT ON OPERATIONS
55
Dear Shareholders,
We kindly ask you to adopt the necessary resolutions concerning the following:
• The Financial Statements as at 31 December 2013, including the Directors’ Report on Operations,
the Financial Statements and the Notes as well as the Report of the Board of Statutory Auditors,
the Certification of the Financial Statements, the Report of the Accounting Audit Firm and related
resolutions;
• Allocation of the 2013 loss of € 128,269,192.31 to be carried forward in full.
Board of Directors
DIRECTORS’ REPORT ON OPERATIONS
56
(empty page)
Notes to the 2013 Separate Financial Statements
57
Separate Financial Statements

Notes to the 2013 Separate Financial Statements
58
Assets
10. Cash and cash equivalents - -
20. Financial assets held for trading 50,009,593 85,031,653
30. Financial assets designated at fair value through profit and loss - -
40. Financial assets available for sale 115,227,947 122,561,142
60. Due from banks 226,273,848 324,649,320
70. Loans to customers 2,114,951,412 2,617,822,838
80. Hedging derivatives 494,489 930,705
100. Equity investments 367,520,250 384,371,385
110. Tangible assets 48,222,694 49,508,028
120. Intangible assets 2,560,454 1,689,720
of which: - goodwill - -
130. Tax assets 252,584,316 220,581,548
a) current 53,264,827 13,254,514
b) deferred (*) 199,319,489 207,327,034
of which: - L.214/2011 198,969,612 206,539,623
150. Other assets 23,573,777 23,403,728
Total assets 3,201,418,780 3,830,550,067
31.12.2013 31.12.2012
BALANCE SHEET (in euro)
*) The comparison data for 2012 was modified to reflect changes following the amendment to IAS 19 "Employee
benefits" and the introduction of the new IAS 19 Revised, effective 1 January 2013. These changes resulted in an
increase in the severance indemnity fund for € 821 thousand, in the related deferred tax assets for € 226
thousand and in the equity valuation reserve for € 595 thousand.
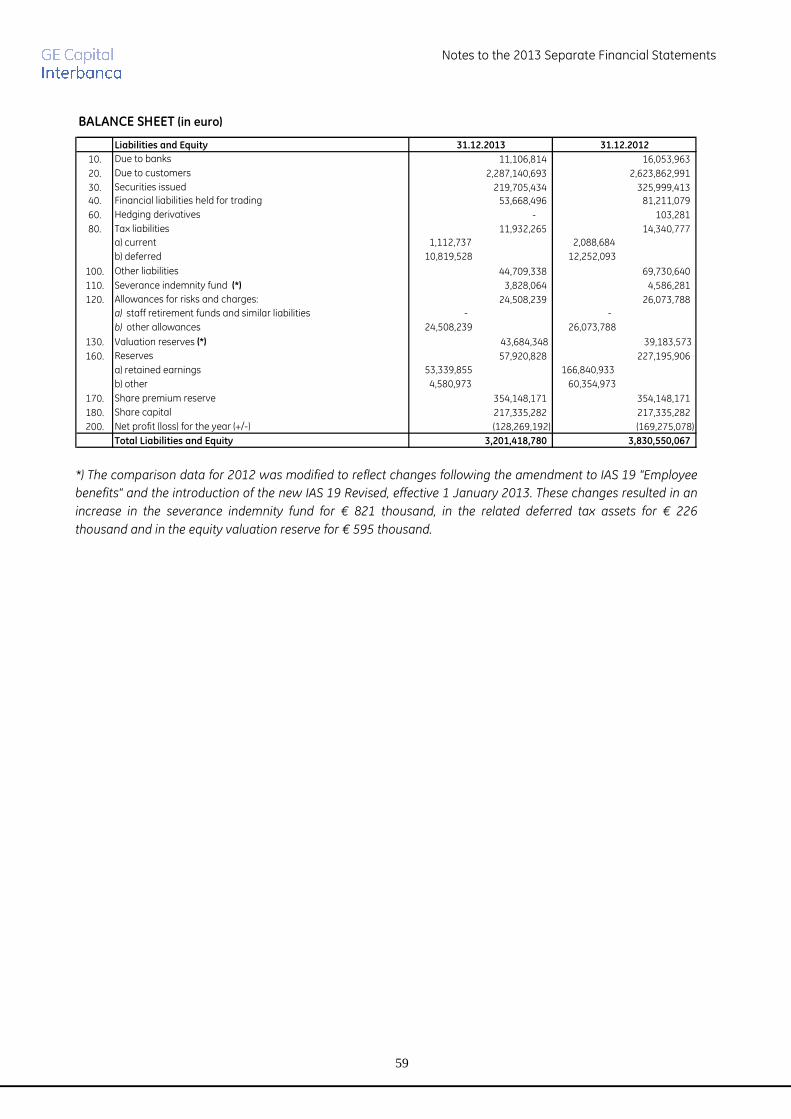
Notes to the 2013 Separate Financial Statements
59
BALANCE SHEET (in euro)
Liabilities and Equity
10. Due to banks 11,106,814 16,053,963
20. Due to customers 2,287,140,693 2,623,862,991
30. Securities issued 219,705,434 325,999,413
40. Financial liabilities held for trading 53,668,496 81,211,079
60. Hedging derivatives - 103,281
80. Tax liabilities 11,932,265 14,340,777
a) current 1,112,737 2,088,684
b) deferred 10,819,528 12,252,093
100. Other liabilities 44,709,338 69,730,640
110. Severance indemnity fund (*) 3,828,064 4,586,281
120. Allowances for risks and charges: 24,508,239 26,073,788
a) staff retirement funds and similar liabilities - -
b) other allowances 24,508,239 26,073,788
130. Valuation reserves (*) 43,684,348 39,183,573
160. Reserves 57,920,828 227,195,906
a) retained earnings 53,339,855 166,840,933
b) other 4,580,973 60,354,973
170. Share premium reserve 354,148,171 354,148,171
180. Share capital 217,335,282 217,335,282
200. Net profit (loss) for the year (+/) (128,269,192) (169,275,078)
Total Liabilities and Equity 3,201,418,780 3,830,550,067
31.12.2013 31.12.2012
*) The comparison data for 2012 was modified to reflect changes following the amendment to IAS 19 "Employee
benefits" and the introduction of the new IAS 19 Revised, effective 1 January 2013. These changes resulted in an
increase in the severance indemnity fund for € 821 thousand, in the related deferred tax assets for € 226
thousand and in the equity valuation reserve for € 595 thousand.

Notes to the 2013 Separate Financial Statements
60
Item
10 Interest income and similar revenues 62,341,772 90,348,909
20 Interest expense and similar charges (17,775,107) (41,215,151)
30 Net interest margin 44,566,665 49,133,758
40 Fee and commission income 6,451,712 10,167,493
50 Fee and commission expense (789,678) (973,447)
60. Net fee and commission income 5,662,034 9,194,046
70 Dividends and similar revenues 2,135,572 27,778
80 Profits (Losses) on trading (13,922,172) (4,313,775)
90 Net result of hedge accounting (97,345) (7,360)
100 Profits (losses) on disposal or repurchase of: 561,723 8,909
a) loans - -
b) financial assets available for sale 561,723 27,225
c) financial assets held to maturity - -
d) financial liabilities - (18,316)
110 Profits (Losses) on financial assets and liabilities
designated at fair value - 1,939
120 Net interest and other banking income 38,906,477 54,045,295
130 Net impairment losses and reversals of (impairment on): (135,973,792) (178,455,098)
a) loans (131,138,378) (155,398,007)
b) financial assets available for sale (2,984,974) (592,828)
c) financial assets held to maturity - -
d) other financial activities (1,850,440) (22,464,263)
140 Operating income (97,067,315) (124,409,803)
150 Administrative expenses: (60,446,941) (74,745,509)
a) personnel expenses (31,374,833) (38,973,950)
b) other administrative expenses (29,072,108) (35,771,559)
160 Net provisions for risks and charges (710,388) (5,299,648)
170 Net adjustments to/recoveries on tangible assets (1,417,831) (1,366,680)
180 Net adjustments to/recoveries on intangible assets (638,619) (660,331)
190 Other operating expense/income 4,797,053 7,023,395
200 Operating costs (58,416,726) (75,048,773)
210 Gains (Losses) from investments (16,851,135) 11,024,612-
240 Profits (Losses) on disposal of investments -
250 Profit (Loss) before tax from continuing
operations (172,335,176) (210,483,188)
260 Taxes on income from continuing operations 44,065,984 41,208,110
270 Profit (Loss) after tax from continuing
operations (128,269,192) (169,275,078)
290 Net profit (loss) for the year (128,269,192) (169,275,078)
INCOME STATEMENT (in euro)
31.12.2013 31.12.2012

Notes to the 2013 Separate Financial Statements
61
Item 31.12.2013 31.12.2012
10. Profit (Loss) for the year (128.269.192) (169.275.078)
Other income components net of taxes not reclassified to profit or
loss: 91.904 (595.458)
40. Defined benefit plans (*) 91.904 (595.458)
Other income components after tax that may be reclassified to
profit or loss: 4.408.871 8.382.303
90. Cash flow hedges 40.411 135.214
100. Available-for-sale financial assets: 4.368.460 8.247.089
110. Total other income components net of taxes 4.500.775 7.786.845
120. Comprehensive income (Item 10 + 110) (123.768.417) (161.488.233)
STATEMENT OF COMPREHENSIVE INCOME
*) The comparison data for 2012 was modified to reflect changes following the amendment to IAS 19 "Employee
benefits" and the introduction of the new IAS 19 Revised, effective 1 January 2013. These changes resulted in an
increase in the severance indemnity fund for € 821 thousand, in the related deferred tax assets for € 226
thousand and in the equity valuation reserve for € 595 thousand.

Notes to the 2013 Separate Financial Statements
62
Issu
e o
f n
ew
sh
are
s
Pu
rch
ase
of
tre
asu
ry
sha
res
Ext
rao
rdin
ary
div
ide
nd
s
Ch
an
ge
s in
eq
uit
y
inst
rum
en
ts
De
riv
ati
ve
s o
n
tre
asu
ry s
ha
res
Sto
ck o
pti
on
s
Share capital: 217.335.282 - 217.335.282 - - - - - - - - - - 217.335.282
a) ordinary shares 217.335.282 - 217.335.282 - - - - - - - - - - 217.335.282
b) other shares - - - - - - - - - - - - - -
Share premium reserve 354.148.171 - 354.148.171 - - - - - - - - - - 354.148.171
Reserves: 227.195.906 - 227.195.906 (169.275.078) - - - - - - - - - 57.920.828
a) retained earnings 166.840.933 - 166.840.933 (113.501.078) - - - - - - 53.339.855
b) other 60.354.973 - 60.354.973 (55.774.000) - - - - - - - - - 4.580.973
Valuation reserves: 39.183.573 - 39.183.573 4.500.775 43.684.348
Equity instruments - - - - - - - - - - - - - -
Treasury shares - - - - - - - - - - - - - -
Net profit (loss) for the year (169.275.078) - (169.275.078) 169.275.078 - - - - - - - - (128.269.192) (128.269.192)
Equity 668.587.854 - 668.587.854 - - - - - - - - - (123.768.417) 544.819.437
STATEMENT OF CHANGES IN EQUITY (2013)
Reserves
Div
ide
nd
s a
nd
oth
er
all
oca
tio
ns
20
12
co
mp
reh
en
siv
e
inco
me
Changes in the year
Eq
uit
y a
s a
t 3
1.1
2.2
01
3
Changes in
reserves
Movements in equity
Ba
lan
ces
as
at
31
.12
.20
12
Ch
an
ge
s in
op
en
ing
ba
lan
ces
Ba
lan
ces
as
at
01
.01
.20
13
Allocation of prior year's
result
*) The comparison data for 2012 was modified to reflect changes following the amendment to IAS 19 "Employee benefits" and the introduction of the new IAS 19 Revised,
effective 1 January 2013. These changes resulted in an increase in the severance indemnity fund for € 821 thousand, in the related deferred tax assets for € 226
thousand and in the equity valuation reserve for € 595 thousand.
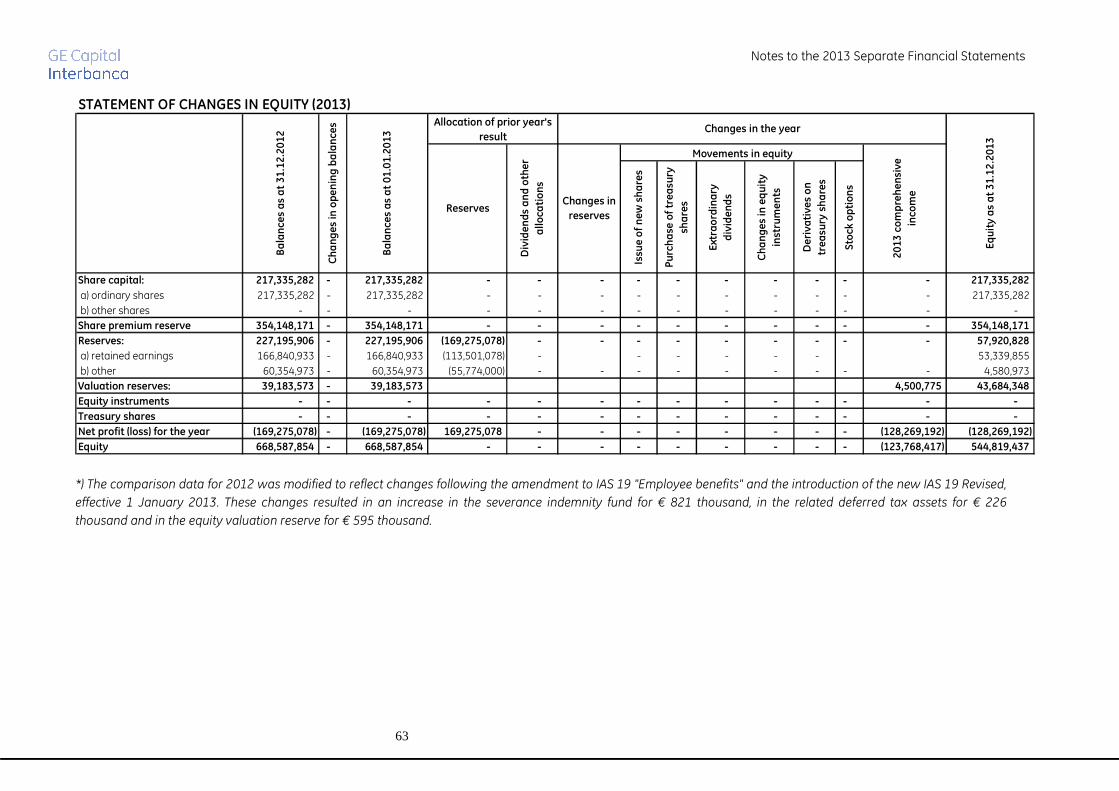
Notes to the 2013 Separate Financial Statements
63
Issu
e o
f n
ew
sh
are
s
Pu
rch
ase
of
tre
asu
ry
sha
res
Ext
rao
rdin
ary
div
ide
nd
s
Ch
an
ge
s in
eq
uit
y
inst
rum
en
ts
De
riv
ati
ve
s o
n
tre
asu
ry s
ha
res
Sto
ck o
pti
on
s
Share capital: 217,335,282 - 217,335,282 - - - - - - - - - - 217,335,282
a) ordinary shares 217,335,282 - 217,335,282 - - - - - - - - - - 217,335,282
b) other shares - - - - - - - - - - - - - -
Share premium reserve 354,148,171 - 354,148,171 - - - - - - - - - - 354,148,171
Reserves: 227,195,906 - 227,195,906 (169,275,078) - - - - - - - - - 57,920,828
a) retained earnings 166,840,933 - 166,840,933 (113,501,078) - - - - - - 53,339,855
b) other 60,354,973 - 60,354,973 (55,774,000) - - - - - - - - - 4,580,973
Valuation reserves: 39,183,573 - 39,183,573 4,500,775 43,684,348
Equity instruments - - - - - - - - - - - - - -
Treasury shares - - - - - - - - - - - - - -
Net profit (loss) for the year (169,275,078) - (169,275,078) 169,275,078 - - - - - - - - (128,269,192) (128,269,192)
Equity 668,587,854 - 668,587,854 - - - - - - - - - (123,768,417) 544,819,437
Ba
lan
ces
as
at
01
.01
.20
13
Allocation of prior year's
result
STATEMENT OF CHANGES IN EQUITY (2013)
Reserves
Div
ide
nd
s a
nd
oth
er
all
oca
tio
ns
20
13
co
mp
reh
en
siv
e
inco
me
Changes in the year
Eq
uit
y a
s a
t 3
1.1
2.2
01
3
Changes in
reserves
Movements in equity
Ba
lan
ces
as
at
31
.12
.20
12
Ch
an
ge
s in
op
en
ing
ba
lan
ces
*) The comparison data for 2012 was modified to reflect changes following the amendment to IAS 19 "Employee benefits" and the introduction of the new IAS 19 Revised,
effective 1 January 2013. These changes resulted in an increase in the severance indemnity fund for € 821 thousand, in the related deferred tax assets for € 226
thousand and in the equity valuation reserve for € 595 thousand.

Notes to the 2013 Separate Financial Statements
64
STATEMENT OF CASH FLOWS Direct Method
OPERATING ACTIVITIES 31.12.2013 31.12.2012
1. MANAGEMENT 10.451.727 428.989
Interest received 63.183.550 93.589.921Interest paid (16.488.885) (40.167.635) Dividends and similar revenues 2.135.572 27.778 Net fee and commission income 5.662.034 9.194.046Personnel expenses (29.340.418) (37.538.983) Other costs (21.236.037) (27.389.247) Other income 5.358.776 7.026.883 Taxes paid 1.177.135 (4.313.775)
Costs/Revenue for assets held for sale net of tax effect - -
2. CASH FLOWS FROM REDUCTIONS IN FINANCIAL ASSETS 507.012.626 335.521.048
Financial assets held for trading 22.306.493 (11.916.596) Financial assets designated at fair value through profit and loss - 2.960.768 Financial assets available for sale 4.348.221 (10.143.597) Due from banks 370.891.591 424.994.731 Due from banks - others 58.979.583 (141.846.746) Loans to customers 39.395.567 118.492.441 Other assets 11.091.170 (47.019.954)
4. CASH FLOWS FROM INCREASES IN FINANCIAL LIABILITIES (515.822.503) (333.478.909)
Due to banks (245.507) (740.880) Due to banks - others (4.700.560) (5.838.056) Due to customers (335.909.822) (364.959.703) Securities issued (108.393.759) (10.390.684) Financial liabilities held for trading (27.542.583) 12.038.063 Financial liabilities designated at fair value through profit and loss (103.281) (218.125) Other liabilities (38.926.991) 36.630.477
NET CASH FLOW FROM/(USED IN) OPERATING ACTIVITIES 1.641.850 2.471.127
INVESTING ACTIVITIES
1. CASH FLOW FROM - -
Sale of equity investments - - Dividends received - - Sale/Repayment of financial assets held to maturity - - Sale of tangible assets - - Sale of intangible assets - - Sale of business units - -
2. CASH FLOW USED IN 1.641.850 2.471.127
Acquisition of equity investments - - Acquisition of financial assets held to maturity - - Acquisition of tangible assets 132.497 927.551 Acquisition of intangible assets 1.509.353 1.543.576 Acquisition of business units - -
NET CASH FLOW FROM/(USED IN) INVESTING ACTIVITIES (1.641.850) (2.471.127)
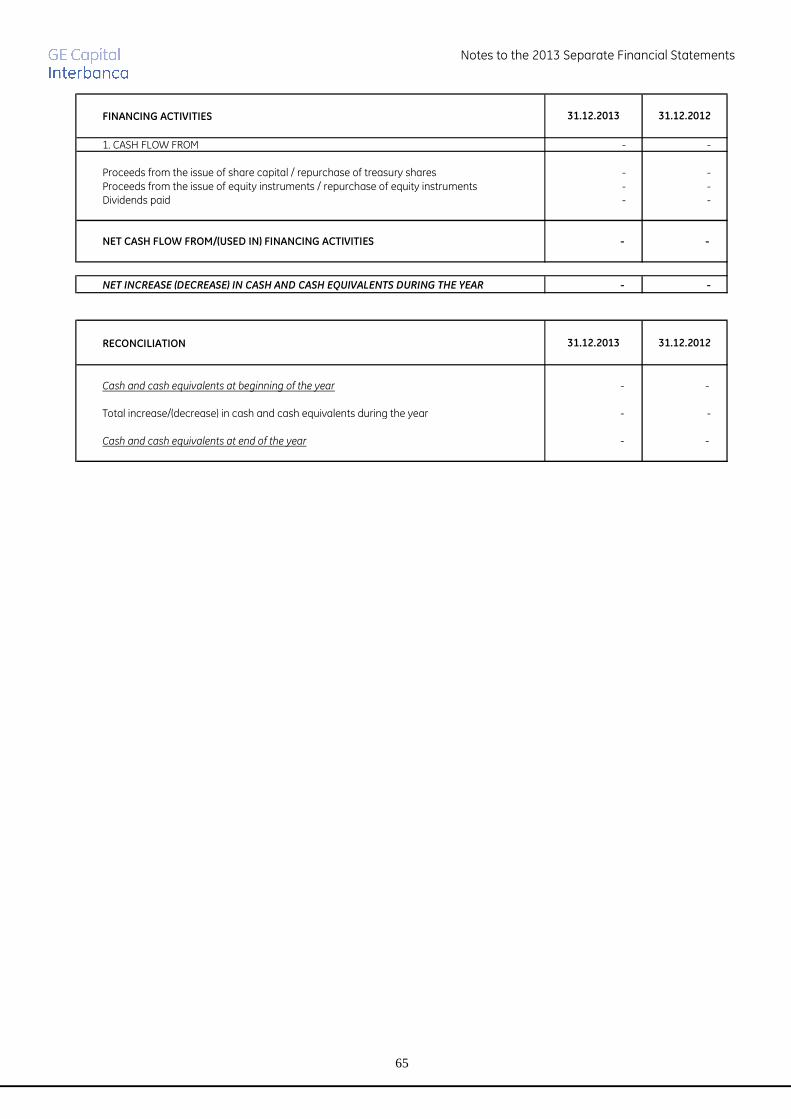
Notes to the 2013 Separate Financial Statements
65
FINANCING ACTIVITIES 31.12.2013 31.12.2012
1. CASH FLOW FROM - -
Proceeds from the issue of share capital / repurchase of treasury shares - - Proceeds from the issue of equity instruments / repurchase of equity instruments - - Dividends paid - -
NET CASH FLOW FROM/(USED IN) FINANCING ACTIVITIES - -
NET INCREASE (DECREASE) IN CASH AND CASH EQUIVALENTS DURING THE YEAR - -
RECONCILIATION 31.12.2013 31.12.2012
Cash and cash equivalents at beginning of the year - -
Total increase/(decrease) in cash and cash equivalents during the year - -
Cash and cash equivalents at end of the year - -
Notes to the 2013 Separate Financial Statements
66
(empty page)

Notes to the 2013 Separate Financial Statements
67
Notes to the Separate Financial Statements

Notes to the 2013 Separate Financial Statements
68
(empty page)

Notes to the 2013 Separate Financial Statements
69
Part A
ACCOUNTING POLICIES

Notes to the 2013 Separate Financial Statements
70
Part A. 1
Introduction
Section 1
Statement of compliance with International Financial Reporting
Standards
These financial statements as at 31 December 2013 have been prepared in accordance with the
International Financial Reporting Standards issued by the International Accounting Standards Board
(IASB) and each applicable interpretation of the International Financial Reporting Interpretation
Committee (IFRIC) contained in the text endorsed by the European Commission, as established by EU
Regulation no. 1606 of 19 July 2002.
The Financial Statements comprise the Balance Sheet, Income Statement, Statement of
Comprehensive Income, Statement of Changes in Equity, Cash Flow Statement and the Notes. The
Financial Statements are presented together with the Directors’ Report on Operations. These
financial statements have been prepared according to the instructions issued by the Bank of Italy in
its Regulation no. 262 of 22 December 2005 and subsequent updates and related temporary
provisions.
The Directors’ Report and the Notes to the Financial Statements provide all of the information
required by legal regulations, the Bank of Italy and the National Commission for Listed Companies
and the Stock Exchange (CONSOB).
The Financial Statements are audited by the independent auditors KPMG S.p.A.
Section 2
Basis of accounting These financial statements, unless otherwise stated, have been prepared in thousands of Euro and
are based on the following overall considerations set by IAS 1.
• Going concern. Assets, liabilities, and off-balance sheet transactions are valued assuming the
entity’s ability to continue as a going concern.
• Accrual basis of accounting. Costs and revenues are accrued and are recognised when they satisfy
the definitions and recognition criteria.
• Consistency of presentation. The presentation and classification of items in the financial statements
are retained from one period to the next unless a change is justified by a requirement of a new
international accounting standard (IAS/IFRS) or an interpretation (SIC) or where it is deemed
necessary to increase the relevance and reliability of the accounting presentation. In case of change,
the new criteria will be adopted retrospectively – as far as possible – providing details of the nature,
reason and amount of the affected items. The presentation and classification of the items comply
with the regulations prescribed by the Bank of Italy with regard to banks’ financial statements.
• Materiality and aggregation. In accordance with the regulations prescribed by the Bank of Italy for
banks’ financial statements, each material class of similar items is presented separately. Dissimilar items, instead, are aggregated unless they are material.

Notes to the 2013 Separate Financial Statements
71
• Offsetting is not allowed. The Group’s assets and liabilities, income and expenses are not offset
unless required or permitted by an international accounting standard (IAS/IFRS), an interpretation
(SIC) or the regulations prescribed by the Bank of Italy.
• Comparative figures. Comparative data for the previous year is provided with regard to all the
information provided in these financial statements – also qualitative information when deemed
useful for a better understanding of the Bank’s situation – unless otherwise required or permitted by
an International Accounting Standard or a related interpretation.
Section 3
Post balance sheet events Not applicable.
Part A. 2
Notes on the Principal Accounting Items
Financial assets held for trading
Classification criteria
This category includes debt and equity securities and the positive fair value of derivative contracts,
held with the intention of generating short-term profits from price changes in said instruments.
Derivative contracts include those embedded in combined financial instruments that are separately
recognised where:
� The economic characteristics and risks of the embedded derivative are not closely related to
the economic characteristics and risks of the host contract;
� A separate instrument with the same conditions as the embedded derivative would meet the
definition of a derivative;
� The (combined) hybrid instrument is not recorded among financial assets and liabilities held
for trading.
An embedded derivative financial instrument is the component of a (combined) hybrid instrument
that also includes a non-derivative host contract, with the effect that some of the cash flows of the
combined instrument vary in a manner similar to those of the stand-alone derivative.
Initial recognition and subsequent derecognition criteria
Financial assets such as debt and equity securities are initially recognised on the settlement date
whereas derivative contracts are recognised on the subscription date.
Financial assets held for trading are initially recognised at cost, deemed as the fair value of the
instrument, without considering any transaction costs or revenues directly attributable to the
instrument.

Notes to the 2013 Separate Financial Statements
72
The embedded derivative in the structured instruments not closely related to the host contract and
which meets the definition of a derivative instrument is recorded separately from the host contract
and valued at fair value, whereas the host contract is accounted for in accordance with the
requirements of the relevant IFRS.
Financial assets are derecognised when the contractual rights to the cash flows from those financial
assets expire or when the financial assets are sold, transferring substantially all the risks and benefits
of ownership.
Measurement criteria
After initial recognition, financial assets held for trading are recorded at fair value.
Fair value is determined by reference to the prices recorded in active markets1, prices provided by
market operators or internal valuation models commonly used by market participants, which take
into account all risk factors related to the instruments and are based on observable market data.
Specifically, the instruments included in this item are unlisted derivative instruments that are valued
using generally accepted valuation models populated on the basis of market parameters. In
reference to counterparty risk related to existing derivatives with Corporate counterparties, the
performing portfolio was valued using the PD and LGD parameters on which the model for collective
loan valuation was based, while the non-performing portfolio was valued on a case-by-case basis.
Financial assets available for sale
Classification criteria
Available-for-sale financial assets are those non-derivative financial assets that are designated as
available for sale or are not classified as Loans and receivables, Assets held for trading or Assets held
to maturity.
In particular, this category includes all securities that act as liquidity reserves for the Bank, securities
relating to investments in guarantee and placement syndicates, convertible notes held by the Bank
as part of its equity investment activities, shareholdings held by the Group, excluded from the trading
book and that cannot be classified as interests in subsidiaries, associates, or joint ventures, including
private equity investments, as well as shares of subscribed syndicated loans that are originally
designated as available for sale.
Initial recognition and subsequent derecognition criteria
Initial recognition of financial assets under this category occurs on the settlement date for debt
securities and equity instruments and on the disbursement date for loans.
Financial assets are initially recognised at cost, deemed as the fair value of the instrument, inclusive
of any transaction cost or revenue directly attributable to the instrument.
Financial assets are derecognised when the contractual rights to the cash flows from those financial
assets expire or when the financial assets are sold, essentially transferring all the risks and benefits
of ownership related to them.
1 A financial instrument is regarded as quoted in an active market if quoted prices are readily and regularly available from an exchange, dealer, broker, industry group, pricing service or regulatory agency and those prices represent actual and regularly occurring market transactions on an arm's length basis.

Notes to the 2013 Separate Financial Statements
73
Measurement criteria
Subsequent to initial recognition, financial assets available for sale are measured at fair value, the
interest (as per application of amortised cost) is recognised in the income statement whereas any
gain and loss arising from changes in fair value is recorded in a specific Equity reserve until the
financial asset is derecognised or an impairment loss is recorded. When the financial assets are sold
or become impaired, the cumulative gain or loss is transferred to the income statement. Equity
instruments for which fair value cannot be reliably measured according to the above guidelines are
stated at cost. The fair value of debt instruments included in this category is calculated based on market prices for
listed instruments, or, for unlisted instruments, based on the discounted contractual cash flows using
interest rates representing the credit risk of the security being valued, derived from the market.
The fair value of equity instruments included in this category is calculated, for listed instruments,
based on market prices, or, for unlisted instruments, based on commonly used valuation models with
parameters taken from the market.
At each balance sheet date or interim report date, the financial assets included in this portfolio are
assessed for indication of impairment. In the event of impairment, the loss is recognised in the
income statement as the difference between the value on initial recognition and the fair value on the
reference date.
The impairment indicators on equity instruments can be divided into two categories:
• Internal factors inherent to the company in question, and therefore, qualitative;
• External factors resulting from the business's market value (only for listed equity instruments), and
therefore quantitative.
The qualitative indicators include the following factors deemed significant: a significant variance
from budget or forecast objectives as per long-term business plans, the announcement or initiation
of restructuring plans, or insolvency or bankruptcy proceedings. Among the quantitative factors external to the company, the following are important indicators of
potential issues for equity instruments: the listing of the security under the initial recognition value by
more than 20% or for an on-going period of more than 9 months. The listing that is lower than the initial recognition value by more than 20% or for a continuous
period of more than 9 months results in the recognition of impairment. In the other cases, the
recognition of the loss in value must be corroborated also by the result of specific analysis relating to
the security and the investment. For debt instruments, objective evidence of impairment is ascribable to events following the initial
recognition that negatively affect the estimate of future cash flows of the investment.
If, in a subsequent period, the reasons for impairment cease to exist following an event occurring
after the impairment was recognised, the previously recognised impairment loss is reversed, the
reversal being recognised in the income statement in the case of loans or debt securities or under
equity in the case of equity instruments. The amount of the reversal cannot, in any case, exceed the
amortised cost the instrument would have had in the absence of said adjustments.

Notes to the 2013 Separate Financial Statements
74
Loans and receivables
Classification criteria
Loans and receivables represent loans to customers and amounts due from banks, both directly
provided and acquired from third parties, with fixed or determinable payments, that are not listed on
an active market and other than those that upon initial recognition are designated as available for
sale.
They also include trade receivables – other than those associated with payment for goods and
services provided, classified under “other assets” – repurchase agreements, receivables originating
from finance lease transactions and securities acquired by subscription or private placement, with
fixed or determinable payments, that are not listed in active markets. Loans and receivables acquired
without recourse are included under loans and receivables only upon verification that no contractual
clauses would significantly invalidate the transfer of all risks and benefits to the transferee company.
Initial recognition and subsequent derecognition criteria
Loans and receivables are initially recognised on the date they are disbursed or, in the case of debt
securities, on the settlement date, on the basis of the fair value of the financial instrument, equal to
the amount disbursed, or the subscription price, including any costs and revenues directly
attributable to the loans and determinable from the inception of the transaction, even when settled
at a later date. Costs that, even with the aforementioned characteristics, are reimbursed by the
borrower or classified as ordinary internal administrative expenses are excluded. Where the net disbursement amount differs from the fair value of the asset, as a result of the
application of a lower interest rate than the one prevailing on the market or the one commonly
applied to loans with similar features, the loan is initially recognised for an amount equal to the
present value of future cash flows using an appropriate discount rate. The difference between the
fair value and the amount disbursed or the subscription price is booked directly to the income
statement. Securities purchased under agreements to resell (reverse repurchase agreements) and securities sold
under agreements to repurchase (repurchase agreements) are generally treated as collateralised
financing transactions (funding or investment transactions). In particular, spot sales and forward
repurchases are recognised as payables for the spot amount received, while spot purchases and
forward sales are recognised as receivables for the spot amount paid. Any transferred loan is derecognised from financial statement assets only where the sale essentially
transferred all the risks and benefits related to the loans. Where, instead, all the risks and benefits
related to the loan have been retained, the latter continue to be recognised as assets in the financial
statements even if legal ownership has effectively been transferred. If it is not possible to verify
whether the risks and benefits have been essentially transferred, the loans are derecognised from
the financial statements if no control whatsoever has been retained over them. On the contrary, where even partial control is retained, loans are maintained in the financial
statements with respect to the residual involvement, at an amount determined by the exposure to
the variability in the amounts of the loans transferred and the changes in the related cash flows.
Finally, transferred loans are derecognised from the financial statements where the contractual
rights to receive the related cash flows are maintained assuming a contractual obligation to pay
such cash flows and only such cash flows, to third parties.

Notes to the 2013 Separate Financial Statements
75
Measurement criteria
After initial recognition, loans are measured at amortised cost, using the effective interest rate
method. Amortised cost is the amount at which loans are measured upon initial recognition plus or
minus any principal repayments, write-downs, write-backs and amortisation – calculated using the
effective interest rate method – of the difference between the initial amount disbursed and the
amount repayable on maturity represented by any income or charge directly attributable to the
individual loan. The effective interest rate is the rate that exactly discounts estimated future cash
flows generated by the loan, both principal and interest, to the disbursed amount including any
revenue and charges related to the loan itself. This measurement method, which follows a financial
approach, allows the allocation of the economic effect of the costs or revenues through the expected
residual life of the loan.
The estimated cash flows and contractual term of the loan take into account all the contractual
clauses that may affect the amounts and maturity dates, without, however, considering any loss
expected thereon. The effective interest rate initially recorded (original contract rate) is the rate that
is used to discount the estimated cash flows and, as a result, it determines the amortised cost after
initial recognition. The amortised cost method is not used for short-term loans whose imminent maturity implies that
the application of the discounting approach leads to immaterial effects. These loans are valued at
historical cost and income and charges related to them are recognised in the income statement on a
straight-line basis over the contractual term of the loan. A similar valuation criterion is adopted for
loans with unspecified maturity or repayable with notice period.
At every close of annual or interim financial statements, the loans are reassessed to identify those
that, following events occurring after initial recognition, show objective evidence of possible
impairment. A loan is considered impaired when it is probable that all contractual principal and interest payments
due in accordance with the terms of the original loan agreement or an equivalent amount will not be
collected.
Non-performing, sub-standard, restructured loans, and loans past due by 90 days or more are all
reviewed for impairment in accordance with the rules issued by the Bank of Italy, consistent with IAS
provisions.
Non-performing loans are assessed individually, the adjustments made to the individual loans being
equal to the difference between the carrying amount of the loan at the time of valuation (amortised
cost) and the present value of the expected future cash flows, calculated using the original effective
interest rate. The expected cash flows take into account the estimated recovery time, the estimated
realisable value of any guarantee received as well as costs that may be sustained for the recovery of
the exposure. The original effective interest rate of each loan remains unchanged over time even where a
restructuring may have given rise to a change in the contractual rate and even though the loan no
longer bears contractual interest. The write-down is recognised in the income statement. The write-downs are reversed and the amount of the loan restated to its original value if, in following
years, the circumstances that had given rise to the write-down cease to exist as long as the valuation
can be objectively related to an event occurring after the impairment was recognised. The reversal is
recognised in the income statement, however it cannot exceed the amortised cost of the instrument
if impairment loss had not occurred.
Restructuring transactions on impaired loans that include the partial or full conversion of the loans

Notes to the 2013 Separate Financial Statements
76
into equity of the borrowing company are assessed based on the fair value of the shares received in
compensation for the loan, as provided for in IFRIC 19. The fair value of these shares is assessed by
applying the same methodologies used for equity investments, based on their classification in the
financial statements.
For other renegotiation transactions, with the exception of those defined as “restructuring”
transactions, when the changes to contractual terms are substantial, the Bank derecognises the
credit position and recognises a new financial asset.
Transactions that are considered “restructured” include credit positions with customers in financial
difficulties for which the renegotiation resulted in a financial loss for the Bank. In this case, the
specific write-down is calculated based in the original interest rate.
Loans for which no individual objective evidence of impairment was assessed, that is, generally,
performing loans, including loans to counterparties in countries at risk, are collectively evaluated for
impairment. For the purposes of a collective evaluation of impairment, loans are grouped on the
basis of similar credit risk characteristics and the related loss percentages are estimated taking into
account historical loss experience, based on observable data as of the measurement date that allow
estimation of the intrinsic loss for each loan category. Impairment losses of collectively assessed
loans are recognised in the income statement. At each balance sheet date or interim report date, any additional write-downs or write-backs are
separately calculated in reference to the entire performing loan portfolio at the same date.
Hedging transactions
Recognition criteria
Hedging transactions are aimed at offsetting potential losses arising on a specific item or group of
items (hedged item) due to a specific risk, against the profits achieved on another instrument or
group of instruments (hedging instrument) in the event that specific risk actually occurs.
IAS 39 recognises the following types of hedges:
• Fair value hedge: its purpose is to hedge the exposure to changes in fair value of an asset or liability
attributable to a particular risk; • Cash flow hedge: its purpose is to hedge the exposure to variability in future cash flows attributable
to particular risks associated with assets and liabilities;
• Hedge of a net investment in a foreign currency: pertaining to the hedging of the risks of an
investment in a foreign company expressed in foreign currency.
Measurement criteria
Hedging derivatives are measured at fair value. In the case of a fair value hedge, the change in fair
value of the hedged item is offset by the change in fair value of the hedging instrument. This
offsetting is recognised by recording in the income statement the changes in fair value relating to
both the hedged item (as regards the changes attributable to the underlying risk factor) and the
hedging instrument. Any difference, which represents the partial ineffectiveness of the hedge, is the
Notes to the 2013 Separate Financial Statements
77
net economic effect. In the case of cash flow hedges, changes in fair value of the derivative, to the extent the hedge is
effective, are recognised under equity and reclassified in the income statement only when – with
reference to the item hedged – the change in the cash flows to be offset manifests.
Fair value is determined by reference to the prices recorded in active markets, as previously defined,
prices provided by market operators or internal valuation models commonly used by market
participants, which take into account all risk factors related to the instruments and are based on
observable market data such as:
• Methods based on the valuation of listed instruments with the same characteristics;
• Calculation of the present value of the cash flows generated by the instrument;
• Option pricing models.
A derivative instrument is designated as a hedging instrument if the hedging relationship between
the hedged item and the hedging instrument is formally documented and if such relationship is
highly effective at the inception of the hedge and on an ongoing basis.
The effectiveness of the hedging relationship depends on the ability of the derivative to generate
changes in fair value that offset changes in the fair value of the hedged item or the related cash
flows.
The effectiveness is assessed at each balance sheet date or interim report date using:
• Prospective testing, which justifies the application of hedge accounting as it proves its expected
effectiveness;
• Retrospective testing, which highlights the degree of hedge effectiveness achieved in the period to
which it relates. In other words, the testing measures to what extent actual results differ from the
perfect hedge.
If the hedge fails the effectiveness test, hedge accounting, according to the methods stated above, is
discontinued and the derivative is reclassified under financial instruments held for trading.
Equity investments
Classification criteria
This item includes investments in subsidiaries.
Initial recognition and subsequent derecognition criteria
Initial recognition of the financial assets in this category occurs at settlement date. Financial assets
are initially recognised at cost. Financial assets are derecognised when the contractual rights to the cash flows from those financial
assets expire or when the financial assets are sold, transferring substantially all the risks and rewards
of ownership.

Notes to the 2013 Separate Financial Statements
78
Measurement criteria
Investments in subsidiaries are valued at cost less charge-offs for impairments.
Specifically, if there is objective evidence that an equity investment is impaired, the recoverable value
of the investment is estimated taking into account the present value of the cash flows which may be
generated in the future by the investment, including the final disposal value.
Where the recoverable value of the investment is lower than its carrying amount, the difference is
recognised in the income statement.
If the reasons for impairment are removed following an event occurring after the impairment was
recognised, the previously recognised impairment loss is reversed, the reversal being recognised in
the income statement, within the limits of the previous charge-offs.
Tangible assets
Classification criteria
This item includes land, buildings used for business, investment properties, technical plants, furniture,
fittings, and sundry equipment.
Own-used buildings are buildings owned by the Group for the purpose of providing services or for
administrative purposes whereas investment property is property held to earn rental income or for
capital appreciation or both.
These are tangible assets held for use in the production or supply of goods and services, for rental to
others or for administrative purposes and which are expected to be used during more than one
period.
Initial recognition and subsequent derecognition criteria
Tangible assets are initially recognised at cost, which includes the purchase price and any cost
directly attributable to the purchase and set-up costs.
Tangible assets are derecognised from the balance sheet on disposal or when the asset is
permanently withdrawn from use and when no future economic benefits are expected from its use
or disposal.
Extraordinary maintenance expenses that give rise to an increase in future economic benefits are
added to the value of the assets whereas ordinary maintenance costs are charged directly to the
income statement.
Measurement criteria
Subsequent to initial recognition, tangible fixed assets, including buildings not used for business
purposes, are carried at cost less accumulated depreciation and any impairment loss. They are
systematically depreciated over their estimated useful life, on a straight-line basis, excluding land. Land purchased vacant or with buildings has an indefinite useful life and is therefore not
depreciated. If the value of the land is incorporated in the value of the building erected thereon, then,
by virtue of the application of the components approach, it is considered as an asset separate from
the buildings. With regard to fully owned buildings and where the ownership percentage is deemed
significant, the allocation of the total value between the land and the buildings is made on the basis

Notes to the 2013 Separate Financial Statements
79
of an evaluation made by an expert appraiser. At each balance sheet date or interim report date, where there is objective evidence that an asset
may be impaired, its carrying value is compared to its recoverable value, equal to the higher of fair
value less costs to sell, and its value in use, that is, the present value of future cash flows expected to
be derived from the asset. Impairment losses are recognised in the income statement. If and when
the circumstances that gave rise to the impairment cease to exist, a recovery value is recorded,
which, however, cannot exceed the value that the asset would have had, net of depreciation,
determined in the absence of previous impairments.
Intangible assets
Classification criteria
Intangible assets are recorded as balance sheet assets only if:
• They are identifiable;
• They are controlled by the entity;
• It is probable that the expected future economic benefits that are attributable to the asset will flow
to the entity;
• The cost of the asset can be reliably measured.
Intangible assets include applications software that will be used over the long-term.
Other assets are recorded as intangible assets if they are identifiable and arise from contractual or
other legal rights.
Initial recognition and subsequent derecognition criteria Intangible assets are stated at cost, as adjusted by any incidental charge, only if it is probable that
the future economic benefits attributable to the assets will flow from the assets and if their cost can
be measured reliably. If that is not the case, the cost of the intangible asset is recognised in the
income statement for the year in which it was incurred. Intangible assets are derecognised from the balance sheet on disposal and if no future economic
benefits are expected from the assets.
Measurement criteria
The cost of intangible assets with defined useful lives is amortised on a straight-line basis over the
expected useful life of the asset. Where the expected useful life is indefinite, then the assets are not
amortised but are systematically tested for impairment. At each balance sheet date, where an indication of impairment exists, the company estimates the
recoverable amount of the assets in question. The impairment loss, recognised in the income
statement, is equal to the difference between the carrying value of the asset and its recoverable
amount.
Notes to the 2013 Separate Financial Statements
80
Current and deferred tax
Income taxes are calculated in accordance with tax regulations currently in force. Tax expense is the
aggregate amount included in the determination of profit and loss for the period in respect of current
tax and deferred tax. Income taxes are recorded in the income statement with the exception of those relating to items that
are directly debited or credited to equity. Income tax provisions are calculated based on a prudent estimate of the current tax charges,
deferred tax assets and deferred tax liabilities. Deferred tax assets and deferred tax liabilities are calculated taking into account the temporary
differences between the carrying amount of an asset or liability pursuant to the Italian Civil Code
criteria and their tax base, with no time limitation.
Deferred tax assets represent the amounts of income taxes recoverable in future periods in respect
of:
• Deductible temporary differences;
• The carry-forward of unused tax losses;
• The carry-forward of unused tax credits.
Deferred tax liabilities represent the amounts of income taxes payable in future periods in respect of
taxable temporary differences. Deferred tax assets and liabilities are systematically assessed based on their expected recoverability.
These estimates are made considering any changes in tax rates or regulations as well as any
changes in the Bank’s tax status, including agreements to participate in the National Tax
Consolidation scheme.
Effects of tax consolidation The tax consolidation agreements, effective in Italy beginning in 2011 for companies participating in
the consolidation scheme, envisage, among other items, that any tax losses brought to the tax
consolidation by individual companies are not remunerated to said companies by the consolidating
body. Similarly, the agreements provide that taxes due for any taxable income produced by the individual
entities making up the tax consolidation are paid only if, and to the extent that, the taxes are
effectively paid to the tax authorities by the consolidating body, based on the tax consolidation.
IAS 12 does not govern the accounting methods for the effects of the tax consolidation on the
individual financial statements of either the consolidating body or the companies included in the
consolidation. Taking into account the specific provisions envisaged in the tax consolidation
agreements referenced above, among the accounting models that were deemed applicable in such
circumstances based on prevailing professional opinions and considering statutory regulations, the
Group defined the following methodology for the accounting representation of the IRES effects of the
tax consolidation for individual financial statements:
• Each entity will recognise its tax burden accrued for the year in the income taxes item, in current
taxes if there is taxable income or in deferred taxes in the event of tax losses, in application of IAS 12;
• These effects are corrected directly in the income statements in the same tax item (current or
deferred) in the same year and in the amount that would result in no financial settlement between

Notes to the 2013 Separate Financial Statements
81
the entities and the Group as a result of the tax consolidation agreements;
• The detailed transactions for accrued taxes will include separate information on its impact on the
effective taxes for each individual entity that is attributable to the national tax consolidation scheme;
• Unused tax losses that each year should be definitively transferred from the subsidiaries to the tax
consolidating body will be included in the estimate of recoverability for the financial statements of
the consolidating body.
Allowances for risks and charges
Classification criteria
This item includes provisions for actual obligations arising as a result of a past event, the settlement
of which is certain or highly probable, but in respect of which uncertainties exist about the timing or
amount required in settlement.
Recognition criteria
A provision is recognised if it meets the following criteria:
• A legal obligation (actual or implicit) exists as a result of a past event;
• It is probable that an outflow of resources embodying economic benefits will be required to settle
the obligation;
• A reasonable estimate can be made of the amount of the obligation.
In the event the time factor is significant, the provisions are discounted using discount rates that
reflect current market rates. The effect of discounting is recognised in the income statement.
Liabilities, securities issued
Classification criteria
Due to banks, Due to customers, Securities issued and Subordinated loans encompass the various
types of interbank funding and deposits from customers as well as the funding through certificates of
deposit and debt securities in issue, less any amount repurchased.
Initial recognition and subsequent derecognition criteria
Initial recognition of such financial liabilities occurs at the time of collection of the sums deposited or
on the issue of debt securities.
Initial recognition is based on the fair value of the liabilities, normally equal to the amount collected
or the issue price, increased by any income or charge directly attributable to each deposit or issue
transaction and not reimbursed by the funding counterpart. Internal administrative expenses are
excluded. Financial liabilities are derecognised from the financial statements when the relevant obligation has
expired or been extinguished. Derecognition also occurs for repurchase of previously issued
securities. The difference between the carrying amount of the liability and the amount paid to
repurchase the liability is recognised in the income statement. Own securities placed on the market

Notes to the 2013 Separate Financial Statements
82
subsequent to their repurchase are treated as a new issue recognised at the new placement price
with no impact on the income statement.
Measurement criteria
Subsequent to initial recognition, financial liabilities are carried at amortised cost using the effective
interest rate method. An exception is made for short-term liabilities, where the time is irrelevant. These are stated at the
amount collected and related costs, if any, are recognised in the income statement on a straight-line
basis over the contractual term of the liability.
Financial liabilities held for trading This item includes the negative value of derivative contracts held for trading, valued at fair value, of
implicit contracts in other financial instruments. It also includes other liabilities, designated at fair
value, which originate from uncovered short positions generated by security trading activities.
The measurement, recognition and derecognition criteria are equivalent to those for financial assets
held for trading.
Foreign currency transactions
Recognition criteria
Foreign currency transactions are initially recognised in the functional currency, by applying the spot
exchange rate on the transaction date to the foreign currency amount.
Measurement criteria
At each balance sheet date or interim report date, financial statement items denominated in foreign
currency are translated as follows:
• Monetary amounts are translated using the closing rate;
• Non-monetary items that are measured in terms of historical cost are translated using the
exchange rate at the date of the transaction;
• Non-monetary items that are measured at fair value are translated using the exchange rate on the
closing date.
Exchange differences arising on the settlement of monetary items or on translating monetary items
at rates different from those at which they were translated on initial recognition or in previous
financial statements are recognised in the income statement relating the period in which they arise.
When a gain or loss on a non-monetary item is recognised directly under equity, any exchange
component of that gain or loss is also recognised under equity. Conversely, when a gain or loss on a
non-monetary item is recognised in the income statement, any exchange component of that gain or
loss is also recognised in the income statement.
Notes to the 2013 Separate Financial Statements
83
Leasehold improvements Leasehold improvements are capitalised in consideration of the fact that the company enjoying the
use of the premises has control over the assets and the future economic benefits generated by it
over the entire term of the lease. Leasehold improvements are amortised for a period not exceeding
the term of the lease.
Severance indemnity fund The severance indemnity fund is initially recognised based on its actuarial value. For the purposes of
defining actuarial value, the Projected Unit Credit Method is used, which involves the estimate of future
payments based on historical statistical analyses, the demographic curve and the present value of
those cash flows using a market interest rate. The contributions paid in each financial year are
considered as separate units, separately measured and recorded to build up the final post-employment
benefit obligation. The current service costs of the plan are accounted for under personnel expenses as
the net amount of contributions paid, contributions of prior years not yet recorded, accrued interest
cost, expected return on plan assets, and actuarial gains and losses. With Regulation no. 475/2012, the
European Commission endorsed, among other things, the new version of IAS 19, which has the objective
of enhancing the clarity and comparability of financial statements, particularly in reference to defined
benefits plans. Effective 1 January 2013, the "corridor method" was abolished, which had an impact on the Bank's
equity as at the date of first application of the new standard, for an amount equivalent to the actuarial
losses not recognised in applying the “corridor method”. This change in the standard resulted in a
reduction in valuation reserves under equity for € 595,458 as at 31 December 2013.
Following the reform of supplementary social security as per Italian Legislative Decree no. 252/2005,
supplemented by the innovations made by the 2007 Finance Law and its subsequent implementing
decrees:
• severance indemnities accrued as at 31 December 2006 remain with the company and continue to
be considered a “defined benefit plan”: The obligation for the benefits accrued by the employees is
valued by means of use of actuarial techniques;
• severance indemnities under accrual as at 1 January 2007 are considered a “defined contribution
plan” irrespective of allocation by employee to supplementary social security, or to the Treasury
allowance at INPS. The obligation is determined by the amounts to be contributed for each period.
Also, other employee benefits such as seniority bonuses and pension fund contributions, provided for
by IAS 19, are recorded as liabilities by estimating the single amount to be paid to each employee
using actuarial calculation methods.
Stock options Stock option plans on shares in the Parent Company General Electric Company, which are currently
assigned to some of the Bank’s employees, are regulated on the balance sheet of the Parent
Company.
Charges related to said plans are calculated based on the fair value of the options at the balance
sheet date, allocated across the vesting period.

Notes to the 2013 Separate Financial Statements
84
Dividends and revenue recognition Revenues are recognised when received or at least when it is probable that future benefits will be
received and that such benefits can be measured reliably. In particular:
• Default interest, if provided for in the terms of the contract, is recognised in the income statement
only when actually collected;
• Dividends are recognised in the income statement when the right to receive payment is
established;
• Revenues generated through brokerage of traded financial instruments, calculated as the
difference between the transaction price and the fair value of the instruments, are recognised in the
income statement when the transaction is recorded if the fair value can be determined by reference
to recent parameters or transactions observable on the same market where the instrument is
traded. Income related to financial instruments for which the above measurement is not possible is
recognised in the income statement over the entire duration of the transaction.
Notes to the 2013 Separate Financial Statements
85
Part A. 3 Disclosure on Transfers between Financial Asset Portfolios No transfers were carried out in 2013. Part A. 4 Fair Value Disclosure
Qualitative disclosure
This section contains the fair value disclosure as required by IFRS 13 “Fair Value Measurement”, a new
accounting standard that became effective 1 January 2013, in combination with IAS 34 and IFRS 7.
Fair value is the amount that would be received from the sale of an asset, or paid to transfer a liability, in
an ordinary transaction between counterparties in the primary market at the measurement date (exit
price).
The fair value of a financial liability that is payable (for example, a demand deposit) cannot be less than
the amount payable upon request, discounted to the first date on which payment could be requested.
In the case of financial instruments listed in active markets, the fair value is determined from the official
listing on the primary (or most advantageous) market to which the Company has access (Mark to
Market).
A financial instrument is considered to be listed in an active market if the listed prices are readily and
regularly available through a price list, dealer, broker, price-calculating agency or regulatory authority
and these prices represent effective market transactions that take place under normal market
conditions. If there is no official listing on an active market for a financial instrument as a whole, but
there are active markets for the components that make up the instrument, the fair value is based on the
relevant market prices for the components.
If there are no market listings or other observable input, such as the listed price of an identical asset in a
non-active market, alternative valuation models are used, such as:
• Market valuation method: use of market listings for similar liability or equity instruments held as assets
by other parties in the market;
• Cost method: the cost that would be required to replace the service capacity of an asset;
• Profit method: discounted valuation technique based on expected future cash flows by a market
counterparty that holds a liability or equity instrument as an asset.
The valuation methods (Mark to Model) are used only in line with generally accepted market practices.
Valuation models include techniques based on discounting expected future cash flows and an estimate
of volatility and are subject to revision both during their development and periodically afterwards, in
order to ensure they are fully consistent with the valuation objectives.
These methodologies use input based on prices observed in recent transactions of the instrument being
valued and/or prices/listings of instruments with similar characteristics in terms of risk profile.
The prices/listings are relevant for determining the most important parameters, in terms of credit risk,
liquidity risk, price risk and other relevant risks, for the instrument being valued.
Notes to the 2013 Separate Financial Statements
86
The reference to the market for these parameters reduces the discretion in the valuation, ensuring at
the same time that the resulting fair value can be verified.
A.4.1. Fair Value Levels 2 and 3: Valuation techniques and input used
Valuation techniques are used to value positions for which market sources do not provide a market
price. GE Capital Interbanca uses valuation techniques that are widely used in the market for calculating
the fair value of financial instruments and other instruments that are not listed and actively exchanged.
The valuation techniques used for Level 2 assets and liabilities are described below.
Discounted cash flows
Valuation techniques based on discounted cash flows generally consist of calculating an estimate of
expected future cash flows throughout the life of the instrument. The model requires the cash flow
estimate and the adoption of market parameters for discounting: the discount rate or margin reflects
the credit and/or financing spread required by the market for instruments with similar risk and liquidity
profiles, in order to define a “discounted value”. The fair value of the contract is the sum of the
discounted future cash flows.
Option pricing model
Option pricing model techniques are generally used for instruments in which the holder has a
contingent right or obligation based on the occurrence of a future event, such as the price of a
reference asset surpassing a pre-determined strike price.
Option models estimate the probability that a specific event will occur by incorporating assumptions
such as the volatility of the estimates, the price of the underlying instrument and the expected return
rate.
Market approach
This valuation technique uses prices generated by market transactions that involve assets, liabilities or
groups of assets and liabilities that are identical or similar.
The Bank has no Level 3 financial assets or liabilities.
A.4.2 Valuation processes and sensitivity For processes, refer to Part E - Section 2 Market Risks. The Bank has no Level 3 financial assets or liabilities and related input that cannot be readily observed.
A.4.3 Fair value hierarchy IFRS 13 classifies the level of observability of input used for pricing.
Specifically, three levels are envisaged:
• Level 1: the fair value of instruments classified in this level is calculated based on listed prices
observed in active markets;
• Level 2: the fair value of instruments classified in this level is calculated based on valuation models
that use observable input from active markets;
• Level 3: the fair value of instruments classified in this level is calculated based on valuation models
that primarily use meaningful input that is not observable in active market;
There were no transfers between the various levels of the fair value hierarchy.

Notes to the 2013 Separate Financial Statements
87
A.4.4 Additional information Financial assets and liabilities at fair value
Information required by IFRS 13 regarding portfolios valued at fair value on a recurring basis is provided
below.
Fixed-income bonds
Fixed-income bonds are valued through two main processes based on the liquidity of the reference
market. Liquid instruments in active markets are valued at market price (Mark to Market) and, as a
result, these instruments are classified as Level 1 in the fair value hierarchy.
Instruments that are not exchanged in active markets are valued at Mark to Model, using the implicit
curves for the credit spread relative to the issuer’s rating and business sector. The model maximises the
use of observable parameters and minimises the use of non-observable parameters.
Equity securities
Equity securities are classified as Level 1 when a market listing is available and at Level 2 or 3 based on
the extent to which the input used in the valuation is observable, when there are no listings or the
listings have been suspended for an undetermined period. In this case, the valuations are conducted
with a Market Approach through the application of the market multiples model inferred from observable
comparable data and using the DCF control method.
For equity instruments valued at cost, an impairment is recognised if the carrying amount is greater
than the current value of future cash flows by a significant amount and/or over a significant period of
time.
Derivatives
The relevant input for valuation techniques used is primarily based on methodologies of net present
value of future cash flows, and is observable or derived from observable data. Consequently, the
instruments are classified as Level 2.
Financial assets and liabilities not measured at fair value for which fair value is provided for disclosure Financial instruments not measured at fair value, for example loans to customers and deposits, are not
accounted for based on fair value. For these instruments, the fair value is calculated solely for disclosure
purposes and does not have an impact on the income statement and balance sheet figures. In addition,
as these instruments are not generally exchanged, the calculation of fair value includes management
assumptions with respect to the relevant variables.
Due from banks
Due from banks includes the balance of demand deposits and deposits held as collateral for syndicated
loans (IBLOR). With regards to demand deposits, the carrying amount can be considered a satisfactory
proxy of the fair value. The fair value of IBLOR deposits is calculated with the same methodology used for loans to customers,
described below.

Notes to the 2013 Separate Financial Statements
88
Loans to customers
The fair value of due from banks and loans to customers, recognised at amortised cost, is calculated
using the discounted cash flow model that includes the best estimate of the elements necessary to
reflect current market conditions.
Cash flows include principal payments, interest payments and all other costs, and depend on the
contractual conditions and market conditions (see interest rates).
The discount rate includes the risk-free rate, which represents the interest rate that the market would
require for investments with zero risk of a certain duration, and the credit spread (CS), which represents
the additional return that a market participant would require for an investment with a given level of risk.
The CS for unlisted products cannot be derived from observable market prices and is therefore
estimated based on specific counterparty and/or transaction factors.
Non-performing loans
In reference to non-performing loans, the carrying amount can be considered a satisfactory proxy for
the fair value in that the current value already incorporates the best estimates of expected recoveries
discounted to present value, based on interest rates, recovery curves and funding and operating costs.
Liabilities - subordinated loan
The fair value of this type of liability, recognised at amortised cost, is calculated using a DCF model, just
as with loans and receivables, with a discount rate that includes the risk-free rate, which represents the
interest rate the market would require for risk-free investments of a certain duration, and a spread
similar to the rate that expresses the cost of the funding for a similar duration.
Liabilities – revolving loans
Revolving loan lines can be drawn on a continual basis and is not pre-determined. For the fair value of
this liability, recognised at amortised cost, the carrying amount can be considered a satisfactory proxy
of fair value.
Securities issued
For debt securities issued by the Bank measured at amortised cost that are listed on an active market,
the fair value is determined using the market price of the securities. For unlisted securities, the fair value
is calculated using a DCF model. The fair value of structured financial products is calculated using the
appropriate valuation method based on the nature of the incorporated structure.
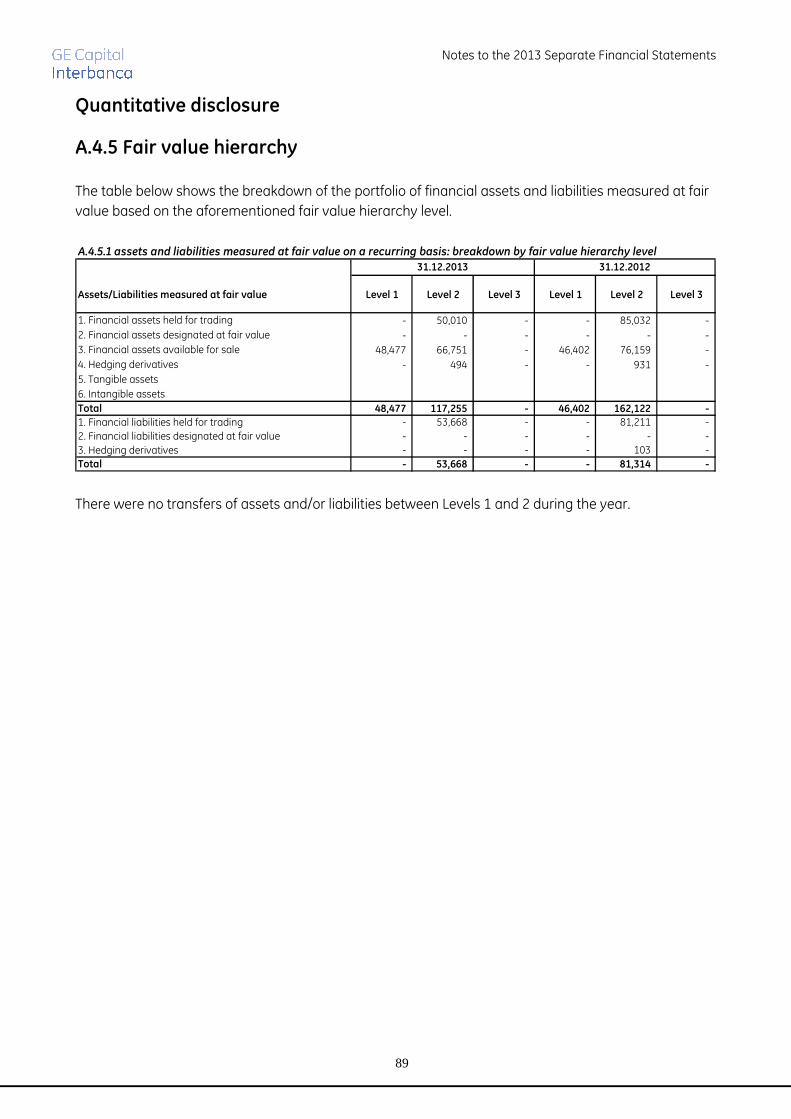
Notes to the 2013 Separate Financial Statements
89
Quantitative disclosure
A.4.5 Fair value hierarchy The table below shows the breakdown of the portfolio of financial assets and liabilities measured at fair
value based on the aforementioned fair value hierarchy level.
Assets/Liabilities measured at fair value Level 1 Level 2 Level 3 Level 1 Level 2 Level 3
1. Financial assets held for trading - 50,010 - - 85,032 -
2. Financial assets designated at fair value - - - - - -
3. Financial assets available for sale 48,477 66,751 - 46,402 76,159 -
4. Hedging derivatives - 494 - - 931 -
5. Tangible assets
6. Intangible assets
Total 48,477 117,255 - 46,402 162,122 -
1. Financial liabilities held for trading - 53,668 - - 81,211 -
2. Financial liabilities designated at fair value - - - - - -
3. Hedging derivatives - - - - 103 -
Total - 53,668 - - 81,314 -
A.4.5.1 assets and liabilities measured at fair value on a recurring basis: breakdown by fair value hierarchy level
31.12.201231.12.2013
There were no transfers of assets and/or liabilities between Levels 1 and 2 during the year.
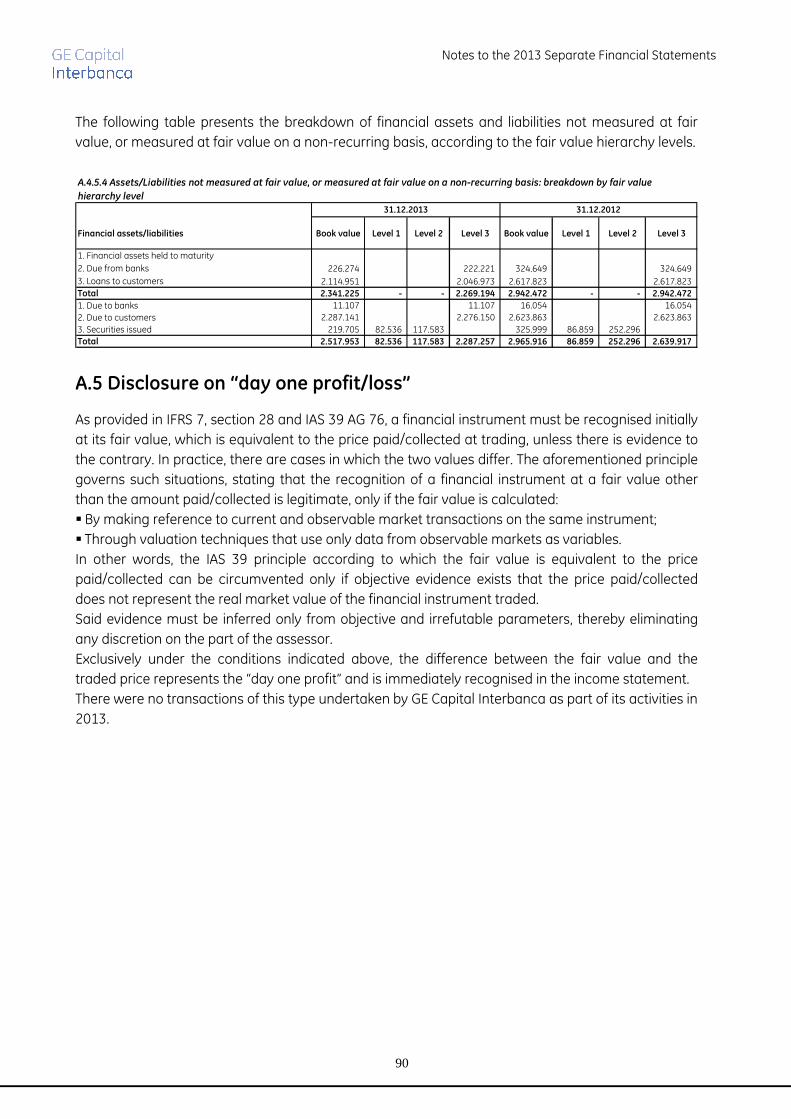
Notes to the 2013 Separate Financial Statements
90
The following table presents the breakdown of financial assets and liabilities not measured at fair
value, or measured at fair value on a non-recurring basis, according to the fair value hierarchy levels.
Financial assets/liabilities Book value Level 1 Level 2 Level 3 Book value Level 1 Level 2 Level 3
1. Financial assets held to maturity
2. Due from banks 226.274 222.221 324.649 324.649
3. Loans to customers 2.114.951 2.046.973 2.617.823 2.617.823
Total 2.341.225 - - 2.269.194 2.942.472 - - 2.942.472
1. Due to banks 11.107 11.107 16.054 16.054
2. Due to customers 2.287.141 2.276.150 2.623.863 2.623.863
3. Securities issued 219.705 82.536 117.583 325.999 86.859 252.296
Total 2.517.953 82.536 117.583 2.287.257 2.965.916 86.859 252.296 2.639.917
31.12.2013 31.12.2012
A.4.5.4 Assets/Liabilities not measured at fair value, or measured at fair value on a non-recurring basis: breakdown by fair value
hierarchy level
A.5 Disclosure on “day one profit/loss”
As provided in IFRS 7, section 28 and IAS 39 AG 76, a financial instrument must be recognised initially
at its fair value, which is equivalent to the price paid/collected at trading, unless there is evidence to
the contrary. In practice, there are cases in which the two values differ. The aforementioned principle
governs such situations, stating that the recognition of a financial instrument at a fair value other
than the amount paid/collected is legitimate, only if the fair value is calculated: � By making reference to current and observable market transactions on the same instrument;
� Through valuation techniques that use only data from observable markets as variables.
In other words, the IAS 39 principle according to which the fair value is equivalent to the price
paid/collected can be circumvented only if objective evidence exists that the price paid/collected
does not represent the real market value of the financial instrument traded.
Said evidence must be inferred only from objective and irrefutable parameters, thereby eliminating
any discretion on the part of the assessor.
Exclusively under the conditions indicated above, the difference between the fair value and the
traded price represents the “day one profit” and is immediately recognised in the income statement.
There were no transactions of this type undertaken by GE Capital Interbanca as part of its activities in
2013.
Notes to the 2013 Separate Financial Statements
91
Part B
INFORMATION ON THE BALANCE SHEET
ASSETS

Notes to the 2013 Separate Financial Statements
92
Section 2
Financial assets held for trading – Item 20
Level 1 Level 2 Level 3 Level 1 Level 2 Level 3
A. Financial assets
1. Debt securities - - - - - - 1.1 structured - - - - - - 1.2 other - - - - - - 2. Equities - - - - - - 3. Investment Fund Units - - - - - - 4. Loans - - - - - - 4.1 repurchase agreements - - - - - - 4.2 other - - - - - -
Total A - - - - - -
B. Derivatives
1. Financial derivatives: - 50,010 - - 85,032 - 1.1 trading - 50,010 - - 85,032 - 1.2 under the fair value option - - - - - - 1.3 other - - - - - - 2. Credit derivatives: - - - - - - 2.1 trading - - - - - - 2.2 under the fair value option - - - - - - 2.3 other - - - - - -
Total B - 50,010 - - 85,032 -
Total (A+B) - 50,010 - - 85,032 -
2.1 Financial assets held for trading: breakdown
Item/Amount31.12.2013 31.12.2012
The decrease in this item is the result of the change in fair value of the outstanding positions, as
there were no new transactions posted during the year.
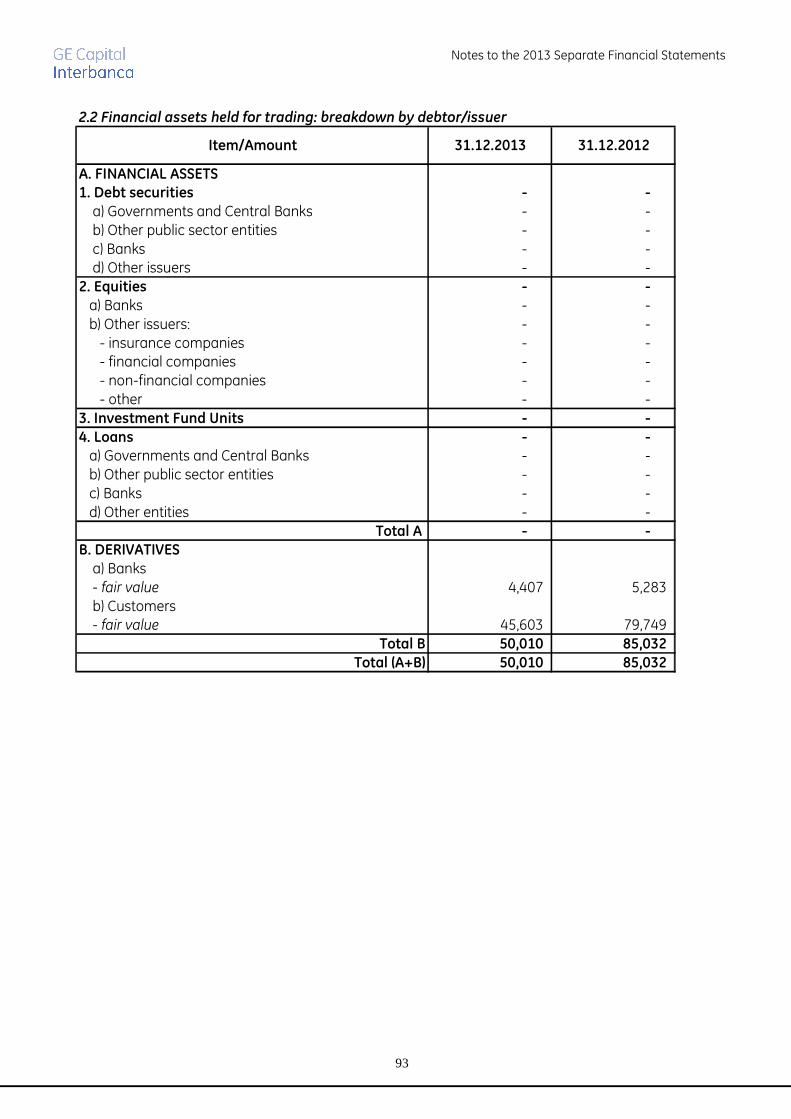
Notes to the 2013 Separate Financial Statements
93
A. FINANCIAL ASSETS
1. Debt securities - -
a) Governments and Central Banks - - b) Other public sector entities - - c) Banks - - d) Other issuers - - 2. Equities - -
a) Banks - - b) Other issuers: - - - insurance companies - - - financial companies - - - non-financial companies - - - other - - 3. Investment Fund Units - -
4. Loans - -
a) Governments and Central Banks - - b) Other public sector entities - - c) Banks - - d) Other entities - -
Total A - -
B. DERIVATIVES
a) Banks - fair value 4,407 5,283 b) Customers - fair value 45,603 79,749
Total B 50,010 85,032
Total (A+B) 50,010 85,032
Item/Amount 31.12.2013 31.12.2012
2.2 Financial assets held for trading: breakdown by debtor/issuer
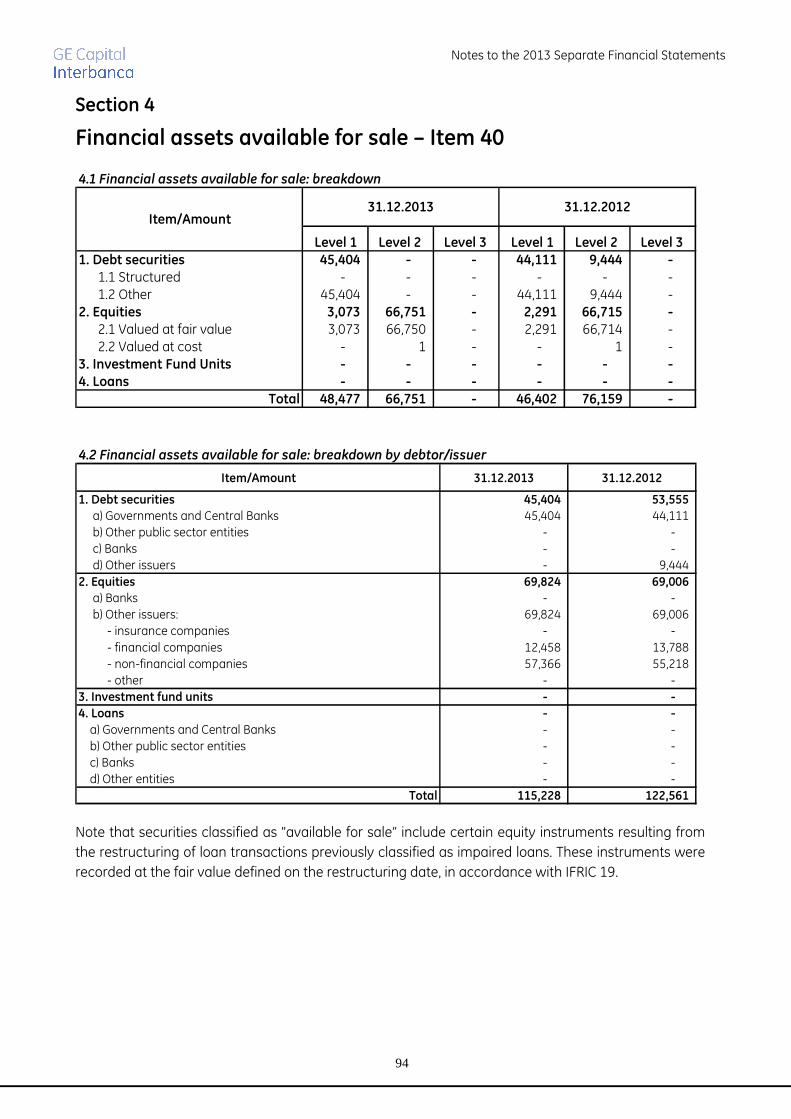
Notes to the 2013 Separate Financial Statements
94
Section 4
Financial assets available for sale – Item 40 4.1 Financial assets available for sale: breakdown
Level 1 Level 2 Level 3 Level 1 Level 2 Level 3
1. Debt securities 45,404 - - 44,111 9,444 -
1.1 Structured - - - - - - 1.2 Other 45,404 - - 44,111 9,444 - 2. Equities 3,073 66,751 - 2,291 66,715 -
2.1 Valued at fair value 3,073 66,750 - 2,291 66,714 - 2.2 Valued at cost - 1 - - 1 - 3. Investment Fund Units - - - - - -
4. Loans - - - - - -
Total 48,477 66,751 - 46,402 76,159 -
Item/Amount31.12.2013 31.12.2012
Item/Amount 31.12.2013 31.12.2012
1. Debt securities 45,404 53,555
a) Governments and Central Banks 45,404 44,111
b) Other public sector entities - -
c) Banks - -
d) Other issuers - 9,444
2. Equities 69,824 69,006
a) Banks - -
b) Other issuers: 69,824 69,006
- insurance companies - -
- financial companies 12,458 13,788
- non-financial companies 57,366 55,218
- other - -
3. Investment fund units - -
4. Loans - -
a) Governments and Central Banks - -
b) Other public sector entities - -
c) Banks - -
d) Other entities - -
Total 115,228 122,561
4.2 Financial assets available for sale: breakdown by debtor/issuer
Note that securities classified as "available for sale” include certain equity instruments resulting from
the restructuring of loan transactions previously classified as impaired loans. These instruments were
recorded at the fair value defined on the restructuring date, in accordance with IFRIC 19.
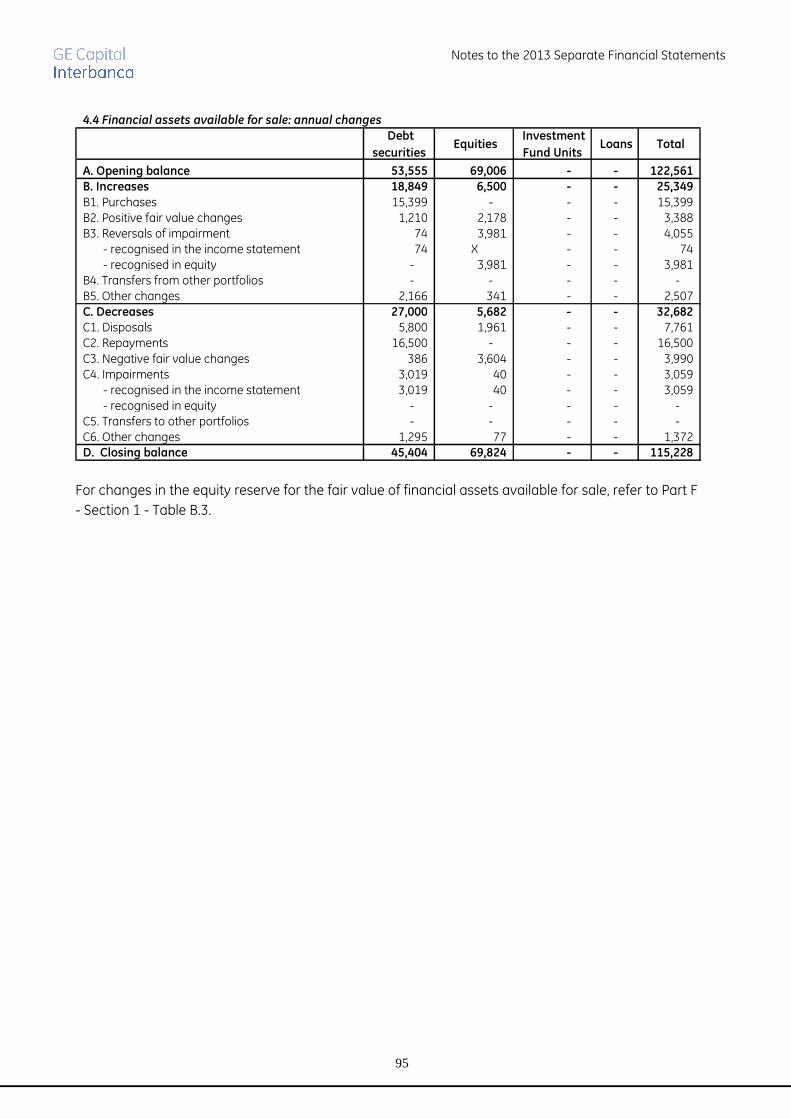
Notes to the 2013 Separate Financial Statements
95
Debt
securities Equities
Investment
Fund Units Loans Total
A. Opening balance 53,555 69,006 - - 122,561
B. Increases 18,849 6,500 - - 25,349
B1. Purchases 15,399 - - - 15,399 B2. Positive fair value changes 1,210 2,178 - - 3,388 B3. Reversals of impairment 74 3,981 - - 4,055 - recognised in the income statement 74 X - - 74 - recognised in equity - 3,981 - - 3,981 B4. Transfers from other portfolios - - - - - B5. Other changes 2,166 341 - - 2,507 C. Decreases 27,000 5,682 - - 32,682
C1. Disposals 5,800 1,961 - - 7,761 C2. Repayments 16,500 - - - 16,500 C3. Negative fair value changes 386 3,604 - - 3,990 C4. Impairments 3,019 40 - - 3,059 - recognised in the income statement 3,019 40 - - 3,059 - recognised in equity - - - - - C5. Transfers to other portfolios - - - - - C6. Other changes 1,295 77 - - 1,372 D. Closing balance 45,404 69,824 - - 115,228
4.4 Financial assets available for sale: annual changes
For changes in the equity reserve for the fair value of financial assets available for sale, refer to Part F
- Section 1 - Table B.3.
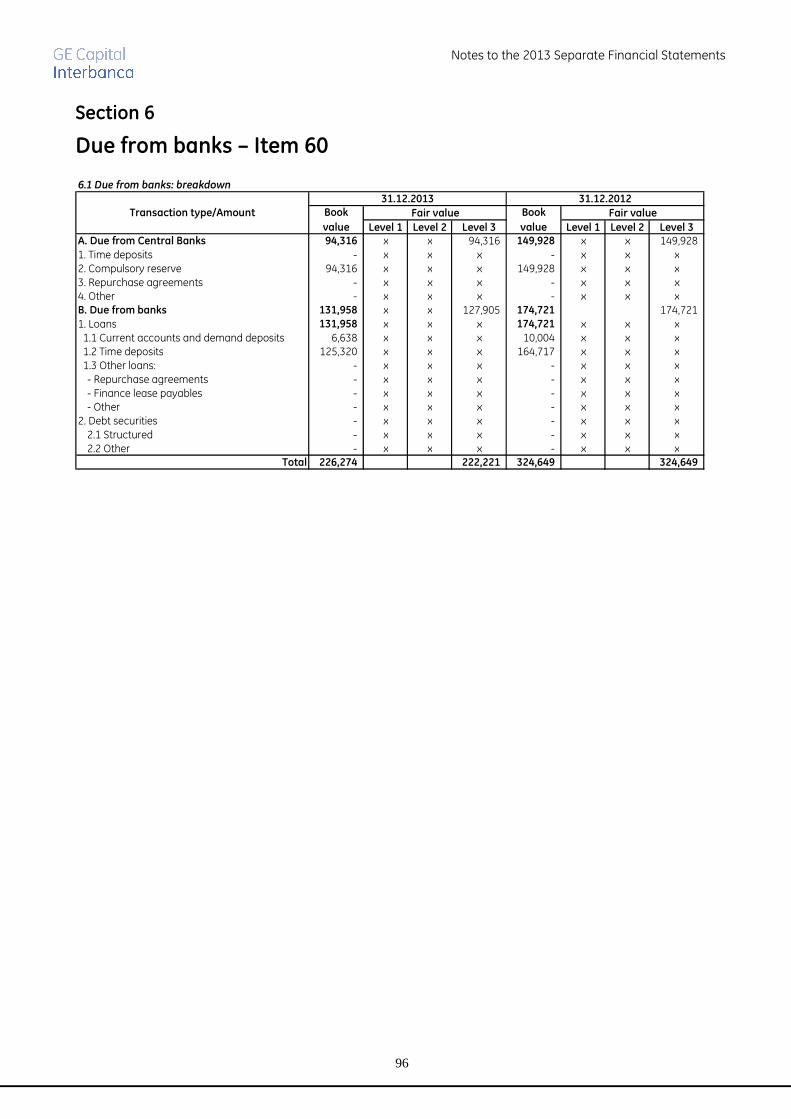
Notes to the 2013 Separate Financial Statements
96
Section 6
Due from banks – Item 60
Level 1 Level 2 Level 3 Level 1 Level 2 Level 3A. Due from Central Banks 94,316 x x 94,316 149,928 x x 149,928 1. Time deposits - x x x - x x x2. Compulsory reserve 94,316 x x x 149,928 x x x3. Repurchase agreements - x x x - x x x4. Other - x x x - x x xB. Due from banks 131,958 x x 127,905 174,721 174,721 1. Loans 131,958 x x x 174,721 x x x 1.1 Current accounts and demand deposits 6,638 x x x 10,004 x x x 1.2 Time deposits 125,320 x x x 164,717 x x x 1.3 Other loans: - x x x - x x x
- Repurchase agreements - x x x - x x x- Finance lease payables - x x x - x x x- Other - x x x - x x x
2. Debt securities - x x x - x x x2.1 Structured - x x x - x x x2.2 Other - x x x - x x x
Total 226,274 222,221 324,649 324,649
6.1 Due from banks: breakdown
Transaction type/Amount
31.12.2013
Book
value
Fair value
31.12.2012
Book
value
Fair value

Notes to the 2013 Separate Financial Statements
97
Section 7 Loans to customers – Item 70
Purchased Others Purchased Others
Loans 1,558,205 - 544,829 2,035,441 2,088,663 - 517,213 x x 2,605,876 1. Current accounts - - x x x - - x x x2. Repurchase agreements - - x x x - - x x x3. Mortgages 1,555,272 - 544,829 x x x 2,088,333 - 517,213 x x x
4. Credit card loans and personal loans, inc. loans guaranteed by salary
99 - x x x
219 - x x x
5. Finance leases - - x x x - - x x x6. Factoring - - x x x - - x x x7. Other transactions 2,834 - x x x 111 - x x xDebt securities 11,917 - - 11,532 11,947 - 11,947
8 Structured - - x x x - - x x x9 Other 11,917 - x x x 11,947 - x x x
Total 1,570,122 - 544,829 2,046,973 2,100,610 - 517,213 2,617,823
Impaired
L1
7.1 Loans to customers: breakdown
Performing
Impaired
L1 L2 L3 L2 L3
31.12.2013
Book value Fair value
Transaction type/Amount
31.12.2012
Book value Fair value
Performing
7.2 Loans to customers: breakdown by debtor/issuer
Purchased Others Purchased Others
1. Debt securities: 11,917 - - 11,947 - -
a) Governments - - - - - - b) Other public sector entities - - - - - - c) Other issuers 11,917 - - 11,947 - -
- non-financial companies 11,917 - - 11,947 - - - other financial companies - - - - - - - insurance companies - - - - - -
- other - - - - - -
2. Loans to: 1,558,205 - 544,829 2,088,663 - 517,213
a) Governments 5,420 - - 6,834 - -
b) Other public sector entities 16 - - 112 - - c) Other entities 1,552,769 - 544,829 2,081,717 - 517,213
- non-financial companies 1,407,513 - 531,082 1,879,445 - 499,903
- other financial companies 122,618 - 12,382 181,803 - 16,163 - insurance companies - - - - - - - other 22,638 - 1,365 20,469 - 1,147
Total 1,570,122 - 544,829 2,100,610 - 517,213
31.12.2013
Impaired
Performing Transaction type/Amount
31.12.2012
Performing
Impaired

Notes to the 2013 Separate Financial Statements
98
Section 8
Hedging derivatives – Item 80
Level 1 Level 2 Level 3 Level 1 Level 2 Level 3
A) Financial derivatives - 494 - 25,000 - 931 - 25,000 1) Fair value - 494 - 25,000 - 931 - 25,000 2) Cash flow - - - - - - - - 3) Foreign investments - - - - - - - -
B) Credit derivatives - - - - - - - - 1) Fair value - - - - - - - - 2) Cash flow - - - - - - - -
Total - 494 - 25,000 - 931 - 25,000
Notional
value
31.12.2012
8.1 Hedging derivatives: breakdown by type of hedging and fair value hierarchies
Fair value 31.12.2013 Notional
value
31.12.2013
Fair value 31.12.2012
Interest
rate risk
Currency
risk
Credit
RiskPrice risk
Multiple
risks
1. Financial assets available for
sale - - - - - x - x2. Loans - - - x - x - x3. Financial assets held to maturity x - - x - x - x4. Portfolio x x x x x - x - 5. Other transactions - - - - - x - x
Total assets - - - - - - - -
1. Financial liabilities 494 - - x - x - x2. Portfolio x x x x x - x -
Total liabilities 494 - - x - - - -
1. Expected transactions x x x x x x - x
2. Portfolio of financial assets and liabilities x x x x x - x -
8.2 Hedging derivatives: breakdown by hedged portfolio and type of hedge
Cash Flow
Transaction/Type of hedge
Ge
ne
ral
Sp
eci
fic
Ge
ne
ral
Fair Value
Specific

Notes to the 2013 Separate Financial Statements
99
Section 10
Equity investments – Item 100
10.1 Investments in subsidiaries, jointly controlled companies or associates: information on equity relationships
Description Registered offices Shareholding %Voting rights
%
A. Wholly-controlled subsidiaries
1. GE Capital Servizi Finanziari S.p.A. Mondovì (CN) 100.00% 100.00% 2. GE Capital Finance S.r.l. Milano 60.00% 60.00% 3. GE Capital Services S.r.l. Roma 79.00% 79.00%
B. Jointly controlled companies
C. Associates 10.2 Partecipazioni in società controllate, controllate in modo congiunto o sottoposte ad
L1 L2 L3
A. Imprese controllate in via esclusiva 1,925,555 160,587 (8,943) 455,018 367,520 x x x
1.GE Capital Servizi Finanziari S.p.A. 1,141,823 63,690 (14,800) 242,314 241,362 x x x 2.GE Capital Finance S.r.l. 244,146 6,158 (3,418) 118,159 70,384 x x x 3.GE Capital Services S.r.l. 539,586 90,739 9,275 94,545 55,774 x x xB. Imprese controllate in modo congiunto - - - - - x x xC. Imprese sottoposte ad influenza notevole - - - - - - - -
Totale 1,925,555 160,587 (8,943) 455,018 367,520 - - -
influenza notevole: informazioni contabili
DenominazioniTotale
attivo
Ricavi
totali
Utile
(Perdita)
Patrimonio
netto
Valore di
bilancio
Fair Value
Figures from the draft financial statements as at 31 December 2013 approved by the respective boards of directors.
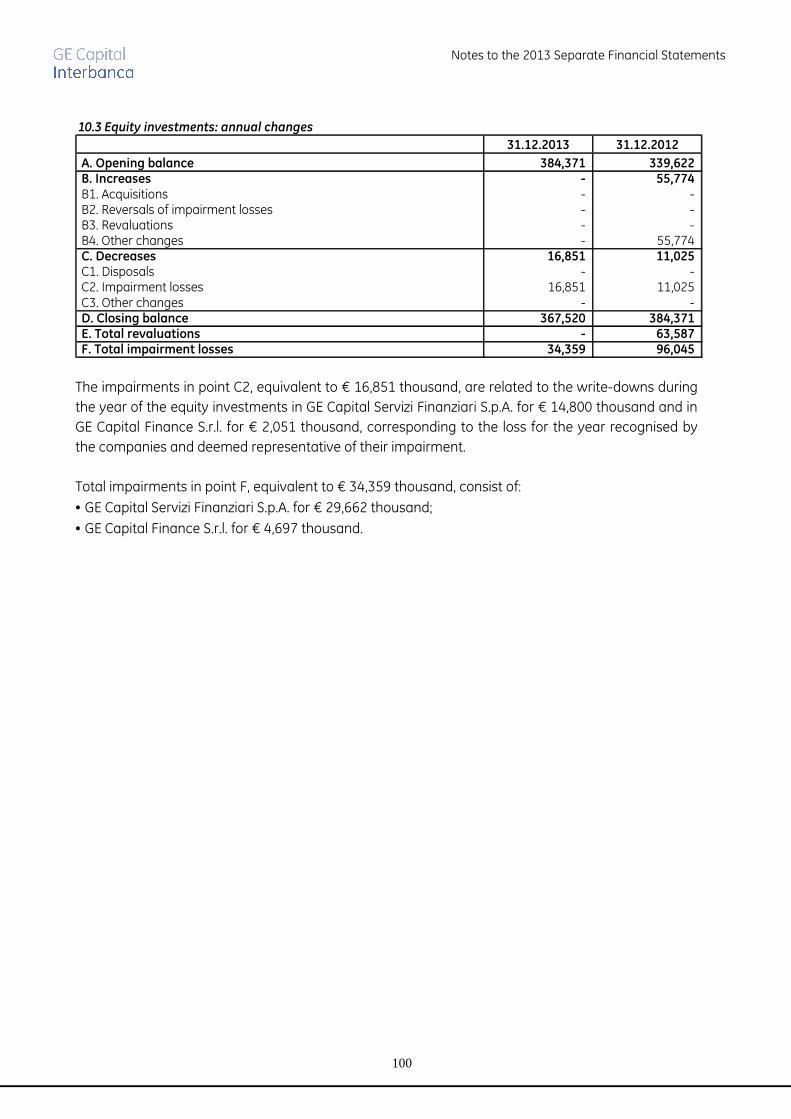
Notes to the 2013 Separate Financial Statements
100
10.3 Equity investments: annual changes
31.12.2013 31.12.2012
A. Opening balance 384,371 339,622 B. Increases - 55,774 B1. Acquisitions - - B2. Reversals of impairment losses - - B3. Revaluations - - B4. Other changes - 55,774 C. Decreases 16,851 11,025 C1. Disposals - - C2. Impairment losses 16,851 11,025 C3. Other changes - - D. Closing balance 367,520 384,371 E. Total revaluations - 63,587 F. Total impairment losses 34,359 96,045
The impairments in point C2, equivalent to € 16,851 thousand, are related to the write-downs during
the year of the equity investments in GE Capital Servizi Finanziari S.p.A. for € 14,800 thousand and in
GE Capital Finance S.r.l. for € 2,051 thousand, corresponding to the loss for the year recognised by
the companies and deemed representative of their impairment.
Total impairments in point F, equivalent to € 34,359 thousand, consist of:
• GE Capital Servizi Finanziari S.p.A. for € 29,662 thousand;
• GE Capital Finance S.r.l. for € 4,697 thousand.

Notes to the 2013 Separate Financial Statements
101
Section 11
Tangible assets – Item 110
Asset/Amount 31.12.2013 31.12.2012
1. Owned operating tangible assets 48,223 49,508
a) land 29,154 29,154 b) buildings 18,343 19,135 c) furniture and fittings 127 159 d) electronic equipment 599 1,060 e) other - -
2. leased tangible assets - -
a) land - - b) buildings - - c) furniture and fittings - - d) electronic equipment - - e) other - -
Total 48,223 49,508
11.1 Tangible assets: breakdown of assets valued at cost

Notes to the 2013 Separate Financial Statements
102
11.5 Own-use Assets: annual changes
Land BuildingsFurniture
and fittings
Electronic
equipmentOther Total
A. Gross opening balance: 29,154 33,033 4,652 13,097 - 79,936
A.1 Aggregate amount of decreases - 13,898 4,493 12,037 - 30,428
A.2 Net opening balances 29,154 19,135 159 1,060 - 49,508
B. Increases: - - 43 90 - 133
B.1 Purchases - - 43 90 - 133
B.2 Improvements capitalised - - - - - -
B.3 Reversals of impairment losses - - - - - -
B.4 Fair value adjustments recognised in - - - - - -
a) equity - - - - - -
b) income statement - - - - - -
B.5 Effect of movements in foreign exchange - - - - - -
B.6 Transfers from investments property - - - - - -
B.7 Other changes - - - - - -
C. Decreases: - 792 75 551 - 1,418
C.1 Disposals - - - - - -
C.2 Depreciation - 792 75 551 - 1,418
C.3 Impairment losses recognised in - - - - - -
a) equity - - - - - -
b) income statement - - - - - -
C.4 Fair value adjustments recognised in - - - - - -
a) equity - - - - - -
b) income statement - - - - - -
C.5 Effect of movements in foreign exchange - - - - - -
C.6 Transfers to - - - - - -
a) investment property - - - - - -
b) non-current assets held for sale - - - - - -
C0.7 Other changes - - - - - -
D. Closing balance: 29,154 18,343 127 599 - 48,223
D.1 Aggregate amount of decreases - 14,691 4,568 12,588 - 31,847
D.2 Gross closing balance 29,154 33,034 4,695 13,187 - 80,070
E. Valuation at cost 29,154 18,343 127 599 - 48,223
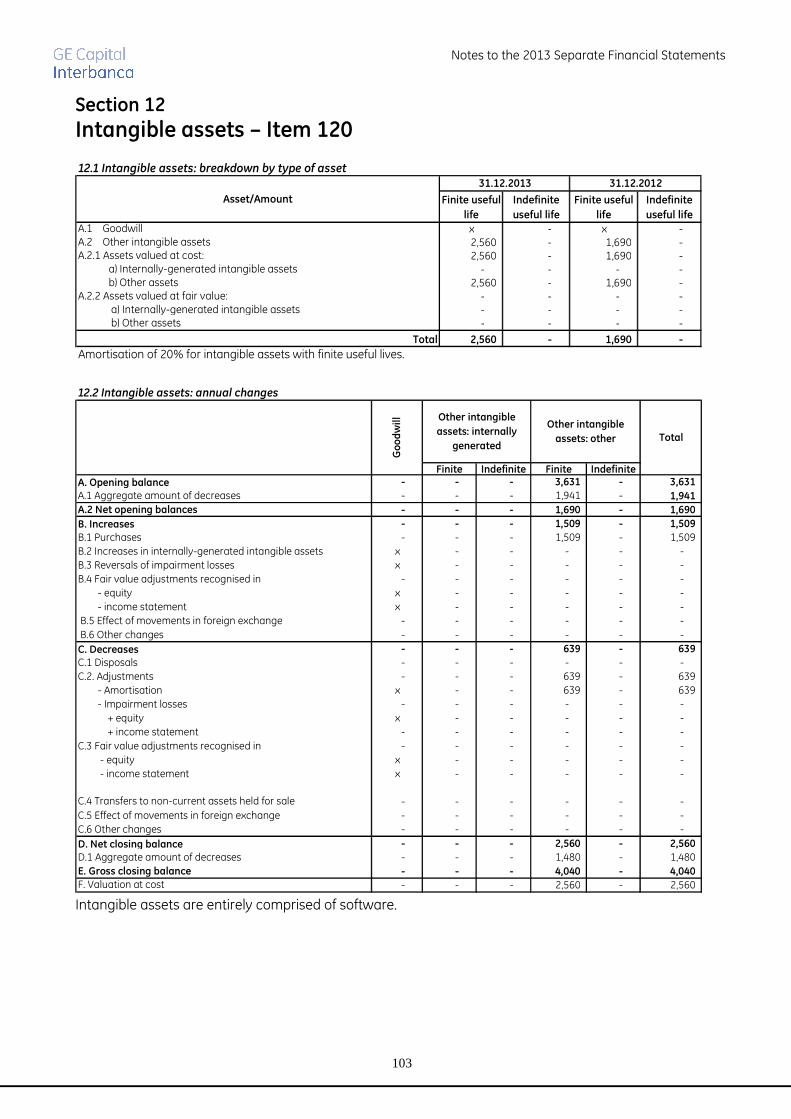
Notes to the 2013 Separate Financial Statements
103
Section 12
Intangible assets – Item 120 12.1 Intangible assets: breakdown by type of asset
Finite useful
life
Indefinite
useful life
Finite useful
life
Indefinite
useful life
A.1 Goodwill x - x - A.2 Other intangible assets 2,560 - 1,690 - A.2.1 Assets valued at cost: 2,560 - 1,690 -
a) Internally-generated intangible assets - - - - b) Other assets 2,560 - 1,690 -
A.2.2 Assets valued at fair value: - - - - a) Internally-generated intangible assets - - - - b) Other assets - - - -
Total 2,560 - 1,690 -
Amortisation of 20% for intangible assets with finite useful lives.
Asset/Amount
31.12.2013 31.12.2012
Finite Indefinite Finite Indefinite
A. Opening balance - - - 3,631 - 3,631
A.1 Aggregate amount of decreases - - - 1,941 - 1,941
A.2 Net opening balances - - - 1,690 - 1,690
B. Increases - - - 1,509 - 1,509
B.1 Purchases - - - 1,509 - 1,509
B.2 Increases in internally-generated intangible assets x - - - - -
B.3 Reversals of impairment losses x - - - - -
B.4 Fair value adjustments recognised in - - - - - -
- equity x - - - - -
- income statement x - - - - -
B.5 Effect of movements in foreign exchange - - - - - -
B.6 Other changes - - - - - -
C. Decreases - - - 639 - 639
C.1 Disposals - - - - - -
C.2. Adjustments - - - 639 - 639
Amortisation x - - 639 - 639
Impairment losses - - - - - -
+ equity x - - - - -
+ income statement - - - - - -
C.3 Fair value adjustments recognised in - - - - - -
- equity x - - - - -
- income statement x - - - - -
C.4 Transfers to non-current assets held for sale - - - - - -
C.5 Effect of movements in foreign exchange - - - - - -
C.6 Other changes - - - - - -
D. Net closing balance - - - 2,560 - 2,560
D.1 Aggregate amount of decreases - - - 1,480 - 1,480
E. Gross closing balance - - - 4,040 - 4,040
F. Valuation at cost - - - 2,560 - 2,560
12.2 Intangible assets: annual changes
Total
Other intangible
assets: internally
generated
Go
od
wil
l
Other intangible
assets: other
Intangible assets are entirely comprised of software.

Notes to the 2013 Separate Financial Statements
104
Section 13
Tax assets and liabilities – Item 130 (assets) and Item 80 (liabilities)
13.1 Deferred tax assets: breakdown
Item 31.12.2013 31.12.2012
Adjustments to loans 198,970 195,639 Tax loss - convertible as per Legislative Decree no. 201/2011 - 10,900 Valuation reserves (*) 349 788 Total deferred tax assets 199,319 207,327
*) The comparison data for 2012 was modified to reflect changes following the amendment to IAS 19
"Employee benefits" and the introduction of the new IAS 19 Revised, effective 1 January 2013. These
changes resulted in an increase in the severance indemnity fund for € 821 thousand, in the related
deferred tax assets for € 226 thousand and in the equity valuation reserve for € 595 thousand.
Unrecognised deferred tax assets: breakdown
Item 31.12.2013 31.12.2012
Previous tax losses from tax consolidation 20,874 20,052 Tax loss - transferred to tax consolidation 14,530 3,358 Adjustments to guarantees granted 4,960 12,987 Provisions for risks and charges 3,482 2,849 Personnel expenses 3,259 3,771 Adjustments to securities 638 638 Other 62 26 Total 47,805 43,681
As a result of regulations on deferred tax assets and in consideration of contractual agreements
resulting from the Bank’s participation in the National Tax Consolidation Scheme, deferred tax assets
were recognised, for both IRES and IRAP purposes, solely for impairments and write-downs on loans
deductible over 5 years at a constant rate, as established in the 2013 Stability Law converted into Law
no. 228/2013. However, deferred tax assets were not recognised for tax losses related to 2009, 2010, 2012 and 2013
for the portion not convertible into tax credits, or on other minor, temporary deductible differences, for
a total of € 50.3 million, as described above, due to uncertainty in the manner and timing for
generating sufficient future taxable income for their recovery.
13.2 Deferred tax liabilities: breakdown
Item 31.12.2013 31.12.2012Tangible assets 9,402 9,461 Write-backs of securities 927 2,299 Default interest receivable 292 292 Personnel expenses 199 200 Total deferred tax liabilities 10,820 12,252
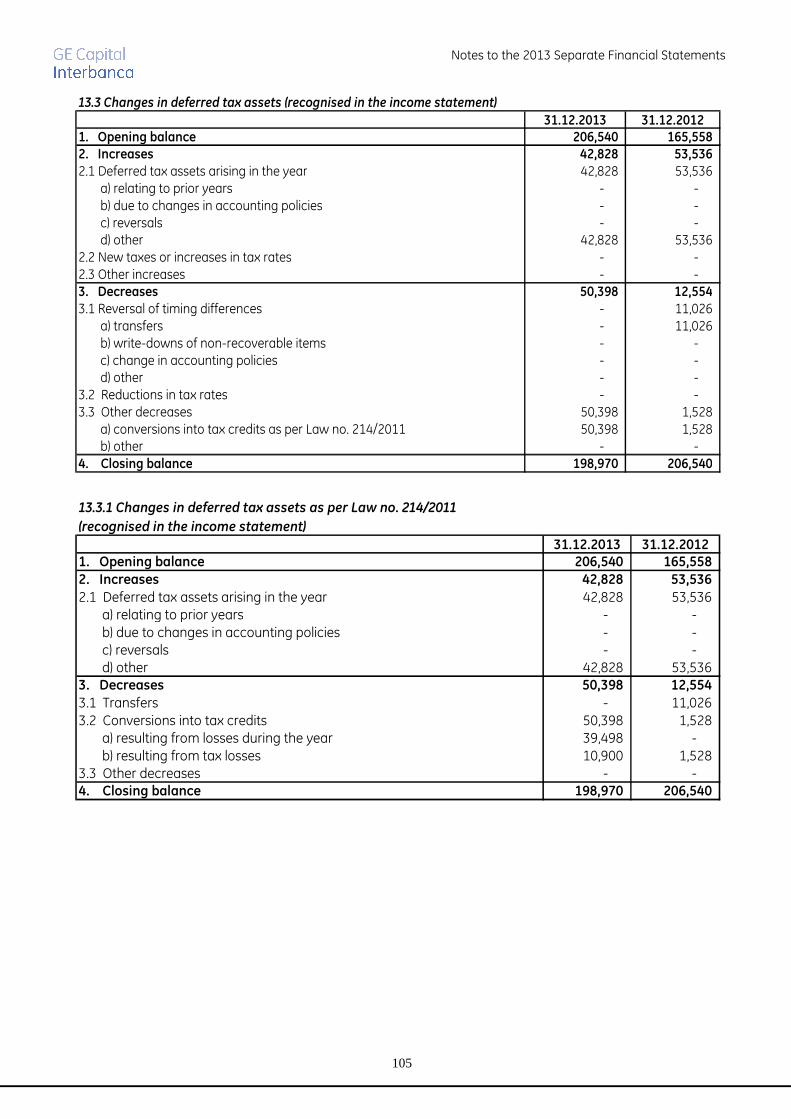
Notes to the 2013 Separate Financial Statements
105
13.3 Changes in deferred tax assets (recognised in the income statement)
31.12.2013 31.12.2012
1. Opening balance 206,540 165,558
2. Increases 42,828 53,536
2.1 Deferred tax assets arising in the year 42,828 53,536 a) relating to prior years - - b) due to changes in accounting policies - - c) reversals - - d) other 42,828 53,536
2.2 New taxes or increases in tax rates - - 2.3 Other increases - - 3. Decreases 50,398 12,554
3.1 Reversal of timing differences - 11,026 a) transfers - 11,026 b) write-downs of non-recoverable items - - c) change in accounting policies - - d) other - -
3.2 Reductions in tax rates - - 3.3 Other decreases 50,398 1,528
a) conversions into tax credits as per Law no. 214/2011 50,398 1,528 b) other - -
4. Closing balance 198,970 206,540 13.3.1 Changes in deferred tax assets as per Law no. 214/2011
(recognised in the income statement)
31.12.2013 31.12.20121. Opening balance 206,540 165,558
2. Increases 42,828 53,536
2.1 Deferred tax assets arising in the year 42,828 53,536 a) relating to prior years - - b) due to changes in accounting policies - - c) reversals - - d) other 42,828 53,536
3. Decreases 50,398 12,554
3.1 Transfers - 11,026 3.2 Conversions into tax credits 50,398 1,528
a) resulting from losses during the year 39,498 - b) resulting from tax losses 10,900 1,528
3.3 Other decreases - - 4. Closing balance 198,970 206,540

Notes to the 2013 Separate Financial Statements
106
13.4 Changes in deferred tax liabilities (recognised in the income statement)
31.12.2013 31.12.2012
1. Opening balance 9,954 10,023
2. Increases - -
2.1 Deferred tax liabilities arising in the year - - a) relating to prior years - - b) due to changes in accounting policies - - c) other - -
2.2 New taxes or increases in tax rates - - 2.3 Other increases - - 3. Decreases 62 69
3.1 Reversal of timing differences 62 69 a) transfers 62 69 b) due to changes in accounting policies - - c) other - -
3.2 Reductions in tax rates - - 3.3 Other decreases - - 4. Closing balance 9,892 9,954
31.12.2013 31.12.2012
1. Opening balance 787 1,670
2. Increases - 226
2.1 Deferred tax assets arising in the year - 226 a) relating to prior years - - b) due to changes in accounting policies (*) - 226 c) other -
2.2 New taxes or increases in tax rates - - 2.3 Other increases - - 3. Decreases 438 1,109
3.1 Reversal of timing differences 438 1,109 a) transfers 403 1,109 b) write-downs of non-recoverable items - - c) due to changes in accounting policies - - d) other 35 -
3.2 Reductions in tax rates - - 3.3 Other decreases - - 4. Closing balance 349 787
13.5 Changes in deferred tax assets (recognised in Equity)
*) The comparison data for 2012 was modified to reflect changes following the amendment to IAS 19
"Employee benefits" and the introduction of the new IAS 19 Revised, effective 1 January 2013. These
changes resulted in an increase in the severance indemnity fund for € 821 thousand, in the related
deferred tax assets for € 226 thousand and in the equity valuation reserve for € 595 thousand.

Notes to the 2013 Separate Financial Statements
107
31.12.2013 31.12.20121. Opening balance 2,298 800
2. Increases 224 1,622
2.1 Deferred tax liabilities arising in the year 224 1,622 a) relating to prior years - - b) due to changes in accounting policies - - c) other 224 1,622 2.2 New taxes or increases in tax rates - - 2.3 Other increases - - 3. Decreases 1,594 124
3.1 Reversal of timing differences 1,594 124 a) transfers 1,594 124 b) due to changes in accounting policies - - c) other - - 3.2 Reductions in tax rates - - 3.3 Other decreases - - 4. Closing balance 928 2,298
13.6 Changes in deferred tax liabilities (recognised in Equity)

Notes to the 2013 Separate Financial Statements
108
Section 15
Other assets – Item 150 15.1 Other assets: breakdown
Item 31.12.2013 31.12.2012
Sums due from third parties 20.051 17.399 Due from taxation authorities 1.985 1.320 Accrual income and prepaid expenses 659 562 Adjustment to cash and other short-term funds 309 2.546
Advance payments - 611 Land mortgages under approval - 325 Other items 571 640
Total 23.575 23.403
Notes to the 2013 Separate Financial Statements
109
LIABILITIES

Notes to the 2013 Separate Financial Statements
110
Section 1
Due to banks – Item 10
Transaction type/Amount 31.12.2013 31.12.2012 1. Due to Central Banks - -
2. Due to banks 11,107 16,054
2.1 Current accounts and demand deposits 1,795 2,041 2.2 Time deposits - - 2.3 Loans 9,312 14,013 2.3.1 Repurchase agreements - - 2.3.2 Other 9,312 14,013 2.4 Commitments to repurchase own equity instruments - - 2.5 Other liabilities - -
Total 11,107 16,054
Fair Value - level 1Fair Value - level 2Fair Value - level 3 11,107 16,054
Total Fair value 11,107 16,054
1.1 Due to banks: breakdown
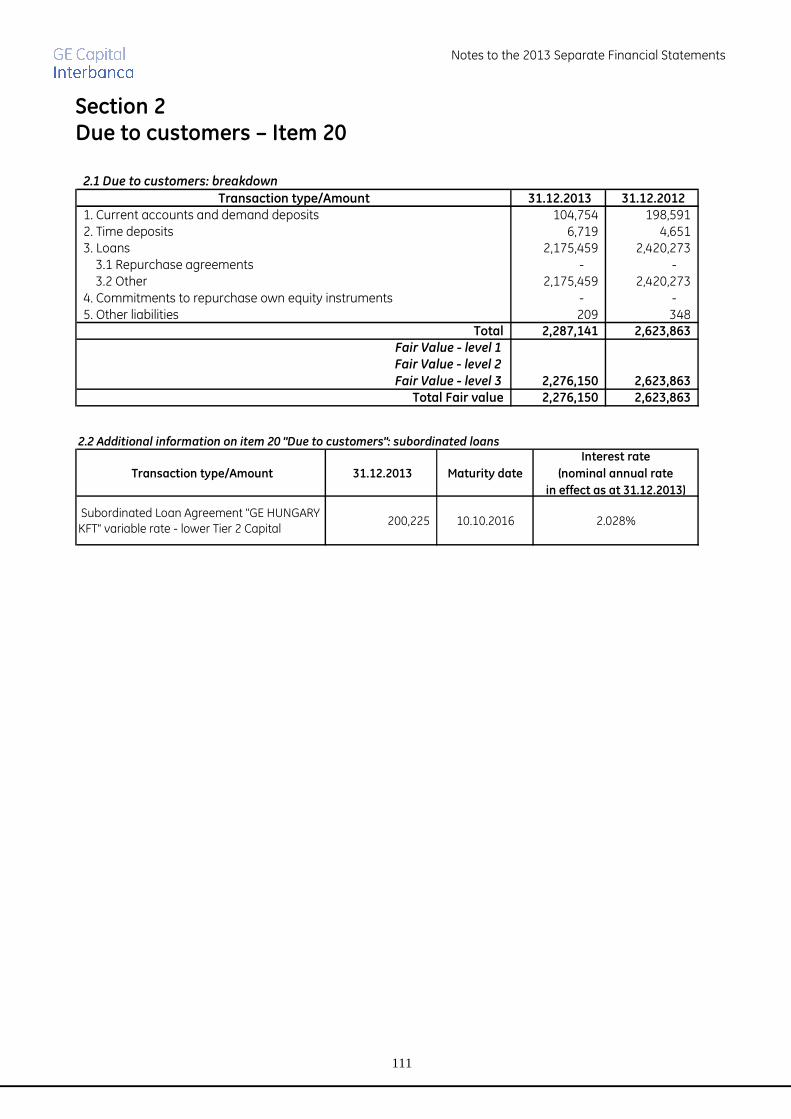
Notes to the 2013 Separate Financial Statements
111
Section 2 Due to customers – Item 20
Transaction type/Amount 31.12.2013 31.12.2012
1. Current accounts and demand deposits 104,754 198,591 2. Time deposits 6,719 4,651 3. Loans 2,175,459 2,420,273 3.1 Repurchase agreements - - 3.2 Other 2,175,459 2,420,273 4. Commitments to repurchase own equity instruments - - 5. Other liabilities 209 348
Total 2,287,141 2,623,863
Fair Value - level 1Fair Value - level 2Fair Value - level 3 2,276,150 2,623,863
Total Fair value 2,276,150 2,623,863
2.1 Due to customers: breakdown
2.2 Additional information on item 20 "Due to customers": subordinated loans
Transaction type/Amount 31.12.2013 Maturity date
Interest rate
(nominal annual rate
in effect as at 31.12.2013)
Subordinated Loan Agreement "GE HUNGARY KFT" variable rate - lower Tier 2 Capital
200,225 10.10.2016 2.028%

Notes to the 2013 Separate Financial Statements
112
Section 3
Securities issued – Item 30
Level 1 Level 2 Level 3 Level 1 Level 2 Level 3
A. Securities
1. bonds 216,509 82,536 114,387 - 320,261 73,752 218,011 -
1.1 structured 83,016 82,536 - - 80,185 73,752 - - 1.2 other 133,493 - 114,387 - 240,076 - 218,011 - 2. other securities 3,196 - 3,196 - 5,738 - 5,738 -
2.1 structured - - - - - - - - 2.2. other 3,196 - 3,196 - 5,738 - 5,738 -
Total 219,705 82,536 117,583 - 325,999 73,752 223,749 -
Fair Value
3.1 Securities issued: breakdown
Type of
security/Amount
31.12.2013
Book
Value
Fair Value
31.12.2012
Book Value
31.12.2013 31.12.2012
1. Fair value hedge: securities held against exposure to 25,539 25,963
a) interest rate risk 25,539 25,963 b) currency risk - - c) multiple risks - - 2. Cash flow hedge: securities hedged against exposure to - -
a) interest rate risk - - b) currency risk - - c) other - -
Total 25,539 25,963
3.3 Securities issued: securities with specific hedges

Notes to the 2013 Separate Financial Statements
113
Section 4
Financial liabilities held for trading – Item 40
4.1 Financial liabilities held for trading: breakdown
L1 L2 L3 L1 L2 L3
A. Financial liabilities (non-derivatives)
1. Due to banks - - - - - - - - - -
2. Due to customers - - - - - - - - - -
3. Debt securities - - - - - - - - - -
3.1 Bonds - - - - - - - - - -
3.1.1 Structured - - - - x - - - - x
3.1.2 Other - - - - x - - - - x
3.2 Other securities - - - - - - - - - -
3.2.1 Structured - - - - x - - - - x
3.2.2 Other - - - - x - - - - x
Total A - - - - - - - - - -
B. Derivatives
1. Financial derivatives 339,737 - 53,668 - - 1,068,683 - 81,211 - -
1.1 Trading x - 53,668 - x x - 81,211 - x
1.2 Under the fair value option x - - - x x - - - x
1.3 Other x - - - x x - - - x
2. Credit derivatives - - - - - - - - - -
2.1 Trading x - - - x x - - - x
2.2 Under the fair value option x - - - x x - - - x
2.3 Other x - - - x x - - - x
Total B x - 53,668 - x x - 81,211 - x
Total (A+B) - - 53,668 - - - - 81,211 - -
FV = fair value
FV* = fair value calculation without adjustments for credit rating
NV = nominal or notional value
L1 = Level 1
L2 = Level 2
L3 = Level 3
Transaction type/Amount
31.12.2013 31.12.2012
FV FV NV FV* NV FV*
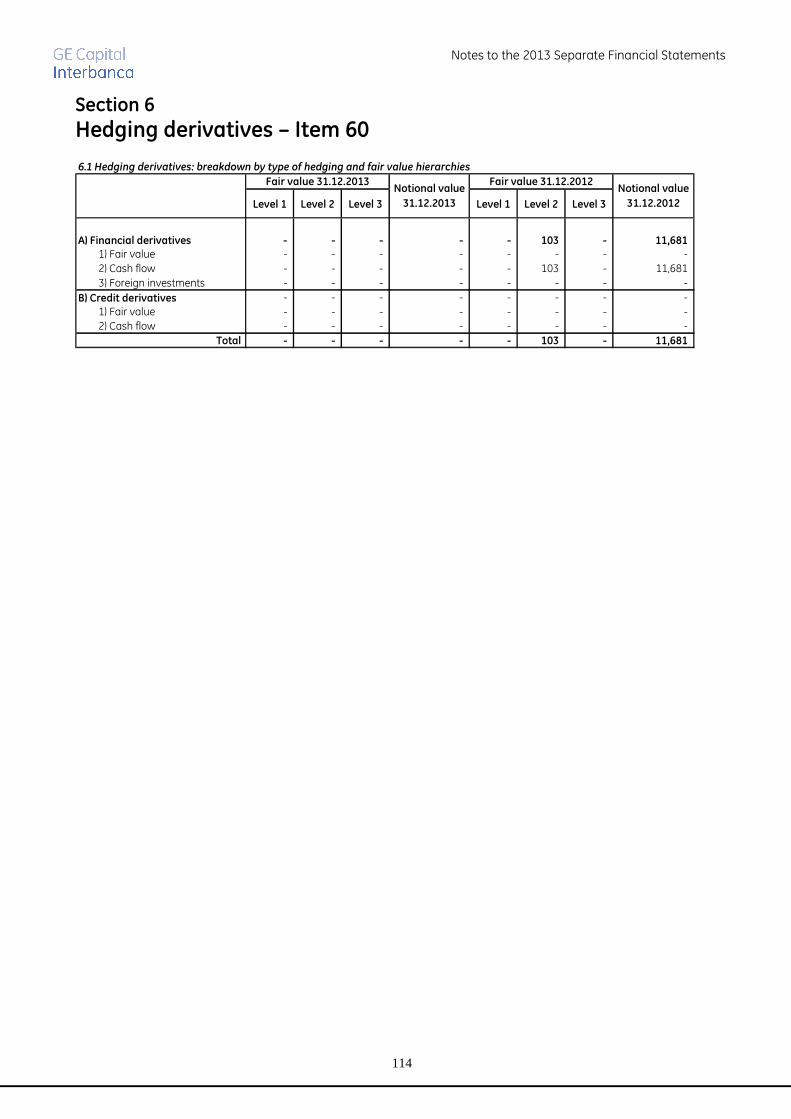
Notes to the 2013 Separate Financial Statements
114
Section 6
Hedging derivatives – Item 60
Level 1 Level 2 Level 3 Level 1 Level 2 Level 3
A) Financial derivatives - - - - - 103 - 11,681
1) Fair value - - - - - - - -
2) Cash flow - - - - - 103 - 11,681
3) Foreign investments - - - - - - - -
B) Credit derivatives - - - - - - - -
1) Fair value - - - - - - - -
2) Cash flow - - - - - - - -
Total - - - - - 103 - 11,681
Notional value
31.12.2012
6.1 Hedging derivatives: breakdown by type of hedging and fair value hierarchies
Fair value 31.12.2013Notional value
31.12.2013
Fair value 31.12.2012

Notes to the 2013 Separate Financial Statements
115
Section 10
Other liabilities – Item 100 10.1 Other liabilities: breakdown
Asset/Amount 31.12.2013 31.12.2012
Adjustments to guarantees granted 18,035 47,224 Due to suppliers 9,141 8,382 Amounts due to third parties 8,497 3,275 Personnel charges 2,439 4,651 Due to tax authorities for withholding taxes 2,241 2,990 Items under processing 2,118 137 Liabilities for seconded personnel 982 1,311 Deposits awaiting release - 325 Other items 1,257 1,436
Total 44,710 69,731

Notes to the 2013 Separate Financial Statements
116
Section 11
Severance indemnity fund – Item 110
31.12.2013 31.12.2012A. Opening balance 4,586 4,172
B. Increases 1,348 2,404
B.1 Provision for the year 1,103 1,454 B.2 Other increases 245 950 C. Decreases 2,106 1,990
C.1 Disbursements 695 564 C.2 Other decreases 1,411 1,426 D. Closing balance 3,828 4,586
11.1 Severance indemnity fund: annual changes
*) The comparison data for 2012 was modified to reflect changes following the amendment to IAS 19
"Employee benefits" and the introduction of the new IAS 19 Revised, effective 1 January 2013. These
changes resulted in an increase in the severance indemnity fund for € 821 thousand, in the related
deferred tax assets for € 226 thousand and in the equity valuation reserve for € 595 thousand. 11.2 Additional information
The value of the severance indemnity fund determined on the basis of art. 2120 of the Italian Civil Code
amounted to € 3,839 thousand.
The demographic and actuarial assumptions used in valuing the severance indemnity fund are as follows:
• The discount rate used in the valuation as at 31 December 2013, equivalent to 2.75% annually,
was chosen based on the market yield curve of corporate bonds with AA ratings and an average
financial duration consistent with the commitments being assessed;
• Turnover rate: 5% per each year between 21 and 60 years of age;
• Retirement: 100% probability upon reaching the minimum requirements of the national social
security plan, considering amendments introduced by Legislative Decree no. 201/2011
converted into Law no. 214/2011 effective from 1 January 2012.

Notes to the 2013 Separate Financial Statements
117
Section 12
Allowances for risks and charges – Item 120 12.1 Allowances for risks and charges: breakdown
Item/Amount 31.12.2013 31.12.20121. Staff retirement funds - - 2. Other allowances for risks and charges 24,508 26,074 2.1 legal disputes 7,268 5,020 2.2 personnel expenses 11,921 14,434 2.3 other 5,319 6,620
Total 24,508 26,074 12.2 Allowances for risks and charges: annual changes
Legal
disputes
Personnel
chargesOther
A. Opening balance - 5,020 14,434 6,620 26,074
B. Increases - 2,700 4,472 1,035 8,207
B.1 Provision for the year - 2,700 4,428 1,035 8,163 B.2 Changes due to time value - - - - -
B.3 Changes due to variations in the discount rate
- - - - -
B.4 Other increases - - 44 - 44 C. Decreases - 452 6,985 2,336 9,773
C.1 Utilisation during the year - 446 4,177 1,413 6,036
C.2 Changes due to variations in the discount rate
- - - - -
C.3 Other decreases - 6 2,808 923 3,737 D. Closing balance - 7,268 11,921 5,319 24,508
Retirement
fundsTotal
Other
12.4 Allowances for risks and charges: other allowances
The amount for legal disputes (Table 12.1-2-2.1) includes 6 actions, 2 of which were allocated during
the year for a total of € 2,700 thousand.
Provisions for “personnel expenses” (Table 12.1-2-2.2) includes:
• € 7,388 thousand for the 2009 redundancy programme;
• € 3,401 thousand for incentive compensation;
• € 1,063 thousand for the staff loyalty fund;
• € 70 thousand for potential litigation with employees;
“Other" provisions (Table 12.1-2-2.3) is mainly related to:
• € 2,785 thousand for possible recovery actions on sold loans;
• € 1,032 thousand for potential lack of recognition of receivables for loan application fees
associated with subsidised credit laws;
• € 878 thousand for potential recovery actions by the Ministry undertaken to claw back funds
related to activities performed under Law 488;
• € 237 thousand for potential recovery actions on M&A positions;
• € 192 thousand for an outstanding invoice not related to lending activity.

Notes to the 2013 Separate Financial Statements
118
• € 191 thousand for corporate litigation.
Both the amounts and the timing are the result of a prudent assessment by the Bank’s directors.
The following are potential liabilities, of a significant amount, related to civil lawsuits for which the
Bank has determined that a negative result is not probable, and therefore did not result in an
allocation in the financial statements:
• Litigation brought against the Bank in 2010 in relation to a position for which the Bank had
stipulated a settlement agreement in 2005 with the then-special commissioner appointed for
procedure for extraordinary administration. The agreement’s validity was brought into question
by the new special commissioner, who presented a claim for damages of € 168 million. The risk
assessment considers the opinions of external attorneys, as well as the initial positive indications
from the proceedings at first instance for this dispute;
• At the beginning of 2012, the Bank was notified, along with more than 60 other defendants, of
litigation related to an equity investment that had previously been held indirectly by the Bank,
the remedy for which is at least € 388 million, jointly and severally. During 2013, the request for
damages for failure to reduce a prior environmental hazard was also extended to the Bank,
jointly with the other defendants, allegedly ascribable to a company the Bank had previously
indirectly owned, in the amount of € 3,400 million. To date, despite the uncertainties normally
associated with the initial phases of a dispute of this complexity, the Bank considers that a
precise valuation of the dispute would be random and premature at this point, based on the
opinion expressed by the attorneys and in consideration of the initial phases of the dispute and
of the still potential nature of the key element of the damages requested (environmental
damages). The Bank holds that the claims advanced by the plaintiff are, ex multis, completely
baseless and lacking proof of the causal relationship between the damages and the Bank's
conduct.

Notes to the 2013 Separate Financial Statements
119
Section 14
Equity – Items 130, 150, 160, 170, 180, 190 and 200
14.1 Share capital and Treasury shares: breakdown
Item/Amount 31.12.2013 31.12.20121. Share capital 217,335 217,335 2. Share premium reserve 354,148 354,148 3. Reserves 57,921 227,196 4. (Treasury shares) - - 5. Valuation reserves (*) 43,684 39,184 6. Equity instruments - - 7. Profit (Loss) for the year (128,269) (169,275)
Total 544,819 668,588
*) The comparison data for 2012 was modified to reflect changes following the amendment to IAS 19
"Employee benefits" and the introduction of the new IAS 19 Revised, effective 1 January 2013. These
changes resulted in an increase in the severance indemnity fund for € 821 thousand, in the related
deferred tax assets for € 226 thousand and in the equity valuation reserve for € 595 thousand.
Item/Type Ordinary Other
A. Shares outstanding at the beginning of the year 72,445,094 -
- fully paid 72,445,094 -
- not fully paid - -
A.1 Treasury shares (-) - -
A.2 Outstanding shares: opening balance 72,445,094 -
B. Increases - -
B.1 New issues - -
- for cash: - -
- business combinations - -
- conversion of bonds - -
- exercise of warrants - -
- other - -
- granted: - -
- to employees - -
- to directors - -
- other - -
B.2 Disposal of treasury shares - -
B.3 Other changes - -
C. Decreases - -
C.1 Redeemable shares - -
C.2 Purchase of treasury shares - -
C.3 Transfer of businesses - -
C.4 Other changes - -
D. Outstanding shares: closing balance 72,445,094 -
D.1 Treasury shares (+) - -
D.2 Shares outstanding at the end of the year - -
- fully paid 72,445,094 -
- not fully paid - -
14.2 Share capital - Number of company's shares: annual changes

Notes to the 2013 Separate Financial Statements
120
14.4 Retained earnings: additional information
Legal
reserve
Statutory
reserve
Treasury
shares
Retained
earningsOther
FTA
reserveTotal
A. Opening balance 35,649 58,508 - - 171,207 98,523- 166,841
B. Increases - - - - - - -
B.1 Allocation of net income - - - - - - - B.2 Other changes - - - - - - -
C. Decreases - - - - 113,501 - 113,501
C.1 Uses - - - - 113,501 - 113,501 - offsetting of losses - - - - 113,501 - 113,501 - dividends paid - - - - - - - - transfers to capital - - - - - - -
C.2 Other changes - - - - - - - D. Closing balance 35,649 58,508 - - 57,706 (98,523) 53,340 14.6 Additional information
Tax treatment of Share Capital, Allowances and Reserves
Not subject
to taxation
Subject to
taxation on
distribution
Not included in
shareholders
taxable income
Total
31.12.2013
Total
31.12.2012
1. Share capital - 20,710 196,625 217,335 217,335
2. Share premium reserve - - 354,148 354,148 354,148
3. Reserves 53,340 4,581 - 57,921 209,121
Extraordinary reserve 57,706 - - 57,706 153,132
Statutory reserve 58,508 - - 58,508 58,508
Legal reserve 35,649 - - 35,649 35,649
Special reserve (Art. 15, 10° of Law no. 516 of 07/08/1982) - 4,581 - 4,581 4,581
First-time Adoption Reserve (98,523) - - (98,523) (98,523)
Reserve for equity investment transfer - - - 55,774
4. (Treasury shares) - - - - -
5. Valuation reserves 41,340 2,344 - 43,684 39,184
AFS Reserve 29,715 - - 29,715 25,347
Tangible Asset Valuation Reserve (503) - - (503) (595)
Cash Flow Reserve - - - - (40)
Special reserve of revaluation 12,128 2,344 - 14,472 14,472
6. Equity instruments - - - - -
7. Profit (Loss) for the year (128,269) - - (128,269) (169,275)
Total (33,589) 27,635 550,773 544,819 650,513
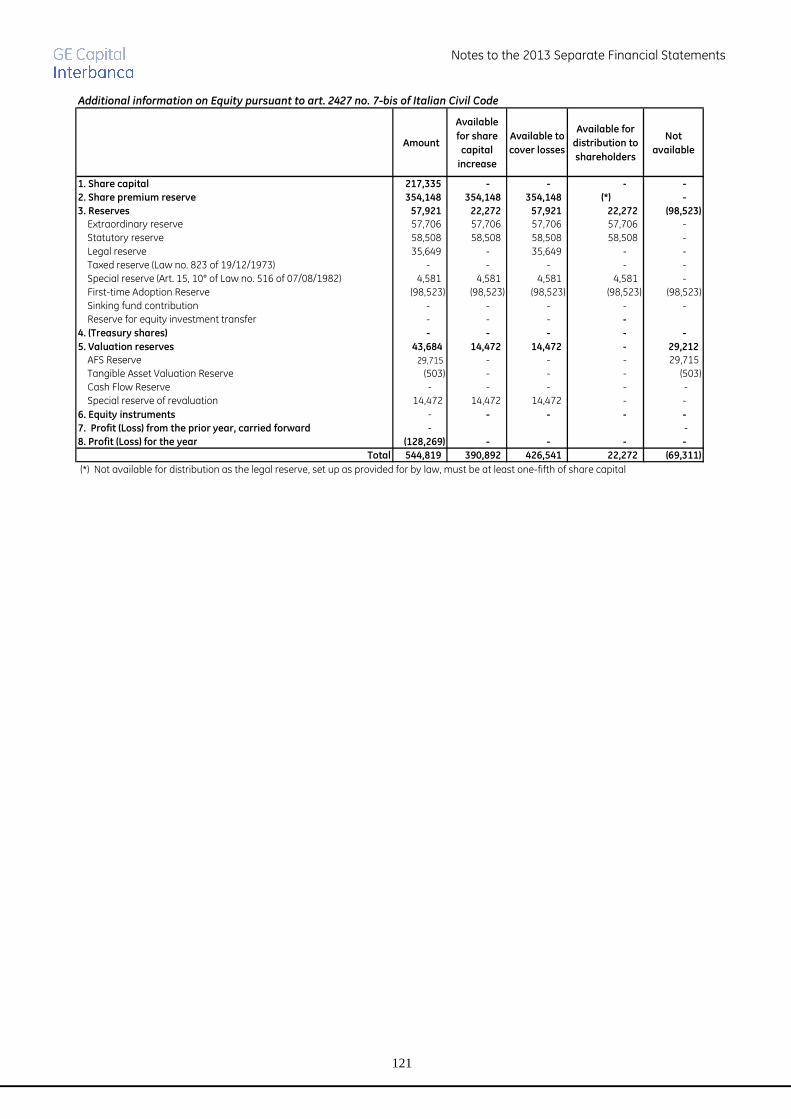
Notes to the 2013 Separate Financial Statements
121
Amount
Available
for share
capital
increase
Available to
cover losses
Available for
distribution to
shareholders
Not
available
1. Share capital 217,335 - - - -
2. Share premium reserve 354,148 354,148 354,148 (*) -
3. Reserves 57,921 22,272 57,921 22,272 (98,523)
Extraordinary reserve 57,706 57,706 57,706 57,706 -
Statutory reserve 58,508 58,508 58,508 58,508 -
Legal reserve 35,649 - 35,649 - -
Taxed reserve (Law no. 823 of 19/12/1973) - - - - -
Special reserve (Art. 15, 10° of Law no. 516 of 07/08/1982) 4,581 4,581 4,581 4,581 -
First-time Adoption Reserve (98,523) (98,523) (98,523) (98,523) (98,523)
Sinking fund contribution - - - - -
Reserve for equity investment transfer - - - -
4. (Treasury shares) - - - - -
5. Valuation reserves 43,684 14,472 14,472 - 29,212
AFS Reserve 29,715 - - - 29,715
Tangible Asset Valuation Reserve (503) - - - (503)
Cash Flow Reserve - - - - -
Special reserve of revaluation 14,472 14,472 14,472 - -
6. Equity instruments - - - - -
7. Profit (Loss) from the prior year, carried forward - -
8. Profit (Loss) for the year (128,269) - - - -
Total 544,819 390,892 426,541 22,272 (69,311)
(*) Not available for distribution as the legal reserve, set up as provided for by law, must be at least one-fifth of share capital
Additional information on Equity pursuant to art. 2427 no. 7-bis of Italian Civil Code

Notes to the 2013 Separate Financial Statements
122
(empty page)

Notes to the 2013 Separate Financial Statements
123
ADDITIONAL INFORMATION
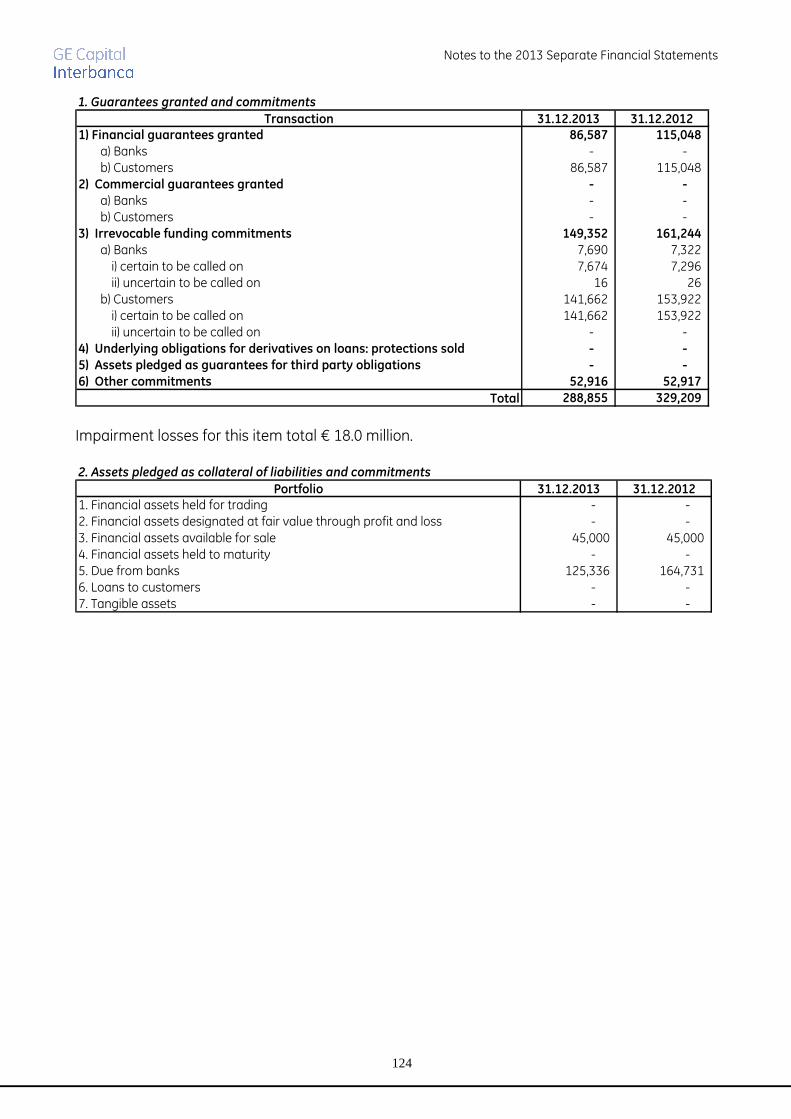
Notes to the 2013 Separate Financial Statements
124
1. Guarantees granted and commitments
Transaction 31.12.2013 31.12.20121) Financial guarantees granted 86,587 115,048
a) Banks - - b) Customers 86,587 115,048
2) Commercial guarantees granted - -
a) Banks - - b) Customers - -
3) Irrevocable funding commitments 149,352 161,244
a) Banks 7,690 7,322 i) certain to be called on 7,674 7,296 ii) uncertain to be called on 16 26
b) Customers 141,662 153,922 i) certain to be called on 141,662 153,922 ii) uncertain to be called on - -
4) Underlying obligations for derivatives on loans: protections sold - -
5) Assets pledged as guarantees for third party obligations - -
6) Other commitments 52,916 52,917
Total 288,855 329,209 Impairment losses for this item total € 18.0 million. 2. Assets pledged as collateral of liabilities and commitments
Portfolio 31.12.2013 31.12.20121. Financial assets held for trading - - 2. Financial assets designated at fair value through profit and loss - - 3. Financial assets available for sale 45,000 45,000 4. Financial assets held to maturity - - 5. Due from banks 125,336 164,731 6. Loans to customers - - 7. Tangible assets - -

Notes to the 2013 Separate Financial Statements
125
4. Management and brokerage of securities on behalf of third parties
Type of service 31.12.2013 31.12.2012
1. Trading of financial instruments on behalf of third parties - 5,551
a) Purchases - 5,501
1. settled - 5,501
2. to be settled - -
b) Sales - 50
1. settled - 50
2. to be settled - -
2. Asset management - -
a) Individual - -
b) Collective - -
3. Custody and administration of securities 2,958,727 3,383,255
a) Third-party securities under custody: associated with
custodial activities (excluding asset management) - -
1. securities issued by the bank preparing the financial statements - -
2. other securities - -
b) Third-party securities under custody (excluding asset management): other 1,478,723 1,724,679
1. securities issued by the bank preparing the financial statements 220,812 223,049
2. other securities 1,257,911 1,501,630
c) Third-party securities held by other depositories 1,252,720 1,411,644
d) Own securities held by other depositories 227,284 246,932
4. Other transactions - -
Notes to the 2013 Separate Financial Statements
126
(empty page)

Notes to the 2013 Separate Financial Statements
127
Part C
INFORMATION ON THE INCOME STATEMENT

Notes to the 2013 Separate Financial Statements
128
Section 1
Interest income and expense – Items 10 and 20 1.1 Interest income and similar revenues: breakdown
1. Financial assets
held for trading - - - - -
2. Financial assets available
for sale 906 - - 906 2,280
3. Financial assets held
to maturity - - - - -
4. Due from banks - 1,044 - 1,044 1,339
5. Loans to customers - 59,918 - 59,918 86,604
6. Financial assets designated
at fair value through profit and loss - - - - -
7. Hedging derivatives x x 474 474 126
8. Other assets x x - - -
Total 906 60,962 474 62,342 90,349
31.12.2013 31.12.2012Item/TypeOther
assets
Debt
securitiesLoans
Interest accrued on positions that are impaired as at the balance sheet date amounts to € 12,063 thousand.
Item/Amount 31.12.2013 31.12.2012
A. Positive differentials on hedging transactions 535 466 B. Negative differentials on hedging transactions (61) (340) C. Balance (A-B) 474 126
1.2 Interest income and similar revenues: differentials for hedging transactions

Notes to the 2013 Separate Financial Statements
129
31.12.2013 31.12.2012
a) financial assets in foreign currencies 5,224 7,403
1.3.1 Interest income on financial assets denominated in foreign currencies
Item/Type Liabilities SecuritiesOther
transactions31.12.2013 31.12.2012
1. Due to Central Banks - x - - - 2. Due to banks (228) x - (228) (471) 3. Due to customers (7,764) x - (7,764) (28,187) 4. Securities issued x (9,781) - (9,781) (12,555) 5. Financial liabilities held for trading - - - - - 6. Financial liabilities designated at fair value through profit and loss - - - - - 7. Other liabilities and allowances x x (2) (2) (2) 8. Hedging derivatives x x - - -
Total (7,992) (9,781) (2) (17,775) (41,215)
1.4 Interest expense and similar charges: breakdown
1.6.1 Interest expense on liabilities denominated in foreign currencies31.12.2013 31.12.2012
a) financial liabilities in foreign currencies (1,183) (2,483)

Notes to the 2013 Separate Financial Statements
130
Section 2
Net fee and commission income – Items 40 and 50
Type of service/Amount 31.12.2013 31.12.2012a) guarantees granted 1,655 1,903
b) credit derivatives - -
c) management, brokerage and consulting services: - 760
1. brokerage of financial instruments - - 2. foreign exchange trading - - 3. asset management - - 3.1 individual - - 3.2 collective - - 4. custody and administration of securities - - 5. custodian bank - - 6. placement of securities - - 7. order collection - 1 8. advisory services - 759 8.1 related to investments - - 8.2 related to financial structures - 759 9. distribution of third party services - - 9.1 asset management - - 9.1.1 individual - - 9.1.2 collective - - 9.2 insurance products - - 9.3 other products - - d) collection and payment services - -
e) servicing for securitisation transactions - -
f) services for factoring transactions - -
g) tax collection services - -
h) management of multilateral trading facilities - -
i) management of current accounts - -
j) other services 4,797 7,504
Total 6,452 10,167
2.1 Fee and commission income: breakdown
Fee and commission income primarily refers to lending activities, such as leader transactions and
agency fees (€ 1.8 million), debt revisions and restructurings (€ 1.5 million), early repayments and
settlements (€ 0.5 million) and guarantees issued (€ 1.6 million).
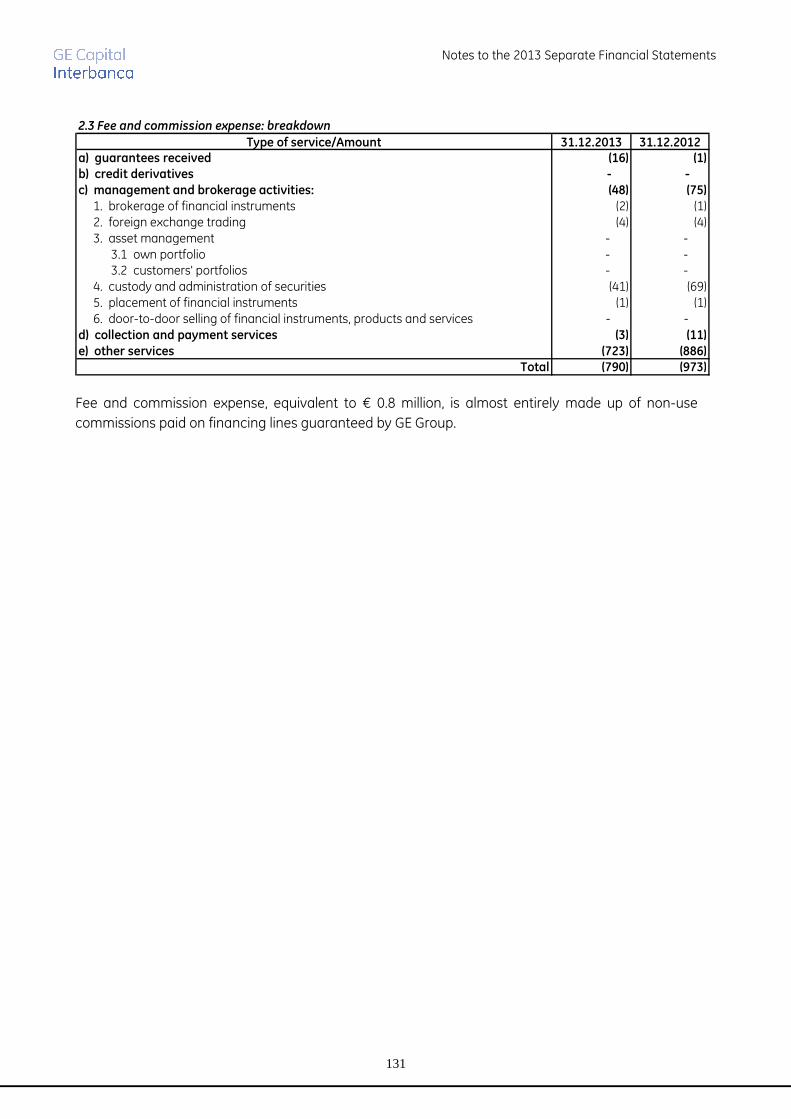
Notes to the 2013 Separate Financial Statements
131
2.3 Fee and commission expense: breakdown
Type of service/Amount 31.12.2013 31.12.2012a) guarantees received (16) (1)
b) credit derivatives - -
c) management and brokerage activities: (48) (75)
1. brokerage of financial instruments (2) (1) 2. foreign exchange trading (4) (4) 3. asset management - - 3.1 own portfolio - - 3.2 customers' portfolios - - 4. custody and administration of securities (41) (69) 5. placement of financial instruments (1) (1) 6. door-to-door selling of financial instruments, products and services - -
d) collection and payment services (3) (11)
e) other services (723) (886)
Total (790) (973)
Fee and commission expense, equivalent to € 0.8 million, is almost entirely made up of non-use
commissions paid on financing lines guaranteed by GE Group.

Notes to the 2013 Separate Financial Statements
132
Section 3
Dividends and similar revenues – Item 70
Dividends
Income from
investment
fund units
Dividends
Income from
investment
fund units
A. Financial assets held for trading - - - - B. Financial assets available for sale 2,136 - 28 - C. Financial assets designated at fair value through profit and loss - - - - D. Equity investments - x - x
Total 2,136 - 28 -
Item/Amount
31.12.2013 31.12.2012
3.1 Dividends and similar revenues: breakdown
Dividends collected during the year are essentially attributable to the equity investment in Dayco LCC.

Notes to the 2013 Separate Financial Statements
133
Section 4
Profits (Losses) on trading – Item 80
Transaction/ItemUnrealised
gains (A)
Realised
gains (B)
Unrealised
losses (C)
Realised
losses (D)
Net result
[(A+B)-(C+D)]
1. Financial assets held for trading - - - - -
1.1 Debt securities - - - - -
1.2 Equities - - - - -
1.3 Investment fund units - - - - -
1.4 Loans - - - - -
1.5 Other - - - - -
2. Financial liabilities held
for trading - - - - -
2.1 Debt securities - - - - -
2.2 Liabilities
2.3 Other - - - - -
3. Financial assets and liabilities:
exchange differences x x x x 407
4. Derivatives 25,557 13,743 (40,344) (13,285) (14,329)
4.1 Financial derivatives: 25,557 13,743 (40,344) (13,285) (14,329)
- On debt securities and
interest rates 25,557 13,743 (40,344) (13,285) (14,329)
- On equities and share
indexes - - - - -
- On foreign exchange and gold x x x x -
- Other - - - - -
4.2 Credit derivatives - - - - -
Total 25,557 13,743 (40,344) (13,285) (13,922)
4.1 Profits (losses) on trading: breakdown
The data includes impairment losses, both specific and collective, for loans to customers with positive
fair value. The collective impairments are calculated based on the same criteria used for Loans to
customers.
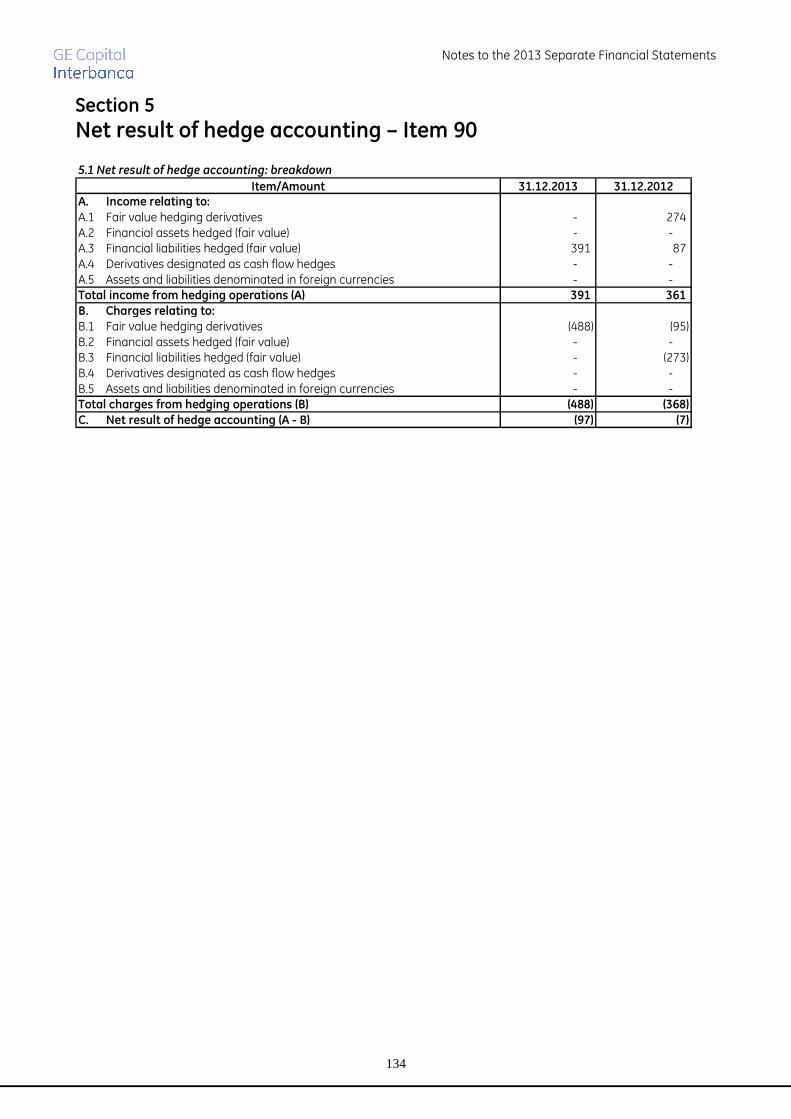
Notes to the 2013 Separate Financial Statements
134
Section 5
Net result of hedge accounting – Item 90
Item/Amount 31.12.2013 31.12.2012A. Income relating to:
A.1 Fair value hedging derivatives - 274 A.2 Financial assets hedged (fair value) - - A.3 Financial liabilities hedged (fair value) 391 87 A.4 Derivatives designated as cash flow hedges - - A.5 Assets and liabilities denominated in foreign currencies - - Total income from hedging operations (A) 391 361
B. Charges relating to:
B.1 Fair value hedging derivatives (488) (95) B.2 Financial assets hedged (fair value) - - B.3 Financial liabilities hedged (fair value) - (273) B.4 Derivatives designated as cash flow hedges - - B.5 Assets and liabilities denominated in foreign currencies - - Total charges from hedging operations (B) (488) (368)
C. Net result of hedge accounting (A - B) (97) (7)
5.1 Net result of hedge accounting: breakdown

Notes to the 2013 Separate Financial Statements
135
Section 6
Profits (Losses) on disposals/repurchases – Item 100
Profits LossesNet profit
(loss)Profits Losses
Net profit
(loss)
Financial assets
1. Due from banks - - - - - - 2. Loans to customers - - - - - - 3. Financial assets available for sale 562 - 562 27 - 27 3.1 Debt securities 222 - 222 - - - 3.2 Equities 340 - 340 27 - 27 3.3 Investment fund units - - - - - - 3.4 Loans - - - - - - 4. Financial assets held to maturity - - - - - -
Total assets 562 - 562 27 - 27
Financial liabilities
1. Due to banks - - - - - - 2. Due to customers - - - - - - 3. Securities issued - - - - (18) (18)
Total liabilities - - - - (18) (18)
Asset/Item
31.12.2013 31.12.2012
6.1 Profits (Losses) on disposals/repurchases: breakdown

Notes to the 2013 Separate Financial Statements
136
Section 8
Net impairment losses and reversals of impairment – Item 130
A B A B
A. Due from banks - - - - - - - - 5
- Loans - - - - - - - - 5 - Debt securities - - - - - - - -
B. Loans to customers (72) (150,798) (190) 6,236 8,924 125 4,637 (131,138) (155,403) Impaired loans
purchased - - - - - -
- Loans - - X - - X X - -
- Debt securities - - X - - X X - -
Other receivables (72) (150,798) (190) 6,236 8,924 125 4,637 (131,138) (155,403)
- Loans (72) (150,798) (190) 6,236 8,924 125 4,637 (131,138) (155,403) - Debt securities - - - - - - - - -
C. Total (72) (150,798) (190) 6,236 8,924 125 4,637 (131,138) (155,398)
Collective
Total
31.12.2013
(1)-(2)
Co
lle
ctiv
e
Individual
Impairment losses
(1)
Individual
8.1 Net impairment losses/recoveries on loans: breakdown
De
reco
gn
itio
ns
Oth
er
Total
31.12.2012Transaction/Item
Recoveries
(2)
De
reco
gn
itio
ns
Oth
er
A B
A. Debt securities - (2,945) - - (2,945) 1,488
B. Equities - (40) x x (40) (2,081)
C. Investment fund units - - x - - - D. Loans to banks - - - - - - E. Loans to customers - - - - - - F. Total - (2,985) - - (2,985) (593)
Key
A = From interestB = Other recoveries
8.2 Net impairment losses/recoveries on financial assets available for sale: breakdown
Total
31.12.2013
(1)-(2)
Total
31.12.2012Transaction/Item
Impairment losses
(1)
Individual
Recoveries
(2)
Individual
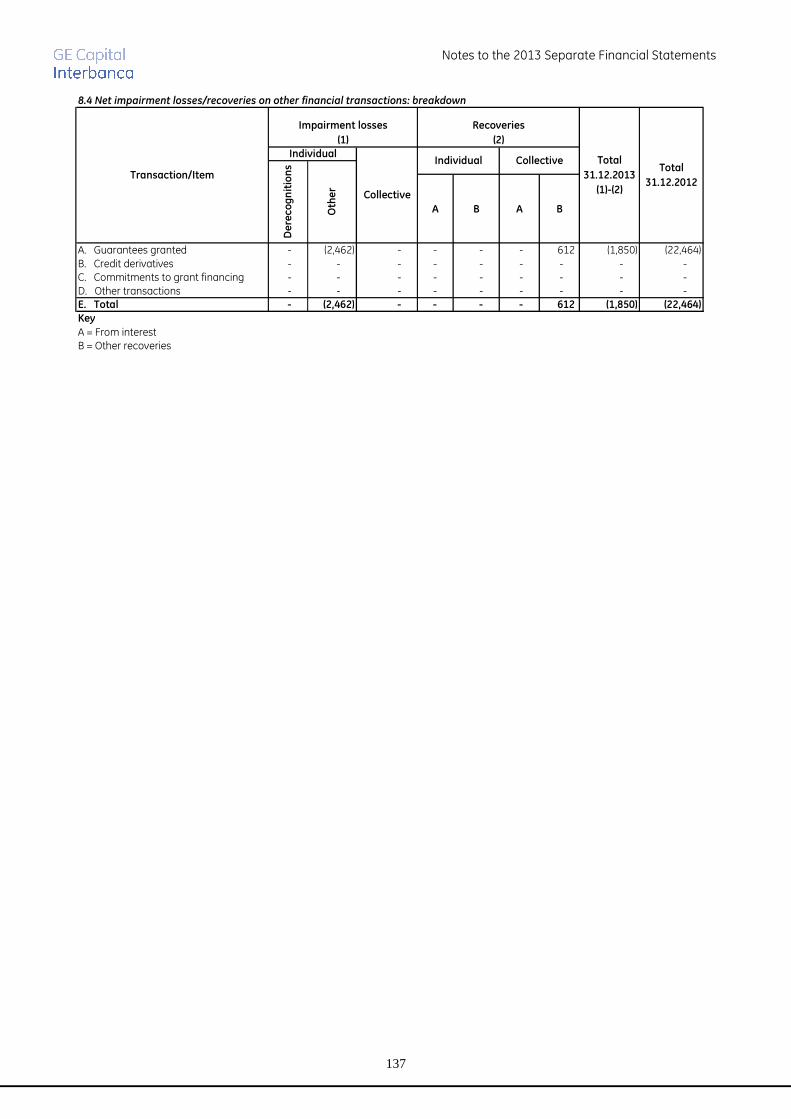
Notes to the 2013 Separate Financial Statements
137
A B A B
A. Guarantees granted - (2,462) - - - - 612 (1,850) (22,464) B. Credit derivatives - - - - - - - - - C. Commitments to grant financing - - - - - - - - - D. Other transactions - - - - - - - - - E. Total - (2,462) - - - - 612 (1,850) (22,464)
Key
A = From interestB = Other recoveries
Oth
er
Recoveries
(2)
Total
31.12.2013
(1)-(2)
8.4 Net impairment losses/recoveries on other financial transactions: breakdown
Impairment losses
(1)
Transaction/ItemTotal
31.12.2012
Individual
Collective
Individual Collective
De
rec
og
nit
ion
s
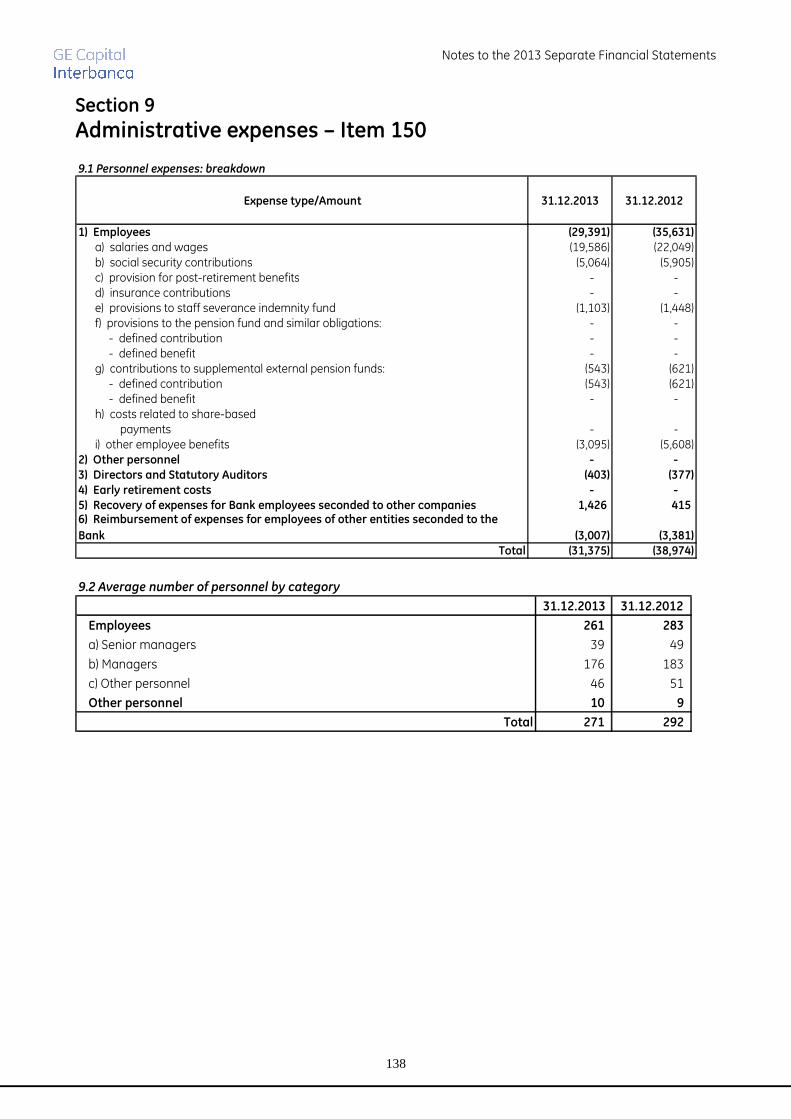
Notes to the 2013 Separate Financial Statements
138
Section 9
Administrative expenses – Item 150 9.1 Personnel expenses: breakdown
Expense type/Amount 31.12.2013 31.12.2012
1) Employees (29,391) (35,631)
a) salaries and wages (19,586) (22,049) b) social security contributions (5,064) (5,905) c) provision for post-retirement benefits - - d) insurance contributions - - e) provisions to staff severance indemnity fund (1,103) (1,448) f) provisions to the pension fund and similar obligations: - - - defined contribution - - - defined benefit - - g) contributions to supplemental external pension funds: (543) (621) - defined contribution (543) (621) - defined benefit - - h) costs related to share-based payments - - i) other employee benefits (3,095) (5,608) 2) Other personnel - -
3) Directors and Statutory Auditors (403) (377)
4) Early retirement costs - -
5) Recovery of expenses for Bank employees seconded to other companies 1,426 415 6) Reimbursement of expenses for employees of other entities seconded to the
Bank (3,007) (3,381)
Total (31,375) (38,974)
9.2 Average number of personnel by category
31.12.2013 31.12.2012
Employees 261 283
a) Senior managers 39 49
b) Managers 176 183
c) Other personnel 46 51
Other personnel 10 9
Total 271 292

Notes to the 2013 Separate Financial Statements
139
Expense type/Amount 31.12.2013 31.12.2012Leaving incentives ("una - tantum") (1,875) (3,792) Social contributions (641) (973) Stock options (178) (98) Banking sector solidaridity fund contribution (118) - Training and follow-up courses (57) (444) Other (226) (301)
Total (3,095) (5,608)
9.4 Other benefits in favour of employees
9.5 Other administrative expenses: breakdown
31.12.2013 31.12.2012
Costs for services from GE Group companies (9,805) (14,391) External consulting and professional services (6,012) (7,727) Leasing of equipment and software (4,788) (4,024) Outsourcing (2,687) (2,800) Rental and office expenses (1,373) (1,514) Information expenses (981) (985) Maintenance expenses (467) (1,005) Advertising and other promotional expenses (298) (474) Other costs (1,365) (1,629)
(27,776) (34,549)
Indirect taxes and duties: - substitute tax (DPR 601/73) (710) (639) - municipal property tax (381) (380) - stamp duty (47) (49) - other (158) (155)
(1,296) (1,223)
Total (29,072) (35,772)

Notes to the 2013 Separate Financial Statements
140
Section 10
Net provisions for risks and charges – Item 160
31.12.2013 31.12.2012
Provision for corporate and tax litigation (3,253) (4,935) Provision for employment litigation - (232) Provision for staff loyalty fund (132) (196) Other provision (481) -
Uses for surpluses during the year 3,156 63
Total (710) (5,300)
10.1 Net provisions for risks and charges: breakdown

Notes to the 2013 Separate Financial Statements
141
Section 11
Net adjustments to/recoveries on tangible assets – Item 170
Asset/Item Depreciation (a)Impairment
losses (b)Recoveries (c)
Net result
(a+b-c)A. Tangible assets A.1 Owned (1,418) - - (1,418) - for use (1,418) - - (1,418) - for investment - - - - A.2 Leased - - - - - for use - - - - - for investment - - - -
Total (1,418) - - (1,418)
11.1 Net adjustments to tangible assets: breakdown
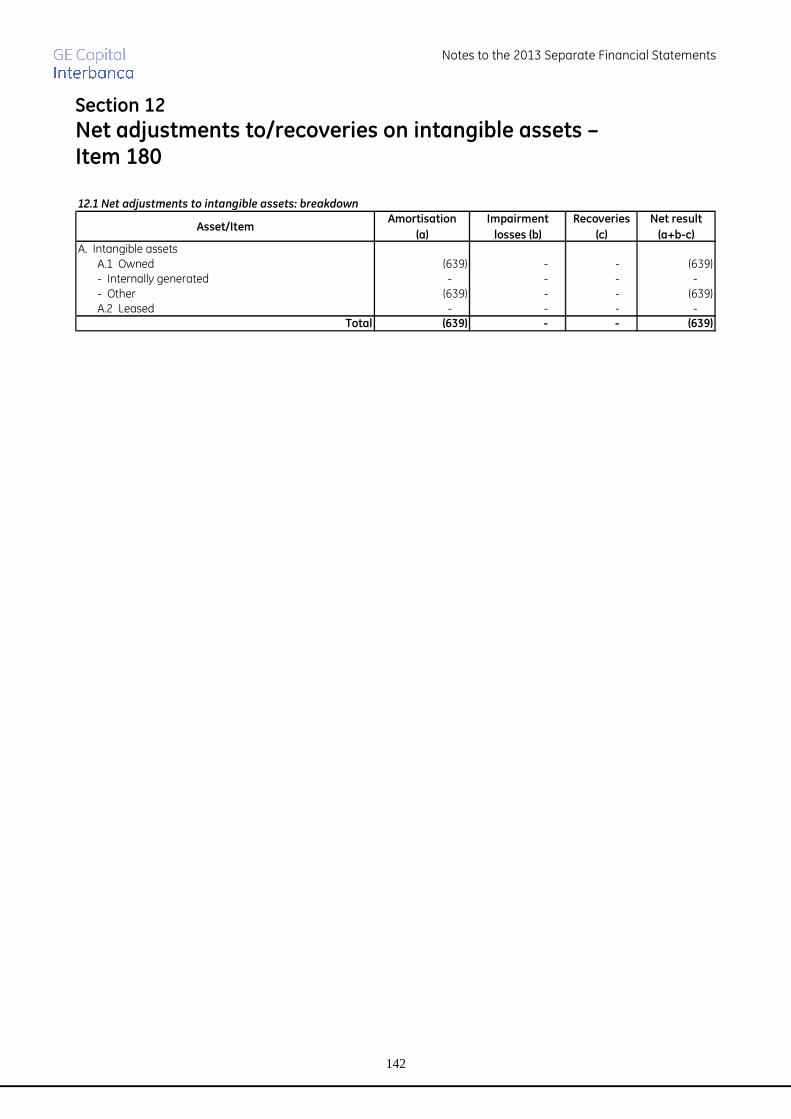
Notes to the 2013 Separate Financial Statements
142
Section 12
Net adjustments to/recoveries on intangible assets – Item 180
Asset/ItemAmortisation
(a)
Impairment
losses (b)
Recoveries
(c)
Net result
(a+b-c)A. Intangible assets A.1 Owned (639) - - (639) - Internally generated - - - - - Other (639) - - (639) A.2 Leased - - - -
Total (639) - - (639)
12.1 Net adjustments to intangible assets: breakdown
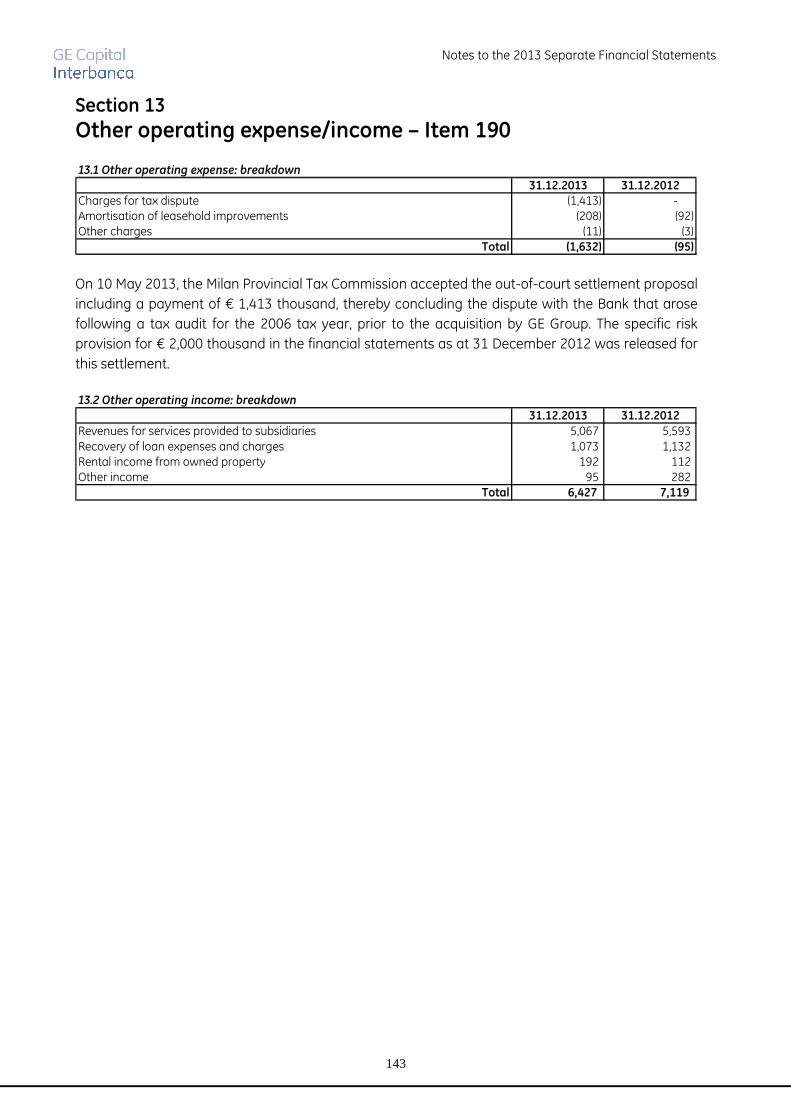
Notes to the 2013 Separate Financial Statements
143
Section 13
Other operating expense/income – Item 190
31.12.2013 31.12.2012
Charges for tax dispute (1,413) - Amortisation of leasehold improvements (208) (92) Other charges (11) (3)
Total (1,632) (95)
13.1 Other operating expense: breakdown
On 10 May 2013, the Milan Provincial Tax Commission accepted the out-of-court settlement proposal
including a payment of € 1,413 thousand, thereby concluding the dispute with the Bank that arose
following a tax audit for the 2006 tax year, prior to the acquisition by GE Group. The specific risk
provision for € 2,000 thousand in the financial statements as at 31 December 2012 was released for
this settlement.
31.12.2013 31.12.2012
Revenues for services provided to subsidiaries 5,067 5,593 Recovery of loan expenses and charges 1,073 1,132 Rental income from owned property 192 112 Other income 95 282
Total 6,427 7,119
13.2 Other operating income: breakdown
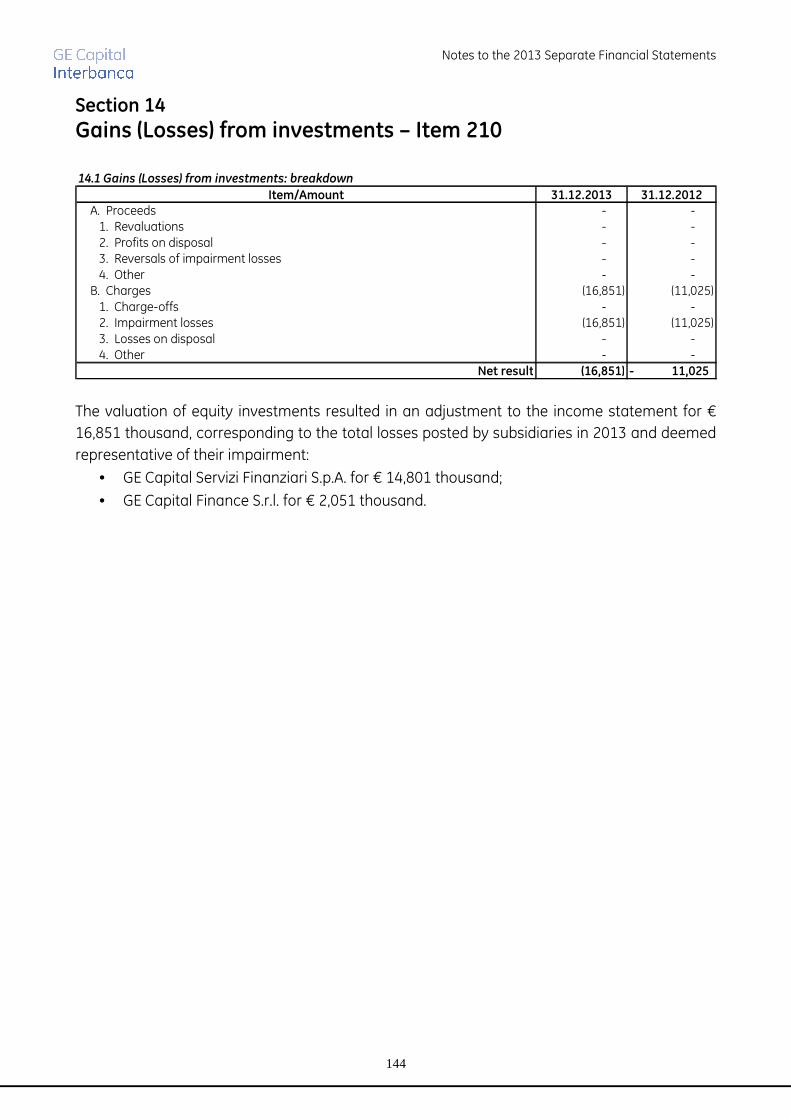
Notes to the 2013 Separate Financial Statements
144
Section 14
Gains (Losses) from investments – Item 210
Item/Amount 31.12.2013 31.12.2012
A. Proceeds - - 1. Revaluations - - 2. Profits on disposal - - 3. Reversals of impairment losses - - 4. Other - - B. Charges (16,851) (11,025) 1. Charge-offs - - 2. Impairment losses (16,851) (11,025) 3. Losses on disposal - - 4. Other - -
Net result (16,851) 11,025-
14.1 Gains (Losses) from investments: breakdown
The valuation of equity investments resulted in an adjustment to the income statement for €
16,851 thousand, corresponding to the total losses posted by subsidiaries in 2013 and deemed
representative of their impairment:
• GE Capital Servizi Finanziari S.p.A. for € 14,801 thousand;
• GE Capital Finance S.r.l. for € 2,051 thousand.
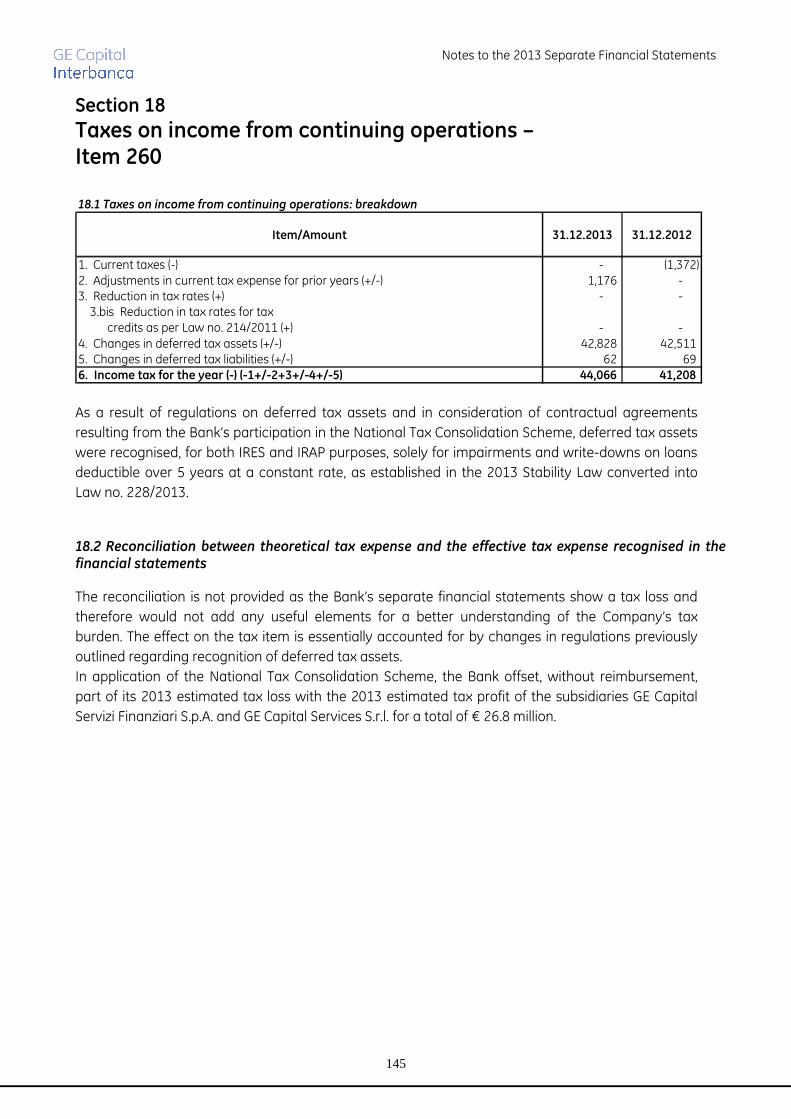
Notes to the 2013 Separate Financial Statements
145
Section 18
Taxes on income from continuing operations – Item 260
Item/Amount 31.12.2013 31.12.2012
1. Current taxes (-) - (1,372) 2. Adjustments in current tax expense for prior years (+/-) 1,176 - 3. Reduction in tax rates (+) - - 3.bis Reduction in tax rates for tax credits as per Law no. 214/2011 (+) - - 4. Changes in deferred tax assets (+/-) 42,828 42,511 5. Changes in deferred tax liabilities (+/-) 62 69 6. Income tax for the year (-) (-1+/-2+3+/-4+/-5) 44,066 41,208
18.1 Taxes on income from continuing operations: breakdown
As a result of regulations on deferred tax assets and in consideration of contractual agreements
resulting from the Bank’s participation in the National Tax Consolidation Scheme, deferred tax assets
were recognised, for both IRES and IRAP purposes, solely for impairments and write-downs on loans
deductible over 5 years at a constant rate, as established in the 2013 Stability Law converted into
Law no. 228/2013. 18.2 Reconciliation between theoretical tax expense and the effective tax expense recognised in the financial statements
The reconciliation is not provided as the Bank’s separate financial statements show a tax loss and
therefore would not add any useful elements for a better understanding of the Company’s tax
burden. The effect on the tax item is essentially accounted for by changes in regulations previously
outlined regarding recognition of deferred tax assets.
In application of the National Tax Consolidation Scheme, the Bank offset, without reimbursement,
part of its 2013 estimated tax loss with the 2013 estimated tax profit of the subsidiaries GE Capital
Servizi Finanziari S.p.A. and GE Capital Services S.r.l. for a total of € 26.8 million.

Notes to the 2013 Separate Financial Statements
146
(empty page)
Notes to the 2013 Separate Financial Statements
147
Part D
STATEMENT OF COMPREHENSIVE INCOME

Notes to the 2013 Separate Financial Statements
148
Statement of Comprehensive Income
Items Gross amount Income tax Net amount
10. Net profit (loss) for the year (172,335) 44,066 (128,269)
Other comprehensive income not reclassified to profit or loss: 126 (34) 92
20. Property, plant and equipment - - -
30. Intangible assets - - -
40. Defined benefit plans 126 (34) 92
50. Non-current assets classified as held for sale - - -
60. Portion of revaluation reserves from investments valued at equity- - -
Other comprehensive income after tax that may be reclassified to profit or loss:3,439 969 4,408
70. Hedges of foreign investments: - - -
a) fair value changes - - -
b) reclassification to profit or loss - - -
c) other changes - - -
80. Exchange differences: - - -
a) changes in value - - -
b) reclassification to profit or loss - - -
c) other changes - - -
90. Cash flow hedges: 60 (20) 40
a) fair value changes 60 (20) 40
b) reclassification to profit or loss - - -
c) other changes - - -
100. Available-for-sale financial assets: 3,379 989 4,368
a) fair value changes 3,379 989 4,368
b) reclassification to profit or loss - - -
- impairment losses - - -
- gains/losses on disposals - - -
c) other changes - - -
110. Non-current assets classified as held for sale: - - -
a) fair value changes - - -
b) reclassification to profit or loss - - -
c) other changes - - -
120. Portion of revaluation reserves from investments valued at equity:- - -
a) fair value changes - - -
b) reclassification to profit or loss - - -
- impairment losses - - -
- gains/losses on disposals - - -
c) other changes - - -
130. Total of other comprehensive income 3,565 935 4,500
140. Comprehensive income (Item 10+130) (168,770) 45,001 (123,769)
Analytical Statement of Comprehensive Income
NOTES TO THE 2013 SEPARATE FINANCIAL STATEMENTS
149
Part E
INFORMATION ON RISKS AND RISK MANAGEMENT POLICIES

NOTES TO THE 2013 SEPARATE FINANCIAL STATEMENTS
150
INTRODUCTION
The corporate governance bodies assume an essential role in risk management and control,
ensuring that the risks to which the Bank is exposed have been identified in terms of sources,
possible trends and necessary oversight. Specifically, these bodies formalise the reference
framework for determining risk propensity, risk management policies, and the risk management
process, ensure they are applied and periodically review them to ensure they are effective over time.
The Bank’s Board of Directors has the exclusive responsibility, which cannot be delegated, for the
strategic supervision and management of the Bank, which it exercises through the Chief Executive
Officer. The Board of Directors sets the general management guidelines and the strategic business
objectives for the Bank and the Banking Group, and develops the business and financial plans,
ensuring their implementation. In particular, the Board of Directors defines and approves: (i) the
Bank’s business model, (ii) the Bank’s strategic objectives, (iii) the risk objectives, the tolerance
threshold and the risk governance policies and (iv) guidelines for the internal control system.
The Bank’s Board of Statutory Auditors, who ensure adequate control, are responsible for overseeing
the accuracy, adequacy, functionality and reliability of the internal control system and the reference
framework for determining risk propensity.
The Chief Executive Officer (who also performs the role of General Manager), and senior
management with powers delegated by the bank, are responsible for strategic objectives, the
reference framework for determining risk propensity and the risk governance policies defined by the
strategic supervision body.
Additionally, specific internal committees were set up in the Bank that are primarily focused on
integrated risk control and validating that established objectives are met.
Specifically, the following committees are involved in risk management and control:
• Management Committee, which is primarily responsible for implementing the strategic initiatives
of the Board of Directors, assisting in the definition of management strategies, evaluating the
risk/return profile and variances from the objectives;
• Investments Committee, which functions as a consulting and decision-making body in the areas
of credit risk assumption and management and equity investments;
• Risk Committee, responsible for monitoring overall risks as well as proposing and defining
related management policies and processes, and compliance with operational limits for risk
assumption; On 19 December 2013, the Bank’s Board of Directors resolved to approve the establishment of the
Compensation Committee, setting the number of members at 3.
The Committee was assigned the task of making proposals, consulting, and monitoring issues related
to compensation and internal policies
The performance of the respective control activities is ensured by the Bank’s control functions.
Additionally, specific control duties were delegated to the Supervisory Board, established pursuant to
Legislative Decree no. 231/2001, and to the Executive charged with preparing the company’s
financial reports.
NOTES TO THE 2013 SEPARATE FINANCIAL STATEMENTS
151
PUBLIC DISCLOSURE On its internet site (www.gecapitalinterbanca.it), the Bank publishes both the 2013 Financial
Statements as well as "public disclosure" (3rd pillar of Basel II - Bank of Italy Circular no. 285), in which
it provides information regarding capital adequacy, risk exposure and the general characteristics of
systems for identifying, measuring and managing risk.

NOTES TO THE 2013 SEPARATE FINANCIAL STATEMENTS
152
Section 1
Credit Risk
Qualitative disclosure
1. General characteristics
2013 was characterised by the continued consolidation of the Bank’s functional and production
structures as well as the standardisation of operating activities related to risk assumption,
specifically as related to prudential management and management of the current portfolio.
Specifically, the commitment was focused on stricter valuation parameters in the assumption of new
risk through initiatives aimed at achieving higher quality standards in the new portfolio, in light of
adverse conditions in the market, and re-launching the business through investments that
strengthen the commercial structure as well as the monitoring and control functions.
The role of Relationship Banker was further enhanced, as the single point of reference for the
customer.
The product range was expanded in order to meet market needs and commercial agreements were
put in place with financial counterparties to increase the distribution channels for Banking Group
products.
The activities and actions taken in terms of both organisation and process as part of risk
management and monitoring, as well as new specific tools for integrated measurement of credit and
financial risks to ensure more effective risk control, were important developments during the year.
2. Credit risk management policies
2.1 Organisational aspects In general, the lending process as a whole follows the standard organisational criterion consisting of
the operating phases, roles and responsibilities described below, with certain specific characteristics
depending on different products/portfolios:
Credit approval:
o The Commercial unit identifies the possibility of new transactions in compliance with the
strike zone approved by the Board of Directors based on its defined risk appetite;
o The Underwriting unit analyses the requests for new loans from Commercial units and
develops a loan proposal to be submitted to the competent deliberating body, ensuring the
application of the Banking Group’s credit and risk management policies, expressing an
overall opinion based on the analyses performed of the proposed loan structure and any
guarantees provided; in this phase, a specific rating is assigned to each customer.
The controls envisaged by legislative and regulatory requirements related to “Related
Parties” and “banking representatives” are performed in the underwriting phase;
o The deliberating bodies make their decision on the requested loan based on their
respective authorisation level. A resolution by the Board of Directors is required for credit
approval to related/associated parties, with an opinion from the Independent Director of
the Banking Group when required.
NOTES TO THE 2013 SEPARATE FINANCIAL STATEMENTS
153
The Loan execution process includes notifying the customer regarding the approval of the loan and
its characteristics, followed by the stipulation of the contract, activities related to acquiring any
guarantees and the disbursement of the approved loan. In these activities, the Risk Underwriting unit
is supported by the Legal and Operations departments, who are responsible for preparing the
approved contracts, as well as controlling for the proper fulfilment of all activities leading up to loan
disbursement.
Loan management is performed by the Risk – Portfolio Management unit for performing customers,
and principally includes activities related to:
o Reviewing, through periodic controls of credit positions to verify trends, any variations from
the valuations made in the underwriting phase or from the latest revision of the position,
with continual reference to timeliness of repayments, status of the relationship, trends
reported by the Italian Central Credit Register, and updates to the reputational profile.
During the periodic valuation of positions, contractual covenant compliance is also
reviewed and, on the basis of the analysis, the customer’s rating or risk class may be
changed. These activities are aimed at anticipating problematic cases and providing
adequate reporting to the competent decision-taking bodies.
If a credit position shows objective signs of repayment problems, it is transferred to the Risk
- Workout & Credit Recovery unit, specialised in managing impaired transactions;
o Creation and management of a watchlist of customer names that, while still considered
performing, have given indications that warrant more stringent monitoring;
o Periodic updating of the value of mortgage guarantees using assessments from
independent third parties;
o Valuation and preparation of change proposals (guarantee restrictions, new payment
schedules, assumptions, etc.) with respect to the original loan characteristics.
These proposals are then reviewed by the competent decision-taking body.
Monitoring and management of impaired loans is carried out by the Risk — Workout and Credit
Recovery team to optimise loan recovery.
The main activities involve:
o Management of impaired loans, carried out by:
− taking all initiatives deemed necessary for loan recovery, in
collaboration with the Bank’s Legal department and making use of external attorneys if
necessary, with the aim of returning the customer to performing status;
− adopting all extra-judicial actions necessary for loan recovery, including disposal and
restructuring transactions on said loans.
These activities are performed through the careful monitoring of customer performance, historical
trends in delinquent payments, issues reported to the Italian Central Credit Register, and the
updating of the reputational profile.
On basis of issues that arose during monitoring, the possibility of assigning a different regulatory risk
classification, consistent with the borrower's situation, is reviewed.
Impairment tests are carried out using the Discounted Cash Flow Method, for customers with issues
but who are still operational, or with the Liquidation Value Method, when the value of the guarantee
is a certain source for recovering the position. In this phase, recovery times are estimated and any
provision proposals are prepared.
Additionally, the value of the mortgage guarantee is periodically updated, using assessments
provided by independent third parties and adjusted where necessary to consider any losses that
would result from the disposal process.

NOTES TO THE 2013 SEPARATE FINANCIAL STATEMENTS
154
The bodies and key functions of the Bank that preside over the lending process are listed below, with
a brief description of their specific responsibilities.
• Board of Directors:
o Oversees the establishment of the Group’s strategic objectives, guiding proposals
formulated by other Group companies regarding lending policies;
o Defines criteria for recognising, assessing and managing risk;
o Approves authorisation levels and signatory powers attributed to bodies and functions of
the Parent Company with respect to approving and modifying loans;
o Sets its risk appetite through the delegation system, indicating excluded sectors and
approving a strike zone that identifies the characteristics of target products;
o Grants the Chief Risk Officer of the Parent Company Bank the responsibility of ensuring
the consistency of the system of powers delegated to Group companies, as part of its
prerogatives of management and control, in accordance with the various attributes of
the products disbursed and the customer type.
• Senior Management:
o Implements the strategies and policies established by the Board of Directors;
o Develops the rules, procedures and organisational structures to ensure the adoption and
maintenance of an efficient lending process and the related risk control framework;
o Takes decisions based on its independence, including through the appropriate technical
Committees;
o Guides and coordinates management activities of Group companies.
• Risk Committee of the Parent Company Bank, with the following key responsibilities:
o Propose and define risk management policies, rating models, financial capital and, more
generally, capital adequacy;
o Ensure a single and global approach to risk governance, by applying the policies,
processes and controls approved by the Board of Directors, in order to contain, to the
extent possible, the risk of unexpected losses or damage to the Group's image;
o Ensure compliance with envisaged limits and delegations by risk type for the Bank and
the Group, taking the necessary initiatives regarding the approach to risk where
necessary, specifically for credit risks in reference to the loan portfolio, derivative
products and equity investments, evaluating the triggers and proposals for taking
appropriate actions for risk mitigation;
o Monitor information flows on Banking Group risk performance, including regulatory limits
on credit risk concentration, evaluating actions deemed useful to ensure capital
adequacy for the Bank and the Banking Group.
• The Commercial Area is responsible for coordinating, monitoring and evaluating the commercial
and distribution activities of the Bank and Group. In this context, the commercial structure
manages the relationship with the customer in the loan process, and, through the Relationship
Banker, assumes the role of interfacing with specialised Group structures.
In general, the commercial structure activities are supported by the:
o Direct network, consisting of the branches and specialised teams of the Parent Company
Bank dedicated to the Commercial Banking and Corporate Finance products;
o Indirect network for the development of the subsidiaries’ commercial activities.
The Commercial Area ensures that the commercial, profitability, risk and service level objectives
are met that the Bank established in its strike zone. This area also develops, through the Group’s
organisational units, commercial initiatives of various products and services for customers,
directly or through partnership agreements.

NOTES TO THE 2013 SEPARATE FINANCIAL STATEMENTS
155
• Risk Area:
o Promotes the risk policies and develops the procedures and updated delegation system,
for the Board of Directors’ approval;
o Ensures the appropriate supervision of risk (acceptance, measurement, control and
reporting) as well as compliance with regulatory provisions;
o Manages credit litigation with the support of the Legal & Regulatory department.
2.2 Systems for management, measurement and monitoring Activities related to approval, management, measurement and control of the loan portfolio depend
on the type of product/customer brokered.
The principles of prudence that guide loan approval policies are represented in the risk appetite
established by the Board of Directors regarding the general criteria and limits for credit risk
assumption.
Generally, the aforementioned criteria define:
o Standard characteristics of “commercialisable” products, included in approved lists by
the Board of Directors;
o Maximum permitted durations for loans;
o Geographic restrictions by country or region;
o Restrictions on industrial sectors that may be financed, for both profitability (risk-return)
reasons as well as ethical-reputational;
o Loan approval methodologies and allowable delegations in the various process stages;
o Standing of the potential target customer, the reputational profile of the loan applicant
and the identification of the effective borrower;
o Specific decision-taking procedures in the event the potential target customer or the
legal/economic Group to which the customer belongs are included in the cases provided
by IAS 24, business representatives (art.136 Consolidated Banking Act), or related parties
(prudential supervision provisions – Circular no. 263, Heading V, Section V);
o Exposure of the loan applicant and the legal/financial Group to which the applicant
belongs:
- within GE Capital Group, in order to define the application of delegation of
powers;
- within the GE Capital Interbanca Banking Group, to monitor concentration limits;
o Creditworthiness of each transaction based on the expected recovery capacity of the
customer;
o General characteristic of the transaction, in particular reference to reviews conducted to
prohibit the financing of transactions that involve risks for the environment, or public
health and safety risks, or the reputation of the Banking Group, or money-laundering and,
more generally, financing terrorism or criminal activities;
o Financing approval methodologies developed for new products or industrial, market and
guarantee sectors;
o Classification methods of watchlist positions;
o Definitions used to classify and monitor problem positions;
o Rating level assigned to the customer, together with the related Probability of Default (PD)
and Loss Given Default (LGD) risk factors;
o Criteria for carrying out the impairment test and quantification of any allowances made
to credit risk provisions.

NOTES TO THE 2013 SEPARATE FINANCIAL STATEMENTS
156
Internal controls
With regard to portfolio control activities, loans to customers are monitored by the Risk - Portfolio
Management & Workout area, which is responsible for continual and pro-active verification of
customers’ positions based on:
o Periodically reviewing credit positions in order to review performance;
o Assigning any changes to ratings and reputational profiles based on issues that
emerge after the contract stipulation;
o Reviewing covenants;
o Identifying and monitoring risk factors that may impact the ability of the customer to
repay the loan;
o Periodic monitoring of outstanding instalments in order to anticipate any issues that
may arise in terms of the customer’s solvency;
o Monitoring exposures with individual customers and their legal/financial groups with
respect to regulatory or internal individual/consolidated limits for risk concentration;
loans are monitored monthly in order to identify anomalous trends and anticipate
their negative effects.
The Bank requires each credit exposure of each customer to be classified in terms of its risk,
according to shared metrics that comply with regulatory risk classifications.
The risk classification is initially assigned during the approval phase of a new deal and is
subsequently updated on a continual basis as part of portfolio monitoring and management
activities.
The classification is assigned in respect of the regulatory risk classification standards, establishing for
each investment:
o The risk classification envisaged by Bank of Italy;
o The quality of any guarantees provided by the customer.
An internal rating is also assigned for all credit risk exposures.
The ratings assigned to each customer are part of the credit evaluation process in the stages of
approval, revision, management and monitoring of the portfolio, and are used to estimate expected
losses, as part of the capital allocation process, in stress tests, in various risk analyses and in
producing internal and external reports.
The Bank uses its own rating system (which is not, however, used to calculate the capital needed to
offset credit risks), consisting of seven levels. This system is based on qualitative criteria and provides
useful indications for the classification of structured finance transactions (project finance, acquisition
finance and real estate financing), and includes quantitative criteria that allow for better
management of the rating attribution process.
Ratings are assigned to the Bank’s performing customers upon each decision taken with regard to
the application (decision to grant a new loan, waiver or contractual amendment decision, etc.).
Periodically, assigned ratings are reviewed based on the latest financial statements, reports made to
the Italian Central Credit Register, or any other factor that may influence the creditworthiness of the
counterparty. Customers assigned a rating of “7 - Sufficient” are included in the watchlist, which
includes exposures to customers for which management has requested a higher level of attention.
Along with the internal ratings described above, product ratings are also used by applying GE Group
methodologies, differentiated by product/borrower type. The primary model for Corporate customers
is Moody’s RiskCalc model, along with other models for smaller companies/customers or for specific
products.
NOTES TO THE 2013 SEPARATE FINANCIAL STATEMENTS
157
The “letter” rating thus obtained, or a letter that reflects the attribution scale of the respective
international rating agencies, is then converted into the Obligor Rating (OR) value scale used
operationally within General Electric Group.
The Bank’s Enterprise Risk Management (ERM) department is completing an internal project to
develop a rating system for Italian Corporate customers based on insolvency risk valuations provided
by Cerved Group, which was granted ECAI recognition by Bank of Italy in February 2010 in
accordance with the prudential supervision provisions for banks, Circular no. 263/2006. In carrying
out this project, the periodic reporting produced for the Board of Directors, the Risk Committee and
the Chief Risk Officer is particularly significant.
More specifically, information is produced on all outstanding transactions that analyse, for each
product/customer type:
o Trends in the key loan positions and/or portfolios;
o The loan portfolio positioning, providing various views of the breakdown of the entire
portfolio by type of business segment;
o Trends in performing and non-performing loans;
o Details on non-performing positions;
o Waivers on loan instalments or specific charge-offs made;
o Overall trend in provisions and forecasted valuation of the expected portfolio
performance, specifically with regard to expected losses.
2.3 Techniques for mitigating credit risk
In order to align credit risks with lending policies, the Bank seeks to support credit lines with
appropriate guarantees and other risk mitigation measures.
Generally, based on the specific product characteristics, the Bank obtains collateral commensurate
with the standing of the borrower and the type/duration of the credit exposure, which includes
mortgage guarantees, liens of plants and machinery, pledges, surety bonds, credit insurance and
collateral.
The Bank updates the value of mortgage guarantees using appraisals conducted by independent
third parties on an annual basis for significant transactions.
2.4 Non-performing financial assets
The Risk - Portfolio Management & Workout area ensures the timely updating of loans classified as
impaired in the various risk categories established by regulatory instructions and recorded in
financial statements as impaired loans.
Impaired loans are identified based on the impairment policy guidelines, in general due to significant
unfavourable events, such as considerable deterioration in company performance, restructuring of
contractual terms, or prolonged observation status.
After one or more of the aforementioned signs of deterioration have been verified, the Bank
determines the amount of any write-down to the loan, using valuation techniques differentiated by
type and condition of the position under consideration. If the test does not confirm the existence of
impairment, a percentage of the write-down is applied to the position based on estimated lump-sum
parameters.
The summary of proposed provisions is periodically reviewed by the Investments Committee, as are
the individual proposals that require, for subsequent approval, delegation levels assigned to the CRO,
to two Bank Directors or to the Board of Directors.

NOTES TO THE 2013 SEPARATE FINANCIAL STATEMENTS
158
At regular intervals, the Bank’s Chief Risk Officer and Chief Financial Officer coordinate the process to
review the adequacy of provisions made, in order to ensure consistency with the overall risk profile of
the impaired portfolio.
Management activities for the impaired portfolio are distinguished based on the significance of the
position under consideration, through undertaking all activities to bring it back to performing status,
any restructuring of the positions, as well as necessary judicial and extra-judicial actions to recover
the non-performing positions.

NOTES TO THE 2013 SEPARATE FINANCIAL STATEMENTS
159
Quantitative disclosure
A. Credit quality
A.1 Performing and non-performing loan exposures: amounts, adjustments, trends,
segmentation by performance and geography
Portfolio/Quality
No
n-
pe
rfo
rmin
g
Su
b-s
tan
da
rd
Re
stru
ctu
red
Imp
air
ed
Pa
st
du
e
No
t Im
pa
ire
d
Pa
st d
ue
Oth
er
ass
ets
To
tal
1. Financial assets held for trading 3 5,719 - - 230 44,058 50,010
2. Financial assets available for sale - - - - 45,404 45,404
3. Financial assets held to maturity - - - - - -
4. Due from banks - - - - 226,274 226,274
5. Loans to customers 131,451 313,408 53,002 46,968 125,753 1,444,369 2,114,951
6. Financial assets designated at fair value through profit and loss - - - - - -
7. Financial assets under disposal - - - - - -
8. Hedging derivatives - - - - 494 494
Total 31.12.2013 131,454 319,127 53,002 46,968 125,983 1,760,599 2,437,133
Total 31.12.2012 147,995 265,821 44,411 76,302 449,804 2,097,657 3,081,990
A.1.1 Breakdown of financial assets by portfolio classification and credit quality
(book value)
Gro
ss e
xpo
sure
Ind
ivid
ua
l
ad
just
me
nts
Ne
t e
xpo
sure
Gro
ss e
xpo
sure
Co
lle
ctiv
e
ad
just
me
nts
Ne
t e
xpo
sure
1. Financial assets held for trading 11,656 5,934 5,722 x x 44,288 50,010
2. Financial assets available for sale 15,243 15,243 - 45,404 - 45,404 45,404
3. Financial assets held to maturity - - - - - - -
4. Due from banks - - - 226,274 - 226,274 226,274
5. Loans to customers 1,192,930 648,101 544,829 1,625,766 55,644 1,570,122 2,114,951
6. Financial assets designated at fair value through profit and loss - - - x x - -
7. Financial assets under disposal - - - - - - -
8. Hedging derivatives - - - x x 494 494
Total 31.12.2013 1,219,829 669,278 550,551 1,897,444 55,644 1,886,582 2,437,133
Total 31.12.2012 1,117,383 582,854 534,529 2,538,054 59,240 2,547,461 3,081,990
A.1.2 Breakdown of financial assets by portfolio classification and credit quality (gross and net values)
To
tal
(ne
t e
xpo
sure
)
Portfolio/Quality
Impaired assets Performing

NOTES TO THE 2013 SEPARATE FINANCIAL STATEMENTS
160
A.1.3 On- and off-balance sheet exposures to banks: gross and net values
Type of exposure/AmountGross
exposure
Individual
impairment
Collective
impairmentNet exposure
A. On-Balance Sheet exposures
a) Non-performing loans - - x - b) Sub-standard loans - - x - c) Restructured exposures - - x - d) Past due exposures - - x - b) Other assets 226,274 x - 226,274
Total A 226,274 - - 226,274
B. Off-Balance Sheet exposures a) Non-performing - - x - b) Other 12,590 x - 12,590
Total B 12,590 - - 12,590
Total (A+B) 238,864 - - 238,864
A.1.6 On- and off-balance sheet exposures to customers: gross and net values
Type of exposure/AmountGross
exposure
Individual
impairment
Collective
impairmentNet exposure
A. On-Balance Sheet exposures
a) Non-performing loans 524,035 392,584 x 131,451 b) Sub-standard loans 532,711 219,302 x 313,409 c) Restructured exposures 103,303 50,301 x 53,002 d) Past due exposures 48,124 1,157 x 46,967 b) Other assets 1,671,170 x 55,644 1,615,526
Total A 2,879,343 663,344 55,644 2,160,355
B. Off-Balance Sheet exposures a) Non-performing 101,604 21,697 x 79,907 b) Other 249,134 x 2,272 246,862
Total B 350,738 21,697 2,272 326,769
Total (A+B) 3,230,081 685,041 57,916 2,487,124

NOTES TO THE 2013 SEPARATE FINANCIAL STATEMENTS
161
Causes/CategoriesNon-
performing
Sub-
standardRestructured Past due
A. Gross opening exposures 526,783 443,287 63,201 64,018
-of which: exposures sold not derecognised - - - -
B. Increases 70,234 260,788 96,348 47,303
B.1 inflows from performing exposures 190,259 5,864 45,166 B.2 transfers from other categories of impaired exposures 63,756 62,807 60,890 1,710 B.3 other increases 6,478 7,722 29,594 427 C. Decreases 72,982 171,364 56,246 63,197
C.1 outflows to performing exposures - 785 - 16,590 C.2 derecognitions 57,278 5,516 29,324 C.3 collections 15,704 39,687 6,876 2,866 C.4 gains on disposal - - - - C.4 bis losses on disposal - - - C.5 transfers to other categories of impaired exposures 125,376 20,046 43,741 C.6 other decreases - - - -
D. Gross closing exposure 524,035 532,711 103,303 48,124
-of which: exposures sold not derecognised - - - -
A.1.7 On-balance sheet credit exposures to customers: changes in gross impaired exposures
Causes/CategoriesNon-
performing
Sub-
standardRestructured Past due
A. Total adjustments: opening balance 378,788 181,459 19,094 735
-of which: exposures sold not derecognised - - - -
B. Increases 80,154 114,574 67,414 1,582
B.1 impairment losses 44,645 104,117 469 1,567
B.1 bis losses on disposal - - - -
B.2 transfers from other categories
of impaired exposures 34,171 4,652 34,102 15
B.3 other increases 1,338 5,805 32,843 -
C. Decreases 66,358 76,731 36,207 1,160
C.1 reversals of impairment losses 7,276 1,947 465 460
C.2 recoveries on repayments 1,804 993 2,215 -
C.2 bis profits on disposal - - - -
C.3 derecognitions 57,278 5,516 29,324 -
C.4 transfers to other categories
of impaired exposures - 68,275 4,203 462
C.5 other decreases - - - 238
D. Total adjustments 392,584 219,302 50,301 1,157
-of which: exposures sold not derecognised - - - -
A.1.8 On-balance sheet credit exposures to customers: changes in total adjustments
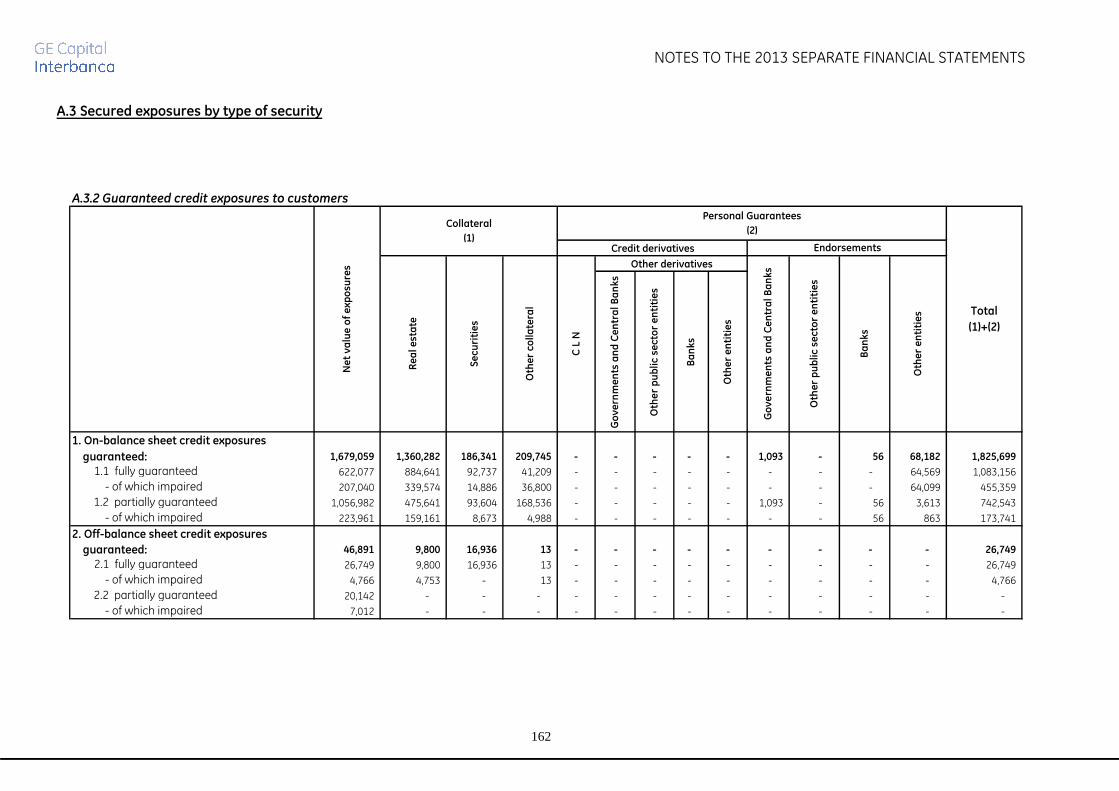
NOTES TO THE 2013 SEPARATE FINANCIAL STATEMENTS
162
A.3 Secured exposures by type of security
A.3.2 Guaranteed credit exposures to customers
Go
ve
rnm
en
ts a
nd
Ce
ntr
al
Ba
nk
s
Oth
er
pu
bli
c se
cto
r e
nti
tie
s
Ba
nk
s
Oth
er
en
titi
es
1. On-balance sheet credit exposures
guaranteed: 1,679,059 1,360,282 186,341 209,745 - - - - - 1,093 - 56 68,182 1,825,699
1.1 fully guaranteed 622,077 884,641 92,737 41,209 - - - - - - - - 64,569 1,083,156
- of which impaired 207,040 339,574 14,886 36,800 - - - - - - - - 64,099 455,359
1.2 partially guaranteed 1,056,982 475,641 93,604 168,536 - - - - - 1,093 - 56 3,613 742,543
- of which impaired 223,961 159,161 8,673 4,988 - - - - - - - 56 863 173,741
2. Off-balance sheet credit exposures
guaranteed: 46,891 9,800 16,936 13 - - - - - - - - - 26,749
2.1 fully guaranteed 26,749 9,800 16,936 13 - - - - - - - - - 26,749
- of which impaired 4,766 4,753 - 13 - - - - - - - - - 4,766
2.2 partially guaranteed 20,142 - - - - - - - - - - - - -
- of which impaired 7,012 - - - - - - - - - - - - -
Total
(1)+(2)
Credit derivatives Endorsements
Other derivatives
Go
ve
rnm
en
ts a
nd
Ce
ntr
al
Ba
nk
s
Oth
er
pu
bli
c se
cto
r e
nti
tie
s
Collateral
(1)
Ne
t v
alu
e o
f e
xpo
sure
s
Personal Guarantees
(2)
Re
al
est
ate
Se
curi
tie
s
Oth
er
coll
ate
ral
C L
N
Ba
nk
s
Oth
er
en
titi
es

NOTES TO THE 2013 SEPARATE FINANCIAL STATEMENTS
163
B. Breakdown and concentration of loans
Ne
t e
xpo
sure
Ind
ivid
ua
l ad
just
me
nts
Co
lle
ctiv
e a
dju
stm
en
ts
Ne
t e
xpo
sure
Ind
ivid
ua
l ad
just
me
nts
Co
lle
ctiv
e a
dju
stm
en
ts
Ne
t e
xpo
sure
Ind
ivid
ua
l ad
just
me
nts
Co
lle
ctiv
e a
dju
stm
en
ts
Ne
t e
xpo
sure
Ind
ivid
ua
l ad
just
me
nts
Co
lle
ctiv
e a
dju
stm
en
ts
Ne
t e
xpo
sure
Ind
ivid
ua
l ad
just
me
nts
Co
lle
ctiv
e a
dju
stm
en
ts
Ne
t e
xpo
sure
Ind
ivid
ua
l ad
just
me
nts
Co
lle
ctiv
e a
dju
stm
en
ts
A. On-balance sheet exposures
A.1 Non-performing loans - - x - - x 3,084 13,992 x - - x 127,208 374,518 x 1,159 4,074 x
A.2 Sub-standard loans - - x - - x 9,298 1,586 x - - x 303,925 217,502 x 186 214 x
A.3 Restructured loans - - x - - x - - x - - x 53,002 50,301 x - - x
A.4 Past due exposures - - x - - x - - x - - x 46,947 1,157 x 20 - x
A.5 Other exposures 50,824 x 158 16 x - 122,618 x 3,581 - x - 1,419,430 x 51,264 22,638 x 641
TOTAL A 50,824 - 158 16 - - 135,000 15,578 3,581 - - - 1,950,512 643,478 51,264 24,003 4,288 641
B. Off-balance sheet exposures
B.1 Non-performing loans - - x - - x - - x - - x 3 145 x - - x
B.2 Sub-standard loans - - x - - x 151 4 x - - x 30,353 11,051 x - - x
B.3 Other impaired assets - - x - - x - - x - - x 49,400 10,497 x - - x
B.4 Other exposures - x - - x - 7,757 x 7 - x - 239,105 x 2,265 - x -
TOTAL B - - - - - - 7,908 4 7 - - - 318,861 21,693 2,265 - - -
TOTAL 31.12.2013 50,824 - 158 16 - - 142,908 15,582 3,588 - - - 2,269,373 665,171 53,529 24,003 4,288 641
TOTAL 31.12.2012 50,945 - 182 112 - 2 249,041 26,176 4,837 - - - 2,741,785 596,347 56,559 31,131 4,669 545
Other public sector
entitiesFinancial companies
B.1 Breakdown of on- and off-balance sheet exposures to customers by segment (book value)
Insurance companies Non-financial companies Other entities
Exposure/Counterparty
Governments

Notes to the 2013 Separate Financial Statements
164
Ne
t e
xpo
sure
To
tal
imp
air
me
nts
Ne
t e
xpo
sure
To
tal
imp
air
me
nts
Ne
t e
xpo
sure
To
tal
imp
air
me
nts
Ne
t e
xpo
sure
To
tal
imp
air
me
nts
Ne
t e
xpo
sure
To
tal
imp
air
me
nts
A. On-balance sheet exposures
A.1 Non-performing loans 131,451 390,822 - 1,762 - - - - - -
A.2 Sub-standard loans 301,569 204,687 7,243 7,934 4,597 6,681 - - - -
A.3 Restructured loans 53,002 50,301 - - - - - - - -
A.4 Past due exposures 43,927 1,120 3,040 37 - - - - - -
A.5 Other exposures 1,456,465 51,172 63,184 1,671 95,877 2,801 - - - -
Total A 1,986,414 698,102 73,467 11,404 100,474 9,482 - - - -
B. Off-balance sheet exposures
B.1 Non-performing loans 3 145 - - - - - - - -
B.2 Sub-standard loans 30,504 11,055 - - - - - - - -
B.3 Other impaired assets 49,400 10,497 - - - - - - - -
B.4 Other exposures 233,796 2,207 13,066 65 - - - - - -
Total B 313,703 23,904 13,066 65 - - - - - -
TOTAL 31.12.2013 2,300,117 722,006 86,533 11,469 100,474 9,482 - - - -
TOTAL 31.12.2012 2,775,993 671,263 159,101 7,634 137,920 10,420 - - - -
B.2 Breakdown of on- and off-balance sheet exposures to customers by geographic area (book value)
AsiaOther
countries
Exposure/Geographic area
Italy Other EU countries America
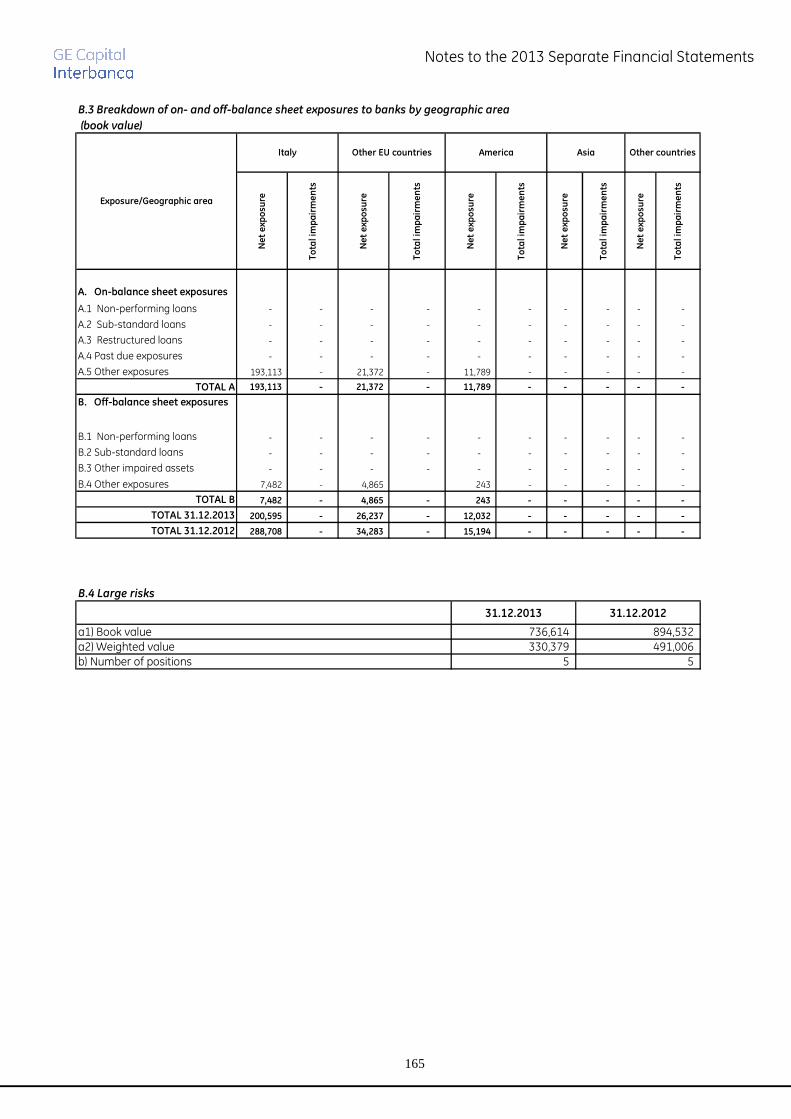
Notes to the 2013 Separate Financial Statements
165
Ne
t e
xpo
sure
To
tal i
mp
air
me
nts
Ne
t e
xpo
sure
To
tal i
mp
air
me
nts
Ne
t e
xpo
sure
To
tal i
mp
air
me
nts
Ne
t e
xpo
sure
To
tal i
mp
air
me
nts
Ne
t e
xpo
sure
To
tal i
mp
air
me
nts
A. On-balance sheet exposures
A.1 Non-performing loans - - - - - - - - - -
A.2 Sub-standard loans - - - - - - - - - -
A.3 Restructured loans - - - - - - - - - -
A.4 Past due exposures - - - - - - - - - -
A.5 Other exposures 193,113 - 21,372 - 11,789 - - - - -
TOTAL A 193,113 - 21,372 - 11,789 - - - - -
B. Off-balance sheet exposures
B.1 Non-performing loans - - - - - - - - - -
B.2 Sub-standard loans - - - - - - - - - -
B.3 Other impaired assets - - - - - - - - - -
B.4 Other exposures 7,482 - 4,865 243 - - - - -
TOTAL B 7,482 - 4,865 - 243 - - - - -
TOTAL 31.12.2013 200,595 - 26,237 - 12,032 - - - - -
TOTAL 31.12.2012 288,708 - 34,283 - 15,194 - - - - -
B.3 Breakdown of on- and off-balance sheet exposures to banks by geographic area
(book value)
Asia Other countries
Exposure/Geographic area
Italy Other EU countries America
31.12.2013 31.12.2012
a1) Book value 736,614 894,532 a2) Weighted value 330,379 491,006 b) Number of positions 5 5
B.4 Large risks

Notes to the 2013 Separate Financial Statements
166
Section 2
Market Risk
2.1 Interest rate risk and price risk – Trading book for regulatory
capital purposes
Interest rate risk
Qualitative disclosure
A. General characteristics
The trading book is managed to contain the risk position, with no speculative transactions being
made.
In 2013, consistent with internal policies prohibiting any type of speculative transaction, the trading
book was made up of residual transactions from Corporate Desk activities (sold in 2009) in which
derivative contracts were offered to customers to hedge financial risks they had assumed. These
transactions were simultaneously hedged, in order to cancel the market risk on the Bank’s books
with back-to-back transactions.
B. Management procedures and measurement of interest rate risk
The process of managing and controlling market risk is carried out on different levels of the
organisational structure. The essential role of managing and controlling market risk is the
responsibility of the Board of Directors, who defines the objectives and strategies for risk assumption.
Upon proposal of the Risk Committee, the Board of Directors approves the ALCO Policy that defines
the guidelines, risk limits and market risk control procedures.
The ALCO policy is implemented in the operations:
� By the Risk Committee, for defining the monitoring and control policies and for planning and
defining any actions to return to the defined limits;
� By the ALCO Technical Committee, for the monitoring and control of risk positions;
� By Treasury, for operational functions;
� By the Risk department, for monitoring and controlling market risk.
The ALCO Committee meets monthly to supervise the market risk monitoring activities.
GE Capital Interbanca S.p.A.’s trading book is monitored daily in terms of the VaR model Market Risk.
VaR is a statistically-based estimate of potential losses caused by changes in risk factors to which
the trading book is exposed over a predefined time horizon (holding period) and with a specific level
of statistical confidence. Following a prudent approach, the Bank assumes a 99% confidence level
and a one working day holding period as the key parameters in its VaR model.
In calculating the VaR, the Bank adopts the historical simulation methodology with a series of data
equivalent to two years.
The Bank does not currently use an internal market risk management model to determine prudent
capital requirements, as they are quantified using the standardised method.

Notes to the 2013 Separate Financial Statements
167
The following table illustrates exposure to market risk, expressed in VaR terms, as measured by the
internal system for 2013.
Key:
Dati in euro: Amounts in euro
Var (1 Giorno – i.c. 99%): VaR (1 day – i.c. 99%)
January, February, March, April, May, June, July, August, September, October, November, December
Notes to the 2013 Separate Financial Statements
168
Price risk
Qualitative disclosure
A. General characteristics
In 2013, activity involving equity securities was nil, in line with ALCO policy.
B. Management procedures and measurement methodologies of price risk
Please refer to the description of interest rate risk in the previous section.
Quantitative disclosure
Not applicable.

Notes to the 2013 Separate Financial Statements
169
2.2 – Interest rate risk and price risk – Banking book
Interest rate risk
Qualitative disclosure
A. General characteristics, interest rate management processes and
measurement methods
In 2013, the Bank’s exposure to structural interest rate risk was consistent with the established
regulatory limits.
Exposure to interest rate risk is limited both in terms of potential impact on the Economic Value and
the Interest Margin under the hypothetical conditions of interest rate stress.
Additionally, the Bank managed the exposure to basis risk consistent with the level and volatility of
money market rates, maintaining the risk position within the general limits established for interest
rate risk.
Illustration of the internal model
The system guarantees an integrated approach to interest rate risk monitoring and management,
with particular attention to:
• Module for the statistical analysis of risk exposure, through which the Bank's current and
future exposure to financial risks is assessed in a crisis scenario. This module is currently used to
evaluate:
o Liquidity risk, through the evaluation of all cash flows (both capital and interest)
generated by the Bank’s operations in relation to the banking book (maturity gap
analysis);
o The effects of an interest rate shock on the net interest margin simultaneous with and
parallel to the cut-off date (shock sensitivity analysis +/- 200 basis points).
• Module for fixing analysis, through which the effective risk position for variable rate transactions
is obtained with an indication of the period in which interest rate re-fixing will occur.
• Module for simulation analysis, through which the effects of corporate strategies on profitability
are evaluated and, at the same time, sensitivity of the net interest margin to various scenarios of
forecasted interest rates; thus, the model:
o Enables the ALM department to conduct an inertial simulation of the income statement
and balance sheet by calculating the relevant average capital, average and actual
month-end interest rates, and real interest rates;
o Analyses different scenarios of new volumes with segmentation by type and pricing rules
and obtains details for individual transactions;
o Defines liquidity mismatches (of capital and interest) by calculating the capitalisation
effect on the Bank’s income statement.
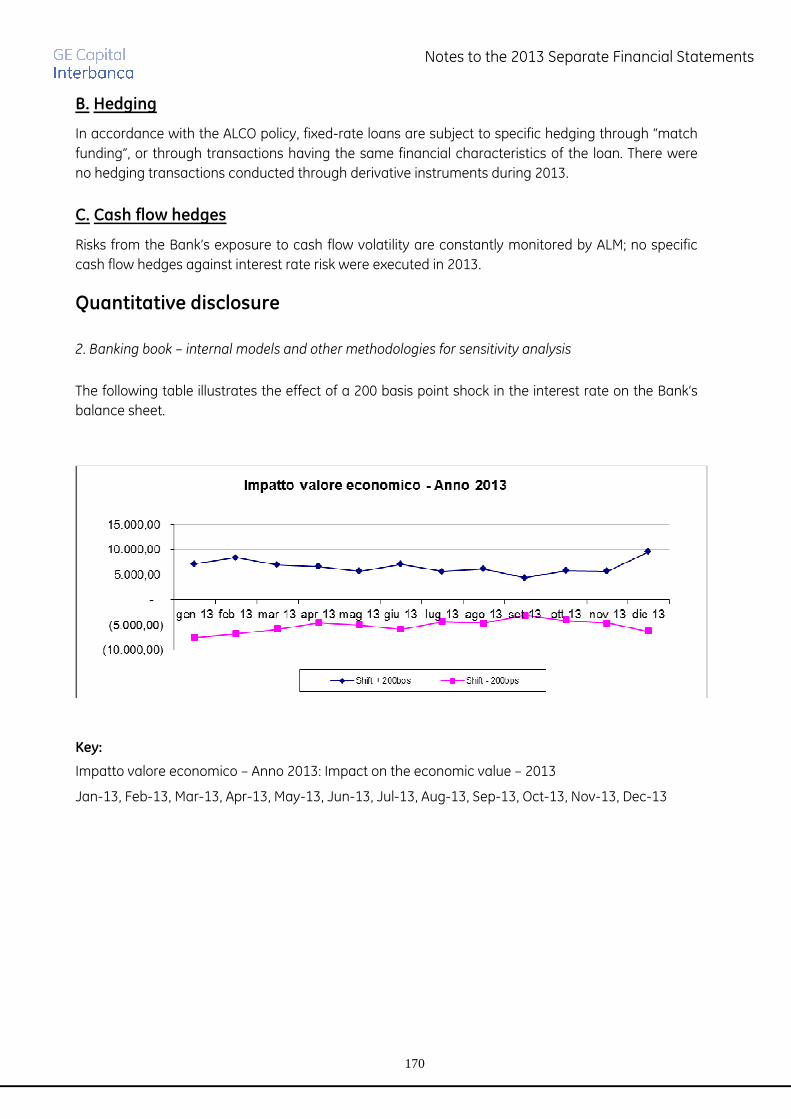
Notes to the 2013 Separate Financial Statements
170
B. Hedging
In accordance with the ALCO policy, fixed-rate loans are subject to specific hedging through “match
funding”, or through transactions having the same financial characteristics of the loan. There were
no hedging transactions conducted through derivative instruments during 2013.
C. Cash flow hedges
Risks from the Bank’s exposure to cash flow volatility are constantly monitored by ALM; no specific
cash flow hedges against interest rate risk were executed in 2013.
Quantitative disclosure
2. Banking book – internal models and other methodologies for sensitivity analysis
The following table illustrates the effect of a 200 basis point shock in the interest rate on the Bank’s
balance sheet.
Key:
Impatto valore economico – Anno 2013: Impact on the economic value – 2013
Jan-13, Feb-13, Mar-13, Apr-13, May-13, Jun-13, Jul-13, Aug-13, Sep-13, Oct-13, Nov-13, Dec-13
Notes to the 2013 Separate Financial Statements
171
Price risk
Qualitative disclosure
A. General characteristics, price risk management processes and measurement
methods
The Equity Investment activity carried out by the Bank to date has been focused on acquiring
minority stakes in developing and mature industrial, commercial or service companies and
supporting their growth (e.g., providing expansion capital) or assisting in restructuring their
shareholder base through leveraged acquisitions (e.g., leveraged buy-out, family buy-out,
management buy-in/buy-out, or replacement transactions) in order to create value and achieve
adequate capital gains upon disposal.
Investments in start-up companies or, as a rule, companies in the financial, insurance and real estate
sectors, do not fall within the scope of our activities, as they are characterised by higher risk and
assume specific business competencies. Non-politically correct sectors are also excluded, such as
weapons, gambling or activities that have a negative impact on the environment. The Bank does not
participate in turnaround situations, with the exception of shareholdings resulting from the
conversions of loans of companies in temporary financial difficulty, which are, however, not part of
the typical equity investment activities undertaken by Equity Investment.
The role played by the Bank in companies in which it has a shareholding is that of strategic
shareholder, as it shares the overall guidance of areas of development potentially significant to its
investment in the portfolio company (e.g., significant acquisitions, stock market listing, etc.) with the
other core shareholders, without taking any decisions of an operational/management nature –
except through its participation in any corporate bodies (e.g. Board of Directors) – which are left to
the full and total autonomy of company management.
The time horizon of the investments is usually 4 to 5 years.
The assessment of potential investments includes gaining an understanding of the current and
prospective competitive position of the target company and of its earnings and financial position.
This assessment is conducted in close cooperation with the heads of the company
(entrepreneur/owner and top management) and also has the aim of better understanding the quality
of the company’s management.
Compatibility of a potential investment with various prudential limits required for such transactions
by the Bank of Italy are verified in advance.
Potential investments are measured using various valuation methodologies widely used in the
industry, selecting those which are considered most appropriate on a case-by-case basis. The
selection of investment opportunities by the Equity Investment unit also takes into consideration the
adequacy of the range of expected returns (internal rate of return) compared to the risks of the
investment, and prior identification of appropriate exit strategies which are reasonably achievable.
Each potential investment that passes the first phase of evaluation and analysis and is considered to
be a significant or unique investment opportunity is generally subject to due diligence, with the
support of external experts and specialists, in which a deeper analysis of specific and significant
aspects of the activity of the target company is conducted. Due diligence may relate to one or more
of the following areas of the company’s operations: accounting, finance, tax, environment,
production/commercial, organisation and management, legal, and labour law.
Protection of the Bank’s minority shareholdings is guaranteed through the establishment of
appropriate master agreements (including, for example, adequate warranties relating to the

Notes to the 2013 Separate Financial Statements
172
company’s historic situation) and shareholders’ agreements, which may include clauses facilitating
divestment (pre-defined exit strategies).
When establishing shareholders’ agreements, reference is made to the principal elements of the
portfolio company’s corporate governance, quorums required for taking strategic decisions, rights to
information, participation in the Board of Directors and rights and obligations for issuing shares (e.g.,
pre-emption rights, co-sale rights, etc.).
Ongoing monitoring of investments is carried out by the Equity Investment unit, typically through
appointment of a representative to the Board of Directors of the portfolio/target company and
verification of performance against the budget and business plan.
The Enterprise Risk Management & Risk Analytics area carries out second-level monitoring based on
documentation produced by Equity Investment.
The approval process for new investments, add-ons and divestments envisages that, prior to being
submitted to the competent deliberating body, proposals formulated by the Equity Investment unit
are reviewed by the Investments Committee, supported in its decisions by the Equity Risk Manager
EMEA, as well as the internal areas of Legal, Compliance and Risk.
On a quarterly basis, the Investments Committee reviews the updated evaluations of investments
and convertible bonds in the portfolio, as well as any impairment proposals, submitting its
conclusions to the Risk Committee.
The Enterprise Risk Management & Risk Analytics area provides the Risk Committee with its own
independent opinion on each of the investment evaluations and any impairment tests, based on its
analysis.

Notes to the 2013 Separate Financial Statements
173
2.3 - Currency risk
Qualitative disclosure
A. General characteristics, currency risk management processes and
measurement methods
Structural foreign exchange risk is mitigated by offsetting transactions, typically raising funding in
the same currency.
Positions in foreign currency are monitored using the reports produced by ALM.
B. Hedging of currency risk
There were no over-the-counter derivative transactions to hedge currency risk during 2013.
Quantitative disclosure
US Dollar GB PoundPolish
Zloty
Czech
Republic
Koruna
Swiss FrancOther
currencies
A. Financial assets 179,789 - 3,537 959 1,320 5
A.1 Debt securities - - - - - - A.2 Equities - - - - - - A.3 Loans to banks 5,638 - - 46 442 5 A.4 Loans to customers 174,151 - 3,537 913 878 - A.5 Other financial assets - - - - - -
B. Other assets - - - - -
C. Financial liabilities (191,435) - (3,480) (946) (1,280) -
C.1 Due to banks - - (193) - - - C.2 Due to customers (191,435) - (3,287) (946) (1,280) - C.3 Debt securities - - - - - - C.4 Other financial liabilities - - - - - -
D. Other liabilities - - - - -
E. Financial derivatives - - - - - -
- Options - - - - - -
+ Long positions - - - - - - + Short positions - - - - - -
- Other - - - - - - + Long positions - - - - - - + Short positions - - - - - -
Total assets 179,789 - 3,537 959 1,320 5
Total liabilities (191,435) - (3,480) (946) (1,280) -
Gap (+/-) (11,646) - 57 13 40 5
Item
Currencies
1. Breakdown of assets, liabilities and derivatives by currency of denomination

Notes to the 2013 Separate Financial Statements
174
2. Internal models and other methodologies for sensitivity analysis
The currency risk for the trading book was nil in 2013.
The following graph shows the trend in the relationship between open positions in the banking book
and equity.
Key:
Rischio di cambio Portafoglio bancario: Banking book credit risk
Mar-13, Jun-13, Sep-13, Dec-13
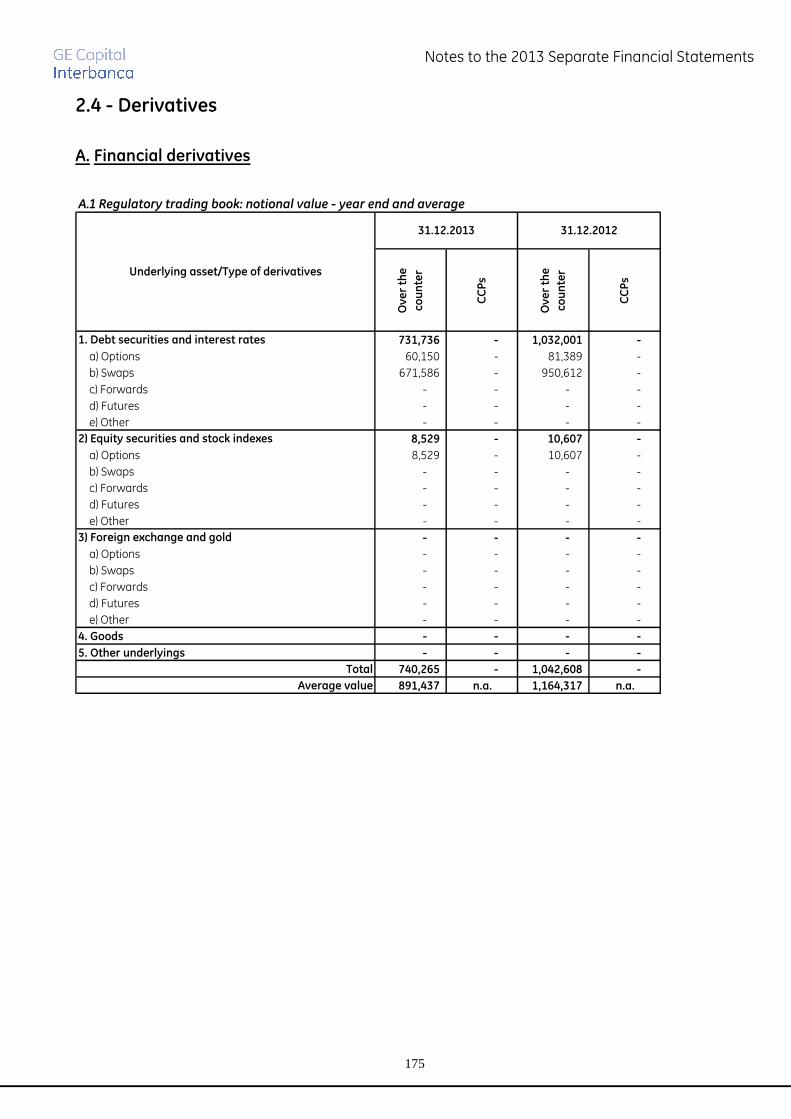
Notes to the 2013 Separate Financial Statements
175
2.4 - Derivatives
A. Financial derivatives
Ov
er
the
cou
nte
r
CC
Ps
Ov
er
the
cou
nte
r
CC
Ps
1. Debt securities and interest rates 731,736 - 1,032,001 -
a) Options 60,150 - 81,389 -
b) Swaps 671,586 - 950,612 -
c) Forwards - - - -
d) Futures - - - -
e) Other - - - -
2) Equity securities and stock indexes 8,529 - 10,607 -
a) Options 8,529 - 10,607 -
b) Swaps - - - -
c) Forwards - - - -
d) Futures - - - -
e) Other - - - -
3) Foreign exchange and gold - - - -
a) Options - - - -
b) Swaps - - - -
c) Forwards - - - -
d) Futures - - - -
e) Other - - - -
4. Goods - - - -
5. Other underlyings - - - -
Total 740,265 - 1,042,608 -
Average value 891,437 n.a. 1,164,317 n.a.
A.1 Regulatory trading book: notional value - year end and average
Underlying asset/Type of derivatives
31.12.2013 31.12.2012

Notes to the 2013 Separate Financial Statements
176
Ov
er
the
cou
nte
r
CC
Ps
Ov
er
the
cou
nte
r
CC
Ps
1. Debt securities and interest rates 25,000 - 36,681 -
a) Options - - - -
b) Swaps 25,000 - 36,681 -
c) Forwards - - - -
d) Futures - - - -
e) Other - - - -
2) Equity securities and stock indexes 10,000 - 10,000 -
a) Options 10,000 - 10,000 -
b) Swaps - - - -
c) Forwards - - - -
d) Futures - - - -
e) Other - - - -
3) Foreign exchange and gold - - - -
a) Options - - - -
b) Swaps - - - -
c) Forwards - - - -
d) Futures - - - -
e) Other - - - -
4. Goods - - - -
5. Other underlyings - - - -
Total 35,000 - 46,681 -
Average value 40,841 n.a. 65,701 n.a.
A.2 Banking book: notional value - year end and averageA.2.1 Hedging
Underlying asset/Type of derivatives
31.12.2013 31.12.2012

Notes to the 2013 Separate Financial Statements
177
Ov
er
the
cou
nte
r
CC
Ps
Ov
er
the
cou
nte
r
CC
Ps
1. Debt securities and interest rates - - - -
a) Options - - - -
b) Swaps - - - -
c) Forwards - - - -
d) Futures - - - -
e) Other - - - -
2) Equity securities and stock indexes 69,630 - 69,630 -
a) Options 69,630 - 69,630 -
b) Swaps - - - -
c) Forwards - - - -
d) Futures - - - -
e) Other - - - -
3) Foreign exchange and gold - - - -
a) Options - - - -
b) Swaps - - - -
c) Forwards - - - -
d) Futures - - - -
e) Other - - - -
4. Goods - - - -
5. Other underlyings - - - -
Total 69,630 - 69,630 -
Average value 69,630 n.a. 76,630 n.a.
A.2.2 Other derivatives
Underlying asset/Type of derivatives
31.12.2013 31.12.2012

Notes to the 2013 Separate Financial Statements
178
Ov
er
the
cou
nte
r
CC
Ps
Ov
er
the
cou
nte
r
CC
Ps
A. Regulatory trading portfolio 50,010 - 85,032 -
a) Options 44 - 305 -
b) Interest rate swaps 49,966 - 84,727 -
c) Cross currency swaps - - - -
d) Equity swaps - - - -
e) Forwards - - - -
f) Futures - - - -
g) Others - - - -
B. Banking book - hedging 494 - 931 -
a) Options - - - -
b) Interest rate swaps 494 - 931 -
c) Cross currency swaps - - - -
d) Equity swaps - - - -
e) Forwards - - - -
f) Futures - - - -
g) Others - - - -
C. Banking book - other derivatives - - - -
a) Options - - - -
b) Interest rate swaps - - - -
c) Cross currency swaps - - - -
d) Equity swaps - - - -
e) Forwards - - - -
f) Futures - - - -
g) Others - - - -
Total 50,504 - 85,963 -
A.3 Financial derivatives: gross positive fair value - breakdown by products
31.12.2013 31.12.2012
Portfolios/Types of derivatives
Positive fair value

Notes to the 2013 Separate Financial Statements
179
Ov
er
the
cou
nte
r
CC
Ps
Ov
er
the
cou
nte
r
CC
Ps
A. Regulatory trading portfolio 53,668 - 81,211 -
a) Options 76 - 306 -
b) Interest rate swaps 53,592 - 80,905 -
c) Cross currency swaps - - - -
d) Equity swaps - - - -
e) Forwards - - - -
f) Futures - - - -
g) Others - - - -
B. Banking book - hedging - - 103 -
a) Options - - - -
b) Interest rate swaps - - 103 -
c) Cross currency swaps - - - -
d) Equity swaps - - - -
e) Forwards - - - -
f) Futures - - - -
g) Others - - - -
C. Banking book - other derivatives - - - -
a) Options - - - -
b) Interest rate swaps - - - -
c) Cross currency swaps - - - -
d) Equity swaps - - - -
e) Forwards - - - -
f) Futures - - - -
g) Others - - - -
Total 53,668 - 81,314 -
A.4 Financial derivatives: gross negative fair value - breakdown by products
31.12.2013 31.12.2012
Portfolios/Types of derivatives
Negative fair value

Notes to the 2013 Separate Financial Statements
180
Contracts not included in netting agreements
Go
ve
rnm
en
ts a
nd
Ce
ntr
al B
an
ks
Oth
er
pu
bli
c se
cto
r
en
titi
es
Ba
nk
s
Fin
an
cia
l
com
pa
nie
s
Insu
ran
ce
com
pa
nie
s
No
n-f
ina
nci
al
com
pa
nie
s
Oth
er
en
titi
es
1) Debt securities and interest rate indexes
- notional amount - - 403,726 25,131 - 302,879 -
- positive fair value - - 4,407 7,270 - 38,333 -
- negative fair value - - 53,668 - - - -
- future exposure - - 3,565 343 - 2,583 -
2) Equity securities and stock indexes
- notional amount - - - - - 8,529 -
- positive fair value - - - - - - -
- negative fair value - - - - - - -
- future exposure - - - - - 117 -
3) Gold and currencies
- notional amount - - - - - - -
- positive fair value - - - - - - -
- negative fair value - - - - - - -
- future exposure - - - - - - -
4) Other instruments -
- notional amount - - - - - - -
- positive fair value - - - - - - -
- negative fair value - - - - - - -
- future exposure - - - - - - -
A.5 OTC financial derivatives - regulatory trading book: notional amount, gross positive and negative fair values by
counterparty - contracts not included in netting agreements
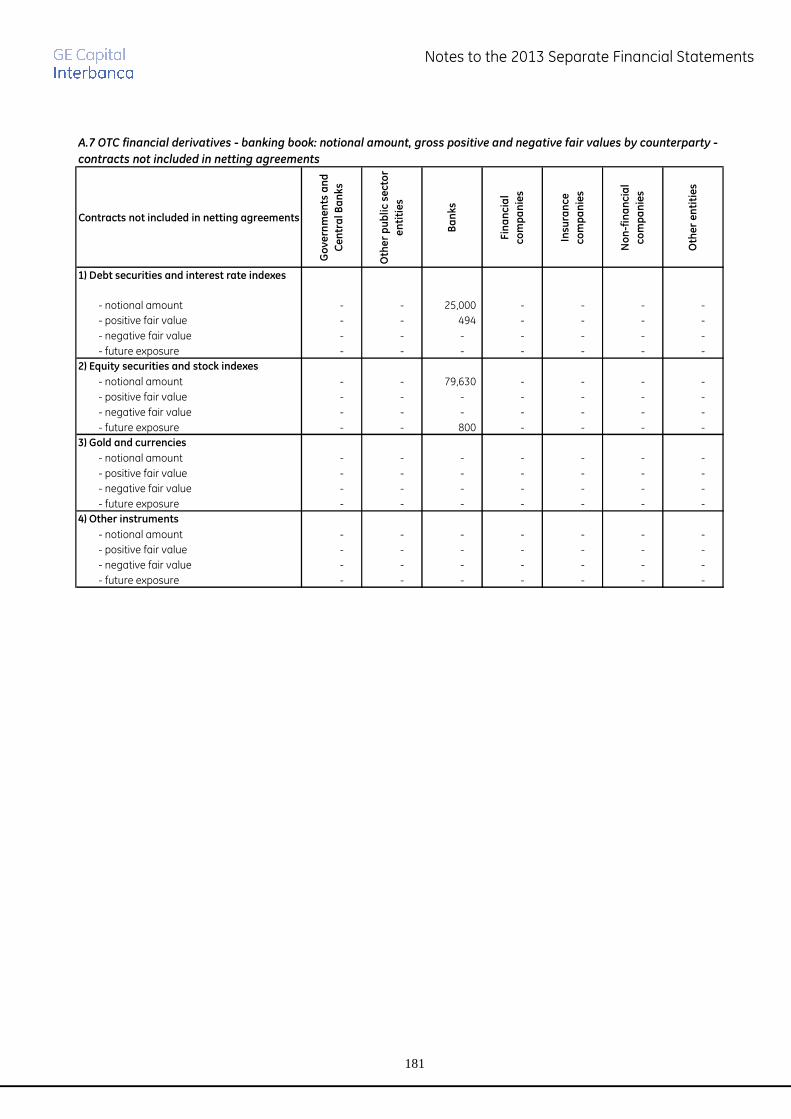
Notes to the 2013 Separate Financial Statements
181
Contracts not included in netting agreements
Go
ve
rnm
en
ts a
nd
Ce
ntr
al B
an
ks
Oth
er
pu
bli
c se
cto
r
en
titi
es
Ba
nk
s
Fin
an
cia
l
co
mp
an
ies
Insu
ran
ce
co
mp
an
ies
No
n-f
ina
nc
ial
co
mp
an
ies
Oth
er
en
titi
es
1) Debt securities and interest rate indexes
- notional amount - - 25,000 - - - -
- positive fair value - - 494 - - - -
- negative fair value - - - - - - -
- future exposure - - - - - - -
2) Equity securities and stock indexes
- notional amount - - 79,630 - - - -
- positive fair value - - - - - - -
- negative fair value - - - - - - -
- future exposure - - 800 - - - -
3) Gold and currencies
- notional amount - - - - - - -
- positive fair value - - - - - - -
- negative fair value - - - - - - -
- future exposure - - - - - - -
4) Other instruments
- notional amount - - - - - - -
- positive fair value - - - - - - -
- negative fair value - - - - - - -
- future exposure - - - - - - -
A.7 OTC financial derivatives - banking book: notional amount, gross positive and negative fair values by counterparty -
contracts not included in netting agreements
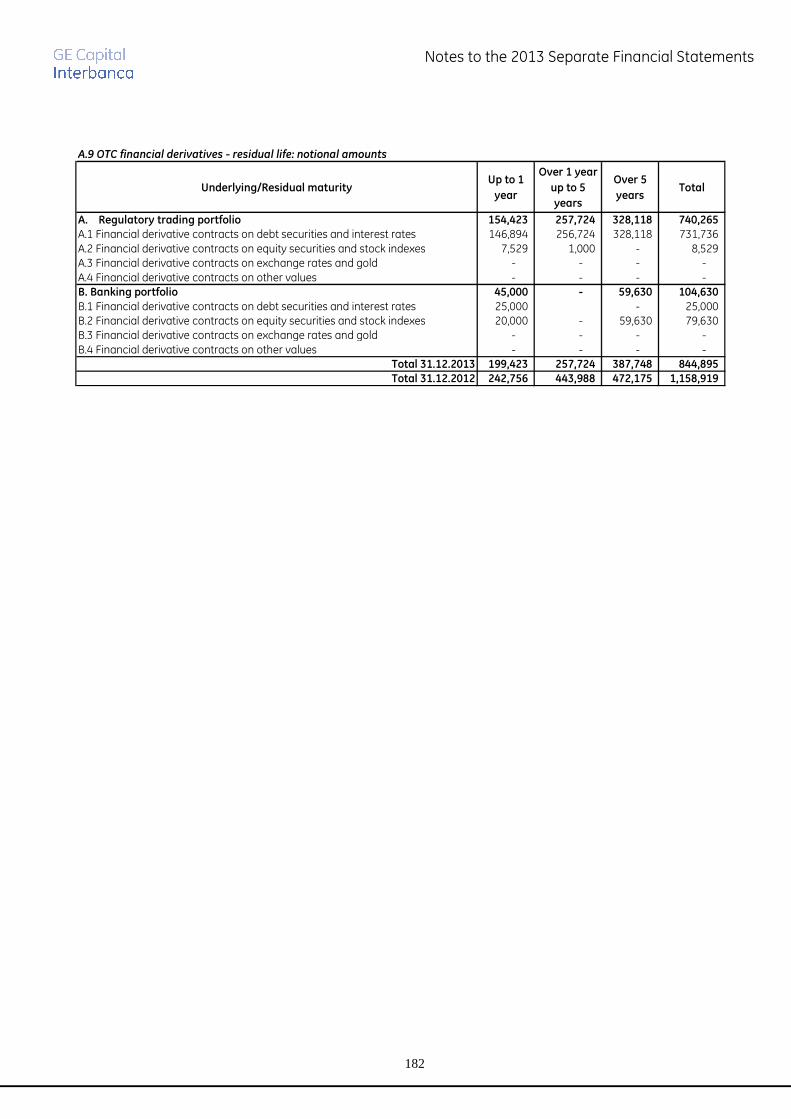
Notes to the 2013 Separate Financial Statements
182
Underlying/Residual maturityUp to 1
year
Over 1 year
up to 5
years
Over 5
yearsTotal
A. Regulatory trading portfolio 154,423 257,724 328,118 740,265
A.1 Financial derivative contracts on debt securities and interest rates 146,894 256,724 328,118 731,736 A.2 Financial derivative contracts on equity securities and stock indexes 7,529 1,000 - 8,529 A.3 Financial derivative contracts on exchange rates and gold - - - - A.4 Financial derivative contracts on other values - - - - B. Banking portfolio 45,000 - 59,630 104,630
B.1 Financial derivative contracts on debt securities and interest rates 25,000 - 25,000 B.2 Financial derivative contracts on equity securities and stock indexes 20,000 - 59,630 79,630 B.3 Financial derivative contracts on exchange rates and gold - - - - B.4 Financial derivative contracts on other values - - - -
Total 31.12.2013 199,423 257,724 387,748 844,895
Total 31.12.2012 242,756 443,988 472,175 1,158,919
A.9 OTC financial derivatives - residual life: notional amounts

Notes to the 2013 Separate Financial Statements
183
Section 3
Liquidity Risk
Qualitative disclosure
A. General characteristics, liquidity risk management processes and
measurement methods
As in prior years, the Bank’s structural liquidity profile in 2013 was aligned with criteria for sound and
prudent management.
83% of the Bank’s financial needs are met through funding provided by General Electric Group
financial companies.
Analysis of cumulative cash flows from the Bank’s inertial liquidity position showed a substantial
liquidity surplus in 2013, which resulted in the early repayment of certain lines provided by GE.

Notes to the 2013 Separate Financial Statements
184
Quantitative disclosure
1. Maturity analysis: position for contractual residual life of financial assets and liabilities
Item/Contractual residual lifeOn
demand
Over 1 up
to 7 days
Over 7 up
to 15 days
Over 15
days up to
1 month
Over 1 up
to 3
months
Over 3 up
to 6
months
Over 6
months up
to 1 year
Over 1 up to
5 years
Over 5
yearsIndefinite
Assets 122,104 7,842 15,850 43,007 46,765 103,067 242,389 1,070,073 448,761 15,045
A.1 Government securities - - - - - - 15 30 - -
A.2 Other debt securities - - - - - - 2 - - 15,045
A.3 Investment fund units - - - - - - - - - -
A.4 Loans 122,104 7,842 15,850 43,007 46,765 103,067 242,372 1,070,043 448,761 -
- Banks 100,956 - 6,550 17,003 - 3,765 3,677 40,448 41,981 -
- Customers 21,148 7,842 9,300 26,004 46,765 99,302 238,695 1,029,595 406,780 -
Liabilities 64,368 18 10,028 20,132 108,910 21,638 690,392 1,339,692 63,034 -
B.1 Deposits 63,915 - 10,000 20,038 108,385 10,650 674,953 1,208,987 3,404 -
- Banks 1,603 - - - 324 471 633 4,478 3,404 -
- Customers 62,312 - 10,000 20,038 108,061 10,179 674,320 1,204,509 - -
B.2 Debt securities 453 18 28 94 525 10,988 15,439 130,705 59,630 -
B.3 Other liabilities - - - - - - - - - -
Off-balance sheet transactions (12,807) - - - 2,463 11,216 23,533 11,226 - -
C.1 Financial derivatives with
underlying asset exchange- - - - - - - - - -
Long positions - - - - - - - -
Short positions - - - - - - - -
C.2 Financial derivatives without
underlying asset exchange(5,132) - - - - 10,000 15,000 - - -
Long positions 48,536 - - - - 10,000 15,000 - - -
Short positions (53,668) - - - - - - - - -
C.3 Deposits and funding receivable - - - - - - - - - -
Long positions - - - - - - - - - -
Short positions - - - - - - - - - -
C.4 Irrevocable funding commitments (7,675) - - - - - 7,675 - - -
Long positions - - - - - - 7,675 - - -
Short positions (7,675) - - - - - - - - -
C.5 Guarantees granted - - - - 2,463 1,216 858 11,226 - -
C.6 Guarantees received - - - - - - - - - -
C.7 Financial derivatives with
underlying asset exchange
Long positions - - - - - - - - - -
Short positions - - - - - - - - - -
C.8 Financial derivatives without
underlying asset exchange - - - - - - - - - -
Long positions
Short positions - - - - - - - - - -
Currency of denomination: Euro

Notes to the 2013 Separate Financial Statements
185
Item/Contractual residual lifeOn
demand
Over 1 up
to 7 days
Over 7 up
to 15 days
Over 15
days up
to 1
month
Over 1 up
to 3
months
Over 3
up to 6
months
Over 6
months
up to 1
year
Over 1 up
to 5 years
Over 5
yearsIndefinite
Assets 6,849 318 637 1,562 2,843 8,898 11,883 117,556 75,144 -
A.1 Government securities - - - - - - - - - -
A.2 Other debt securities - - - - - - - - - -
A.3 Investment fund units - - - - - - - - - -
A.4 Loans 6,849 318 637 1,562 2,843 8,898 11,883 117,556 75,144 -
- Banks 5,638 - - - - - - - - -
- Customers 1,211 318 637 1,562 2,843 8,898 11,883 117,556 75,144 -
Liabilities 2,273 - - - - - 185,991 2,900 - -
B.1 Deposits 2,273 - - - - - 185,991 2,900 - -
- Banks - - - - - - - - - -
- Customers 2,273 - - - - - 185,991 2,900 - -
B.2 Debt securities - - - - - - - - - -
B.3 Other liabilities - - - - - - - - - -
Off-balance sheet transactions - - - - - - - - - -
C.1 Financial derivatives with underlying
asset exchange- - - - - - - - - -
Long positions - - - - - - - - - -
Short positions - - - - - - - - - -
C.2 Financial derivatives without
underlying asset exchange- - - - - - - - - -
Long positions - - - - - - - - -
Short positions - - - - - - - - - -
C.3 Deposits and funding receivable - - - - - - - - - -
Long positions - - - - - - - - - -
Short positions - - - - - - - - - -
C.4 Irrevocable funding commitments - - - - - - - - - -
Long positions - - - - - - - - - -
Short positions - - - - - - - - - -
C.5 Guarantees granted - - - - - - - - - -
C.6 Guarantees received - - - - - - - - - -
C.7 Financial derivatives with underlying
asset exchange
Long positions - - - - - - - - - -
Short positions - - - - - - - - - -
C.8 Financial derivatives without
underlying asset exchange - - - - - - - - - -
Long positions
Short positions - - - - - - - - - -
1. Maturity analysis: position for contractual residual life of financial assets and liabilities Currency of denomination: US Dollar
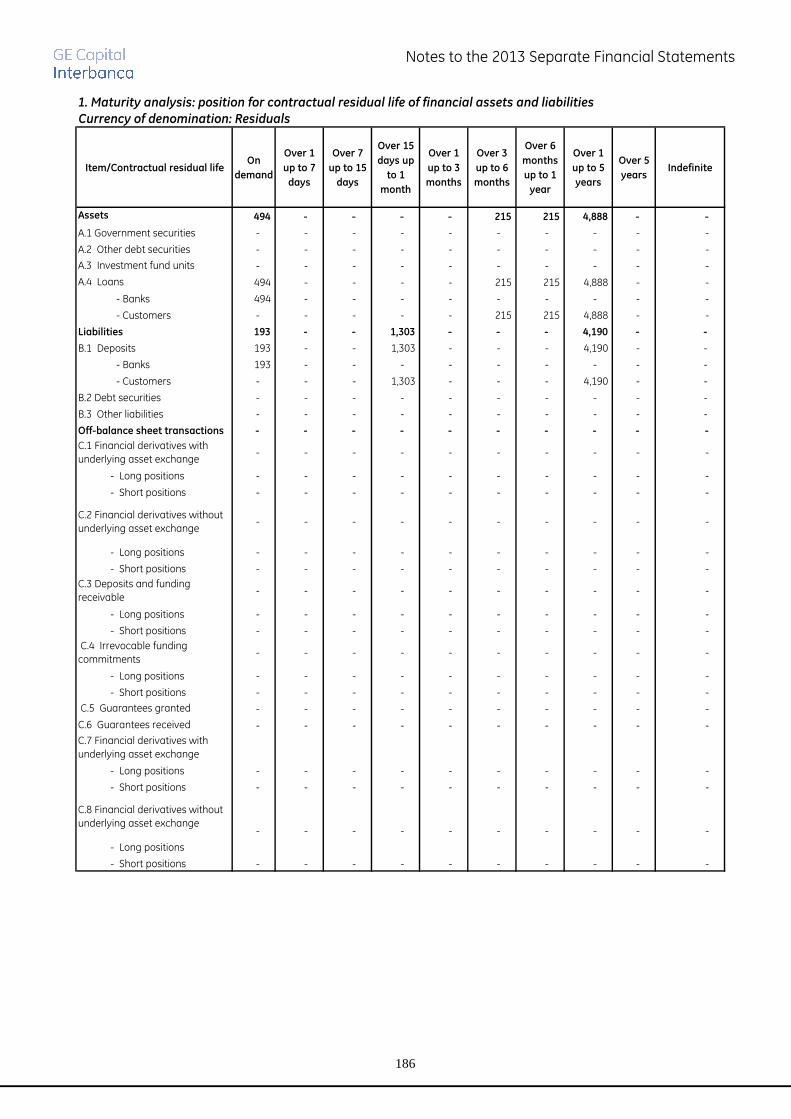
Notes to the 2013 Separate Financial Statements
186
Item/Contractual residual lifeOn
demand
Over 1
up to 7
days
Over 7
up to 15
days
Over 15
days up
to 1
month
Over 1
up to 3
months
Over 3
up to 6
months
Over 6
months
up to 1
year
Over 1
up to 5
years
Over 5
yearsIndefinite
Assets 494 - - - - 215 215 4,888 - -
A.1 Government securities - - - - - - - - - -
A.2 Other debt securities - - - - - - - - - -
A.3 Investment fund units - - - - - - - - - -
A.4 Loans 494 - - - - 215 215 4,888 - -
- Banks 494 - - - - - - - - -
- Customers - - - - - 215 215 4,888 - -
Liabilities 193 - - 1,303 - - - 4,190 - -
B.1 Deposits 193 - - 1,303 - - - 4,190 - -
- Banks 193 - - - - - - - - -
- Customers - - - 1,303 - - - 4,190 - -
B.2 Debt securities - - - - - - - - - -
B.3 Other liabilities - - - - - - - - - -
Off-balance sheet transactions - - - - - - - - - -
C.1 Financial derivatives with
underlying asset exchange- - - - - - - - - -
Long positions - - - - - - - - - -
Short positions - - - - - - - - - -
C.2 Financial derivatives without
underlying asset exchange- - - - - - - - - -
Long positions - - - - - - - - - -
Short positions - - - - - - - - - -
C.3 Deposits and funding
receivable- - - - - - - - - -
Long positions - - - - - - - - - -
Short positions - - - - - - - - - -
C.4 Irrevocable funding
commitments - - - - - - - - - -
Long positions - - - - - - - - - -
Short positions - - - - - - - - - -
C.5 Guarantees granted - - - - - - - - - -
C.6 Guarantees received - - - - - - - - - -
C.7 Financial derivatives with
underlying asset exchange
Long positions - - - - - - - - - -
Short positions - - - - - - - - - -
C.8 Financial derivatives without
underlying asset exchange- - - - - - - - - -
Long positions
Short positions - - - - - - - - - -
1. Maturity analysis: position for contractual residual life of financial assets and liabilities Currency of denomination: Residuals
Notes to the 2013 Separate Financial Statements
187
Section 4
Operational Risk
Qualitative disclosure
A. General characteristics, operational risk management processes and
measurement methods
Operational risk (in reference to Basel II provisions) relates to the risk of suffering losses due to the
following categories of causal factors: human resources, processes, technology systems and
external events. Operational risk includes legal risk, or the risk of losses resulting from violations of
law or regulations, from contractual or extra-contractual liability or from other disputes. Strategic risk
and reputational risk are not included in operational risk.
To determine minimal capital requirements for operational risks, GE Capital Interbanca S.p.A.
adopted the Basic Indicator Approach (BIA) methodology. According to regulatory instructions, the
minimum compulsory capital requirement is calculated as 15% of the average of the net interest and
other banking income over the last three years.
The operational risk management framework adopted by the Bank reflects the requirements of the
Parent Company GE Capital Corporation (GECC), which defines the overall operational risk
management framework and establishes the rules and organisational processes for measuring,
managing and controlling these risks.
The Bank’s operational risk management processes are coordinated by the Operational Risk
Department, which is part of Enterprise Risk Management and Risk Analytics (ERM – RA) Department.
The processes activated within the Bank as part of the operational risk management framework are:
• Internal Loss Data (ILD): structured process for collecting data on the Bank’s operational
losses;
• Risk Control Self Assessment (RCSA): a prospective valuation of the potential operational risks
to which the Bank is exposed;
• Issue Management: process in which the operational anomalies that emerged from LDC and
RCSA are managed and resolved.
In 2013, the Bank’s Operational Risk Department supported the implementation project for a new
technology platform dedicated to managing information related to Enterprise Risk Management. The
project was coordinated by the Parent Company GECC and included the adoption of a modular
technology solution to replace the current tools used by Enterprise Risk Management, Internal Audit
and Compliance departments, developed by a third party and to be extended to all subsidiary legal
entities.
With regards to Enterprise Risk Management department, the system will become the primary tool
for managing the processes of the operational risk framework, including the implementation of
modules for the RCSA process, for the collection of information on events and operational losses, for
reporting of the Key Risk Indicators and for managing issues the emerge from the detection and
measurement processes. During 2013, the Issue Management module was released into production
and the first user acceptance tests were conducted on the RCSA module. At the same time the ERM –
RA OpRIsk Department began activities to adapt the RCSA process and the related management
tools currently in place, in order to integrate them into the new system, with the objective of
enhancing the system functionality that doesn’t fully meet the needs of GE Capital Interbanca Group.

Notes to the 2013 Separate Financial Statements
188
The Internal Loss Data Collection process currently in use classifies operational losses according to
risk categories defined by regulatory authorities, listed below:
• Internal fraud: losses due to unauthorised activities, fraud, misappropriation of funds or
violations of law, regulations, or company directives that involve at least one internal
resource of the intermediary; • External fraud: losses due to fraud, misappropriation of funds or violations of law by parties
external to the intermediary;
• Employee relations and work-place safety: losses from actions that do not comply with the
law or contracts regarding employment, health and work-place safety, from the payment of
damages from personal injuries or from discrimination or the lack of application of equal
conditions;
• Customers, products and operational practices: losses from non-compliance with
professional obligations to customers or from the nature or characteristics of the product or
service provided;
• Damage to property: losses from external events, such as natural catastrophes, vandalism,
terrorism, etc.;
• Interruption of operations and system malfunctions: losses from interruptions to operations
and system malfunctions or unavailability;
• Process execution, delivery and management: losses due to issues in completing
transactions or process management, as well as losses due to relationships with commercial,
seller or supplier counterparties.

Notes to the 2013 Separate Financial Statements
189
Quantitative disclosure
The graphic below shows the percentage distribution of 2013 operational losses, broken down by the
risk classes listed above:
85,9%
14,1%
Perdite Operative 2013
Clienti, prodotti e prassi
operative
Esecuzione, consegna,
gestione dei processi
Key:
Perdite operative 2013: Operational losses - 2013
Clienti, prodotti, prassi operative: Customers, products, operational practices
Esecuzione, consegna, gestione dei processi: Process execution, delivery and management

Notes to the 2013 Separate Financial Statements
190
(empty page)

Notes to the 2013 Separate Financial Statements
191
Part F
INFORMATION ON CAPITAL

Notes to the 2013 Separate Financial Statements
192
Section 1
Equity
A. Qualitative disclosure
As part of its capital management activities, the Bank must ensure that the capital endowment and
the related capital ratios are consistent with the risk profile assumed and are compliant with
regulatory requirements.
The objective of the Capital Planning process is to forecast the internal allocation of capital as a result
of risks related to 2014 activities, in line with the operating plan.
Based on the expected trends in the financial situation for the following year, the Parent Company
Bank decides if implementing its business plan would require an increase in capital to maintain an
adequate level.
Based on the analysis described above, the Group’s strategic planning process consists of the
following phases:
• Blue Print 2 (BP2) - carried out in the first quarter to confirm or revise the budgeted financial
results for the year in progress and provide a forecast of the objectives for the following 2
years and the strategies for achieving them;
• Mid Year Stress Test (MYST) - carried out in the second quarter to provide a forecast of the
objectives for the year in progress and the following 2 years under one or more macro-
economic stress scenarios;
• Blue Print 4 (BP4) - carried out in the third quarter to confirm or revise the budgeted financial
results for the year in progress and determine the investments and growth plans for the
following 2 years; in addition, the financial results for the subsequent year are determined.
• Year End Stress Test (YEST) - carried out in the fourth quarter to provide a forecast of the
objectives for the year in progress and the following 2 years under one or more macro-
economic stress scenarios;
In order to significantly strengthen the Bank’s capital position, the General Electric Group has
transferred all of its equity investments in financial companies in Italy to the Bank, between 2010 and
the present.
As a result of this change, capital management at the Group level is even more important and
strategic, given that the quality and level of capital resources of the individual companies that make
up the Group must be defined as part of the more general objectives of the Group.
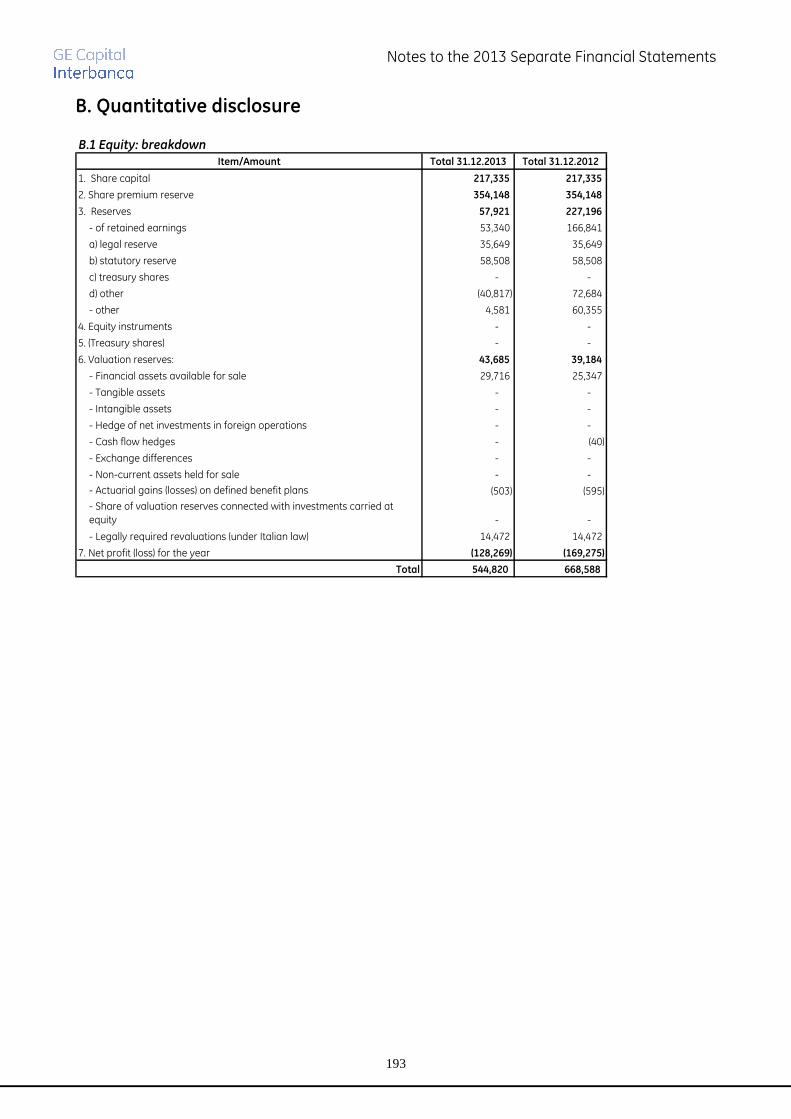
Notes to the 2013 Separate Financial Statements
193
B. Quantitative disclosure B.1 Equity: breakdown
Item/Amount Total 31.12.2013 Total 31.12.2012
1. Share capital 217,335 217,335
2. Share premium reserve 354,148 354,148
3. Reserves 57,921 227,196
- of retained earnings 53,340 166,841
a) legal reserve 35,649 35,649
b) statutory reserve 58,508 58,508
c) treasury shares - -
d) other (40,817) 72,684
- other 4,581 60,355
4. Equity instruments - -
5. (Treasury shares) - -
6. Valuation reserves: 43,685 39,184
- Financial assets available for sale 29,716 25,347
- Tangible assets - -
- Intangible assets - -
- Hedge of net investments in foreign operations - -
- Cash flow hedges - (40)
- Exchange differences - -
- Non-current assets held for sale - -
- Actuarial gains (losses) on defined benefit plans (503) (595)
- Share of valuation reserves connected with investments carried at
equity - -
- Legally required revaluations (under Italian law) 14,472 14,472
7. Net profit (loss) for the year (128,269) (169,275)
Total 544,820 668,588

Notes to the 2013 Separate Financial Statements
194
B.2 Valuation reserves for financial assets available for sale: breakdown
Positive
Reserve
Negative
Reserve
Positive
Reserve
Negative
Reserve
1. Debt securities 35 (321) 258 (1,096)
2. Equities 30,002 - 26,185 -
3. Investment fund units - - - -
4. Loans - - - -
Total 30,037 (321) 26,443 (1,096)
Asset/Amount
31.12.2013 31.12.2012
B.3 Valuation reserves for financial assets available for sale: annual changes
Debt securities EquitiesInvestment
fund unitsLoans
1. Opening balance (838) 26,185 - -
2. Positive changes 809 7,171 - -
2.1 Increases in fair value 809 6,008 - -
2.2 Reversal of negative reserves through the income statement - - - -
- from impairment - - - -
- realised - - - -
2.3 Other changes - 1,163 - -
3. Negative changes 257 3,354 - -
3.1 Decreases in fair value 257 3,354 - -
3.2 Impairment recoveries - - - -
3.3 Reversal of positive reserves: through the income statement - - - -
3.4 Other changes - - - -
4. Closing balance (286) 30,002 - -

Notes to the 2013 Separate Financial Statements
195
Section 2
Regulatory Capital and Ratios
2.1 Regulatory capital
A. Qualitative disclosure
Regulatory capital represents a much broader definition of capital than the legal notion of shareholders’
equity; in addition to share capital and reserves, it also includes a range of positive and negative
elements which are admissible within certain limitations.
1. Tier 1 Capital
The main items in GE Capital Interbanca S.p.A.’s Tier 1 Capital are its share capital, reserves, and share
premium reserves, net of intangible assets and negative reserves on available-for-sale instruments.
This figure does not include any innovative capital instruments admissible as regulatory capital, as the
Bank does not currently have any in issue.
2. Tier 2 Capital
The Bank’s Tier 2 Capital includes real estate valuation reserves, 50% of the positive reserves on
available-for-sale instruments and subordinated liabilities.
A brief description of the main contractual characteristics of the outstanding subordinated instrument
as at 31 December 2013 is given below.
� It is denominated in Euro and was issued for a total of € 200 million, which is its value as at 31
December 2013. The expiration date is 10 October 2016;
� Interest is paid quarterly at a variable rate based on the 3-month Euribor plus a spread of
0.28%;
� The loan may be repaid entirely or partially after the fifth anniversary of the disbursement date;
� In the event of liquidation of GE Capital Interbanca S.p.A., the loan qualifies as subordinated as it
is to be repaid only after the claims of all other creditors have been fully met.

Notes to the 2013 Separate Financial Statements
196
B. Quantitative disclosure 2.1 Regulatory capital
B. Quantitative disclosure
31.12.2013 31.12.2012A. Tier 1 Capital before application of prudential filters 498,574 627,715
B. Tier 1 Capital prudential filters (286) (838) - Positive IAS/IFRS prudential filters - - - Negative IAS/IFRS prudential filters (286) (838) C. Tier 1 Capital after application of prudential filters 498,288 626,877
D. Items to be deducted from Tier 1 Capital - -
E. Total Tier 1 Capital 498,288 626,877
F. Tier 2 Capital before application of prudential filters 164,474 200,657
G. Tier 2 Capital prudential filters (15,001) (13,092) - Positive IAS/IFRS prudential filters - - - Negative IAS/IFRS prudential filters (15,001) (13,092) H. Tier 2 Capital after application of prudential filters 149,473 187,565
I. Items to be deducted from Tier 2 Capital - -
L. Total Tier 2 Capital 149,473 187,565
M. Items to be deducted from Total Tier 1 and Tier 2 Capital - -
N. Regulatory capital 647,761 814,442
O. Tier 3 Capital - -
P. Regulatory capital including Tier 3 Capital 647,761 814,442

Notes to the 2013 Separate Financial Statements
197
2.2 – Capital adequacy
A. Qualitative disclosure
Regulatory capital represents the first defence against the various risks connected with banking
activity and, with a forward-looking perspective, the capital level constitutes a fundamental tool in
developing business independence while protecting the Bank’s stability.
Through 31 December 2013, the Bank was subject to the capital adequacy requirements established
by the Basel Committee according to the rules defined by Bank of Italy in Circular no. 263 of 27
December 2006 and subsequent amendments, “New provisions of prudential supervision for banks”.
The Bank did not take advantage of the option to exclude from its equity any unrealised profits or
losses on exposures with central governments classified under “Financial assets available for sale” for
the purposes of calculating regulatory capital, as per IAS 39 (Section II, para. 2), and Circular 285 of 17
December 2013.
Prudential regulation is predominantly on a consolidated basis; based on said regulation, the ratio of
capital to risk-weighted assets must be at least 8%, on a consolidated level.
Moreover, the Regulatory Instructions require the measurement/evaluation of risks to which the Bank
is exposed, prospectively and under stress assumptions, as well as the self-assessment of business
capital adequacy for overall risks (overall internal capital).
These activities make up the ICAAP process. As the Bank belongs to a banking group, ICAAP reporting
is prepared on a consolidated level. Therefore, refer to the corresponding section of the Notes to the
Consolidated Financial Statements.
Following the Supervisory Review and Evaluation Process (SREP) conducted in 2013, the Bank of Italy,
in reviewing the capital objectives for the leading intermediaries in the banking system, requested the
Bank (in Protocol no. 144784/14 of 10 February 2014), as Parent Company, to maintain a consolidated
Common Equity Tier 1 ratio greater than 9.5% and a consolidated Total Capital ratio of at least 11.5%.
As at 31 December 2013, GE Capital Interbanca S.p.A., as Parent Company of the Banking Group with
the same name, meets the capital requirements indicated above, with a consolidated Common Equity
Tier 1 ratio of 13.2% and Total Capital ratio of 17.0%.
EU Regulation 575/2013 (“CRR”) and Directive 2013/36/EU (“CRD IV”) became effective 1 January 2014,
which introduced in the European Union rules defined by the Basel Committee for banking supervision
mainly as regards to capital adequacy, additional capital reserves and public disclosure. Bank of Italy
applied said European provisions in issuing Circular no. 285 “Supervisory provisions for banks”.
The principal changes in implementing the CRD IV Directive (“Basel III”), compared to the previous
capital requirements known as “Basel II”, involve the definition of new capital content aimed at
improving the quality and quantity of banks’ capital, by introducing anti-cyclical and systemic
supervisory tools as well as rules for liquidity risk management and containment of financial leverage.
The imposition of additional capital reserves with respect to the regulatory minimums is designed to
furnish banks with high-quality capital to be used in periods of market tension in order to prevent
dysfunctions in the banking system and avoid interruptions to the credit disbursement process, as well
as to handle risks from certain banks resulting in systemic effects at the global or domestic level.
From 1 January 2014, only the capital conservation reserve applies to banking groups, consisting
solely of primary capital, with a coefficient of 2.5%.

Notes to the 2013 Separate Financial Statements
198
B. Quantitative disclosure
B. Quantitative disclosure
Total 31.12.2013Total
31.12.2012Total 31.12.2013
Total
31.12.2012
A. RISK ASSETS
A.1 CREDIT AND COUNTERPARTY RISKS 3,339,771 4,042,423 3,126,796 3,773,405
1. Standard methodology 3,339,771 4,042,423 3,126,796 3,773,405
2. Internal rating methodology - - - -
2.1 Basic - - - -
2.2 Advanced - - - -
3. Securitisation - - - -
B. CAPITAL REQUIREMENTS
B.1 CREDIT AND COUNTERPARTY RISKS 250,144 301,872
B.2 MARKET RISKS 632 584
1. Standard methodology 632 584
2. Internal models - -
3. Concentration risk - -
B.3 OPERATIONAL RISK 7,881 8,214
1. Basic method 7,881 8,214
2. Standard method - -
3. Advanced method - -
B.4 OTHER CAPITAL REQUIREMENTS - -
B.5 OTHER CALCULATION ELEMENTS (64,664) (77,667)
B.6 TOTAL CAPITAL REQUIREMENTS 193,993 233,003
C. RISK ASSETS AND REGULATORY RATIOS (*)
C.1 Risk-weighted assets 3,233,208 3,883,380
C.2 Tier 1 Capital/Risk-weighted assets
(Tier 1 Capital ratio) 15.4% 16.1%
C.3 Regulatory Capital/Risk-weighted assets
(Total Capital ratio) 20.0% 21.0%
Category/Amount
Unweighted amounts Weighted amounts/requirements
(*) these figures do not include the 25% reduction in regulatory capital requirements for banks belonging to a banking group, as GE Capital Interbanca S.p.A is also Parent Company of the Banking Group of the same name.

Notes to the 2013 Separate Financial Statements
199
Part G
BUSINESS COMBINATIONS
Not applicable

Notes to the 2013 Separate Financial Statements
200
(empty page)
Notes to the 2013 Separate Financial Statements
201
Part H
RELATED PARTY TRANSACTIONS

Notes to the 2013 Separate Financial Statements
202
1. Compensation for key management personnel
In thousands of Euros 31.12.2013
Directors 62
Board of Statutory Auditors & Supervisory Board 341
Managers 4,505
of which: short-term employee benefits 4,300
post-employment benefits 198
stock options 7
Total 4,908
The compensation indicated above refers to Directors, Auditors and Managers with strategic
responsibilities, as defined by the Regulation on Related Parties, who held such offices even for only a
portion of 2013, and is disclosed in accordance with the requirements of IAS 24, paragraph 16.
2. Information on transactions with related parties
PARENT COMPANY
GE Capital Corporation Inc.
SUBSIDIARIES
GE Capital Servizi Finanziari S.p.A.
GE Capital Finance S.r.l.
GE Capital Services S.r.l.
GE SPV S.r.l. (indirect subsidiary through GE Capital Servizi Finanziari S.p.A.)
JOINTLY CONTROLLED COMPANIES
Renting Italease S.r.l. (indirect subsidiary through GE Capital Services S.r.l.)
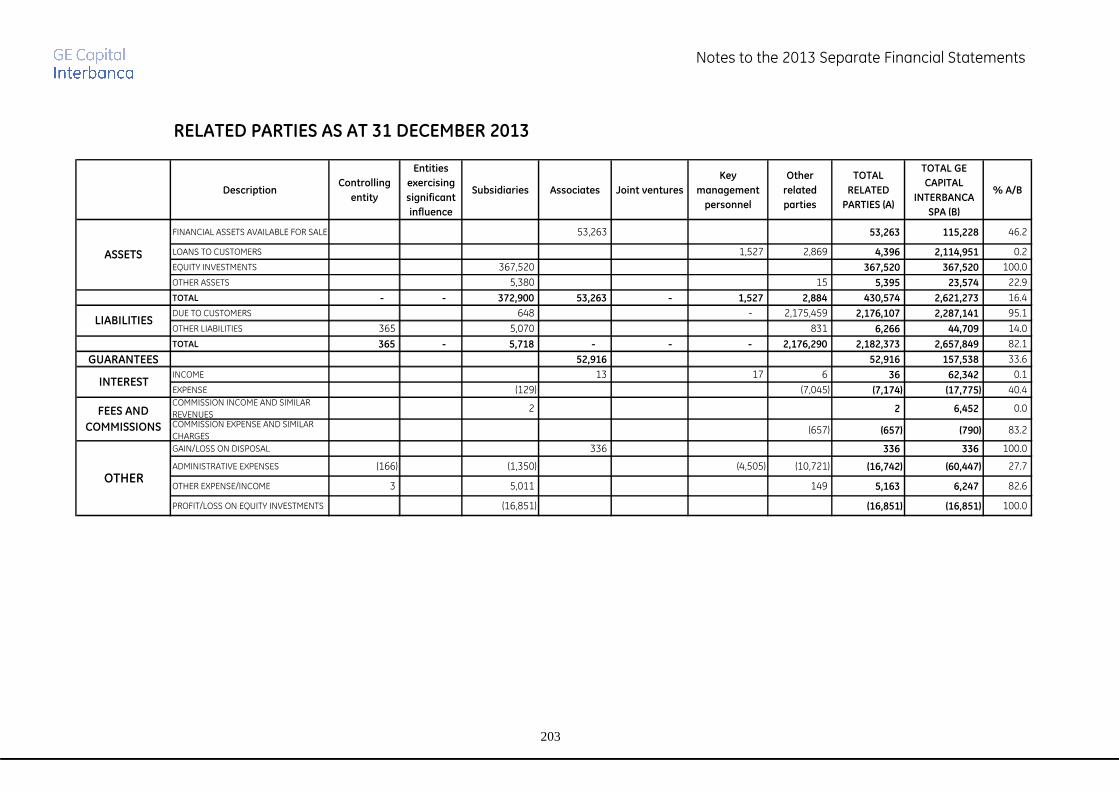
Notes to the 2013 Separate Financial Statements
203
RELATED PARTIES AS AT 31 DECEMBER 2013
DescriptionControlling
entity
Entities
exercising
significant
influence
Subsidiaries Associates Joint ventures
Key
management
personnel
Other
related
parties
TOTAL
RELATED
PARTIES (A)
TOTAL GE
CAPITAL
INTERBANCA
SPA (B)
% A/B
FINANCIAL ASSETS AVAILABLE FOR SALE 53,263 53,263 115,228 46.2
LOANS TO CUSTOMERS 1,527 2,869 4,396 2,114,951 0.2
EQUITY INVESTMENTS 367,520 367,520 367,520 100.0
OTHER ASSETS 5,380 15 5,395 23,574 22.9
TOTAL - - 372,900 53,263 - 1,527 2,884 430,574 2,621,273 16.4
DUE TO CUSTOMERS 648 - 2,175,459 2,176,107 2,287,141 95.1
OTHER LIABILITIES 365 5,070 831 6,266 44,709 14.0
TOTAL 365 - 5,718 - - - 2,176,290 2,182,373 2,657,849 82.1
GUARANTEES 52,916 52,916 157,538 33.6
INCOME 13 17 6 36 62,342 0.1
EXPENSE (129) (7,045) (7,174) (17,775) 40.4 COMMISSION INCOME AND SIMILAR
REVENUES2 2 6,452 0.0
COMMISSION EXPENSE AND SIMILAR
CHARGES(657) (657) (790) 83.2
GAIN/LOSS ON DISPOSAL 336 336 336 100.0
ADMINISTRATIVE EXPENSES (166) (1,350) (4,505) (10,721) (16,742) (60,447) 27.7
OTHER EXPENSE/INCOME 3 5,011 149 5,163 6,247 82.6
PROFIT/LOSS ON EQUITY INVESTMENTS (16,851) (16,851) (16,851) 100.0
OTHER
ASSETS
LIABILITIES
INTEREST
FEES AND
COMMISSIONS

Notes to the 2013 Separate Financial Statements
204
(empty page)
Notes to the 2013 Separate Financial Statements
205
Part I
SHARE-BASED PAYMENTS
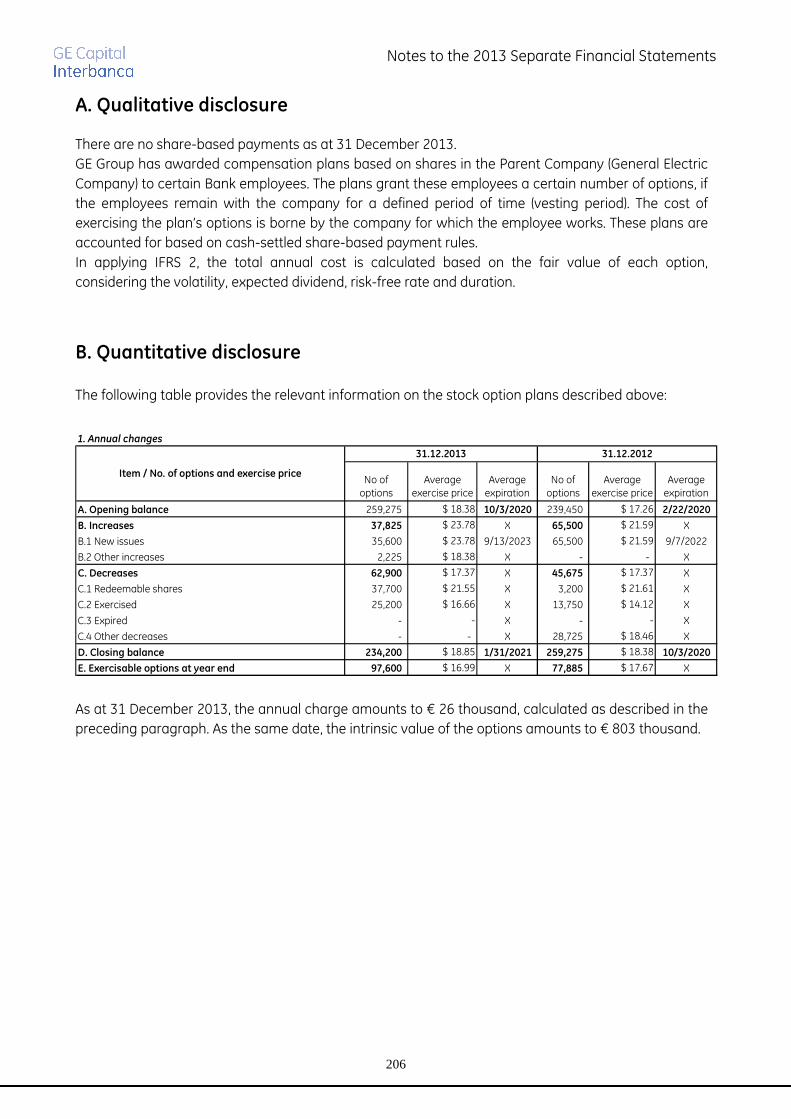
Notes to the 2013 Separate Financial Statements
206
A. Qualitative disclosure
There are no share-based payments as at 31 December 2013.
GE Group has awarded compensation plans based on shares in the Parent Company (General Electric
Company) to certain Bank employees. The plans grant these employees a certain number of options, if
the employees remain with the company for a defined period of time (vesting period). The cost of
exercising the plan’s options is borne by the company for which the employee works. These plans are
accounted for based on cash-settled share-based payment rules.
In applying IFRS 2, the total annual cost is calculated based on the fair value of each option,
considering the volatility, expected dividend, risk-free rate and duration.
B. Quantitative disclosure
The following table provides the relevant information on the stock option plans described above:
1. Annual changes
No of options
Average exercise price
Average expiration
No of options
Average exercise price
Average expiration
A. Opening balance 259,275 $ 18.38 10/3/2020 239,450 $ 17.26 2/22/2020
B. Increases 37,825 $ 23.78 X 65,500 $ 21.59 X
B.1 New issues 35,600 $ 23.78 9/13/2023 65,500 $ 21.59 9/7/2022
B.2 Other increases 2,225 $ 18.38 X - - X
C. Decreases 62,900 $ 17.37 X 45,675 $ 17.37 X
C.1 Redeemable shares 37,700 $ 21.55 X 3,200 $ 21.61 X
C.2 Exercised 25,200 $ 16.66 X 13,750 $ 14.12 X
C.3 Expired - - X - - X
C.4 Other decreases - - X 28,725 $ 18.46 X
D. Closing balance 234,200 $ 18.85 1/31/2021 259,275 $ 18.38 10/3/2020
E. Exercisable options at year end 97,600 $ 16.99 X 77,885 $ 17.67 X
Item / No. of options and exercise price
31.12.2013 31.12.2012
As at 31 December 2013, the annual charge amounts to € 26 thousand, calculated as described in the
preceding paragraph. As the same date, the intrinsic value of the options amounts to € 803 thousand.

Notes to the 2013 Separate Financial Statements
207
Part L
SEGMENT REPORTING

Notes to the 2013 Separate Financial Statements
208
SEGMENT REPORTING The Bank does not define individual segments for which segment reporting is required. In particular,
management does not distinguish the activities of the Bank in operating segments in taking strategic
decisions or in evaluating the Bank’s results.
The following relates to the disclosure required by IFRS 8 at the level of “entity in its entirety”:
� Disclosure regarding products and services: interest income, equivalent to € 62.3 million,
derives almost entirely from corporate lending (€ 59.9 million), also contributing to the
generation of fee and commission income of € 6.5 million, of which € 1.6 million is
attributable to guarantees granted. The remaining interest income is primarily the result of
current accounts with other banks (€ 1.0 million) and interest on debt securities classified in
the “Available for sale” portfolio (€ 0.9 million).
� Disclosure regarding geographic areas: in reference to the revenue breakdown by
geographic area, the revenues indicated above are produced almost exclusively in Italy
based on relationships with Italian customers. Buildings owned by the Bank are located
exclusively in Italy, the values for which are indicated in the related section of the Notes to
the Financial Statements.
� There are no individual customers whose revenues represent 10% of the total Bank
revenues.
Notes to the 2013 Separate Financial Statements
209
ADDITIONAL INFORMATION

Notes to the 2013 Separate Financial Statements
210
DISCLOSURE PURSUANT TO ARTICLE 2427-16 BIS OF THE ITALIAN CIVIL CODE
Pursuant to art. 2427-16 bis of the Italian Civil Code, the compensation paid to the Accounting
Audit Firm KPMG S.p.A. for services provided during the year is listed below:
• Accounting audit of the separate and consolidated financial statements: € 193
thousand;
• Limited half-year audit: € 82 thousand;
• Reporting package audit (SOX 404): € 100 thousand;
• Certification services: € 8 thousand.
The amounts above are expressed before applying VAT.

Notes to the 2013 Separate Financial Statements
211
DISCLOSURE PURSUANT TO ARTICLE 2497 BIS OF THE ITALIAN CIVIL CODE
The following is a summary of the essential data from the latest approved financial statements of the
company exercising management and control, GE Capital Corporation, in accordance with art. 2497-
bis, paragraph 4 of the Italian Civil Code:
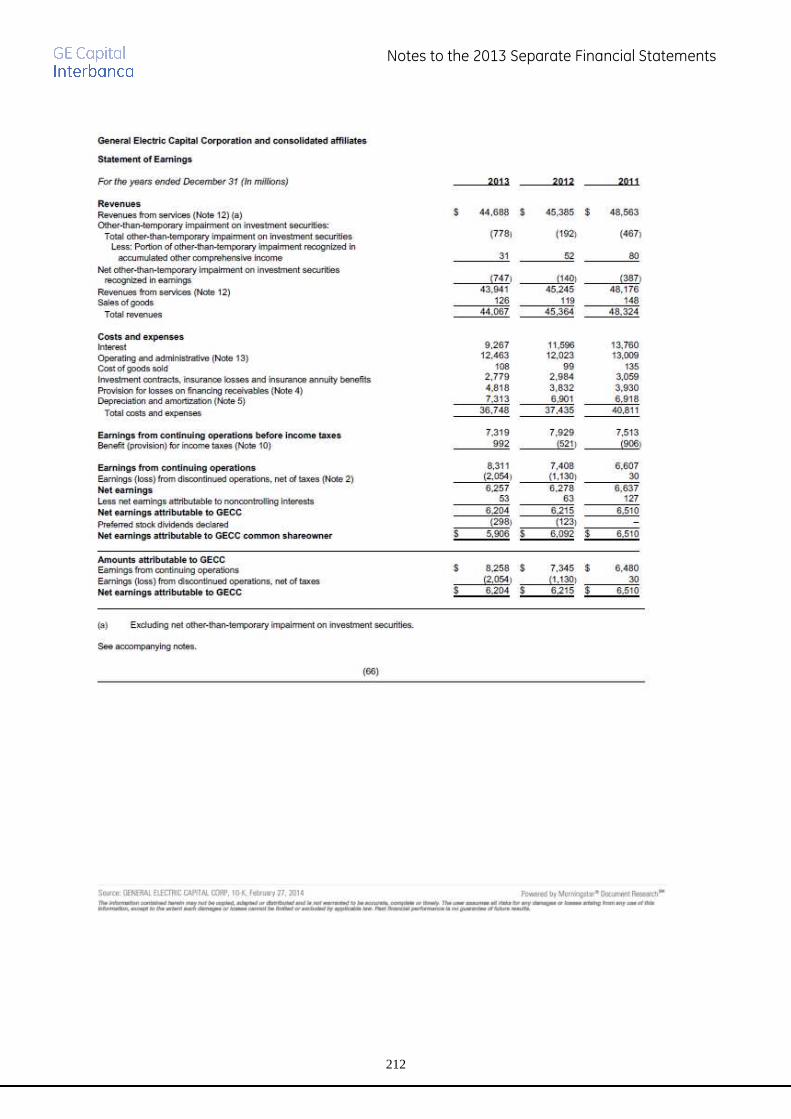
Notes to the 2013 Separate Financial Statements
212
Notes to the 2013 Separate Financial Statements
213
REPORT OF THE BOARD OF STATUTORY AUDITORS Board of Statutory Auditors' Report to the General Meeting of Shareholders
pursuant to art. 2429 of the Italian Civil Code in reference to the Financial
Statements closed as at 31 December 2013
Dear Shareholders,
T
he Financial Statements closed as at 31 December 2013, which the Directors have
submitted for your review and approval, were presented during the Board of
Directors meeting held 13 March 2014 and prepared according to international
accounting standards IAS/IFRS.
These Financial statements show a loss of € 128,269,192.31.
As provided for in the aforementioned international accounting standards, the
Financial Statements comprise the Statement of financial position, , Income
Statement, the Statement of Changes in Equity, the Statement of Comprehensive
Income, the Cash Flow Statement and the Notes and represent the Company’s
financial and economic position. The Directors’ Report on Operations presents the
Company’s situation, operating performance, both as a whole and for the Company’s
various segments, and the most important events that occurred during the year and
following the closing of the financial statements, as well as the management outlook.
The 2013 Income Statement of GE Capital Interbanca was substantially affected by
the lower contribution of the interest margins and the valuation components of the
non-performing loan portfolio, generated prior to the Bank’s acquisition by General
Electric Group, for which management recorded an impairment loss of € 137,640
thousand. The ratio of gross non-performing loans on total loans is 39.2%, compared
to 30.4% at the end of 2012.
Notes to the 2013 Separate Financial Statements
214
After excluding the write down of the investments in subsidiaries totalling € 16.851
thousand, net of taxes, the net loss decreased to approximately € 128.269 thousand ,
as compared to € 169.275 thousand as of December 31, 2012.
As at 31 December 2013, the GE Capital Interbanca Banking consists of the
following:
Parent Company:
•GE Capital Interbanca S.p.A.
Companies belonging to the Banking Group:
•GE Capital Servizi Finanziari S.p.A.
•GE Capital Finance S.r.l.
•GE SPV S.r.l.
Aside from the above subsidiaries, the Group consolidation perimeter also includes,
starting from 31 December 2012, GE Capital Services S.r.l., a non – financial
company operating in the long-term rental of cars and instrumentals goods business.
The Group closed the year with a consolidated net loss of € 118.977 thousand.
The 2013 Separate and Consolidated Financial Statements were audited by KPMG
S.p.A., which issued clean reports on 26 March 2014.
In accordance with legislative provisions, we performed controls on the
Company’s administration and supervised compliance with the law and the Articles
of Association.
Specifically, note that we:
• Participated in all Board of Directors meetings in 2013 and, during these
meetings, received detailed information on the most significant economic and
financial transactions carried out by the Company, ensuring that they were

Notes to the 2013 Separate Financial Statements
215
compliant with the law and the Articles of Association and were not manifestly
imprudent, risky, had potential conflicts of interest, or in contrast with
shareholders' meeting resolutions;
• Supervised the adequacy of the Company’s organisational structure and
compliance with principles of correct administration, through direct observation,
gathering information from managers of organisational departments and meetings
with the Accounting Audit Firm to exchange data and relevant information;
• Oversaw the adequacy of the internal control system and the administrative-
accounting system, as well as the reliability of the latter in properly representing
operational events, by obtaining information from managers of the respective
departments, reviewing business documents and analysing the results of work
performed by the Accounting Audit Firm. In particular, KPMG issued on 26
March 2014 its "Report pursuant to art. 19, paragraph 3 of Legislative Decree no.
39/2010”, which did not find any significant deficiencies in the internal control
system in relation to the financial reporting process;
• Verified the compliance with legislative regulations in preparing the Separate and
Consolidated Financial Statements and the respective Reports on Operations by
direct verification and information received from KPMG S.p.A.;
• Assessed and supervised the adequacy of instructions provided to subsidiaries,
that permitted them to provide information necessary for meeting communication
obligations provided for by law on a timely basis.
•

Notes to the 2013 Separate Financial Statements
216
Furthermore, note that:
• During 2013, 13 Board of Directors meetings were held and 8 meetings of the
Board of Statutory Auditors;
• We did not receive indications from the Board of Directors or the Accounting
Audit Firm of any atypical or unusual transactions with third parties, related
parted or intercompany transactions;
• Information provided by Directors regarding intercompany transactions and those
with related parties, which were inherent to and consistent with the business
purposes, should be considered completed;
• There were no complaints presented pursuant to art. 2408 of the Italian Civil
Code;
• The following assignments were granted to KPMG S.p.A. as communicated by
the Accounting Audit Firm:
o Audit of the Separate and Consolidated Financial Statements of GE Capital
Interbanca S.p.A. closed as at 31 December 2013 (compensation € 205,000
excluding expenses and VAT);
o Limited audit of the half-year report of GE Capital Interbanca S.p.A.
(compensation € 82,000 excluding expenses and VAT);
o SOX audit of the 2013 reporting package (compensation € 100,000 excluding
expenses and VAT);
• In its letter dated 26 March 2014, KPMG issued its annual confirmation of
independence in accordance with art. 17, paragraph. 9, letter a) of Legislative
Decree no. 39/2010.
Notes to the 2013 Separate Financial Statements
217
In performing its supervisory activities, as described above, no significant issues
emerged that required communication to the Supervisory Bodies or including in this
report.
We are in favour of approving the Financial Statements as at 31 December 2013 and
the proposal to cover losses proposed by the Board of Directors.
Milan, 26 March 2014
BOARD OF STATUTORY AUDITORS
Paolo A. Colombo
Marco Giorgino
Alberto Dalla Libera

Notes to the 2013 Separate Financial Statements
218
(empty page)
Notes to the 2013 Separate Financial Statements
219
Certification of the Financial Statements pursuant to article 154-bis of Legislative Decree no. 58 of 24 February 1998
The undersigned, Paolo Braghieri and Ettore Colombo, in their capacities as Chief Executive Officer and
Executive charged with preparing the financial reports of GE Capital Interbanca S.p.A., in accordance
with the provisions of art. 154-bis, paragraphs 3 and 4 of Legislative Decree no. 58 of 24 February
1998, do certify:
• The adequacy of the financial reports with regard to the characteristics of the business, and
• The actual implementation of the administrative and accounting procedures for preparing the
2013 Financial Statements.
Furthermore, we attest that the Financial Statements as at 31 December 2013:
a) Have been prepared under international accounting standards recognised by the European
Community in compliance with EC Regulation no. 1606/2002 of the European Parliament and
European Council decision of 19 July 2002, as well as implementing regulations issued in relation
to art. 9 of Legislative Decree no. 38 of 28 February 2005;
b) Correspond to the books and accounting entries;
c) Provide a true and correct representation of the equity, economic and financial position of the
Issuer.
The Directors’ Report on Operations includes an accurate analysis of performance and operating results,
as well as the situation of the Issuer, together with a description of the principal risks and uncertainties to
which they are exposed.
Milan, 13 March 2014
Paolo Braghieri Ettore Colombo
Chief Executive Officer Executive charged with preparing
[signature] the company's financial statements
[signature]

Notes to the 2013 Separate Financial Statements
220
(empty page)
Notes to the 2013 Separate Financial Statements
221
REPORT OF THE ACCOUNTING AUDIT FIRM

Notes to the 2013 Separate Financial Statements
222

Directors’ Report on Consolidated Operations
223
CONSOLIDATED ANNUAL REPORT OF THE GE CAPITAL INTERBANCA
BANKING GROUP

Directors’ Report on Consolidated Operations
224
(empty page)

Directors’ Report on Consolidated Operations
225
FINANCIAL AND OPERATING HIGHLIGHTS
CONSOLIDATED 2013 2012
in millions of Euros
Due from banks and loans to customers 3,895 4,405
Equity investments (including other equity interests) 70 75
Funding 3,861 4,174
Net interest margin (*) 90 103
Net fee and commission income (*) 12 13
Net interest and other banking income (*) 91 112
Net impairment losses (*) (177) (202)
Operating costs (*) (90) (116)
Net income (loss) for the period (*) (119) (165)
In %
Net interest margin / Net interest and other banking income (*) 98.9 91.9
Net fee and commission income / Net interest and other banking income (*) 13.5 12.0
Operating costs / Net interest and other banking income (*) 98.6 104.2
In millions of Euros
Equity 570 685
Regulatory Tier 1 Capital 523 642
Total regulatory capital 672 830
Capital ratios - in %
Regulatory Tier 1 Capital / Risk-weighted assets 13.2 14.2
Total regulatory capital / Risk-weighted assets 17.0 18.3
Credit risk ratios %
Net impaired loans / Total net loans 16.5 14.0
Net impaired loans / Equity 112.7 89.8
Net non-performing loans / Total net loans 3.8 3.7
In absolute terms
Headcount at year end 621 684
(*) 2012 consolidated income statement data is “pro-forma”, as it includes the results of GE Capital Services S.r.l, for
comparison purposes

Directors’ Report on Consolidated Operations
226
(empty page)

Directors’ Report on Consolidated Operations
227
DIRECTORS’ REPORT ON CONSOLIDATED OPERATIONS 229
SUMMARY OF CONSOLIDATED ACTIVITIES 237
2013 CONSOLIDATED FINANCIAL RESULTS 247
ADDITIONAL INFORMATION 254
OUTLOOK FOR 2014 264
CONSOLIDATED FINANCIAL STATEMENTS 265
NOTES TO THE CONSOLIDATED FINANCIAL STATEMENTS 275
• Part A – Accounting policies 277
• Part B – Information on the Balance Sheet 301
• Part C – Information on the Income Statement 337
• Part D – Statement of Comprehensive Income 357
• Part E – Information on risks and risk management policies 359
• Part F – Information on capital 407
• Part G – Business combinations 415
• Part H – Related-party transactions 417
• Part I – Share-based payments 421
• Part L – Segment reporting 423
CERTIFICATION OF THE CONSOLIDATED FINANCIAL STATEMENTS
PURSUANT TO ARTICLE 154 BIS OF LEGISLATIVE DECREE NO. 58 OF 24
FEBRUARY 1998
425
REPORT OF THE ACCOUNTING AUDIT FIRM 427
OFFICES 429

Directors’ Report on Consolidated Operations
228
(empty page)
Directors’ Report on Consolidated Operations
229
DIRECTORS’
REPORT
ON CONSOLIDATED
OPERATIONS
Directors’ Report on Consolidated Operations
230
(empty page)

Directors’ Report on Consolidated Operations
231
OVERVIEW OF THE BANKING GROUP'S BUSINESS ACTIVITIES
Dear Shareholders,
In 2013, the Banking Group confirmed its role as a key player in serving medium-sized businesses in
Italy, prioritising organic growth, with the objective of rebalancing the portfolio mix, integrating the
product/service offer and expanding cross-selling actions across the various businesses.
As in 2012, volumes for Group companies for the year grew considerably, despite the increasingly
difficult economic scenario, which brought about a substantial deterioration in credit quality,
recording an annual increase of 24.7%1 in non-performing bank loans.
As evidence of the consolidated re-launching of the Group’s commercial activities, total
disbursements in 2013 were € 2,041 million, a 39.3% increase from the € 1,465 million disbursed in
2012, and counter to the trend for the banking system2 , which posted a decline of 3.8% on an
annual basis in loans to the private sector.
Specifically, disbursements in the various business areas were as follows:
• GE Capital Finance, in the factoring business, posted a marked increase in volumes with €
1,177 million (+111%), confirming the company as an important player in the reference
market, in which it expanded its range of solutions to improve working capital in mid-sized
Italian businesses.
• GE Capital Interbanca, operating in lending, disbursed € 338 million (+8.3%);
• GE Capital Servizi Finanziari, which offers automotive and operating asset leasing, recorded
volumes of € 255 million (-18.8%) for auto leasing , reflecting particularly the effects
of the crisis in the automotive sector, but confirming the Company as a leader in the
reference market, and € 42 million (+35.5%) for operating asset leasing. The growth in
the latter was chiefly attributable to important partnerships signed with leading
operators in the sector, with the objective of intensifying the distribution channel for the
offer;
• GE Capital Services, in the rental business, recorded disbursements of € 231 million (-7.2%).
However, growth in volumes and the positive results for the commercial strategy, continually
validated through careful risk oversight, were not enough to offset the deterioration in the portfolio
quality for the Group’s outstanding loans, which declined as a result of continued weakness in the
economy, resulting in the recognition of a provision in the 2013 income statement for € 177 million.
1 Source: Bank of Italy

Directors’ Report on Consolidated Operations
232
The Banking Group closed 2013 with a net loss of € 119 million, despite the strengthening of the
commercial offer and initiatives undertaken to contain operating costs and optimise the corporate
structure, and facilitate technology and process synergies.
Dear Shareholders,
As Parent Company of the GE Capital Interbanca Banking Group, our institution, enrolled in the
Banking Group Register under no. 10685, is required to prepare the Consolidated Financial
Statements.
2 Source: Bank of Italy
Directors’ Report on Consolidated Operations
233
COMPOSITION OF THE BANKING GROUP
As at 31 December 2013, the GE Capital Interbanca Banking Group consists of the following:
Parent Company:
• GE Capital Interbanca S.p.A.
Companies belonging to the Banking Group:
• GE Capital Servizi Finanziari S.p.A.
• GE Capital Finance S.r.l.
• GE SPV S.r.l.
Furthermore, effective 1 May 2013, as part of the larger corporate simplification project of the GE
Capital Interbanca Group:
� The direct subsidiaries GE Leasing S.p.A. and Bios Interbanca S.r.l. were merged into GE
Capital Servizi Finanziari S.p.A, with retroactive application for accounting and tax purposes
from 1 January 2013;
� The indirect subsidiary GE Commercial Distribution Finance S.r.l. was merged into GE Capital
Finance S.r.l., with retroactive application for accounting and tax purposes from 1 January
2013.
Directors’ Report on Consolidated Operations
234
SCOPE OF CONSOLIDATION
In addition to the equity investments that make up the Banking Group, effective 31 December 2012,
the scope of consolidation includes GE Capital Services S.r.l, a non-financial company operating in
the market of long-term rental of vehicles and operating assets.
The indirect subsidiary GE Noleggi S.p.A. was merged into GE Capital Services S.r.l. effective 8
November 2013, with retroactive application for accounting and tax purposes from 1 January 2013.
The equity investments are consolidated as follows:
FULLY CONSOLIDATED EQUITY INVESTMENTS
Name Registered
offices
Parent
Company’s
percentage of
direct
investment
Banking Group’s
percentage of
investment
GE Capital Servizi Finanziari S.p.A. Mondovì – CU 100 100
GE Capital Finance S.r.l. (1) Milan 60 100
GE SPV S.r.l. (2) Conegliano –TV 0 100
GE Capital Services S.r.l. (3) Rome 79 100
(1) the remaining 40% is owned by the Group through GE Capital Servizi Finanziari S.p.A., which is part of the Banking Group
and 100% owned by GE Capital Interbanca S.p.A.
(2) the company is wholly owned by the Group through the subsidiary GE Capital Servizi Finanziari S.p.A.
(3) the remaining 21% is owned by the Group through GE Capital Servizi Finanziari S.p.A., which is part of the Banking Group
and 100% owned by GE Capital Interbanca S.p.A.
INVESTMENTS CONSOLIDATED UNDER THE EQUITY METHOD
Name Registered offices
Parent Company’s
percentage of
direct investment
Banking Group’s
percentage of
investment
Renting Italease S.r.l. (*) Milan 0 50
(*) Joint venture between Italease Gestione Beni S.p.A. and GE Capital Services S.r.l.
Directors’ Report on Consolidated Operations
235
BASES FOR PREPARATION OF THE CONSOLIDATED FINANCIAL
STATEMENTS
GE Capital Services S.r.l was acquired by the Parent Company on 31 December 2012 and, therefore,
became part of the scope of consolidation as at said date. The 2012 financial statements were
consolidated on a line-by-line basis only for balance sheet items (IFRS 3, paragraphs 8 and 9, IAS 27
paragraph 30).
In summary:
• The Consolidated Balance Sheet as at 31 December 2013 is comparable to that of 31
December 2012, as the scope of consolidation remained unchanged;
• The Consolidated Income Statement as at 31 December 2013 includes the companies in the
current scope of consolidation while the Consolidated Income Statement as at 31 December
2012 does not include the economic results of GE Capital Services S.r.l.

Directors’ Report on Consolidated Operations
236
KEY DATA FOR THE COMPANIES INCLUDED IN THE SCOPE OF
CONSOLIDATION
in thousands of Euros
GE CAPITAL
INTERBANCA
S.p.A.
GE CAPITAL
FINANCE
S.r.l.
GE CAPITAL
SERVIZI
FINANZIARI
S.p.A.
GE SPV
S.r.l.
GE CAPITAL
SERVICES
S.r.l.
BALANCE SHEET
DUE FROM BANKS 226,274 316 458 9 455
LOANS TO CUSTOMERS 2,114,951 231,319 990,418 0 331,595
TANGIBLE AND INTANGIBLE ASSETS 50,783 556 1,259 0 129,952
TAX ASSETS 252,584 10,848 45,096 1 40,160
FUNDING 2,517,953 113,874 860,721 0 369,023
PROVISION FOR RISKS AND CHARGES 24,508 2,326 5,506 0 13,202
EQUITY 544,819 118,159 242,314 10 94,545
INCOME STATEMENT
INTEREST MARGIN 44,567 1,863 23,032 0 20,744
NET FEES AND COMMISSIONS 5,662 2,725 4,835 81 (889)
NET ADJUSTMENTS (135,973) (365) (27,584) (13,297)
PROFIT/LOSS ON EQUITY INVESTMENTS (16,851) - (1,367) 0 -
OPERATING COSTS (58,419) (8,013) (19,867) (80) (3,694)
NET PROFIT (LOSS) (128,269) (3,418) (14,800) 0 9,275
Directors’ Report on Consolidated Operations
237
SUMMARY OF CONSOLIDATED ACTIVITIES
LOANS
Total loans to customers and due from banks declined 11.6% compared to the end of 2012.
In thousands of Euros 31.12.2013 % 31.12.2012 %
Due from banks 236,839 6.1 327,991 7.4
Loans to customers 3,658,308 93.9 4,076,799 92.6
Total 3,895,147 100.0 4,404,790 100.0
LOANS TO CUSTOMERS
Loans to customers declined 10.3% as a result of lower disbursements with respect to loans reaching
maturity and further write-downs.
Total disbursements in 2013 were € 2,041 million, a 39.3% increase from the € 1,465 million
disbursed in 2012, and counter to the trend for the banking system3 , which posted a decline of 3.8%
on an annual basis in loans to the private sector.
The higher growth, both in absolute terms as well as percentages, is due to Factoring, whose 2013
results confirm the complete turnaround of the business with new volumes originated of € 1.2 billion,
more than double the figure for 2012.
Conversely, lending activities for Auto Leasing experienced the greatest decline (-18.8%), reflecting
the crisis in the automotive sector, while corroborating the Company’s position as a leader in the
reference market.
Specifically, disbursements in the various business areas were as follows:
• Factoring for € 1,177 million (€ 557 million in 2012, +111%);
• Lending for € 336 million (€ 312 million in 2012, +7.7%);
• Automotive Leasing for € 255 million (€ 314 million in 2012, -18.8%);
• Rental for € 231 million (€ 249 million in 2012, -7.2%);
• Operating Asset Leasing for € 42 million (€ 31 million in 2012, + 35.5%).
3 Source: Bank of Italy
Directors’ Report on Consolidated Operations
238
DUE FROM BANKS
Due from banks, equivalent to € 237 million, decreased 27.8% from the end of December 2012. This
exposure, chiefly related to the Parent Company, consists primarily of deposits, mostly deposits held
as collateral for syndicated loans (IBLOR) for € 98 million, demand deposits of € 100 million, and, to a
lesser extent, collateral relationships associated with derivative transactions. The decrease is
primarily due to the effect of a temporary liquidity surplus related to early repayments by customers,
which was also seen in 2012.
ENDORSEMENTS AND GUARANTEES
Endorsements and guarantees are € 158 million, a decrease of 26.8%, and consist of sureties issued
for € 105 million (of which € 98 million for related IBLOR loan transactions where the collateral
deposit is included under Due from banks) and € 53 million for a pledge issued on shares in the
Parent Company’s equity portfolio.

Directors’ Report on Consolidated Operations
239
CREDIT REVIEW
The following table shows gross and net loans due from banks and customers, divided by risk class.
In thousands of Euros
Impaired loans 1.502.937 860.180 642.757 16,5 57,2 1.396.403 615.234 4,5
Non-performing 636.966 488.523 148.443 3,8 76,7 633.100 165.151 -10,1
Sub-standard 626.619 294.113 332.506 8,5 46,9 559.911 290.006 14,7
Restructured loans 109.018 50.933 58.085 1,5 46,7 69.137 49.867 16,5
Past due 130.334 26.611 103.723 2,7 20,4 134.255 110.210 -5,9
Performing loans 3.341.293 88.903 3.252.390 83,5 2,7 3.876.633 3.789.558 -14,2
Total loans 4.844.230 949.083 3.895.147 100,0 19,6 5.273.036 4.404.792 -11,6
Net exposure
31.12.2012
(D)
% Chg
(C/D)
Gross
exposure
31.12.2013
(A)
Total
impairment
losses
31.12.2013
(B)
Net
exposure
31.12.2013
(C)
%
(C)
% Coverage
ratio (B/A)
Gross
exposure
31.12.2012
In evaluating the trend in impaired loans during 2013, it is necessary to consider that on 27
December, the Parent Company sold, without recourse, non-performing loans related to 72 positions
for a total gross value of € 36.4 million, which had been completely written off. This sale took place
with the verified bankruptcy of the customers, all in bankruptcy proceedings, as well as the inclusion
of the loans as unsecured receivables as liabilities in the respective bankruptcy proceedings, for
which the Bank verified the non-recoverability of the receivable based on the results of actions taken
and the status of various procedures.
In terms of overall exposure, gross impaired loans increased by 6.7% on an annual basis (+10.2%
excluding the effects of the aforementioned sale). This increase is, for the most part, related to the
“Restructured” (+57.7%) and “Sub-standard” (+11.9%) categories, while the “Non-performing”
category decreased 0.6% (+6.4% excluding the effects of the sale) and the “Past due” category
declined by 2.9%.
2013 figures for the increase in the “Non-performing” category are better than those for the Italian
banking system4 (+24.7%).
Following the variations in gross loans presented above and the related trends in impairments, net
exposures increased 4.5% over the 2012 year-end figure.
The change in the coverage percentage on total impaired loans, currently at 57.2% compared to
55.9% at the end of the prior year, is related to the growth in exposures at greater risk.
The consolidated coverage level in recent years continues to be higher than the system's average. In
fact, for the non-performing category only, the risk data for the Italian banking system showed an
increasing trend, with a coverage percentage that was 39.1% in 2009 and reached 48.6% in
December 2013, while the Group’s figures during the same period showed an increasing trend from
60.3% in 2009, reaching 76.7% at the end of 2013.
4 Source: ABI Economic Analysis Department

Directors’ Report on Consolidated Operations
240
Principal loan ratios
Impaired loans
In % 31.12.2013 31.12.2012
Gross impaired loans / Total gross loans 31.0 26.5
Net impaired loans / Total net loans 16.5 14.0
Net impaired loans / Equity 112.7 89.8
Non-performing
In % 31.12.2013 31.12.2012
Gross non-performing loans / Total gross loans 13.1 12.0
Net non-performing loans / Total net loans 3.8 3.7
Net non-performing loans / Equity 26.0 24.1
Sub-standard
In % 31.12.2013 31.12.2012
Gross sub-standard loans / Total gross loans 12.9 10.6
Net sub-standard loans / Total net loans 8.5 6.6
Net sub-standard loans / Equity 58.3 42.3
Restructured
In % 31.12.2013 31.12.2012
Gross restructured loans / Total gross loans 2.2 1.3
Net restructured loans / Total net loans 1.5 1.1
Net restructured loans / Equity 10.2 7.3
Loans past due by 90 days or more
In % 31.12.2013 31.12.2012
Past due by 90 days or more gross / Total gross loans 2.7 2.5
Past due by 90 days or more net / Total net loans 2.7 2.5
Past due by 90 days or more net / Equity 18.2 16.1

Directors’ Report on Consolidated Operations
241
EQUITY INVESTMENTS
Note that the sole equity investment at the consolidated level refers to Renting Italease S.r.l., a joint
venture with Italease Gestione Beni S.p.A., recognised at a value of € 754 thousand.
Refer to the Directors’ Report on Operations for the Parent Company GE Capital Interbanca S.p.A.’s
2013 Annual Report for more information on the activities and financial results of the subsidiaries
consolidated on a line-by-line basis.
CORPORATE FINANCE
Corporate finance refers exclusively to activities carried out by the Parent Company, as summarised
below:
• The Equity Investment portfolio consists of 7 active positions, with a total exposure of € 60.3
million. During the year, the equity investment in Roal Electronics S.p.A. was sold and the
Almeco S.p.A bond was fully repaid;
• The “Other equity interests” portfolio amounted to approximately € 9.5 million, and consisted
of 8 positions mainly resulting from restructuring transactions for customers in temporary
financial difficulty, which resulted in part of the debt being converted to capital or similar
equity instruments.
TANGIBLE ASSETS
Tangible assets amount to € 179 million as at 31 December 2013 and increased for the value of
assets associated with the long-term operating rentals of automobiles, which contributed € 130
million.
The remaining balance of € 48 million is related to real estate in Milan and Turin owned by the Parent
Company.

Directors’ Report on Consolidated Operations
242
FUNDING
MAIN FUNDING ITEMS
In thousands of Euros 31.12.2013 % 31.12.2012 %
Due to banks 11,957 0.3 16,192 0.4
Due to customers 3,629,261 94.0 3,831,635 91.8
Securities in issue 219,705 5.7 325,999 7.8
Total 3,860,923 100.0 4,173,826 100.0
Total funding (including subordinated loans) decreased by 7.5%, consistent with the decline in loan
volumes over the course of 2013.
Due to banks
Due to banks is essentially made up of short-term funding on the MID. The Parent Company did not
take advantage of the sources of financing made available by the ECB.
Due to customers
In thousands of Euros 31.12.2013 % 31.12.2012 %
Group loans 3,362,422 92.6 3,491,054 91.1 Deposits and demand deposits 214,841 5.9 149,103 3.9 Securitisation 36,107 1.0 176,887 4.6 Other funding 15,891 0.0 14,591 0.4
Total 3,629,261 100.0 3,831,635 100.0
Financing lines consist primarily of intercompany funding for a total of € 3.4 billion.
Intercompany funding includes the ten-year subordinated loan of € 200 million that the Parent
Company received from ABN Amro Bank NV (which subsequently changed ownership, first to
Santander and currently to GE Capital Corporation), maturing 10 October 2016, which qualifies as
lower Tier Two capital, carrying a 3-month Euribor interest rate plus a spread of 0.28%. The loan
agreement does not have any change-of-control clauses.
The item “Deposits and current accounts” includes liquidity generated from corporate customers – a
service to support businesses in managing excess liquidity and optimising yields through time
deposits – increased during 2013 with respect to the previous year, caused by dynamics in liquidity
management on the part of said customers.
This item also includes the financing line obtained following the securitisation of the auto leasing
portfolio at the end of 2010. The exposure amounted to € 36 million as at 31 December 2013, a

Directors’ Report on Consolidated Operations
243
decrease of 79.6%, reflecting the suspension of loan transfers to GE SPV S.r.l. during the year,
following the closure of the revolving period.
Securities in issue
In thousands of Euros 31.12.2013 % 31.12.2012 %
Bonds 216.509 98,5 320.261 98,2
Certificates of deposit 3.196 1,5 5.738 1,8
Total 219.705 100,0 325.999 100,0
This item consists almost entirely of bonds. At the end of 2013, there were 8 bonds in issue from the
Parent Company, of which 2 were listed on the Milan MOT and 1 on the Luxembourg Stock Exchange,
for a total value of € 83 million.
No bond issues were carried out during 2013.

Directors’ Report on Consolidated Operations
244
FINANCIAL ASSETS AND LIABILITIES
Financial assets and liabilities refer exclusively to Parent Company activities, as summarised below:
In thousands of Euros 31.12.2013 31.12.2012
Debt securities 45,404 53,555
- available for sale 45,404 53,555
Derivatives recognised as assets 50,504 85,963
- held for trading 50,010 85,032
- held for hedging 494 931
Derivatives recognised as liabilities 53,668 81,314
- held for trading 53,668 81,211
- held for hedging - 103
Debt securities
The final balance of debt securities is entirely made of up Italian Treasury Certificates (CCT) and Long-
Term Treasury Bonds (BTP), used as collateral in favour of the Bank of Italy in order for the Parent
Company to operate on the Interbank Deposit Market (MID) and the Collateralised Interbank Market
(MIC).
Derivatives held for trading
Almost all derivatives recognised as assets and liabilities held for trading as at 31 December 2013
were tied to interest rate and currency contracts, negotiated with the Parent Company’s Corporate
customers until the end of 2009. At the same time, the Parent Company carried out counter-
transactions with leading financial institutions.
The write-downs on impaired positions amount to € 5.9 million, while the “credit value adjustment”
component for performing positions is € 1 million. As long as this component remains at insignificant
levels, it does not invalidate the current classification of the fair value of the derivative portfolio as
belonging to Level 2, in that the value continues to be calculated by valuation models that use
observable input from active markets.
Hedging derivatives
Transactions in place involve solely rate risk hedges for 2 of our bond issues and consist of swaps
featuring characteristics (such as expiry and indexing) identical to those of the items hedged, trading
with leading Italian and international banks.

Directors’ Report on Consolidated Operations
245
DEFERRED TAX ASSETS
The balance of this item, equivalent to € 288.7 million, decreased by € 2.5 million compared to 31
December 2012. This decrease is mainly due to:
• Conversion of deferred tax assets, existing as at 31 December 2012 associated with loan
impairments deductible over 18 years for € 53.7 million, into tax credits in accordance with
Law no. 214/2011;
• Reversals for the year of € 13.1 million;
• Recognition of new deferred tax assets for the year of € 69.6 million, of which € 50 million
refer to losses and write-downs on loans for the year and deductible at a fixed rate over 5
years for both IRES and IRAP purposes.
Directors’ Report on Consolidated Operations
246
EQUITY
As at 31 December 2013, share capital and reserves – inclusive of the loss for the period – amounted
to € 570.3 million, down € 114.7 million (-16.7%) with respect to the figure recorded at the end of
2012.
The principal changes relate to:
• Positively, valuation reserves, with a balance of € 4.3 million, in relation to the adjustment of
the fair value on available-for-sale financial instruments and actuarial changes for the
severance indemnity;
• Negatively, the loss for the year of € 119.0 million.
REGULATORY CAPITAL AND CAPITAL REQUIREMENTS
Tier 1 Capital amounts to € 523 million, down 18.6% compared to 31 December 2012, primarily
attributable to the loss for the year of € 119 million.
Tier 2 Capital is also lower due to the figurative amortisation of € 40 million from the inclusion of the
subordinated loan for € 200 million expiring in 2016, offset by the positive change in the valuation
reserves for available-for-sale financial instruments.
Against these changes, total regulatory capital amounts to € 672.5 million, down 19% compared to
the end of 2012.
With regard to capital requirements, note that risk assets decreased, despite the drop in regulatory
capital in all of its components, which helps maintain the consolidated coefficients at higher levels
than those calculated and required by Bank of Italy, following its Supervisory Review and Evaluation
Process (SREP) carried out in 2013, for the Bank as Parent Company, both in terms of the Common
Equity Tier 1 ratio (13.2%) and the Total Capital ratio (17.0%).
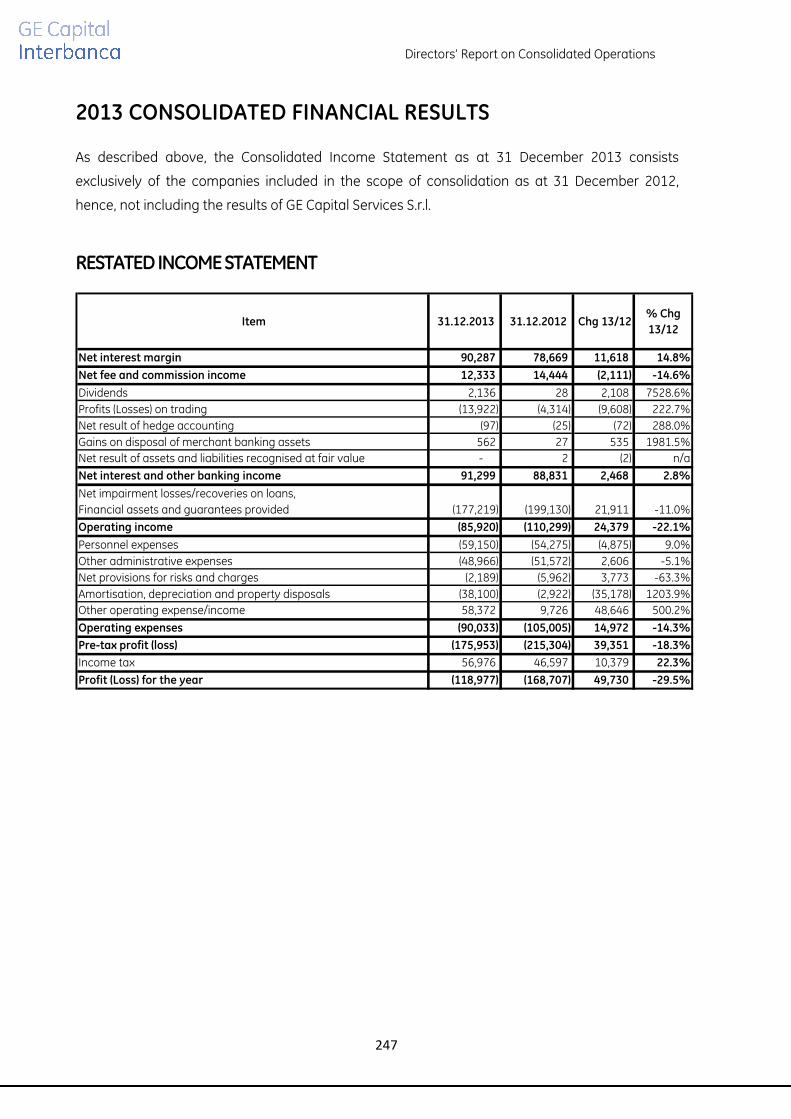
Directors’ Report on Consolidated Operations
247
2013 CONSOLIDATED FINANCIAL RESULTS
As described above, the Consolidated Income Statement as at 31 December 2013 consists
exclusively of the companies included in the scope of consolidation as at 31 December 2012,
hence, not including the results of GE Capital Services S.r.l.
RESTATED INCOME STATEMENT
Item 31.12.2013 31.12.2012 Chg 13/12 % Chg
13/12
Net interest margin 90,287 78,669 11,618 14.8%
Net fee and commission income 12,333 14,444 (2,111) -14.6%
Dividends 2,136 28 2,108 7528.6%
Profits (Losses) on trading (13,922) (4,314) (9,608) 222.7%
Net result of hedge accounting (97) (25) (72) 288.0%
Gains on disposal of merchant banking assets 562 27 535 1981.5%
Net result of assets and liabilities recognised at fair value - 2 (2) n/a
Net interest and other banking income 91,299 88,831 2,468 2.8%
Net impairment losses/recoveries on loans,
Financial assets and guarantees provided (177,219) (199,130) 21,911 -11.0%
Operating income (85,920) (110,299) 24,379 -22.1%
Personnel expenses (59,150) (54,275) (4,875) 9.0%
Other administrative expenses (48,966) (51,572) 2,606 -5.1%
Net provisions for risks and charges (2,189) (5,962) 3,773 -63.3%
Amortisation, depreciation and property disposals (38,100) (2,922) (35,178) 1203.9%
Other operating expense/income 58,372 9,726 48,646 500.2%
Operating expenses (90,033) (105,005) 14,972 -14.3%
Pre-tax profit (loss) (175,953) (215,304) 39,351 -18.3%
Income tax 56,976 46,597 10,379 22.3%
Profit (Loss) for the year (118,977) (168,707) 49,730 -29.5%
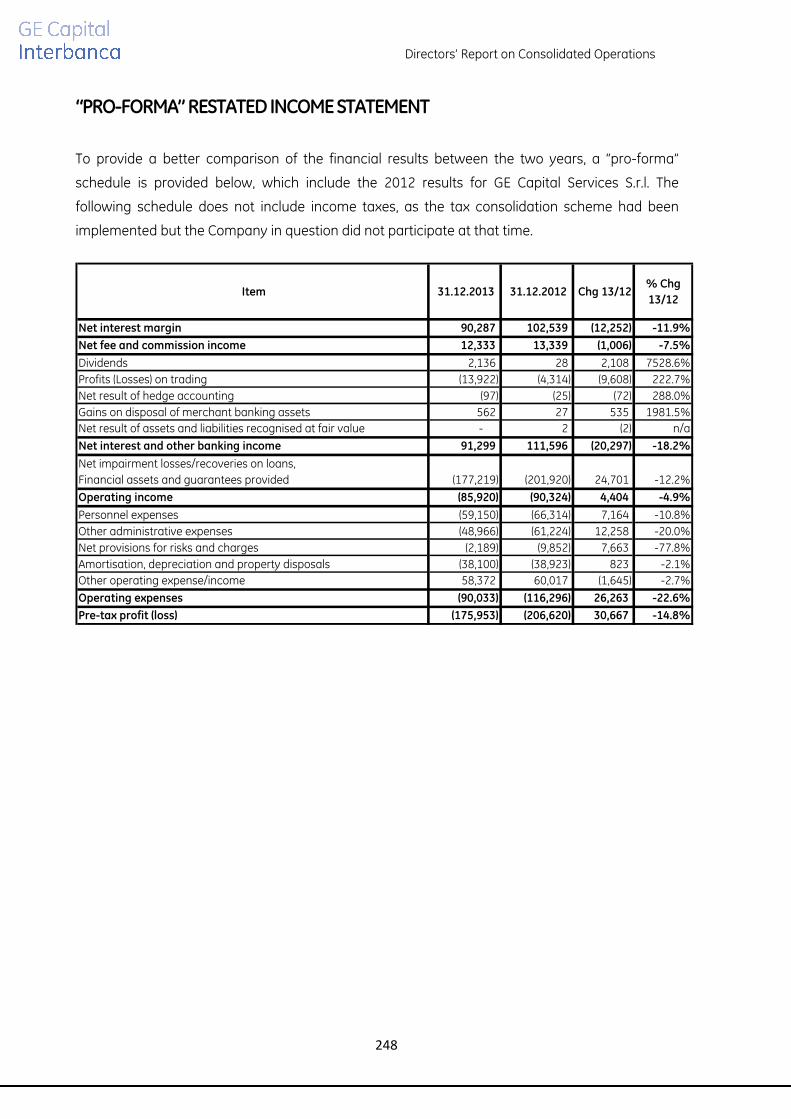
Directors’ Report on Consolidated Operations
248
“PRO-FORMA” RESTATED INCOME STATEMENT
To provide a better comparison of the financial results between the two years, a “pro-forma”
schedule is provided below, which include the 2012 results for GE Capital Services S.r.l. The
following schedule does not include income taxes, as the tax consolidation scheme had been
implemented but the Company in question did not participate at that time.
Item 31.12.2013 31.12.2012 Chg 13/12 % Chg
13/12
Net interest margin 90,287 102,539 (12,252) -11.9%
Net fee and commission income 12,333 13,339 (1,006) -7.5%
Dividends 2,136 28 2,108 7528.6%
Profits (Losses) on trading (13,922) (4,314) (9,608) 222.7%
Net result of hedge accounting (97) (25) (72) 288.0%
Gains on disposal of merchant banking assets 562 27 535 1981.5%
Net result of assets and liabilities recognised at fair value - 2 (2) n/a
Net interest and other banking income 91,299 111,596 (20,297) -18.2%
Net impairment losses/recoveries on loans,
Financial assets and guarantees provided (177,219) (201,920) 24,701 -12.2%
Operating income (85,920) (90,324) 4,404 -4.9%
Personnel expenses (59,150) (66,314) 7,164 -10.8%
Other administrative expenses (48,966) (61,224) 12,258 -20.0%
Net provisions for risks and charges (2,189) (9,852) 7,663 -77.8%
Amortisation, depreciation and property disposals (38,100) (38,923) 823 -2.1%
Other operating expense/income 58,372 60,017 (1,645) -2.7%
Operating expenses (90,033) (116,296) 26,263 -22.6%
Pre-tax profit (loss) (175,953) (206,620) 30,667 -14.8%
Directors’ Report on Consolidated Operations
249
Net interest margin
The net interest margin amounted to € 90.3 million, a 14.8% increase, primarily due to the expansion
of the scope of consolidation, which contributed € 20.7 million.
The net contribution of the “pro-forma” interest margin showed a decrease of 11.9% from the 2012
year-end figure of € 102.5 million.
This decrease over the previous year is due to lower margins, as a result of the reduction in the
Parent Company’s portfolio (down € 340 million in average volumes), together with higher funding
costs applied on renewed credit lines for the auto lease segment.
Net fee and commission income
The net result deriving from the provision of services amounts to € 12.3 million, down 14.6% from
€ 14.4 million in the prior year. This decrease is primarily due to the lower contribution from
Corporate Finance and Auto Lease activities as well as commission expense of € 0.9 million for GE
Capital Services.
The positive figure for 2013 was generated by Factoring activities, as a result of the considerable
increases in volumes during the year, which produced commission income that was € 1.7 million
higher than 2012.
Dividends
Dividends collected during the year of € 2.1 million are essentially attributable to the Parent
Company’s equity investment in Dayco LCC.
Profits (losses) on trading
Trading activities, conducted solely by the Parent Company, consist of derivative transactions carried
out for corporate customers until 2009, in order to provide them with hedges for business operating
risks, while the Bank carried out a counter-transaction with leading financial institutions.
The period result revealed a negative balance of € 13.9 million, an increase from the figure as at 31
December 2012 and amounting to a loss of € 4.3 million; in particular, this figure was affected by the
analytic write-downs of certain impaired positions.

Directors’ Report on Consolidated Operations
250
Net result of hedge accounting
This income statement item, showing a marginal loss of € 97 thousand, reflects changes in fair value
of hedging derivatives and the underlying assets and liabilities.
Profits on disposal of Private Equity investments
During the year just ended, the profits deriving from the Parent Company’s Private Equity activities
amounted to € 0.6 million and referred almost entirely to the sale of the equity investment in Roal
Electronics S.p.A.
Net impairments, charge-offs and reversals of loans, financial assets and
guarantees provided
Net impairments, equivalent to € 177.2 million, although down 11% from the previous year,
represent the income statement component that weighed most heavily on consolidated profit,
reflecting the persistent effects of the economic crisis that began in 2008 as well as the current
liquidity crisis for manufacturing companies and consumers.
In the specific case of the Parent Company, note that this adjusting component, equivalent to € 133
million, is entirely related to the portfolio prior to the acquisition by GE Capital Group. Additionally, as
previously mentioned in the section on impaired loans to customers, the Parent Company and its
subsidiaries have adopted GE Capital Group’s conservative internal policies for credit risk and
maintain coverage levels on the impaired portfolio that are higher than those for the banking system.
Assessments carried out on equity interests and on financial instruments associated with Corporate
Finance activities, classified in the available-for-sale financial assets item, resulted in changes in fair
values that, in the debt securities component, led to the recognition of impairments totalling € 3
million in the income statement.
Operating expenses
Operating expenses decreased 14.3% over the previous year. This impressive result is attributable to
several factors, the most significant of which are the 5.1% decline in administrative expenses and
allowances for risks and charges.
The “pro-forma” result is even more positive, with a decrease of 22.6%, including a 20% drop in
administrative expenses and a 10.8% drop in personnel expenses.
Directors’ Report on Consolidated Operations
251
Personnel expenses
This item amounts to € 59.1 million as at 31 December 2013, up 9%, essentially due to the new scope
of consolidation, whose negative contribution was € 11.4 million; of this, € 3.5 million is for charges
incurred for the collective personnel reduction procedure, as per Law no. 223/91, for which the
agreement was signed on 18 June 2013.
However, labour costs in the “pro-forma” version were down 10.8% compared to the previous year.
This significant result is attributable to fixed and variable salary components, together with lower
costs incurred for employment-related actions compared to 2012, the year in which the voluntary
redundancy incentive plan for senior management was carried out.
Note that additional charges of € 0.9 million were incurred compared to the prior year for
adjustments to the Parent Company’s 2009 redundancy programme, relative to the extension of the
inclusion in the Banking Sector Solidarity Fund, pursuant to art. 24, para. 14 of Law 214/2011.
Other administrative expenses
“Other administrative expenses” were down 5.1% from 2012 despite the negative contribution of €
9.5 million as a result of the new scope of consolidation. The “pro-forma” result is even better, with a
20% reduction.
The expenditure components that had the most influence on the drop in administrative expenses are
those relating to the Master Service Agreements entered into with the General Electric Group and also
includes royalties for use of the GE name and brand, which together decreased € 4.4 million, following
both a redefinition of the contractual base for the royalties, as well as a different division of costs in
the Master Service Agreement on local platforms.
Note that the general decrease in administrative expenses is the result of the first year under the
costs savings project, which seeks to reduce costs by renegotiating the existing service contracts and
from a general cost containment policy.
Directors’ Report on Consolidated Operations
252
Net provisions for risks and charges
The negative balance of € 2.2 million for this item, an improvement of € 3.8 million compared to
2012, is mainly attributable to the allocations made against positions defined as “at risk” associated
with legal disputes, net of releases for completed transactions and the surplus recognised on said
transactions.
For more information, refer to the comments in the Notes to the Consolidated Financial Statements -
Part B - Section 12.
Amortisation, depreciation and property disposals
The total of income statement items 180, 190 and 250 for amortisation, depreciation and property
disposals increased by € 35.2 million, as a result of the inclusion in the scope of consolidation of the
assets associated with the long-term rental of automobiles and machinery.
The “pro-forma” shows a more consistent result, a decline of € 0.8 million, or 4%.
Other operating expense/income
This item shows an increase of € 48.6 million, essentially attributable to the contribution in the new
scope of consolidation from rental income related to fleet automobiles and other rental assets
relative to GE Capital Services.
The “pro-forma” shows a more consistent result, a decline of € 1.6 million, or 2.7%.
Income tax and net profit (loss) for the period
The pre-tax result was a loss of € 176 million, an improvement from the pre-tax loss of € 215.3
million in the previous year.
The income tax component was positive for € 57.0 million mainly related to the recognition of
deferred tax asset relative to loan write-downs that are convertible into tax credits according to
governing regulation, as well as the effects of participation in the tax consolidation with specific
agreements among the companies belonging to the Group’s scope of consolidation.
Specifically, these companies:
• Recognised the amount of the deferred tax assets associated with write-downs and impairments
on loans deductible over 5 years, net of uses for releases of impairments on loans deductible over
18 years, allocated in previous years and converted into tax credits, as well as loan write-downs
exceeding the deductible limit for unregulated companies, increasing the balance as at 31
December 2012 from € 259.4 million to € 271.5 million; with the approval of the 2013 Financial
Directors’ Report on Consolidated Operations
253
Statements and, at the same time, recognising a statutory loss, it will be possible to continue with
the conversion of deferred tax assets into tax credits as described above for € 43.3 million, mainly
from GE Capital Interbanca S.p.A. for € 40.5 million and GE Capital Servizi Finanziari S.p.A. for € 2.5
million;
• Having recognised the amount of deferred tax assets associated with impairment, they may
proceed, following the submission of the 2014 UNICO, with converting deferred tax assets into
tax credits for € 0.4 million (GE Capital Finance S.r.l.); this value represents, based on available
data, the amount of the 2013 tax loss generated by the reversal of timing differences on loan
write-downs deductible over 18 years;
• With the approval of the 2012 Financial Statements, converted into tax credits the deferred tax
assets for loan impairments deductible over 18 years, recognised as at 31 December 2012 for €
42.2 million, primarily generated by GE Capital Interbanca S.p.A. for € 39.5 million and by GE
Capital Servizi Finanziari S.p.A. for € 2.4 million, in relation to the 2012 Italian statutory loss;
• In September 2013, following the submission of the 2013 UNICO, deferred tax assets related to
loan impairments and deductible over 18 years were converted into tax credits, recognised as at
31 December 2012 for € 11.5 million (GE Capital Interbanca S.p.A. for € 10.9 million and GE
Capital Finance S.r.l. for € 0.6 million), related to the 2012 tax loss;
• Despite the tax loss position, did not recognise deferred tax assets on previous losses and other
temporary differences, of a lower amount, for a total of € 61.5 million, as, consistent with IAS 12,
general market conditions give rise to substantial uncertainty on the timing and amount of future
taxable profit that the Group may generate.
Net of income taxes, the loss for the year amounts to € 119.0 million, a decrease of 29.5% compared
to the loss of € 168.7 million in 2012.
Directors’ Report on Consolidated Operations
254
ADDITIONAL INFORMATION
RESEARCH AND DEVELOPMENT
The companies included in the scope of consolidation do not engage in research and development
activities.
INVESTMENTS
Information Technology
During 2013, information technology projects focused on completing the modernisation and
simplification of the infrastructure:
• The Data Centre Consolidation project was completed with the closing of 5 Data Centres and
the concentration of production equipment in a single site in Milan, which meets the
conservative security policies of GE Capital Group;
• The Disaster Recovery environment was renewed to ensure operations continuity consistent
with the business requirements;
• The summary systems used for Supervisory and Anti-Money Laundering reporting were
updated for new regulations;
• A system for producing reports required by the Federal Reserve was developed and
consolidated.
Tangible assets
During 2013, projects to restructure office space were completed, improving operating efficiency; in
particular:
• Extraordinary maintenance was performed on the Bank’s premises in Corso Venezia 56 and
Via Borghetto 5 in Milan. The work on the systems mainly involved extraordinary
maintenance on lifts, installing a system to automatically return the lift to the ground floor in
an emergency, heating and air-conditioning systems and emergency lighting systems;
• Rental contracts were cancelled on offices used for hard copy archives and archiving
services were outsourced to an external supplier;
• The Rome branch in Via Principessa Clotilde 7 was relocated to Via F. Cesi 72, bringing about
a reduction in operating costs and a better use of office space.
Directors’ Report on Consolidated Operations
255
HUMAN RESOURCES
Breakdown of Personnel
Of the 621 employees as at 31 December 2013 (684 in 2012), 54 had part-time contracts (62 in 2012).
Solidarity Fund
Following the recognition by INPS of the Bank’s compliance with requirements for accessing the
safeguard measures referred to in art. 24, para. 14 of Law no. 214/2011, during 2013, 16 employees
terminated their employment relationship with the Bank to have access to the extraordinary benefits
of the Solidarity Fund, as they were already participating in the Agreement of 14 January 2010 and
indicated as participants in the Agreement of 22 December 2011.
The financial impact of access to the Solidarity Fund for these 16 employees had already been
allocated in previous years; the cost difference of € 0.9 million was allocated during the year, to
extend participation in the Solidarity Fund for eligible employees until they reach 62 years of age.
Collective redundancy procedure as per Law no. 223/91
On 5 April 2013, GE Capital Services S.r.l. opened a personnel reduction procedure as per arts. 4 and
24 of Law no. 223/91 for 47 redundant positions, 33 in the Sesto San Giovanni office and 14 in the
Rome office.
This procedure was concluded with a trade union agreement signed on 18 June 2013 at the Ministry
of Labour, in accordance with the aforementioned governing regulation, for a total of 45 redundant
positions.
The same agreement provided for the reassignment of 8 positions that would be included in the
redundancy programme beyond the deadline of 120 days referred to in Law no. 223/91, however,
not beyond 30 June 2014. In addition, voluntary redundancy incentives were envisaged, whose
amount was associated with the number of years of service, age, family responsibilities and Law no.
104/92.
During the implementation of the agreement, 18 employees were reassigned, 10 more than
envisaged in the agreement, for the same number of positions that opened up in other Group
companies.
To date, 26 employees were made redundant upon formalisation with the trade union of the
agreement to not oppose the redundancy assignment, as well as the additional 6 employees that will
be made redundant by the agreement’s expiration. This agreement, whose costs were allocated in
full during the year, is in the phase of implementation and execution.

Directors’ Report on Consolidated Operations
256
“HealthAhead” Programme
HealthAhead is a General Electric Group global initiative with the objective of helping employees and
their families develop healthy lifestyles and is part of the broader General Electric Group programme,
"Healthymagination", which reflects the Group’s commitment to develop a culture that promotes
health through internal initiatives and investments.
The programme includes the creation of the internal Wellness Committee that organises activities
with health education content and makes tools and structures available to assist in realising these
activities. The Italian HealthAhead team organised activities in 2013 around the following topics:
• Physical activities - fitness classes at the office sites and outdoor running groups were
organised throughout the year; in addition, agreements were made with gyms near the
offices;
• Nutrition - meetings on a healthy diet and cooking classes for children were organised to
promote healthy eating habits;
• Tobacco – the smoking prohibition has been confirmed in all buildings and external areas;
professional psychological support was offered for smokers who have initiated a cessation
programme and reflexology sessions were offered to treat nicotine addition;
• Education and prevention - various sessions on prevention and body composition analysis
were offered:
• Stress management - a programme on stress management techniques was organised.
Stock options
General Electric Company granted options for its stock to certain employees of GE Group companies.
In the Notes to the Financial Statements - Part A Accounting Policies - the accounting standards
adopted in applying IFRS 2 are explained. Under the section “Share-based payments”, the
quantitative and qualitative features of the plans are detailed.
Directors’ Report on Consolidated Operations
257
CORPORATE GOVERNANCE
For information regarding Corporate Governance and, in particular:
• The composition of corporate bodies;
• “Related parties”, as per Bank of Italy Circular no. 263/2006 and subsequent amendments;
• The Banking Group and its corporate restructuring;
• Articles of Incorporation;
• Administrative liability of legal entities;
• Management and coordination activities;
• Administrative-financial governance,
refer to the contents of the Directors’ Report on Operations for the 2013 Separate Financial
Statements of the Parent Company GE Capital Interbanca S.p.A.

Directors’ Report on Consolidated Operations
258
PUBLIC DISCLOSURE
On its internet site (www.gecapitalinterbanca.it), the Parent Company publishes both the 2013
Financial Statements as well as "public disclosure" (Bank of Italy Circular no. 285), in which it provides
information regarding capital adequacy, risk exposure and the general characteristics of systems for
identifying, measuring and managing risk.
RISKS, UNCERTAINTIES AND CONTINUITY
For a thorough examination of the methods for measuring and managing credit, financial and other
relevant risks, refer to the specific section of the Notes to the Financial Statements.
In reference to Bank of Italy/CONSOB/ISVAP Document no. 4 of 6 March 2010, in which Directors are
requested to provide information to clarify the impact of the economic and financial crisis,
operational and strategic options, and corrective actions to be taken to confront the contingencies of
the current market and business situation, it should be noted that GE Capital Interbanca Group will
continue to operate for the foreseeable future and that these consolidated financial statements are a
reliable representation of the Group’s economic and financial situation and have been prepared
under the assumption of a going concern.
The main uncertainties to which the GE Capital Interbanca Group is exposed are associated with
trends in the real economy and the resulting impacts on typical activities it performs, as well as the
estimation processes for financial assets, with particular reference to the loan portfolio.
The Group is organised to handle these uncertainties, backed by an asset structure that
demonstrates the constant commitment by the GE Capital Group to ensure asset adequacy and
compliance with regulatory requirements.
Disclosure pursuant to the joint Bank of Italy/CONSOB/IVASS Document no. 6 of 8 March 2013.
The Group does not hold any long-term investments financed through term-structured repos.

Directors’ Report on Consolidated Operations
259
RELATIONS WITH SUPERVISORY BODIES
Following the Supervisory Review and Evaluation Process (SREP) conducted in 2013, the Bank of Italy,
in reviewing the capital objectives for the leading intermediaries in the banking system, requested
the Bank (in Protocol no. 144784/14 of 10 February 2014), as Parent Company, to maintain a
consolidated Common Equity Tier 1 ratio greater than 9.5% and a consolidated Total Capital ratio of
at least 11.5%. The Board of Directors and the Board of Statutory Auditors were informed of this
request by the competent internal departments on 27 February 2014.
During 2013, the Parent Company also worked directly with Bank of Italy on compensation policies
and strengthening the capital of GE Capital Interbanca Group.
RELATIONS WITH THE REVENUE AGENCY
On 10 May 2013, the Milan Provincial Tax Commission accepted the out-of-court settlement
proposal for a payment of € 1.4 million, thereby extinguishing the dispute with the Parent
Company, which arose following the tax audit for the 2006 tax year, which was prior to the
acquisition by GE Group.
Moreover, a tax assessment notice and a notification of penalty were received by GE Capital
Servizi Finanziari S.p.A. and GE Capital Services S.r.l. claiming that the following companies
had not properly applied withholding taxes on interest paid to the Hungarian lender.
Furthermore, in the same context, note that the other Group companies, including the Parent
Company, have responded to questionnaires received from the Revenue Agency in reference
to interest paid in 2009.
At the time these financial statements were being drawn up, the aforementioned companies
submitted in a timely manner, with the support of the GE Capital Group’s tax structures and
the external tax consultants, tax settlement proposals, appeals and statements in their
defence in relation to the penalties applied, and paid one-third of the tax amount, amounting
to Euro 6,5 million, pending the resolution of the dispute.
On 5 March 2014, the Parent Company received a letter from the Revenue Agency
concerning the start of a tax audit in relation to direct taxes, VAT and IRAP for 2010 and
2011.

Directors’ Report on Consolidated Operations
260
TAX CONSOLIDATION
Beginning in the 2013 tax year, the National Tax Consolidation Scheme was extended to the
subsidiary GE Capital Services S.r.l, which is not part of the Banking Group.
Hence, considering the mergers with retrospective accounting and tax effective dates of 1 January
2013 of the already consolidated GE Leasing Italia S.p.A, Bios Interbanca S.r.l. and GE Distribution
Finance S.r.l., the current scope of the National Tax Consolidation Scheme includes GE Capital
Interbanca S.p.A. (as consolidating company), together with GE Capital Servizi Finanziari S.p.A., GE
Capital Finance S.r.l., GE SPV S.r.l. and GE Capital Services S.r.l. (as consolidated companies).
Consistent with adopted GE Group practices, the consolidation agreements in effect within the Italian
tax group envisage that any tax losses brought into the tax consolidation by individual companies
are not reimbursed to said companies. In addition, the agreements envisage that taxes on any
taxable income due from individual entities making up the national tax group are reimbursed only if,
and to the extent that, they are effectively paid to tax authorities by the consolidating body, on the
basis of the results of the Group’s national tax consolidation.
For more information on the accounting impact of these contractual terms, refer to the section of the
Notes to the Financial Statements regarding accounting policies.
The effects of these agreements on the income tax item are described in the Notes to the Financial
Statements section “Taxes on income from continuing operations”.
NEW TAX LEGISLATION
The new items introduced by the Stability Law (Law no. 147 of 27 December 2013) include the
reformulation of the tax treatment of write-downs and impairments on loans to customers for credit
and financial institutions referred to in Legislative Decree no. 87/92, effective from the tax year
underway as at 31 December 2013.
The new measures envisage that:
• Write-downs and impairment on loans to customers, other than those realised through the sale
for consideration, are deductible, both for IRES and IRAP purposes, at a fixed rate in the current
year and the following four years;
• Write-downs and impairment on loans to customers realised through the sale for consideration
are deductible in full in the year in which they are recognised in the financial statements, both for
IRES and IRAP purposes.
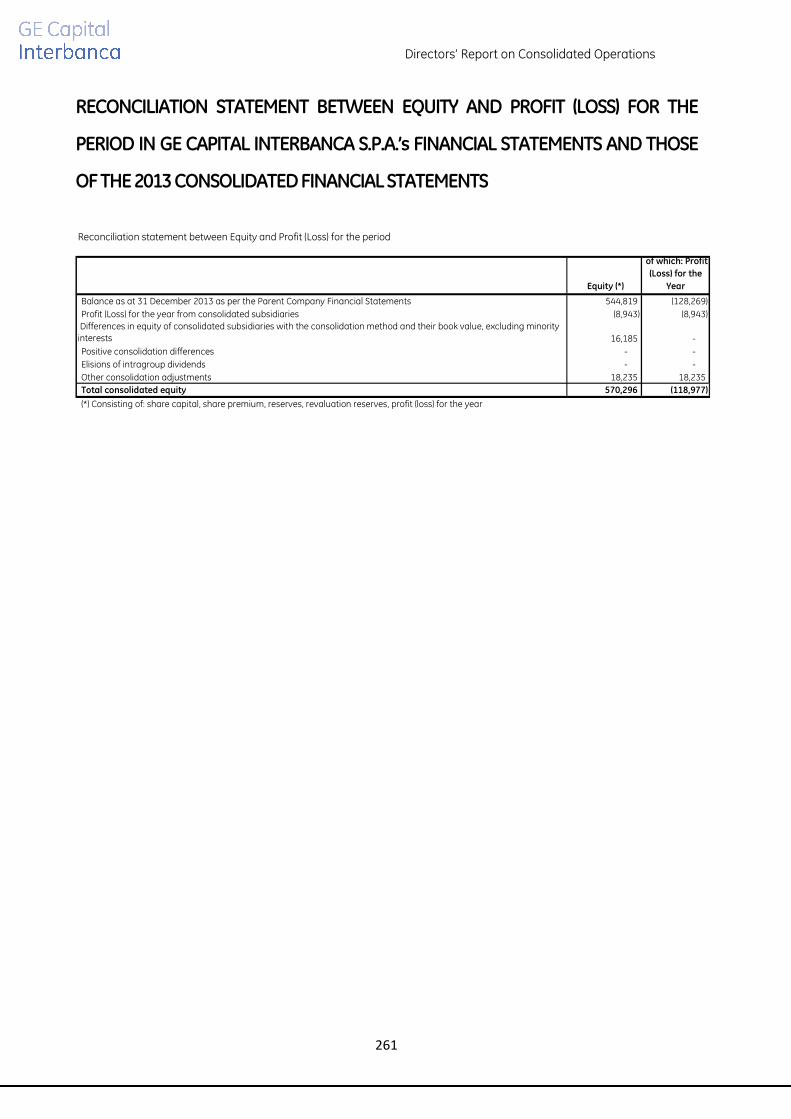
Directors’ Report on Consolidated Operations
261
RECONCILIATION STATEMENT BETWEEN EQUITY AND PROFIT (LOSS) FOR THE
PERIOD IN GE CAPITAL INTERBANCA S.P.A.’s FINANCIAL STATEMENTS AND THOSE
OF THE 2013 CONSOLIDATED FINANCIAL STATEMENTS
Reconciliation statement between Equity and Profit (Loss) for the period
Equity (*)
of which: Profit
(Loss) for the
Year
Balance as at 31 December 2013 as per the Parent Company Financial Statements 544,819 (128,269)
Profit (Loss) for the year from consolidated subsidiaries (8,943) (8,943)
Differences in equity of consolidated subsidiaries with the consolidation method and their book value, excluding minority interests 16,185 -
Positive consolidation differences - -
Elisions of intragroup dividends - -
Other consolidation adjustments 18,235 18,235
Total consolidated equity 570,296 (118,977)
(*) Consisting of: share capital, share premium, reserves, revaluation reserves, profit (loss) for the year
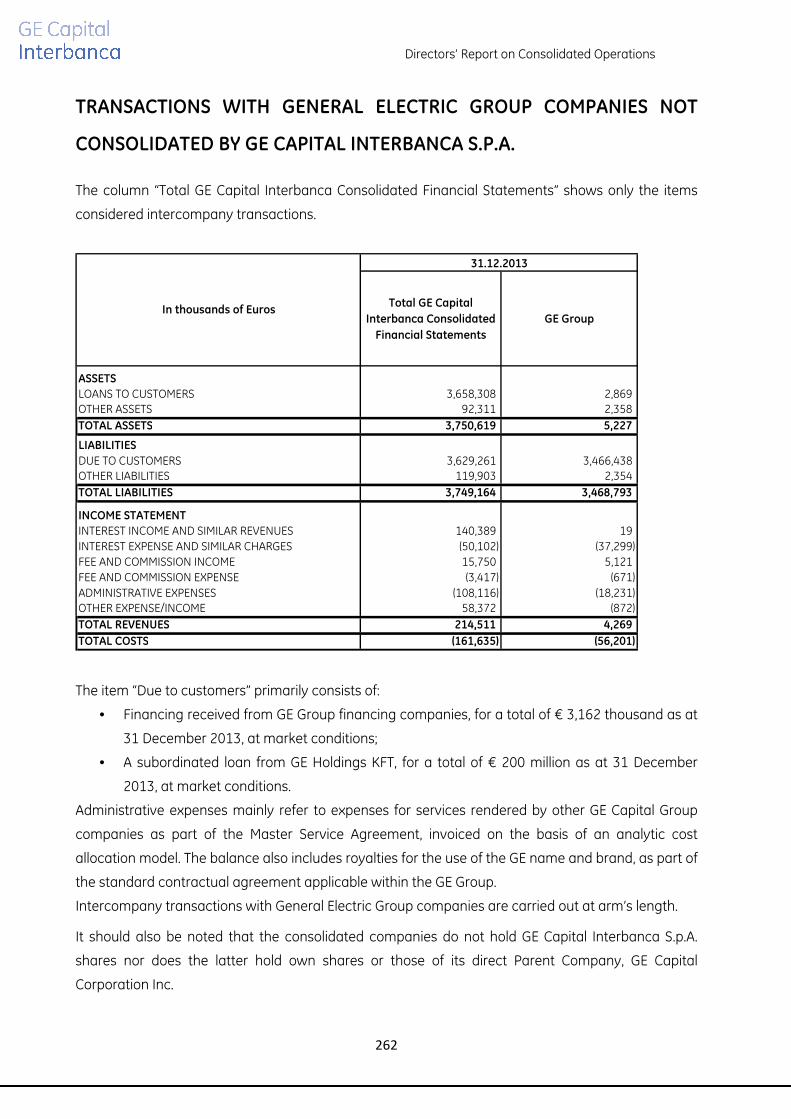
Directors’ Report on Consolidated Operations
262
TRANSACTIONS WITH GENERAL ELECTRIC GROUP COMPANIES NOT
CONSOLIDATED BY GE CAPITAL INTERBANCA S.P.A.
The column “Total GE Capital Interbanca Consolidated Financial Statements” shows only the items
considered intercompany transactions.
Total GE Capital
Interbanca Consolidated
Financial Statements
GE Group
ASSETS
LOANS TO CUSTOMERS 3,658,308 2,869
OTHER ASSETS 92,311 2,358
TOTAL ASSETS 3,750,619 5,227
LIABILITIES
DUE TO CUSTOMERS 3,629,261 3,466,438
OTHER LIABILITIES 119,903 2,354
TOTAL LIABILITIES 3,749,164 3,468,793
INCOME STATEMENT
INTEREST INCOME AND SIMILAR REVENUES 140,389 19
INTEREST EXPENSE AND SIMILAR CHARGES (50,102) (37,299)
FEE AND COMMISSION INCOME 15,750 5,121
FEE AND COMMISSION EXPENSE (3,417) (671)
ADMINISTRATIVE EXPENSES (108,116) (18,231)
OTHER EXPENSE/INCOME 58,372 (872)
TOTAL REVENUES 214,511 4,269
TOTAL COSTS (161,635) (56,201)
In thousands of Euros
31.12.2013
The item “Due to customers” primarily consists of:
• Financing received from GE Group financing companies, for a total of € 3,162 thousand as at
31 December 2013, at market conditions;
• A subordinated loan from GE Holdings KFT, for a total of € 200 million as at 31 December
2013, at market conditions.
Administrative expenses mainly refer to expenses for services rendered by other GE Capital Group
companies as part of the Master Service Agreement, invoiced on the basis of an analytic cost
allocation model. The balance also includes royalties for the use of the GE name and brand, as part of
the standard contractual agreement applicable within the GE Group.
Intercompany transactions with General Electric Group companies are carried out at arm’s length.
It should also be noted that the consolidated companies do not hold GE Capital Interbanca S.p.A.
shares nor does the latter hold own shares or those of its direct Parent Company, GE Capital
Corporation Inc.

Directors’ Report on Consolidated Operations
263
SIGNIFICANT EVENTS AFTER THE FINANCIAL YEAR END
There were no significant events after the financial year end for any of the companies included in the
scope of consolidation.

Directors’ Report on Consolidated Operations
264
OUTLOOK FOR 2014
Dear Shareholders,
GE Capital Interbanca Group is positioned for 2014 with a structure that is leaner and more focused,
due to reductions in the number of legal entities and the reorganisation of leasing activities.
The Group will continue to pursue its growth plans for all three product lines: lending, leasing and
factoring. Particular emphasis will be placed on cross-selling activities in the commercial network
through:
• The expected recovery in the leasing market that was sluggish throughout 2013;
• Signals from the lending market show that in the initial months of 2014, there was a steady
recovery of activities for competitors, with a resulting immediate compression in margins;
despite this, credit demand appears to be increasing;
• Significant growth in factoring volumes, despite a market that is expected to increase only
moderately.
In order to accelerate growth in volumes, partnerships with leading operators in the sector, such as
regional banks, will be pursued. In addition, emphasis will continue to be placed on the management
of loan portfolios, which are expected to see a reduction in impairments in 2014 due to the careful
selection of new disbursements and the stringent allocation policy followed in recent years.
Finally, cost reduction efforts will continue through the pursuit of operating efficiencies.
Notes to the 2013 Consolidated Financial Statements
265
CONSOLIDATED FINANCIAL STATEMENTS

Notes to the 2013 Consolidated Financial Statements
266
Assets
10. Cash and cash equivalents 2 1
20. Financial assets held for trading 50,010 85,032
30. Financial assets designated at fair value - -
40. Financial assets available for sale 115,228 122,561
60. Due from banks 236,839 327,991
70. Loans to customers 3,658,308 4,076,799
80. Hedging derivatives 494 931
100. Equity investments 754 2,154
120. Tangible assets 178,986 175,107
130. Intangible assets 3,564 2,517 of which:
- goodwill - -
140. Tax assets 348,773 309,285 a) current 60,098 22,852
b) deferred (*) 288,675 286,433
of which L.214/2011 250,437 254,004
160. Other assets 92,311 96,486
Total assets 4,685,269 5,198,864
31.12.2013 31.12.2012
CONSOLIDATED BALANCE SHEET (in thousands of Euros)
*) The comparison data for 2012 was modified to reflect changes following the amendment to IAS 19 "Employee
benefits" and the introduction of the new IAS 19 Revised, effective 1 January 2013. These changes resulted in an
increase in the severance indemnity fund for € 892 thousand, in the related deferred tax assets for € 246
thousand and in the equity valuation reserve for € 646 thousand.
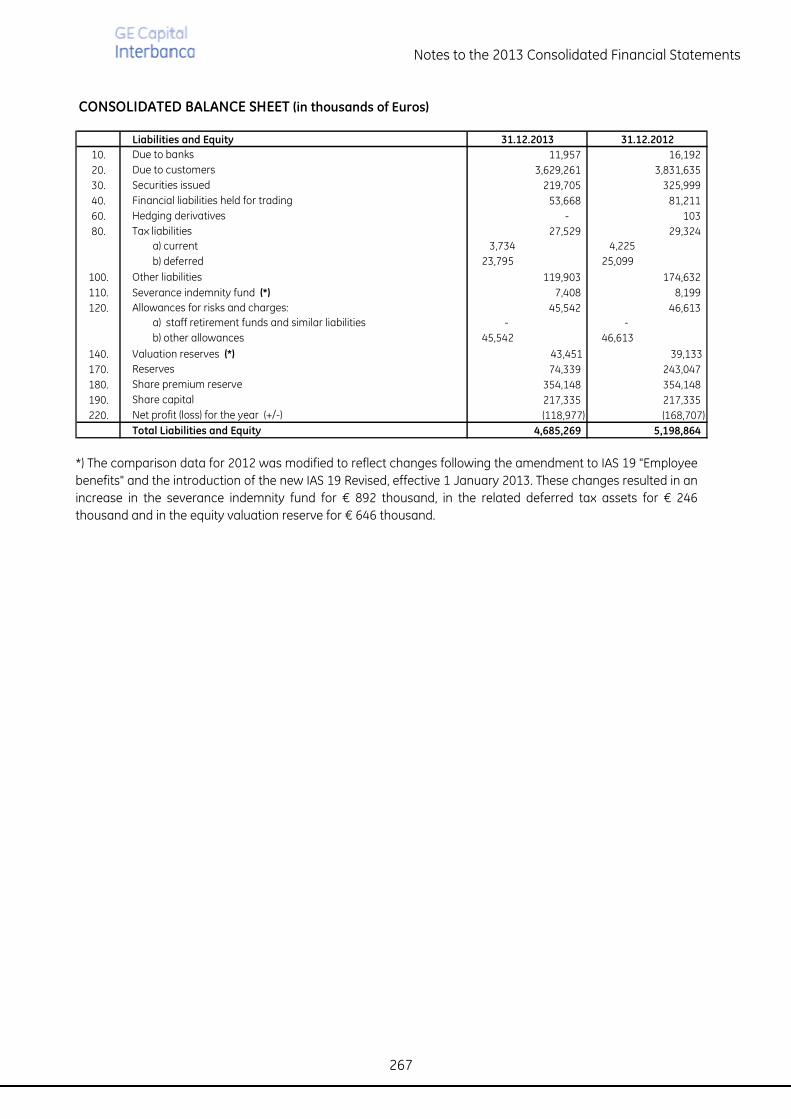
Notes to the 2013 Consolidated Financial Statements
267
Liabilities and Equity
10. Due to banks 11,957 16,192
20. Due to customers 3,629,261 3,831,635
30. Securities issued 219,705 325,999
40. Financial liabilities held for trading 53,668 81,211
60. Hedging derivatives - 103
80. Tax liabilities 27,529 29,324
a) current 3,734 4,225
b) deferred 23,795 25,099
100. Other liabilities 119,903 174,632
110. Severance indemnity fund (*) 7,408 8,199
120. Allowances for risks and charges: 45,542 46,613
a) staff retirement funds and similar liabilities - -
b) other allowances 45,542 46,613
140. Valuation reserves (*) 43,451 39,133
170. Reserves 74,339 243,047
180. Share premium reserve 354,148 354,148
190. Share capital 217,335 217,335
220. Net profit (loss) for the year (+/-) (118,977) (168,707)
Total Liabilities and Equity 4,685,269 5,198,864
31.12.201231.12.2013
CONSOLIDATED BALANCE SHEET (in thousands of Euros)
*) The comparison data for 2012 was modified to reflect changes following the amendment to IAS 19 "Employee
benefits" and the introduction of the new IAS 19 Revised, effective 1 January 2013. These changes resulted in an
increase in the severance indemnity fund for € 892 thousand, in the related deferred tax assets for € 246
thousand and in the equity valuation reserve for € 646 thousand.

Notes to the 2013 Consolidated Financial Statements
268
Item 31.12.2013 31.12.2012
10 Interest income and similar revenues 140,389 140,723
20 Interest expense and similar charges (50,102) (62,054)
30 Net interest margin 90,287 78,669
40 Fee and commission income 15,750 19,683
50 Fee and commission expense (3,417) (5,239)
60. Net fee and commission income 12,333 14,444
70 Dividends and similar revenues 2,136 28
80 Profits (Losses) on trading (13,922) (4,314)
90 Net result of hedge accounting (97) (7)
100 Profits (Losses) on disposal or repurchase of: 562 9
a) loans - -
b) financial assets available for sale 562 27
c) financial assets held to maturity - -
d) financial liabilities - (18)
110 Profits (Losses) on financial assets and liabilities
designated at fair value - 2
120 Net interest and other banking income 91,299 88,831
130 Net impairment losses and reversals of (impairment on): (177,219) (199,130)
a) loans (172,384) (176,073)
b) financial assets available for sale (2,985) (593)
c) financial assets held to maturity - -
d) other financial activities (1,850) (22,464)
140 Operating income (85,920) (110,299)
180. Administrative expenses: (108,116) (105,847)
a) personnel expenses (59,150) (54,275)
b) other administrative expenses (48,966) (51,572)
190. Net provisions for risks and charges (2,189) (5,962)
200. Net adjustments to/recoveries on tangible assets (37,080) (1,785)
210. Net adjustments to/recoveries on intangible assets (1,036) (1,241)
220. Other operating expense/income 58,372 9,726
230. Operating costs (90,049) (105,109)
270. Profits (Losses) on disposal of investments 16 104
280. Profit (Loss) before tax from continuing
operations (175,953) (215,304)
290. Taxes on income from continuing operations 56,976 46,597
300. Profit (Loss) before tax from continuing
operations (118,977) (168,707)
320. Profit (Loss) for the year (118,977) (168,707)
340. Parent Company's net profit (loss) (118,977) (168,707)
CONSOLIDATED INCOME STATEMENT (in thousands of Euros)

Notes to the 2013 Consolidated Financial Statements
269
Item 31.12.2013 31.12.2012
10. Profit (Loss) for the year (118.977) (168.707)
Other income components net of taxes not reclassified to profit or
loss: (91) (646)
40. Defined benefit plans (*) (91) (646)
Other income components after tax that may be reclassified to
profit or loss: 4.409 8.382
90. Cash flow hedges 40 135
100. Available-for-sale financial assets: 4.369 8.247
110. Total other income components net of taxes 4.318 7.736
120. Comprehensive income (Item 10 + 110) (114.659) (160.971)
STATEMENT OF COMPREHENSIVE INCOME
*) The comparison data for 2012 was modified to reflect changes following the amendment to IAS 19 "Employee
benefits" and the introduction of the new IAS 19 Revised, effective 1 January 2013. These changes resulted in an
increase in the severance indemnity fund for € 892 thousand, in the related deferred tax assets for € 246
thousand and in the equity valuation reserve for € 646 thousand.

Notes to the 2013 Consolidated Financial Statements
270
Issu
e o
f n
ew
sh
are
s
Pu
rch
ase
of
tre
asu
ry s
ha
res
Ext
rao
rdin
ary
div
ide
nd
s
Ch
an
ge
s in
eq
uit
y
inst
rum
en
ts
De
riv
ati
ve
s o
n t
rea
sury
sha
res
Sto
ck o
pti
on
s
Share capital: 217,335 - 217,335 - - - - - - - - - - 217,335
a) ordinary shares 217,335 - 217,335 - - - - - - - - - - 217,335
b) other shares - - - - - - - - - - - - - -
Share premium reserve 354,148 - 354,148 - - - - - - - - - - 354,148
Reserves: 93,290 - 93,290 79,446 - 70,311 - - - - - - - 243,047
a) retained earnings 88,709 - 88,709 79,446 - - - - - - 168,155
b) other 4,581 - 4,581 - - 70,311 - - - - - - - 74,892
Valuation reserves: (*) 31,397 - 31,397 7,736 39,133
Equity instruments - - - - - - - - - - - - - -
Treasury shares - - - - - - - - - - - - - -
Net profit (loss) for the year 79,446 - 79,446 (79,446) - - - - - - - - (168,707) (168,707)
Equity 775,616 - 775,616 - - 70,311 - - - - - - (160,971) 684,956
Movements in Equity
20
12
co
mp
reh
en
siv
e in
com
e
CONSOLIDATED STATEMENT OF CHANGES IN EQUITY (2012)
Ba
lan
ces
as
at
31
.12
.20
11
Ch
an
ge
s in
op
en
ing
ba
lan
ces
Ba
lan
ces
as
at
01
.01
.20
12
Allocation of prior Changes in the year
Eq
uit
y a
s a
t 3
1.1
2.2
01
2
Reserves
Div
ide
nd
s a
nd
oth
er
all
oca
tio
ns
Changes in
reserves
*) The comparison data for 2012 was modified to reflect changes following the amendment to IAS 19 "Employee benefits" and the introduction of the new IAS 19
Revised, effective 1 January 2013. These changes resulted in an increase in the severance indemnity fund for € 892 thousand, in the related deferred tax assets for €
246 thousand and in the equity valuation reserve for € 646 thousand.

Notes to the 2013 Consolidated Financial Statements
271
Issu
e o
f n
ew
sh
are
s
Pu
rch
ase
of
tre
asu
ry s
ha
res
Ext
rao
rdin
ary
div
ide
nd
s
Ch
an
ge
s in
eq
uit
y
inst
rum
en
ts
De
riv
ati
ve
s o
n t
rea
sury
sha
res
Sto
ck o
pti
on
s
Share capital: 217,335 - 217,335 - - - - - - - - - - 217,335
a) ordinary shares 217,335 - 217,335 - - - - - - - - - - 217,335
b) other shares - - - - - - - - - - - - - -
Share premium reserve 354,148 - 354,148 - - - - - - - - - - 354,148
Reserves: 243,047 - 243,047 (168,707) - - - - - - - - - 74,339
a) retained earnings 168,155 - 168,155 (168,155) - - - - - - -
b) other 74,892 - 74,892 (552) - - - - - - - - - 74,339
Valuation reserves: (*) 39,133 - 39,133 4,318 43,451
Equity instruments - - - - - - - - - - - - - -
Treasury shares - - - - - - - - - - - - - -
Net profit (loss) for the year (168,707) - (168,707) 168,707 - - - - - - - - (118,977) (118,977)
Equity 684,956 - 684,956 - - - - - - - - - (114,659) 570,296
Div
ide
nd
s a
nd
oth
er
all
oca
tio
ns
Changes in
reserves
Movements in Equity
20
13
co
mp
reh
en
siv
e in
com
e
CONSOLIDATED STATEMENT OF CHANGES IN EQUITY (2013)
Ba
lan
ces
as
at
31
.12
.20
12
Ch
an
ge
s in
op
en
ing
ba
lan
ces
Ba
lan
ces
as
at
01
.01
.20
13
Allocation of prior Changes in the year
Eq
uit
y a
s a
t 3
1.1
2.2
01
3
Reserves
*) The comparison data for 2012 was modified to reflect changes following the amendment to IAS 19 "Employee benefits" and the introduction of the new IAS 19
Revised, effective 1 January 2013. These changes resulted in an increase in the severance indemnity fund for € 892 thousand, in the related deferred tax assets for €
246 thousand and in the equity valuation reserve for € 646 thousand.

Notes to the 2013 Consolidated Financial Statements
272
OPERATING ACTIVITIES
as at
31.12.2013
as at
31.12.2012
1. MANAGEMENT 76.580 10.985
Interest received 140.224 145.839 Interest paid (48.815) (61.007) Dividends and similar revenuesNet fee and commission income 12.333 14.444 Personnel expenses (59.150) (54.275) Other costs (15.160) (37.216) Other income 47.148 5.442 Taxes paid - (2.242) Costs/Revenue for assets held for sale net of tax effect
2. CASH FLOWS FROM REDUCTIONS IN FINANCIAL ASSETS 400.197 370.496
Financial assets held for trading 34.925 (11.917) Financial assets designated at fair value - 2.963 Financial assets available for sale 4.348 (10.144) Due from banks 91.152 (11.381) Loans to customers 246.272 385.931 Other assets 23.500 15.044
4. CASH FLOWS FROM INCREASES IN FINANCIAL LIABILITIES (433.749) (363.166)
Due to banks (4.234) (6.575) Due to customers (201.562) (326.958) Securities issued (108.394) (10.391) Financial liabilities held for trading (27.543) 12.038 Financial liabilities designated at fair value through profit and loss (103) (218) Other liabilities (91.913) (31.062)
NET CASH FLOW FROM/(USED IN) OPERATING ACTIVITIES 43.028 18.315
INVESTING ACTIVITIES
as at
31.12.2013
as at
31.12.2012
1. CASH FLOW FROM 16 104
Sale of equity investmentsDividends receivedSale/Repayment of financial assets held to maturitySale of tangible assets 16 104 Sale of intangible assetsSale of business units
2. CASH FLOW USED IN 43.043 18.420
Acquisition of equity investments 1 15.078Acquisition of financial assets held to maturityAcquisition of tangible assets 40.959 1.157 Acquisition of intangible assets 2.083 2.185 Acquisition of business units
NET CASH FLOW FROM/(USED IN) INVESTING ACTIVITIES (43.027) (18.316)

Notes to the 2013 Consolidated Financial Statements
273
FINANCING ACTIVITIES
1. CASH FLOW FROM - 0
Proceeds from the issue of share capital / repurchase of treasury sharesProceeds from the issue of equity instruments / repurchase of equity instruments Dividends paid - 0
NET CASH FLOW FROM/(USED IN) FINANCING ACTIVITIES - 0
NET INCREASE (DECREASE) IN CASH AND CASH EQUIVALENTS DURING THE YEAR 1 (1)
RECONCILIATION
as at
31.12.2013
as at
31.12.2012
Cash and cash equivalents at beginning of the year 1 2
Total increase/(decrease) in cash and cash equivalents during the year 1 (1)
Cash and cash equivalents at end of the year 2 1

Notes to the 2013 Consolidated Financial Statements
274
(empty page)
Notes to the 2013 Consolidated Financial Statements
275
Notes to the Consolidated Financial Statements

Notes to the 2013 Consolidated Financial Statements
276
(empty page)

Notes to the 2013 Consolidated Financial Statements
277
Part A
ACCOUNTING POLICIES
Notes to the 2013 Consolidated Financial Statements
278
Part A. 1
Introduction
Section 1 Statement of compliance with International Financial Reporting Standards
These Consolidated Financial Statements as at 31 December 2013 have been prepared in
accordance with the International Financial Reporting Standards issued by the International
Accounting Standards Board (IASB) and each applicable interpretation of the International Financial
Reporting Interpretation Committee (IFRIC) contained in the text endorsed by the European
Commission, as established by EU Regulation no. 1606 of 19 July 2002.
The Consolidated Financial Statements comprise the Balance Sheet, Income Statement, the
Statement of Comprehensive Income, the Statement of Changes in Equity, the Cash Flow Statement
and the Notes. The Financial Statements are presented together with the Directors’ Report on
Operations. These financial statements have been prepared according to the instructions issued by
the Bank of Italy in its Regulation no. 262 of 22 December 2005 and subsequent updates and related
temporary provisions.
The Directors’ Report and the Notes to the Financial Statements provide all of the information
required by legal regulations, the Bank of Italy and the National Commission for Listed Companies and
the Stock Exchange (CONSOB).
The Consolidated Financial Statements are audited by the independent auditors KPMG S.p.A.
Section 2 Basis of accounting
These financial statements, unless otherwise stated, have been prepared in thousands of Euro and
are based on the following overall considerations set by IAS 1.
� Going concern. Assets, liabilities, and off-balance sheet transactions are valued assuming the
entity’s ability to continue as a going concern.
� Accrual basis of accounting. Costs and revenues are accrued and are recognised when they
satisfy the definitions and recognition criteria.
� Consistency of presentation. The presentation and classification of items in the financial
statements are retained from one period to the next unless a change is justified by a
requirement of a new international accounting standard (IAS/IFRS) or an interpretation (SIC) or
where it is deemed necessary to increase the relevance and reliability of the accounting
presentation. In the event of change, the new criteria will be adopted retrospectively – as far as
possible – providing details of the nature, reason and amount of the affected items. The

Notes to the 2013 Consolidated Financial Statements
279
presentation and classification of the items comply with the regulations prescribed by the
Bank of Italy with regard to banks’ financial statements.
� Materiality and aggregation. In accordance with the regulations prescribed by the Bank of Italy
for banks’ financial statements, each material class of similar items is presented separately.
Dissimilar items, instead, are aggregated unless they are material.
� Offsetting is not allowed. The Group’s assets and liabilities, income and expenses are not offset
unless required or permitted by an international accounting standard (IAS/IFRS), an
interpretation (SIC) or the regulations prescribed by the Bank of Italy.
� Comparative figures. Comparative data for the previous year is provided with regard to all the
information provided in these financial statements – also qualitative information where
deemed useful for a better understanding of the Group’s situation – unless otherwise required
and permitted by an international accounting standard or a related interpretation. The 2013
Income Statement is not comparable to that of the previous year, considering the acquisition
as at 31 December 2012 of GE Capital Services S.r.l. and its inclusion in the scope of
consolidation.

Notes to the 2013 Consolidated Financial Statements
280
Section 3 Scope and methods of consolidation
The Consolidated Financial Statements represent the economic and financial position of the GE Capital
Interbanca Banking Group, including the Parent Company and the companies for which the Parent
Company directly or indirectly holds the majority of voting rights.
GE Capital Services S.r.l was acquired by the Parent Company on 31 December 2012 and, therefore,
became part of the scope of consolidation as at said date. The 2012 financial statements were
consolidated on a line-by-line basis only for balance sheet items (IFRS 3, paragraphs 8 and 9, IAS 27
paragraph 30).
In summary:
• the Consolidated Balance Sheet as at 31 December 2013 is comparable to that of 31
December 2012, as the scope of consolidation remained unchanged;
• the Consolidated Income Statement as at 31 December 2013 includes the companies in the
current scope of consolidation while the Consolidated Income Statement as at 31 December
2012 does not include the economic results of GE Capital Services S.r.l.
In these Consolidated Financial Statements, investments in wholly-owned subsidiaries are accounted
for as follows:
Based on the full consolidation method, the carrying value of subsidiaries that are directly controlled
by the Parent Company is offset – against assets and liabilities of the subsidiaries – by the
corresponding Group’s share in the subsidiary’s equity, as restated to comply with the relevant
accounting standards. Intra-group assets and liabilities, off-balance sheet transactions, revenue and
charges, as well as income and losses arising from transactions between consolidated companies are
eliminated. Any positive differences between the value of investments in subsidiaries and the Group’s
share of equity in those subsidiaries are included under goodwill and are tested for impairment; any
negative differences are recognised in the income statement.

Notes to the 2013 Consolidated Financial Statements
281
Stakeholder % Share
A. Companies
A.1. Fully consolidated
3. GE Capital Servizi Finanziari S.p.A. Mondovì (Cuneo) 1 GE Capital Interbanca S.p.A. 100% 100%
4. GE Capital Finance S.r.l. Milan 1 GE Capital Interbanca S.p.A. 60% 100%
5. GE Capital Finance S.r.l. Milan GE Capital Servizi Finanziari S.p.A. 40% 100%
6. GE SPV S.r.l. Conegliano (Treviso) 1 GE Capital Servizi Finanziari S.p.A. 100% 100%
8. GE Capital Services S.r.l. Rome 1 GE Capital Interbanca S.p.A. 79% 100%
9. GE Capital Services S.r.l. Rome GE Capital Servizi Finanziari S.p.A. 21% 100%
(*) 1= majority of voting rights at the shareholders' meeting
1. Equity investments in subsidiaries, wholly-owned or under joint control (proportionally consolidated)
Effective
voting rights
%
Type of
relationship
(*)
Registered officesName of company
Investment ratio
Section 4 Post balance sheet events
Not applicable.

Notes to the 2013 Consolidated Financial Statements
282
Part A. 2
Notes on the Principal Accounting Items Financial assets held for trading
Classification criteria
This category includes debt and equity securities and the positive fair value of derivative contracts, held with the intention of generating short-term profits from price changes in said instruments. Derivative contracts include those embedded in combined financial instruments that are separately recognised where:
� The economic characteristics and risks of the embedded derivative are not closely related to the economic characteristics and risks of the host contract;
� A separate instrument with the same conditions as the embedded derivative would meet the definition of a derivative;
� The (combined) hybrid instrument is not recorded among financial assets and liabilities held for trading.
An embedded derivative financial instrument is the component of a (combined) hybrid instrument that also includes a non-derivative host contract, with the effect that some of the cash flows of the combined instrument vary in a manner similar to those of the stand-alone derivative.
Initial recognition and subsequent derecognition criteria
Financial assets such as debt and equity securities are initially recognised on the settlement date whereas derivative contracts are recognised on the subscription date.
Financial assets held for trading are initially recognised at cost, deemed as the fair value of the instrument, without considering any transaction costs or revenues directly attributable to the instrument.
The embedded derivative in the structured instruments not closely related to the host contract and which meets the definition of a derivative instrument is recorded separately from the host contract and valued at fair value whereas the host contract is accounted for in accordance with the requirements of the relevant IFRS.
Financial assets are derecognised when the contractual rights to the cash flows from those financial assets expire or when the financial assets are sold, transferring substantially all the risks and benefits of ownership.
Measurement criteria
After initial recognition, financial assets held for trading are recorded at fair value.
Fair value is determined by reference to the prices recorded in active markets, prices provided by market operators or internal valuation models commonly used by market participants, which take into account all risk factors related to the instruments and are based on observable market data.
Specifically, the instruments included in this item are unlisted derivative instruments that are valued using generally accepted valuation models populated on the basis of market parameters. Counterparty risk related to existing derivatives with corporate counterparties was estimated using the PD and LGD parameters on which the model for collective loan impairment was based.

Notes to the 2013 Consolidated Financial Statements
283
Financial assets available for sale
Classification criteria
Available-for-sale financial assets are those non-derivative financial assets that are designated as available for sale or are not classified as Loans and receivables, Assets held for trading or Assets held to maturity.
In particular, this category includes all securities that act as liquidity reserves, securities relating to investments in guarantee and placement syndicates, convertible notes held as part of equity investment activities, shareholdings held by the Group, excluded from the trading book and that cannot be classified as interests in subsidiaries, associates, or joint ventures, including private equity investments as well as shares of subscribed syndicated loans that are originally designated as available for sale.
Initial recognition and subsequent derecognition criteria
Initial recognition of financial assets under this category occurs on the settlement date for debt securities and equity instruments and on the disbursement date for loans.
Financial assets are initially recognised at cost, deemed as the fair value of the instrument, inclusive of any transaction cost or revenue directly attributable to the instrument.
Financial assets are derecognised when the contractual rights to the cash flows from those financial assets expire or when the financial assets are sold, essentially transferring all the risks and benefits of ownership related to them.
Measurement criteria
Subsequent to initial recognition, financial assets available for sale are measured at fair value, the interest (as per application of amortised cost) is recognised in the income statement whereas any gain and loss arising from changes in fair value is recorded in a specific Equity reserve until the financial asset is derecognised or an impairment loss is recorded. When the financial assets are sold or become impaired, the cumulative gain or loss is transferred to the income statement. Capital instruments for which fair value cannot be reliably measured according to the above guidelines are stated at cost. The fair value of debt instruments included in this category is calculated based on market prices for listed instruments, or, for unlisted instruments, based on the discounted contractual cash flows using interest rates representing the credit risk of the security being valued, derived from the market. The fair value of equity instruments included in this category is calculated, for listed instruments, based on market prices, or, for unlisted instruments, based on commonly used valuation models with parameters taken from the market.
At each balance sheet date or interim report date, the financial assets included in this portfolio are assessed for indication of impairment. In the event of impairment, the loss is recognised in the income statement as the difference between the value on initial recognition and the fair value on the reference date. The impairment indicators on equity instruments can be divided into two categories:
� Internal factors inherent to the company in question, and therefore, qualitative;
� External factors resulting from the business' market value (only for listed equity instruments), and therefore quantitative.
For qualitative indicators, the following factors are considered relevant: a significant variance from budget or forecast objectives as per long-term business plans, or the announcement or initiation of restructuring plans or insolvency or bankruptcy proceedings.
Notes to the 2013 Consolidated Financial Statements
284
For quantitative indicators, external to the company, the following factors are considered relevant as indicators of potential issues for equity instruments: the listing of the security under the initial recognition value by more than 20% or for an on-going period of more than 9 months. The presence of a listing more than 20% lower than the initial recognition value or for a continuous period of more than 9 months results in the recognition of impairment. In the other cases, the recognition of the loss in value must also be corroborated by the result of specific analyses relating to the security and the investment. For debt instruments, objective evidence of impairment is ascribable to events following the initial recognition that negatively impact the estimated future cash flows of the investment.
If, in a subsequent period, the reasons for impairment cease to exist following an event occurring after the impairment was recognised, the previously recognised impairment loss is reversed, the reversal being recognised in the income statement in the case of loans or debt securities or under equity in the case of equity instruments. The amount of the reversal cannot, in any case, exceed the amortised cost the instrument would have had in the absence of said adjustments.
Loans and receivables
Classification criteria
Loans and receivables represent loans to customers and amounts due from banks, both directly provided and acquired from third parties, with fixed or determinable payments, that are not listed on an active market and other than those that upon initial recognition are designated as available for sale. They also include trade receivables – other than those associated with payment for goods and services provided, classified under “other assets” – repurchase agreements, receivables originating from finance lease transactions and securities acquired by subscription or private placement, with fixed or determinable payments, that are not listed in active markets. Loans and receivables acquired without recourse are included under loans and receivables only upon verification that no contractual clauses would significantly invalidate the transfer of all risks and benefits to the transferee company.
Initial recognition and subsequent derecognition criteria
Loans and receivables are initially recognised on the date they are disbursed or, in the case of debt securities, on the settlement date, on the basis of the fair value of the financial instrument, equal to the amount disbursed, or the subscription price, including any costs and revenues directly attributable to the loans and determinable from the inception of the transaction, even when settled at a later date. Costs that, even with the aforementioned characteristics, are reimbursed by the borrower or classified as ordinary internal administrative expenses are excluded. Where the net disbursement amount differs from the fair value of the asset, as a result of the application of a lower interest rate than the one prevailing on the market or the one commonly applied to loans with similar features, the loan is initially recognised for an amount equal to the present value of future cash flows using an appropriate discount rate. The difference between the fair value and the amount disbursed or the subscription price is booked directly to the income statement. Securities purchased under agreements to resell (reverse repurchase agreements) and securities sold under agreements to repurchase (repurchase agreements) are generally treated as collateralised financing transactions (funding or investment transactions). In particular, spot sales and forward repurchases are recognised as payables for the spot amount received, while spot purchases and forward sales are recognised as receivables for the spot amount paid. Any transferred loan is derecognised from financial statement assets only where the sale essentially transferred all the risks and benefits related to the loans. Where, instead, all the risks and benefits related to the loan have been retained, the latter continue to be recognised as assets in the financial statements even if legal ownership has effectively been transferred. If it is not possible to verify whether the risks and benefits have been essentially transferred, the loans are derecognised from the financial statements if no control whatsoever has been retained over them. On the contrary, where
Notes to the 2013 Consolidated Financial Statements
285
even partial control is retained, loans are maintained in the financial statements with respect to the residual involvement, at an amount determined by the exposure to the variability in the amounts of the loans transferred and the changes in the related cash flows. Finally, transferred loans are derecognised from the financial statements where the contractual rights to receive the related cash flows are maintained assuming a contractual obligation to pay such cash flows and only such cash flows, to third parties.
Measurement criteria
After initial recognition, loans are measured at amortised cost, using the effective interest rate method. Amortised cost is the amount at which loans are measured upon initial recognition plus or minus any principal repayments, write-downs, write-backs and amortisation – calculated using the effective interest rate method – of the difference between the initial amount disbursed and the amount repayable on maturity represented by any income or charge directly attributable to the individual loan. The effective interest rate is the rate that exactly discounts estimated future cash flows generated by the loan, in terms of both principal and interest, to the disbursed amount including any revenue and charges related to the loan itself. This measurement method, which follows a financial approach, allows the allocation of the economic effect of the costs or revenues through the expected residual life of the loan.
The estimated cash flows and contractual term of the loan take into account all the contractual clauses that may affect the amounts and maturity dates, without, however, considering any loss expected thereon. The effective interest rate initially recorded (original contract rate) is the rate that is used to discount the estimated cash flows and, as a result, it determines the amortised cost after initial recognition. The amortised cost method is not used for short-term loans whose short maturity implies that the application of the discounting approach leads to immaterial effects. These loans are valued at historical cost and income and charges related to them are recognised in the income statement on a straight-line basis over the contractual term of the loan. A similar valuation criterion is adopted for loans with unspecified maturity or repayable with notice period. At every close of annual or interim financial statements, the loans are reassessed to identify those that, following events occurring after initial recognition, show objective evidence of possible impairment. A loan is considered impaired when it is probable that all contractual principal and interest payments due in accordance with the terms of the original loan agreement or an equivalent amount will not be collected. Non-performing, sub-standard, restructured loans, and loans past due by 90 days or more are all reviewed for impairment in accordance with the rules issued by the Bank of Italy, consistent with IAS provisions. Non-performing loans are assessed individually, the adjustments made to the individual loans being equal to the difference between the carrying amount of the loan at the time of valuation (amortised cost) and the present value of the expected future cash flows, calculated using the original effective interest rate. The expected cash flows take into account the estimated recovery time, the estimated realisable value of any guarantee received as well as costs that may be sustained for the recovery of the exposure. The original effective interest rate of each loan remains unchanged over time even where a restructuring may have given rise to a change in the contractual rate and even though the loan no longer bears contractual interest. The write-down is recognised in the income statement. The write-downs are reversed and the amount of the loan restated to its original value if, in following years, the circumstances that had given rise to the write-down cease to exist as long as the valuation can be objectively related to an event occurring after the impairment was recognised. The reversal is recognised in the income statement, however it cannot exceed the amortised cost of the instrument if impairment loss had not occurred.

Notes to the 2013 Consolidated Financial Statements
286
Restructuring transactions on impaired loans that include the partial or full conversion of the loans into equity of the borrowing company are assessed based on the fair value of the shares received in compensation for the loan, as provided for in IFRIC 19. The fair value of these shares is assessed by applying the same methodologies used for equity investments, based on their classification in the financial statements. For other renegotiation transactions, with the exception of those defined as “restructuring” transactions, when the changes to contractual terms are substantial, the Bank derecognises the credit position and recognises a new financial asset. Transactions that are considered “restructured” include credit positions with customers in financial difficulties for which the renegotiation resulted in a financial loss for the Bank. In this case, the specific write-down is calculated based in the original interest rate. Loans for which no individual objective evidence of impairment was assessed, that is, generally, performing loans, including loans to counterparties in countries at risk, are collectively evaluated for impairment. For the purposes of a collective evaluation of impairment, loans are grouped on the basis of similar credit risk characteristics and the related loss percentages are estimated taking into account historical loss experience, based on observable data as of the measurement date that allow estimation of the intrinsic loss for each loan category. Impairment losses of collectively assessed loans are recognised in the income statement. At each balance sheet date or interim report date, any additional write-down or write-back is separately calculated with reference to the entire performing loan portfolio at the same date.
Hedging transactions
Recognition criteria
Hedging transactions are aimed at offsetting potential losses arising on a specific item or group of items (hedged item) due to a specific risk, against the profits achieved on another instrument or group of instruments (hedging instrument) in the event that specific risk actually occurs. IAS 39 recognises the following types of hedges:
� Fair value hedge: its purpose is to hedge the exposure to changes in fair value of an asset or liability attributable to a particular risk;
� Cash flow hedge: its purpose is to hedge the exposure to variability in future cash flows attributable to particular risks associated with assets and liabilities;
� Hedge of a net investment in a foreign currency: pertaining to the hedging of the risks of an investment in a foreign company expressed in currency.
Measurement criteria
Hedging derivatives are measured at fair value. In the case of a fair value hedge, the change in fair value of the hedged item is offset by the change in fair value of the hedging instrument. This offsetting is recognised by recording in the income statement the changes in fair value relating to both the hedged item (as regards the changes attributable to the underlying risk factor) and the hedging instrument. Any difference, which represents the partial ineffectiveness of the hedge, is the net economic effect. In the case of cash flow hedges, changes in fair value of the derivative, to the extent the hedge is effective, are recognised under equity and reclassified in the income statement only when – with reference to the item hedged – the change in the cash flows to be offset manifests. Fair value is determined by reference to the prices recorded in active markets, as previously defined, prices provided by market operators or internal valuation models commonly used by market participants, which take into account all risk factors related to the instruments and are based on observable market data such as:

Notes to the 2013 Consolidated Financial Statements
287
� Methods based on the valuation of listed instruments with the same characteristics; � Calculation of the present value of the cash flows generated by the instrument; � Option pricing models.
A derivative instrument is designated as a hedging instrument if the hedging relationship between the hedged item and the hedging instrument is formally documented and if such relationship is highly effective at the inception of the hedge and on an ongoing basis. The effectiveness of the hedging relationship depends on the ability of the derivative to generate changes in fair value that offset changes in the fair value of the hedged item or the related cash flows. The effectiveness is assessed at each balance sheet date or interim report date using:
� Prospective testing, which justifies the application of hedge accounting as it proves its expected effectiveness;
� Retrospective testing, which highlights the degree of hedge effectiveness achieved in the period to which it relates. In other words, the testing measures to what extent actual results differ from the perfect hedge.
If the hedge fails the effectiveness test, hedge accounting, according to the methods stated above, is discontinued and the derivative is reclassified under financial instruments held for trading.
Tangible assets
Classification criteria
This item includes land, buildings used for business, investment properties, technical plants, furniture, fittings, and sundry equipment. Own-used buildings are buildings owned by the Group for the purpose of providing services or for administrative purposes whereas investment property is property held to earn rental income or for capital appreciation or both. These are tangible assets held for use in the production or supply of goods and services, for leasing to others or for administrative purposes and which are expected to be used during more than one period.
Initial recognition and subsequent derecognition criteria
Tangible assets are initially recognised at cost, which includes the purchase price and any cost directly attributable to the purchase and set-up costs. Tangible assets are derecognised from the balance sheet on disposal or when the asset is permanently withdrawn from use and when no future economic benefits are expected from its use or disposal. Extraordinary maintenance expenses that give rise to an increase in future economic benefits are added to the value of the assets whereas ordinary maintenance costs are charged directly to the income statement.
Measurement criteria
Subsequent to initial recognition, tangible fixed assets, including buildings not used for business purposes, are carried at cost less accumulated depreciation and any impairment loss. They are systematically depreciated over their estimated useful life, on a straight-line basis, excluding land. Land purchased vacant or with buildings has an indefinite useful life and is therefore not depreciated. If the value of the land is incorporated in the value of the building erected thereon, then, by virtue of the application of the components approach, it is considered as an asset separate from the buildings. With regard to fully owned buildings and where the ownership percentage is deemed significant, the
Notes to the 2013 Consolidated Financial Statements
288
allocation of the total value between the land and the buildings is made on the basis of an evaluation made by an expert appraiser. At each balance sheet date or interim report date, where there is objective evidence that an asset may be impaired, its carrying value is compared to its recoverable value, equal to the higher of fair value less costs to sell, and its value in use, that is, the present value of future cash flows expected to be derived from the asset. Impairment losses are recognised in the income statement. If and when the circumstances that gave rise to the impairment cease to exist, a recovery value is recorded, which, however, cannot exceed the value that the asset would have had, net of depreciation, determined in the absence of previous impairments.
Intangible assets
Classification criteria
Intangible assets are recorded as balance sheet assets only if:
� They are identifiable; � They are controlled by the entity; � It is probable that the expected future economic benefits that are attributable to the asset will
flow to the entity; � The cost of the asset can be reliably measured.
Intangible assets include applications software that will be used over the long-term. Other assets are recorded as intangible assets if they are identifiable and arise from contractual or other legal rights.
Initial recognition and subsequent derecognition criteria Intangible assets are stated at cost, as adjusted by any incidental charge, only if it is probable that the future economic benefits attributable to the assets will flow from the assets and if their cost can be measured reliably. If that is not the case, the cost of the intangible asset is recognised in the income statement for the year in which it was incurred. Intangible assets are derecognised from the balance sheet on disposal and if no future economic benefits are expected from the assets.
Measurement criteria
The cost of intangible assets with defined useful lives is amortised on a straight-line basis over the expected useful life of the asset. Where the expected useful life is indefinite, then the assets are not amortised but are systematically tested for impairment. At each balance sheet date, where an indication of impairment exists, the company estimates the recoverable amount of the assets in question. The impairment loss, recognised in the income statement, is equal to the difference between the carrying value of the asset and its recoverable amount.
Notes to the 2013 Consolidated Financial Statements
289
Current and deferred tax
Income taxes are calculated in accordance with tax regulations currently in force. Tax expense is the aggregate amount included in the determination of profit and loss for the period in respect of current tax and deferred tax. Income taxes are recorded in the income statement with the exception of those relating to items that are directly debited or credited to equity. Income tax provisions are calculated based on a prudent estimate of the current tax charges, deferred tax assets and deferred tax liabilities. Deferred tax assets and deferred tax liabilities are calculated taking into account the temporary differences between the carrying amount of an asset or liability pursuant to the Italian Civil Code criteria and their tax base, with no time limitation.
Deferred tax assets represent the amounts of income taxes recoverable in future periods in respect of:
� Deductible temporary differences; � The carry-forward of unused tax losses; � The carry-forward of unused tax credits.
Deferred tax liabilities represent the amounts of income taxes payable in future periods in respect of taxable temporary differences. All deferred tax liabilities are included in the financial statements. Deferred tax assets and liabilities are systematically reviewed to take into account any change in tax rates or regulations as well as any change in the tax status of Group companies, including agreements related to the National Tax Consolidation scheme.
Effects of tax consolidation The tax consolidation agreements, effective in Italy beginning in 2011 for companies participating in the consolidation scheme, envisage, among other items, that any tax losses brought to the tax consolidation by individual companies are not remunerated to said companies by the consolidating body. Similarly, the agreements provide that taxes due for any taxable income produced by the individual entities making up the tax consolidation are paid only if, and to the extent that, the taxes are effectively paid to the tax authorities by the consolidating body, based on the tax consolidation. IAS 12 does not govern the accounting methods for the effects of the tax consolidation on the individual financial statements of either the consolidating body or the companies included in the consolidation. Taking into account the specific provisions envisaged in the tax consolidation agreements referenced above, among the accounting models that were deemed applicable in such circumstances based on prevailing professional opinions and considering statutory regulations, the Group defined the following methodology for the accounting representation of the IRES effects of the tax consolidation for individual financial statements:
• Each entity will recognise its tax burden accrued for the year in the income taxes item, in current taxes if there is taxable income or in deferred taxes in the event of tax losses, in application of IAS 12;
• These effects are corrected directly in the income statements in the same tax item (current or deferred) in the same year and in the amount that would result in no financial settlement between the entities and the Group as a result of the tax consolidation agreements;
Notes to the 2013 Consolidated Financial Statements
290
• The detailed transactions for accrued taxes will include separate information on its impact on the effective taxes for each individual entity that is attributable to the national tax consolidation scheme;
• Unused tax losses that each year should be definitively transferred from the subsidiaries to the tax consolidating body will be included in the estimate of recoverability for the financial statements of the consolidating body.
Allowances for risks and charges
Classification criteria
This item includes provisions for actual obligations arising as a result of a past event, the settlement of which is certain or highly probable, but in respect of which uncertainties exist about the timing or amount required in settlement.
Recognition criteria
A provision is recognised if it meets the following criteria:
� A legal obligation (actual or implicit) exists as a result of a past event; � It is probable that an outflow of resources embodying economic benefits will be required to
settle the obligation; � A reasonable estimate can be made of the amount of the obligation.
In the event the time factor is significant, the provisions are discounted using discount rates that reflect current market rates. The effect of discounting is recognised in the income statement.
Liabilities, securities issued
Classification criteria
Due to banks, Due to customers, Securities issued and Subordinated loans encompass the various types of interbank funding, deposits from customers as well as the funding through certificates of deposit and debt securities in issue, less any amount repurchased.
Initial recognition and subsequent derecognition criteria
Initial recognition of such financial liabilities occurs at the time of collection of the sums deposited or on the issue of debt securities. Initial recognition is based on the fair value of the liabilities, normally equal to the amount collected or the issue price, increased by any income or charge directly attributable to each deposit or issue transaction and not reimbursed by the funding counterpart. Internal administrative expenses are excluded. Financial liabilities are derecognised from the financial statements when the relevant obligation has expired or been extinguished. Derecognition also occurs for repurchase of previously issued securities. The difference between the carrying amount of the liability and the amount paid to repurchase it is recognised in the income statement. Own securities placed on the market subsequent to their repurchase are treated as a new issue recognised at the new placement price with no impact on the income statement.
Notes to the 2013 Consolidated Financial Statements
291
Measurement criteria
Subsequent to initial recognition, financial liabilities are carried at amortised cost using the effective interest rate method. An exception is made for short-term liabilities, where the time is irrelevant. These are stated at the amount collected and related costs, if any, are recognised in the income statement on a straight-line basis over the contractual term of the liability.
Financial liabilities held for trading This item includes the negative value of derivative contracts held for trading, valued at fair value , of implicit contracts in other financial instruments. It also includes other liabilities, designated at fair value, which originate from uncovered short positions generated by security trading activities. The measurement, recognition and derecognition criteria are equivalent to those for financial assets held for trading.
Foreign currency transactions
Recognition criteria
Foreign currency transactions are initially recognised in the functional currency, by applying the spot exchange rate on the transaction date to the foreign currency amount.
Measurement criteria
At each balance sheet date or interim report date, financial statement items denominated in foreign currency are translated as follows: Monetary amounts are translated using the closing rate;
� Non-monetary items that are measured in terms of historical cost are translated using the exchange rate at the date of the transaction;
� Non-monetary items that are measured at fair value are translated using the exchange rate on the closing date.
Exchange differences arising on the settlement of monetary items or on translating monetary items at rates different from those at which they were translated on initial recognition or in previous financial statements are recognised in the income statement relating the period in which they arise. When a gain or loss on a non-monetary item is recognised directly under equity, any exchange component of that gain or loss is also recognised under equity. Conversely, when a gain or loss on a non-monetary item is recognised in the income statement, any exchange component of that gain or loss is also recognised in the income statement.
Leasehold improvements Leasehold improvements are capitalised in consideration of the fact that the company enjoying the use of the premises has control over the assets and the future economic benefits generated by it over the entire term of the lease. Leasehold improvements are amortised for a period not exceeding the term of the lease.

Notes to the 2013 Consolidated Financial Statements
292
Severance indemnity fund The severance indemnity fund is initially recognised based on its actuarial value. For the purposes of defining actuarial value, the Projected Unit Credit Method is used, which involves the estimate of future payments based on historical statistical analyses, the demographic curve and the present value of those cash flows using a market interest rate. The contributions paid in each financial year are considered as separate units, separately measured and recorded to build up the final post-employment benefit obligation. The current service costs of the plan are accounted for under personnel expenses as the net amount of contributions paid, contributions of prior years not yet recorded, accrued interest cost, expected return on plan assets, and actuarial gains and losses. With Regulation no. 475/2012, the European Commission endorsed, among other things, the new version of IAS 19, which has the objective of enhancing the clarity and comparability of financial statements, particularly in reference to defined benefits plans. The elimination of the “corridor method”, effective from 1 January 2013, had an impact on the Bank’s net equity at the date of the first application of the new standard, in the amount equivalent to the actuarial losses not recognised in applying the "corridor method”. This change in standard resulted in a reduction of the valuation reserves in equity of € 646 thousand as at 31 December 2012. Following the reform of supplementary social security as per Italian Legislative Decree no. 252/2005, supplemented by the innovations made by the 2007 Finance Law and its subsequent implementing decrees:
• Employee termination indemnities accrued as at 31 December 2006 remain with the company and are considered a “defined benefit plan”: the obligation for benefits accrued by employees is valued by means of use of actuarial techniques;
• Employee termination benefits under accrual as at 1 January 2007 are considered a “defined contribution plan” irrespective of allocation by employee to supplementary social security or to the Treasury allowance at INPS. The obligation is determined by the amounts contributed in each period.
Also, other employee benefits such as seniority bonuses and pension fund contributions, provided for by IAS 19, are recorded as liabilities by estimating the single amount to be paid to each employee using actuarial calculation methods.
Stock options Stock option plans on shares in the Parent Company General Electric Company, which are currently assigned to some of the Banking Group’s employees, are directly regulated in the balance sheet of the Parent Company. Charges related to said plans are calculated based on the fair value of the options at the balance sheet date, allocated across the vesting period.
Dividends and revenue recognition Revenues are recognised when received or at least when it is probable that future benefits will be received and that such benefits can be measured reliably. In particular:
� Default interest, if provided for in the terms of the contract, is recognised in the income statement only when actually collected;
� Dividends are recognised in the income statement when the right to receive payment is established;
� Revenues generated through brokerage of traded financial instruments, calculated as the difference between the transaction price and the fair value of the instruments, are recognised in the income statement when the transaction is recorded if the fair value can be determined by reference to recent parameters or transactions observable on the same market where the

Notes to the 2013 Consolidated Financial Statements
293
instrument is traded. Income related to financial instruments for which the above measurement is not possible is recognised in the income statement over the entire duration of the transaction.
Notes to the 2013 Consolidated Financial Statements
294
ADDITIONAL INFORMATION
Use of estimates and assumptions in preparing the Consolidated
Financial Statements
Amounts in the financial statements were valued based on the principles indicated above. In applying
said principles, if the value of certain financial statement items could not be determined precisely,
estimates and assumptions were used that have a significant impact on the values recorded in the
balance sheet and income statement.
While reaffirming that the use of reasonable estimates is a fundamental part of preparing the
financial statements, without negatively affecting its fairness, the list below details the items in the
financial statements that make significant use of estimates and assumptions:
� Loan valuations;
� Valuation of financial instruments not listed on active markets;
� Valuation of intangible assets and equity investments;
� Quantification of provisions to allowances for risks and charges;
� Quantification of deferred taxes;
� Definition of the depreciation/amortisation rate of tangible and intangible assets with a
defined useful life.
Furthermore, an estimate may be adjusted following changes in the circumstances on which the
estimate was based, upon receiving new information, or as a result of more experience. Any change
in the estimate is applied on an ongoing basis and therefore has an impact on the income statement
for the year in which the change occurred and, possibly, on future income statements.
There were no significant changes during the year to the estimation criteria that were applied in
preparing the 2012 Financial Statements.

Notes to the 2013 Consolidated Financial Statements
295
Part A. 3
Transfers between financial asset portfolios There were not transfers performed during 2013.
Part A. 4
Fair Value Disclosure
Qualitative disclosure
This section contains the fair value disclosure required by IFRS 13 “Fair Value Measurement”, a new
accounting standards that became effective 1 January 2013, in combination with IAS 34 and IFRS 7.
Fair value is the amount that would be received from the sale of an asset, or paid to transfer a liability,
in an ordinary transaction between counterparties in the primary market at the measurement date
(exit price).
The fair value of a financial liability that is payable (for example, a demand deposit) cannot be less
than the amount payable upon request, discounted to the first date on which payment could be
requested.
In the case of financial instruments listed in active markets, the fair value is determined from the
official listing on the primary (or most advantageous) market to which the Company has access (Mark
to Market).
A financial instrument is considered to be listed in an active market if the listed prices are readily and
regularly available through a price list, dealer, broker, price setting agency or regulatory authority and
these prices represent effective market transactions that take place under normal market conditions.
If there is no official listing on an active market for a financial instrument as a whole, but there are
active markets for the components that make up the instrument, the fair value is based on the
relevant market prices for the components.
If there are no market listings or other observable input, such as the listed price of an identical asset in
a non-active market, alternative valuation models are used, such as:
� Market valuation method: use of market listings for similar liability or equity instruments held
as assets by other parties in the market;
� Cost method: the cost that would be required to replace the service capacity of an asset;
� Profit method: discounted valuation technique based on expected future cash flows by a
market counterparty that holds a liability or equity instrument as an asset.
The valuation methods (Mark to Model) are used only in line with generally accepted market practices.
Valuation models include techniques based on discounting expected future cash flows and an
estimate of volatility and are subject to revision both during their development and periodically
afterwards, in order to ensure they are fully consistent with the valuation objectives.
Notes to the 2013 Consolidated Financial Statements
296
These methodologies use input based on prices observed in recent transactions of the instrument
being valued and/or prices/listings of instruments with similar characteristics in terms of risk profile.
The prices/listings are relevant for determining the most important parameters, in terms of credit risk,
liquidity risk, price risk and other relevant risks, for the instrument being valued.
The reference to the market for these parameters reduces the discretion in the valuation, ensuring at
the same time that the resulting fair value can be verified.
A.4.1. Fair value levels 2 and 3 Valuation techniques and input used
Valuation techniques are used to value positions for which market sources do not provide a market
price. GE Capital Interbanca uses valuation techniques that are widely used in the market for
calculating the fair value of financial instruments and other instruments that are not listed and
actively exchanged. The valuation techniques used for Level 2 assets and liabilities are described
below.
Discounted cash flow
Valuation techniques based on discounted cash flows generally consist of calculating an estimate of
expected future cash flows throughout the life of the instrument. The model requires the cash flow
estimate and the adoption of market parameters for discounting: the discount rate or margin reflects
the credit and/or financing spread required by the market for instruments with similar risk and
liquidity profiles, in order to define a “discounted value”. The fair value of the contract is the sum of the
discounted future cash flows.
Option pricing model
Option pricing model techniques are generally used for instruments in which the holder has a
contingent right or obligation based on the occurrence of a future event, such as the price of a
reference asset surpassing a pre-determined strike price.
Option models estimate the probability that a specific event will occur by incorporating assumptions
such as the volatility of the estimates, the price of the underlying instrument and the expected return
rate.
Market approach
This valuation technique uses prices generated by market transactions that involve assets, liabilities or
groups of assets and liabilities that are identical or similar.
There are no Level 3 financial assets or liabilities.
A.4.2 Valuation processes and sensitivity For processes, refer to Part E - Section 2 Market Risks.
There are no Level 3 financial assets or liabilities and related input that cannot be readily observed.

Notes to the 2013 Consolidated Financial Statements
297
A.4.3 Fair value hierarchy
IFRS 13 classifies the level of observability of input used for pricing.
Specifically, three levels are envisaged:
� Level 1: the fair value of instruments classified in this level is calculated based on listed prices
observed in active markets;
� Level 2: the fair value of instruments classified in this level is calculated based on listed prices
observed in active markets;
� Level 3: the fair value of instruments classified in this level is calculated based on valuation
models that primarily use meaningful input that is not observable in active market.
There were no transfers between the various levels of the fair value hierarchy.
A.4.4 Additional information
Financial assets and liabilities at fair value
Information required by IFRS 13 regarding portfolios valued at fair value on a recurring basis is
provided below.
Fixed-income bonds
Fixed-income bonds are valued through two main processes based on the liquidity of the reference
market. Liquid instruments in active markets are valued at market price (Mark to Market) and, as a
result, these instruments are classified as Level 1 in the fair value hierarchy.
Instruments that are not exchanged in active markets are valued at Mark to Model, using the implicit
curves for the credit spread relative to the issuer’s rating and business sector. The model maximises
the use of observable parameters and minimises the use of non-observable parameters.
Equity securities
Equity securities are classified as Level 1 when a market listing is available and at Level 2 or 3 based
on the extent to which the input used in the valuation is observable, when there are no listings or the
listings have been suspended for an undetermined period. In this case, the valuations are conducted
with a Market Approach through the application of the market multiples model inferred from
observable comparable data and using the DCF control method.
For equity instruments valued at cost, an impairment is recognised if the carrying amount is greater
than the current value of future cash flows by a significant amount and/or over a significant period of
time.
Derivatives
The relevant input for valuation techniques used is primarily based on methodologies of net present
value of future cash flows, and is observable or derived from observable data. Consequently, the
instruments are classified as Level 2.

Notes to the 2013 Consolidated Financial Statements
298
Financial assets and liabilities not measured at fair value for which fair value is
provided for disclosure
Financial instruments not measured at fair value, for example loans to customers and deposits, are
not accounted for based on fair value. For these instruments, the fair value is calculated solely for
disclosure purposes and does not have an impact on the income statement and balance sheet
figures. In addition, as these instruments are not generally exchanged, the calculation of fair value
includes management assumptions with respect to the relevant variables.
Due from banks
Due from banks includes the balance of demand deposits and deposits held as collateral for
syndicated loans (IBLOR). With regards to demand deposits, the carrying amount can be considered a
satisfactory proxy of the fair value.
The fair value of IBLOR deposits is calculated with the same methodology used for loans to customers,
described below.
Loans to customers
The fair value of due from banks and loans to customers, recognised at amortised cost, is calculated
using the discounted cash flow model that includes the best estimate of the elements necessary to
reflect current market conditions.
Cash flows include principal payments, interest payments and all other costs, and depend on the
contractual conditions and market conditions (see interest rates).
The discount rate includes the risk-free rate, which represents the interest rate that the market would
require for investments with zero risk of a certain duration, and the credit spread (CS), which
represents the additional return that a market participant would require for an investment with a
given level of risk. The CS for unlisted products cannot be derived from observable market prices and
is therefore estimated based on specific counterparty and/or transaction factors.
Non-performing loans
In reference to non-performing loans, the carrying amount can be considered a satisfactory proxy for
the fair value, in that the current value already incorporates the best estimates of expected recoveries
discounted to present value, based on interest rates, recovery curves and funding and operating
costs.
Liabilities - subordinated loan
The fair value of this type of liability, recognised at amortised cost, is calculated using a DCF model,
just as with loans and receivables, with a discount rate that includes the risk-free rate, which
represents the interest rate the market would require for risk-free investments of a certain duration,
and a spread similar to the rate that expresses the cost of the funding for a similar duration.
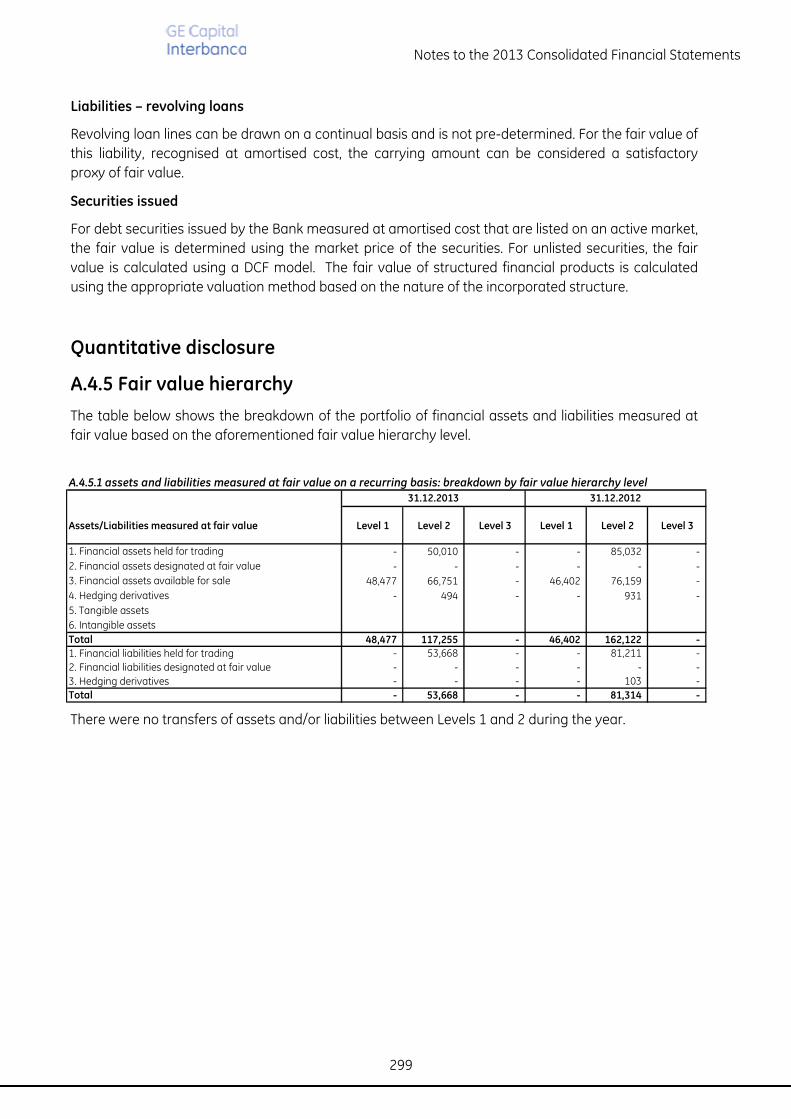
Notes to the 2013 Consolidated Financial Statements
299
Liabilities – revolving loans
Revolving loan lines can be drawn on a continual basis and is not pre-determined. For the fair value of
this liability, recognised at amortised cost, the carrying amount can be considered a satisfactory
proxy of fair value.
Securities issued
For debt securities issued by the Bank measured at amortised cost that are listed on an active market,
the fair value is determined using the market price of the securities. For unlisted securities, the fair
value is calculated using a DCF model. The fair value of structured financial products is calculated
using the appropriate valuation method based on the nature of the incorporated structure.
Quantitative disclosure
A.4.5 Fair value hierarchy
The table below shows the breakdown of the portfolio of financial assets and liabilities measured at
fair value based on the aforementioned fair value hierarchy level.
Assets/Liabilities measured at fair value Level 1 Level 2 Level 3 Level 1 Level 2 Level 3
1. Financial assets held for trading - 50,010 - - 85,032 -
2. Financial assets designated at fair value - - - - - -
3. Financial assets available for sale 48,477 66,751 - 46,402 76,159 -
4. Hedging derivatives - 494 - - 931 -
5. Tangible assets
6. Intangible assets
Total 48,477 117,255 - 46,402 162,122 -
1. Financial liabilities held for trading - 53,668 - - 81,211 -
2. Financial liabilities designated at fair value - - - - - -
3. Hedging derivatives - - - - 103 -
Total - 53,668 - - 81,314 -
A.4.5.1 assets and liabilities measured at fair value on a recurring basis: breakdown by fair value hierarchy level
31.12.201231.12.2013
There were no transfers of assets and/or liabilities between Levels 1 and 2 during the year.

Notes to the 2013 Consolidated Financial Statements
300
The following table presents the breakdown of financial assets and liabilities not measured at fair
value, or measured at fair value on a non-recurring basis, according to the fair value hierarchy levels.
Financial assets/liabilities Book value Level 1 Level 2 Level 3 Book value Level 1 Level 2 Level 3
1. Financial assets held to maturity
2. Due from banks 236,839 232,786 327,991 327,991
3. Loans to customers 3,658,308 3,590,330 4,076,799 4,076,799
Total 3,895,147 - - 3,823,116 4,404,790 - - 4,404,790
1. Due to banks 11,957 11,957 16,192 16,192
2. Due to customers 3,629,261 3,618,270 3,831,635 3,831,635
3. Securities issued 219,705 82,536 117,583 325,999 86,859 252,296
Total 3,860,923 82,536 117,583 3,630,227 4,173,826 86,859 252,296 3,847,827
31.12.2013 31.12.2012
A.4.5.4 Assets/Liabilities not measured at fair value, or measured at fair value on a non-recurring basis: breakdown by fair value
hierarchy level
A.5 Disclosure on “day one profit/loss”
As provided in IFRS 7, section 28 and IAS 39 AG 76, a financial instrument must be initially recognised
at its fair value, which is equivalent to the price paid/collected at trading, unless there is evidence to
the contrary. In practice, there are cases in which the two values differ. The aforementioned principle
governs such situations, stating that the recognition of a financial instrument at a fair value other
than the amount paid/collected is legitimate, only if the fair value is calculated:
� By making reference to current and observable market transactions on the same instrument;
� Through valuation techniques that use only data from observable markets as variables.
In other words, the IAS 39 principle according to which the fair value is equivalent to the price
paid/collected can be circumvented only if objective evidence exists that the price paid/collected does
not represent the real market value of the financial instrument traded.
Said evidence must be inferred only from objective and irrefutable parameters, thereby eliminating
any discretion on the part of the assessor.
Exclusively under the conditions indicated above, the difference between the fair value and the traded
price represents the “day one profit” and is immediately recognised in the income statement.
There were no transactions of this type undertaken by the GE Capital Interbanca Group as part of its
activities in 2012.

Notes to the 2013 Consolidated Financial Statements
301
Part B
INFORMATION ON THE BALANCE SHEET
ASSETS

Notes to the 2013 Consolidated Financial Statements
302
Section 1
CASH AND CASH EQUIVALENTS – ITEM 10
31.12.2013 31.12.2012a) Cash 2 1
b) Demand deposits with Central Banks - -
Total 2 1
1.1 Cash and cash equivalents: breakdown

Notes to the 2013 Consolidated Financial Statements
303
Section 2 Financial assets held for trading – Item 20
Level 1 Level 2 Level 3 Level 1 Level 2 Level 3
A. Financial assets
1. Debt securities - - - - - - 1.1 structured - - - - - - 1.2 other - - - - - - 2. Equities - - - - - - 3. Investment Fund Units - - - - - - 4. Loans - - - - - - 4.1 repurchase agreements - - - - - - 4.2 other - - - - - -
Total A - - - - - -
B. Derivatives
1. Financial derivatives: - 50,010 - - 85,032 - 1.1 trading - 50,010 - - 85,032 - 1.2 under the fair value option - - - - - - 1.3 other - - - - - - 2. Credit derivatives: - - - - - - 2.1 trading - - - - - - 2.2 under the fair value option - - - - - - 2.3 other - - - - - -
Total B - 50,010 - - 85,032 -
Total (A+B) - 50,010 - - 85,032 -
2.1 Financial assets held for trading: breakdown
Item/Amount31.12.2013 31.12.2012
The decrease in this item is the result of the change in fair value of the outstanding positions, as
there were no new transactions posted during the year.
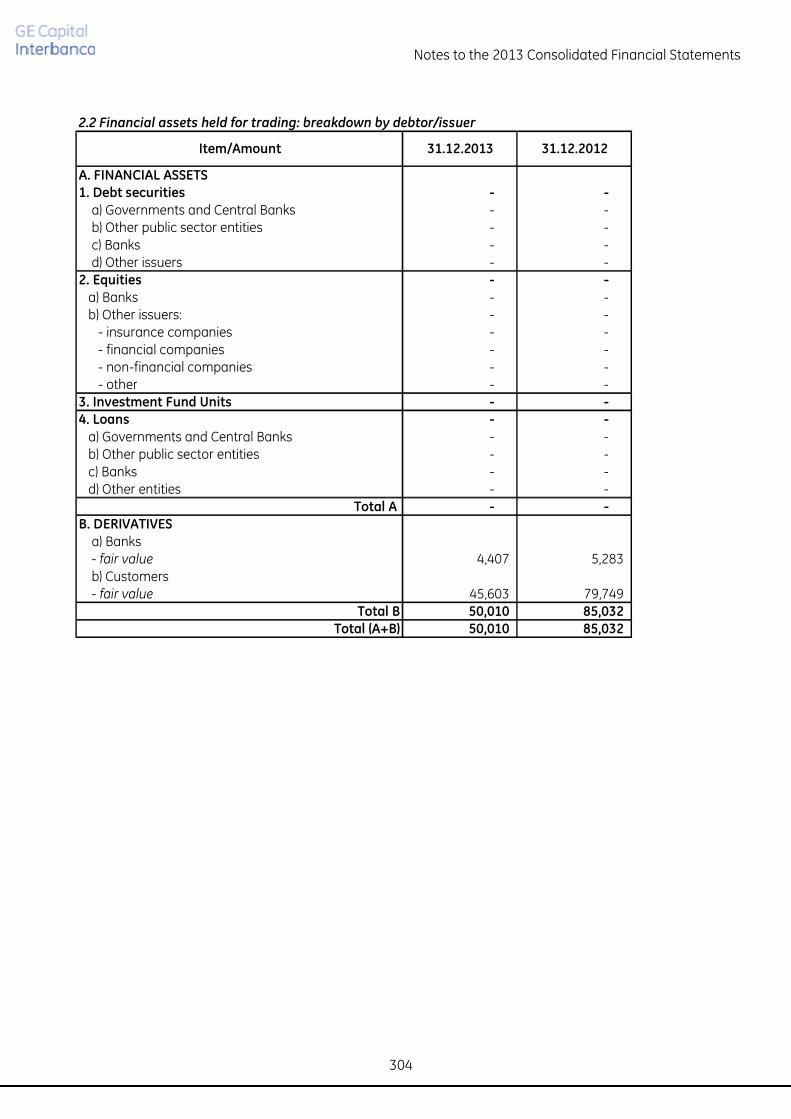
Notes to the 2013 Consolidated Financial Statements
304
A. FINANCIAL ASSETS
1. Debt securities - -
a) Governments and Central Banks - - b) Other public sector entities - - c) Banks - - d) Other issuers - - 2. Equities - -
a) Banks - - b) Other issuers: - - - insurance companies - - - financial companies - - - non-financial companies - - - other - - 3. Investment Fund Units - -
4. Loans - -
a) Governments and Central Banks - - b) Other public sector entities - - c) Banks - - d) Other entities - -
Total A - -
B. DERIVATIVES
a) Banks - fair value 4,407 5,283 b) Customers - fair value 45,603 79,749
Total B 50,010 85,032
Total (A+B) 50,010 85,032
Item/Amount 31.12.2013 31.12.2012
2.2 Financial assets held for trading: breakdown by debtor/issuer

Notes to the 2013 Consolidated Financial Statements
305
Section 4 Financial assets available for sale – Item 40
4.1 Financial assets available for sale: breakdown
Level 1 Level 2 Level 3 Level 1 Level 2 Level 3
1. Debt securities 45,404 - - 44,111 9,444 -
1.1 Structured - - - - - - 1.2 Other 45,404 - - 44,111 9,444 - 2. Equities 3,073 66,751 - 2,291 66,715 -
2.1 Valued at fair value 3,073 66,750 - 2,291 66,714 - 2.2 Valued at cost - 1 - - 1 - 3. Investment Fund Units - - - - - -
4. Loans - - - - - -
Total 48,477 66,751 - 46,402 76,159 -
Item/Amount31.12.2013 31.12.2012
Item/Amount 31.12.2013 31.12.2012
1. Debt securities 45,404 53,555
a) Governments and Central Banks 45,404 44,111
b) Other public sector entities - -
c) Banks - -
d) Other issuers - 9,444
2. Equities 69,824 69,006
a) Banks - -
b) Other issuers: 69,824 69,006
- insurance companies - -
- financial companies 12,458 13,788
- non-financial companies 57,366 55,218
- other - -
3. Investment fund units - -
4. Loans - -
a) Governments and Central Banks - -
b) Other public sector entities - -
c) Banks - -
d) Other entities - -
Total 115,228 122,561
4.2 Financial assets available for sale: breakdown by debtor/issuer
Note that securities classified as "available for sale” includes certain equity instruments resulting from the restructuring of loan transactions classified as impaired loans. These instruments were recorded at the fair value defined on the restructuring date, in accordance with IFRIC 19.

Notes to the 2013 Consolidated Financial Statements
306
Debt
securities Equities
Investment
Fund Units Loans Total
A. Opening balance 53,555 69,006 - - 122,561
B. Increases 18,849 6,500 - - 25,349
B1. Purchases 15,399 - - - 15,399 B2. Positive fair value changes 1,210 2,178 - - 3,388 B3. Reversals of impairment 74 3,981 - - 4,055 - recognised in the income statement 74 X - - 74 - recognised in equity - 3,981 - - 3,981 B4. Transfers from other portfolios - - - - - B5. Other changes 2,166 341 - - 2,507 C. Decreases 27,000 5,682 - - 32,682
C1. Disposals 5,800 1,961 - - 7,761 C2. Repayments 16,500 - - - 16,500 C3. Negative fair value changes 386 3,604 - - 3,990 C4. Impairments 3,019 40 - - 3,059 - recognised in the income statement 3,019 40 - - 3,059 - recognised in equity - - - - - C5. Transfers to other portfolios - - - - - C6. Other changes 1,295 77 - - 1,372 D. Closing balance 45,404 69,824 - - 115,228
4.4 Financial assets available for sale: annual changes
For changes in the equity reserve for the fair value of financial assets available for sale, refer to Part F - Section 1 - Table B.3.

Notes to the 2013 Consolidated Financial Statements
307
Section 6 Due from banks – Item 60
Level 1 Level 2 Level 3 Level 1 Level 2 Level 3A. Due from Central Banks 94,316 - - 94,316 149,928 - - 149,928
1. Time deposits - X X X X X X2. Compulsory reserve 94,316 X X X 149,928 X X X3. Repurchase agreements - X X X X X X4. Other - X X X X X XB. Due from banks 142,523 - - 138,470 178,063 - - 178,063
1. Loans 142,523 - - 138,470 178,063 - - 178,063
1.1 Current accounts and demand deposits 6,953 X X X 13,019 X X X 1.2 Time deposits 125,320 X X X 164,717 X X X 1.3 Other loans: 10,250 X X X - X X X
- Repurchase agreements X X X - X X X- Finance lease payables 236 X X X 327 X X X- Other 10,014 X X X - X X X
2. Debt securities - - - - - - - - 2.1 Structured - X X X - X X X2.2 Other - X X X - X X X
Total 236,839 232,786 327,991 327,991
6.1 Due from banks: breakdown
Transaction type/Amount
31.12.2013
Book
value
Fair value
31.12.2012
Book
value
Fair value

Notes to the 2013 Consolidated Financial Statements
308
Section 7 Loans to customers – Item 70
Purchased Others Purchased Others
Loans 3,021,558 80,004 544,829 - - 3,578,798 3,449,646 45,268 569,938 - - 4,064,852 1. Current accounts - - - X X X - - - X X X2. Repurchase agreements - - - X X X - - - X X X3. Mortgages 1,738,375 51,492 544,829 X X X 2,291,703 - 569,938 X X X
4. Credit card loans and personal loans, inc. loans guaranteed by salary
72,275 5,361 - X X X
105,443 7,176 - X X X
5. Finance leases 652,347 21,514 - X X X 631,427 26,625 - X X X6. Factoring 228,940 1,137 - X X X 93,025 2,004 - X X X7. Other transactions 329,621 500 - X X X 328,048 9,463 - X X XDebt securities 11,917 - - - - 11,532 11,947 - - - - 11,947
8 Structured - - - X X X - - X X X9 Other 11,917 - - X X X 11,947 - - X X X
Total 3,033,475 80,004 544,829 3,590,330 3,461,593 45,268 569,938 4,076,799
L2 L3
31.12.2013
Book value Fair value
Transaction type/Amount
31.12.2012
Book value Fair value
Performing
Impaired
L1
7.1 Loans to customers: breakdown
Performing
Impaired
L1 L2 L3
“Other loans” includes € 321,620 thousand for long-term rental contracts for operating assets stipulated by GE Capital Services S.r.l. that are treated as finance leases pursuant to IAS 17. For these contracts, the net impaired positions are equivalent to € 17,922 thousand.
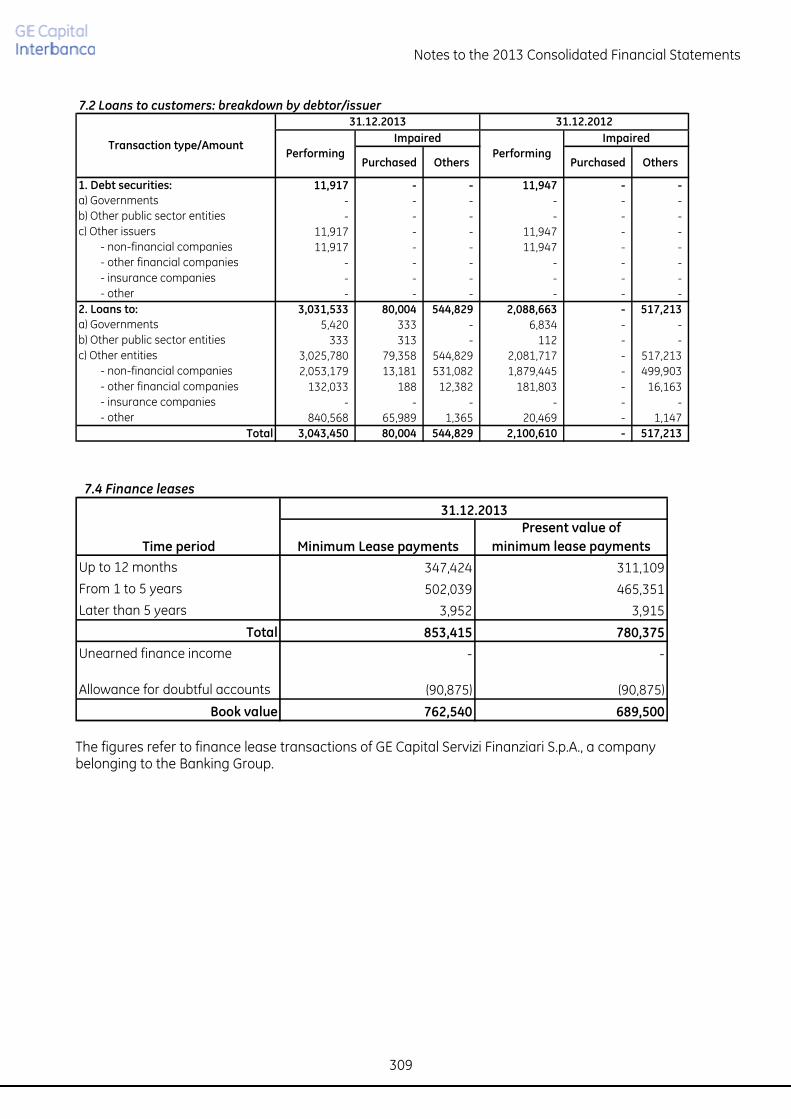
Notes to the 2013 Consolidated Financial Statements
309
7.2 Loans to customers: breakdown by debtor/issuer
Purchased Others Purchased Others
1. Debt securities: 11,917 - - 11,947 - -
a) Governments - - - - - - b) Other public sector entities - - - - - - c) Other issuers 11,917 - - 11,947 - -
- non-financial companies 11,917 - - 11,947 - - - other financial companies - - - - - -
- insurance companies - - - - - - - other - - - - - -
2. Loans to: 3,031,533 80,004 544,829 2,088,663 - 517,213
a) Governments 5,420 333 - 6,834 - - b) Other public sector entities 333 313 - 112 - - c) Other entities 3,025,780 79,358 544,829 2,081,717 - 517,213
- non-financial companies 2,053,179 13,181 531,082 1,879,445 - 499,903
- other financial companies 132,033 188 12,382 181,803 - 16,163 - insurance companies - - - - - - - other 840,568 65,989 1,365 20,469 - 1,147
Total 3,043,450 80,004 544,829 2,100,610 - 517,213
31.12.2013
Impaired
Performing Transaction type/Amount
31.12.2012
Performing
Impaired
7.4 Finance leases
Minimum Lease payments
Present value of
minimum lease payments
Up to 12 months 347,424 311,109
From 1 to 5 years 502,039 465,351
Later than 5 years 3,952 3,915
Total 853,415 780,375
Unearned finance income - -
Allowance for doubtful accounts (90,875) (90,875)
Book value 762,540 689,500
31.12.2013
Time period
The figures refer to finance lease transactions of GE Capital Servizi Finanziari S.p.A., a company belonging to the Banking Group.

Notes to the 2013 Consolidated Financial Statements
310
Section 8 Hedging derivatives – Item 80
Level 1 Level 2 Level 3 Level 1 Level 2 Level 3
A) Financial derivatives - 494 - 25,000 - 931 - 25,000
1) Fair value - 494 - 25,000 - 931 - 25,000
2) Cash flow - - - - - - - -
3) Foreign investments - - - - - - - -
B) Credit derivatives - - - - - - - -
1) Fair value - - - - - - - -
2) Cash flow - - - - - - - -
Total - 494 - 25,000 - 931 - 25,000
Notional
value
31.12.2012
8.1 Hedging derivatives: breakdown by type of hedging and fair value hierarchies
Fair value 31.12.2013 Notional
value
31.12.2013
Fair value 31.12.2012
Interest
rate risk
Currency
risk
Credit
riskPrice risk
Multiple
risks
1. Financial assets available for
sale - - - - - x - x x
2. Loans - - - x - x - x x3. Financial assets held to
maturity x - - x - x - x x
4. Portfolio x x x x x - x - x
5. Other transactions - - - - - x - x -
Total assets - - - - - - - - -
1. Financial liabilities 494 - - x - x - x x
2. Portfolio x x x x x - x - x
Total liabilities 494 - - x - - - - -
1. Expected transactions x x x x x x - x x
2. Portfolio of financial assets and
liabilities x x x x x - x - -
Foreign
investments
8.2 Hedging derivatives: breakdown by hedged portfolio and type of hedge
Cash Flow
Transaction/Type of hedge
Ge
ne
ral
Sp
eci
fic
Ge
ne
ral
Fair Value
Specific
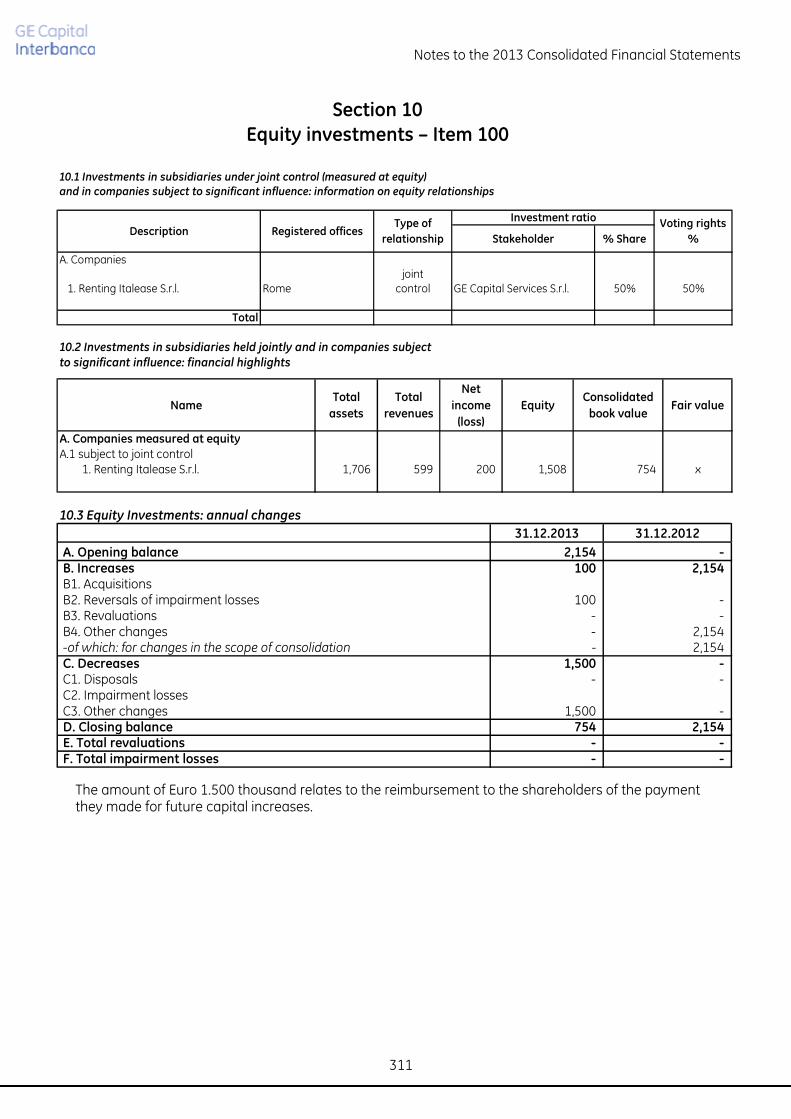
Notes to the 2013 Consolidated Financial Statements
311
Section 10 Equity investments – Item 100
10.1 Investments in subsidiaries under joint control (measured at equity) and in companies subject to significant influence: information on equity relationships
Stakeholder % Share
A. Companies
1. Renting Italease S.r.l. Romejoint
control GE Capital Services S.r.l. 50% 50%
Total
Voting rights
%Description Registered offices
Type of
relationship
Investment ratio
10.2 Investments in subsidiaries held jointly and in companies subject to significant influence: financial highlights
NameTotal
assets
Total
revenues
Net
income
(loss)
EquityConsolidated
book valueFair value
A. Companies measured at equity
A.1 subject to joint control 1. Renting Italease S.r.l. 1,706 599 200 1,508 754 x
10.3 Equity Investments: annual changes
31.12.2013 31.12.2012
A. Opening balance 2,154 - B. Increases 100 2,154 B1. Acquisitions B2. Reversals of impairment losses 100 - B3. Revaluations - - B4. Other changes - 2,154 -of which: for changes in the scope of consolidation - 2,154 C. Decreases 1,500 - C1. Disposals - - C2. Impairment losses C3. Other changes 1,500 - D. Closing balance 754 2,154 E. Total revaluations - - F. Total impairment losses - -
The amount of Euro 1.500 thousand relates to the reimbursement to the shareholders of the payment they made for future capital increases.

Notes to the 2013 Consolidated Financial Statements
312
Section 12 Tangible assets – Item 120
Asset/Amount 31.12.2013 31.12.2012
1. Owned operating tangible assets 178,986 175,107
a) land 29,154 29,154 b) buildings 18,438 19,233 c) furniture and fittings 326 454 d) electronic equipment 599 1,112 e) other 130,469 125,154
2. leased tangible assets - -
a) land - - b) buildings - - c) furniture and fittings - - d) electronic equipment - - e) other - -
Total 178,986 175,107 The item “Other tangible assets” refers to automobiles under medium/long-term rental contracts stipulated by GE Capital Services S.r.l.

Notes to the 2013 Consolidated Financial Statements
313
12.5 Own-use Assets: annual changes
Land BuildingsFurniture
and fittings
Electronic
equipmentOther Total
A. Gross opening balance: 29,154 33,131 5,286 14,505 127,847 209,923
A.1 Aggregate amount of decreases - 13,898 4,832 13,393 2,693 34,816
A.2 Net opening balances 29,154 19,233 454 1,112 125,154 175,107
B. Increases: - - 212 90 54,154 54,456
B.1 Purchases - - 212 90 54,154 54,456
B.2 Improvements capitalised - - - - - -
B.3 Reversals of impairment losses - - - - - -
B.4 Fair value adjustments recognised in - - - - - -
a) equity - - - - - -
b) income statement - - - - - -
B.5 Effect of movements in foreign exchange - - - - - -
B.6 Transfers from investments property - - - - - -
B.7 Other changes - - - - - -
of which for changes in the scope of consolidation - - - - - -
C. Decreases: - 795 340 551 48,891 50,577
C.1 Disposals - - - - 13,807 13,807
C.2 Depreciation - 795 340 551 35,024 36,710
C.3 Impairment losses recognised in - - - - - -
a) equity - - - - - -
b) income statement - - - - - -
C.4 Fair value adjustments recognised in - - - - - -
a) equity - - - - - -
b) income statement - - - - - -
C.5 Effect of movements in foreign exchange - - - - - -
C.6 Transfers to - - - - - -
a) investment property - - - - - -
b) non-current assets held for sale - - - - - -
C0.7 Other changes - - - - 60 60
D. Closing balance: 29,154 18,438 326 651 130,417 178,986
D.1 Aggregate amount of decreases - 14,691 4,585 12,588 - 31,864
D.2 Gross closing balance 29,154 33,129 4,911 13,239 130,417 210,850
E. Valuation at cost 29,154 18,503 486 599 130,641 179,383

Notes to the 2013 Consolidated Financial Statements
314
Section 13 Intangible assets – Item 130
Finite useful
life
Indefinite
useful life
Finite useful
life
Indefinite
useful life
A.1 Goodwill x - x - A.2 Other intangible assets 3,564 - 2,517 - A.2.1 Assets valued at cost: 3,564 - 2,517 -
a) Internally-generated intangible assets - - - - b) Other assets 3,564 - 2,517 -
A.2.2 Assets valued at fair value: - - - - a) Internally-generated intangible assets - - - - b) Other assets - - - -
Total 3,564 - 2,517 -
13.1 Intangible assets: breakdown by type of asset
Asset/Amount
31.12.2013 31.12.2012

Notes to the 2013 Consolidated Financial Statements
315
Finite Indefinite Finite Indefinite
A. Opening balance - - - 7,493 - 7,493
A.1 Aggregate amount of decreases - - - 4,976 - 4,976
A.2 Net opening balances - - - 2,517 - 2,517
B. Increases - - - 2,079 - 2,079
B.1 Purchases - - - 2,079 - 2,079
B.2 Increases in internally-generated intangible assets x - - - - -
B.3 Reversals of impairment losses x - - - - -
B.4 Fair value adjustments recognised in - - - - - -
- equity x - - - - -
- income statement x - - - - -
B.5 Effect of movements in foreign exchange - - - - - -
B0.6 Other changes - - - - - -
of which for changes in the scope of consolidation - - - - - -
C. Decreases - - - 1,032 - 1,032
C.1 Disposals - - - - - -
C.2 Adjustments - - - 1,021 - 1,021
Amortisation x - - 1,021 - 1,021
Impairment losses - - - - - -
+ equity x - - - - -
+ income statement - - - - - -
C.3 Fair value adjustments recognised in - - - - - -
- equity x - - - - -
- income statement x - - - - -
C.4 Transfers to non-current assets held for sale - - - - - -
C.5 Effect of movements in foreign exchange - - - - - -
C.6 Other changes - - - 11 - 11
D. Net closing balance - - - 3,564 - 3,564
D.1 Aggregate amount of decreases - - - 5,997 - 5,997
E. Gross closing balance - - - 9,561 - 9,561
13.2 Intangible assets: annual changes
Total
Other intangible
assets: internally
generated
Go
od
wil
l
Other intangible
assets: other
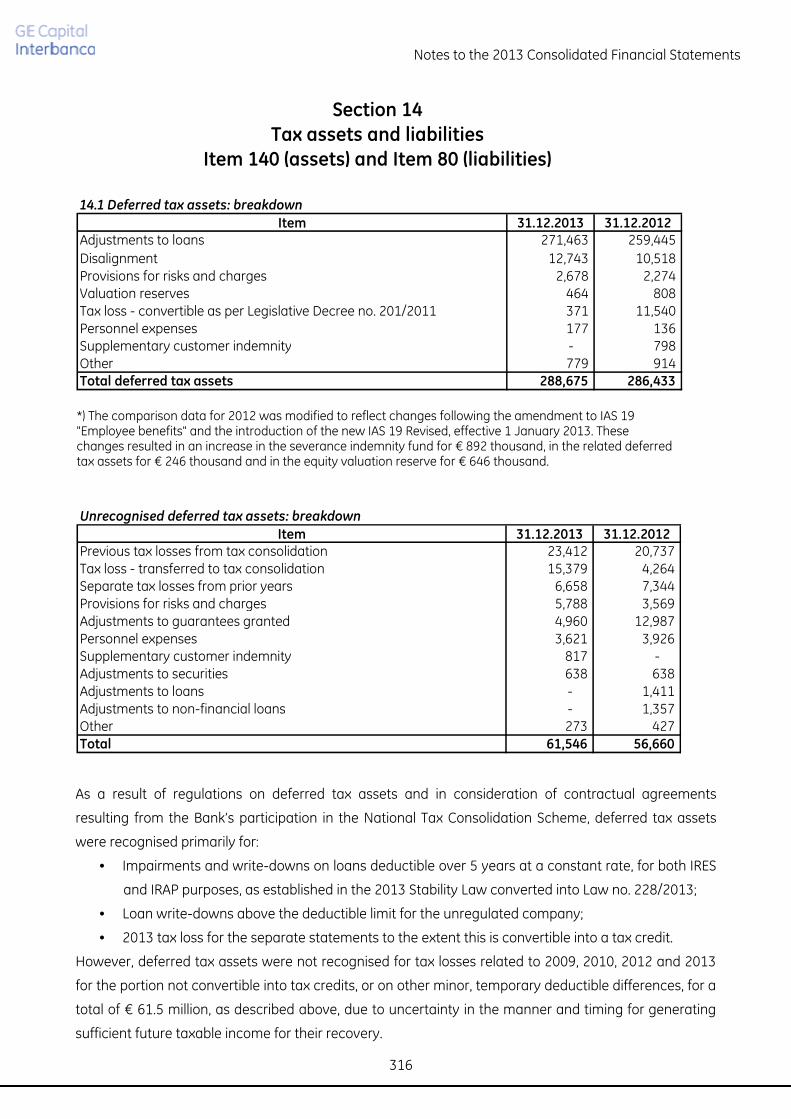
Notes to the 2013 Consolidated Financial Statements
316
Section 14 Tax assets and liabilities
Item 140 (assets) and Item 80 (liabilities)
14.1 Deferred tax assets: breakdown
Item 31.12.2013 31.12.2012
Adjustments to loans 271,463 259,445
Disalignment 12,743 10,518 Provisions for risks and charges 2,678 2,274 Valuation reserves 464 808 Tax loss - convertible as per Legislative Decree no. 201/2011 371 11,540 Personnel expenses 177 136 Supplementary customer indemnity - 798 Other 779 914 Total deferred tax assets 288,675 286,433
*) The comparison data for 2012 was modified to reflect changes following the amendment to IAS 19 "Employee benefits" and the introduction of the new IAS 19 Revised, effective 1 January 2013. These changes resulted in an increase in the severance indemnity fund for € 892 thousand, in the related deferred tax assets for € 246 thousand and in the equity valuation reserve for € 646 thousand.
Unrecognised deferred tax assets: breakdown
Item 31.12.2013 31.12.2012
Previous tax losses from tax consolidation 23,412 20,737 Tax loss - transferred to tax consolidation 15,379 4,264 Separate tax losses from prior years 6,658 7,344 Provisions for risks and charges 5,788 3,569 Adjustments to guarantees granted 4,960 12,987 Personnel expenses 3,621 3,926 Supplementary customer indemnity 817 - Adjustments to securities 638 638 Adjustments to loans - 1,411 Adjustments to non-financial loans - 1,357 Other 273 427 Total 61,546 56,660
As a result of regulations on deferred tax assets and in consideration of contractual agreements
resulting from the Bank’s participation in the National Tax Consolidation Scheme, deferred tax assets
were recognised primarily for:
• Impairments and write-downs on loans deductible over 5 years at a constant rate, for both IRES
and IRAP purposes, as established in the 2013 Stability Law converted into Law no. 228/2013;
• Loan write-downs above the deductible limit for the unregulated company;
• 2013 tax loss for the separate statements to the extent this is convertible into a tax credit.
However, deferred tax assets were not recognised for tax losses related to 2009, 2010, 2012 and 2013
for the portion not convertible into tax credits, or on other minor, temporary deductible differences, for a
total of € 61.5 million, as described above, due to uncertainty in the manner and timing for generating
sufficient future taxable income for their recovery.

Notes to the 2013 Consolidated Financial Statements
317
Item 31.12.2013 31.12.2012
Tangible assets 21,378 21,804 Write-backs of securities 927 2,299 Default interest receivable 612 485 Dividends 219 215 Personnel expenses 218 296 Other 441 - Total deferred tax liabilities 23,795 25,099
14.2 Deferred tax liabilities: breakdown
14.3 Changes in deferred tax assets (recognised in the income statement)
31.12.2013 31.12.20121. Opening balance 285,594 211,297
2. Increases 69,524 101,286
2.1 Deferred tax assets arising in the year 69,524 73,002 a) relating to prior years - - b) due to changes in accounting policies - - c) reversals - - d) other 69,524 73,002
2.2 New taxes or increases in tax rates - - 2.3 Other increases - 28,284 3. Decreases 66,855 26,989
3.1 Reversal of timing differences 13,124 21,982 a) transfers 11,915 21,982 b) write-downs of non-recoverable items - - c) change in accounting policies - - d) other 1,209 -
3.2 Reductions in tax rates - - 3.3 Other decreases 53,731 5,007
a) conversions into tax credits as per Law no. 214/2011 53,731 4,921 b) other - 86
4. Closing balance 288,263 285,594

Notes to the 2013 Consolidated Financial Statements
318
31.12.2013 31.12.2012
1. Opening balance 254,004 210,119
2. Increases 50,230 60,014
2.1 Deferred tax assets arising in the year 50,230 60,014 a) relating to prior years - 22 b) due to changes in accounting policies - - c) reversals - - d) other 50,230 59,992
3. Decreases 53,730 16,129
3.1 Transfers - 11,122 3.2 Conversions into tax credits 53,730 4,921
a) resulting from losses during the year 42,190 3,393 b) resulting from tax losses 11,540 1,528
3.3 Other decreases - 86 4. Closing balance 250,504 254,004
14.3.1 Changes in deferred tax assets as per Law no. 214/2011
(recognised in the income statement)
31.12.2013 31.12.20121. Opening balance 22,725 10,248
2. Increases 128 22,106
2.1 Deferred tax liabilities arising in the year 128 9,444 a) relating to prior years - 125 b) due to changes in accounting policies - - c) other 128 9,319
2.2 New taxes or increases in tax rates - - 2.3 Other increases - 12,662
of which for changes in the scope of consolidation - 12,662 3. Decreases 62 9,629
3.1 Reversal of timing differences 62 9,629 a) transfers 62 9,629 b) due to changes in accounting policies - - c) other - -
3.2 Reductions in tax rates - - 3.3 Other decreases - - 4. Closing balance 22,791 22,725
14.4 Changes in deferred tax liabilities (recognised in the income statement)

Notes to the 2013 Consolidated Financial Statements
319
31.12.2013 31.12.2012
1. Opening balance 839 1,670
2. Increases - 278
2.1 Deferred tax assets arising in the year - 246 a) relating to prior years - - b) due to changes in accounting policies (*) - 246 c) other -
2.2 New taxes or increases in tax rates - - 2.3 Other increases - 32
of which for changes in the scope of consolidation - 32
3. Decreases 427 1,109
3.1 Reversal of timing differences 427 1,109 a) transfers 403 1,109 b) write-downs of non-recoverable items - - c) due to changes in accounting policies - - d) other 24 -
3.2 Reductions in tax rates - - 3.3 Other decreases - - 4. Closing balance 412 839
14.5 Changes in deferred tax assets (recognised in Equity)
*) The comparison data for 2012 was modified to reflect changes following the amendment to IAS 19 "Employee
benefits" and the introduction of the new IAS 19 Revised, effective 1 January 2013. These changes resulted in an
increase in the severance indemnity fund for € 892 thousand, in the related deferred tax assets for € 246
thousand and in the equity valuation reserve for € 646 thousand.
31.12.2013 31.12.20121. Opening balance 2,374 800
2. Increases 224 1,698
2.1 Deferred tax liabilities arising in the year 224 1,622 a) relating to prior years - b) due to changes in accounting policies - c) other 224 1,622 2.2 New taxes or increases in tax rates - - 2.3 Other increases - 76
of which for changes in the scope of consolidation 76
3. Decreases 1,594 124
3.1 Reversal of timing differences 1,594 124 a) transfers 1,594 124 b) due to changes in accounting policies - - c) other - - 3.2 Reductions in tax rates - - 3.3 Other decreases - - 4. Closing balance 1,004 2,374
14.6 Changes in deferred tax liabilities (recognised in Equity)
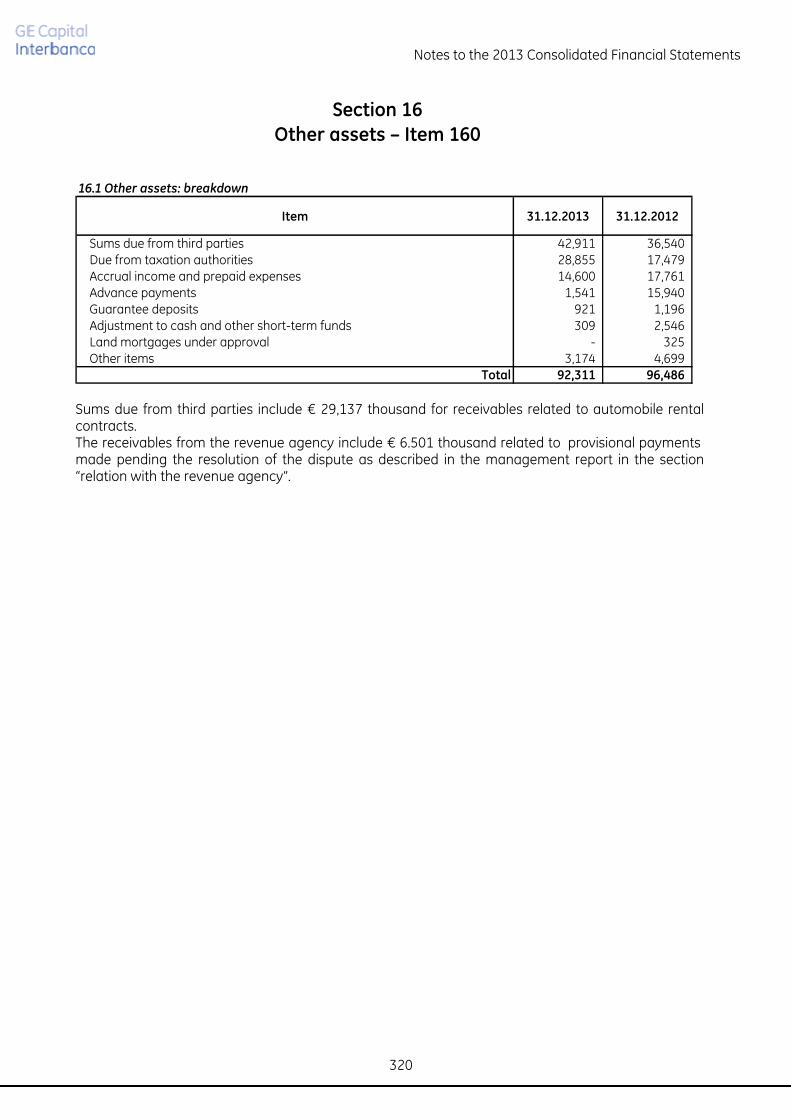
Notes to the 2013 Consolidated Financial Statements
320
Section 16 Other assets – Item 160
Item 31.12.2013 31.12.2012
Sums due from third parties 42,911 36,540 Due from taxation authorities 28,855 17,479 Accrual income and prepaid expenses 14,600 17,761 Advance payments 1,541 15,940 Guarantee deposits 921 1,196 Adjustment to cash and other short-term funds 309 2,546 Land mortgages under approval - 325 Other items 3,174 4,699
Total 92,311 96,486
16.1 Other assets: breakdown
Sums due from third parties include € 29,137 thousand for receivables related to automobile rental contracts. The receivables from the revenue agency include € 6.501 thousand related to provisional payments made pending the resolution of the dispute as described in the management report in the section “relation with the revenue agency”.

Notes to the 2013 Consolidated Financial Statements
321
LIABILITIES
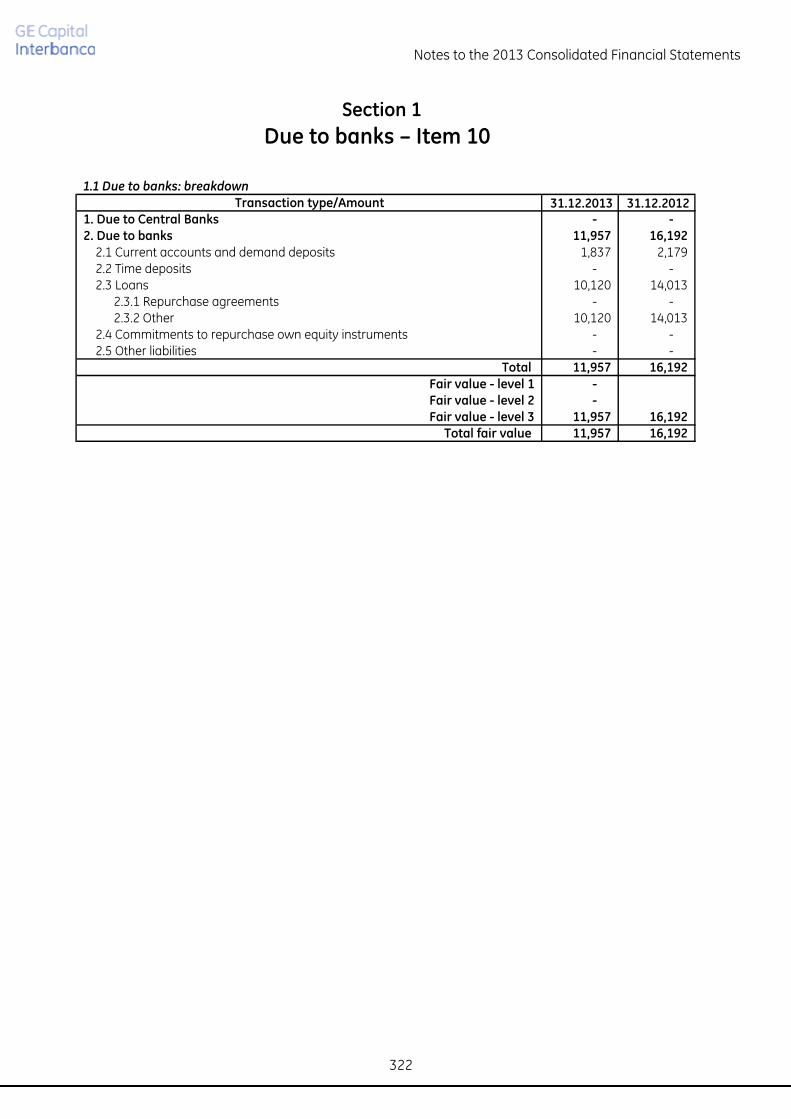
Notes to the 2013 Consolidated Financial Statements
322
Section 1
Due to banks – Item 10
Transaction type/Amount 31.12.2013 31.12.2012 1. Due to Central Banks - -
2. Due to banks 11,957 16,192
2.1 Current accounts and demand deposits 1,837 2,179 2.2 Time deposits - - 2.3 Loans 10,120 14,013 2.3.1 Repurchase agreements - - 2.3.2 Other 10,120 14,013 2.4 Commitments to repurchase own equity instruments - - 2.5 Other liabilities - -
Total 11,957 16,192
Fair value - level 1 -
Fair value - level 2 -
Fair value - level 3 11,957 16,192
Total fair value 11,957 16,192
1.1 Due to banks: breakdown

Notes to the 2013 Consolidated Financial Statements
323
Section 2 Due to customers – Item 20
Transaction type/Amount 31.12.2013 31.12.2012
1. Current accounts and demand deposits 104,106 71,375 2. Time deposits 6,719 4,651 3. Loans 3,476,778 3,568,733 3.1 Repurchase agreements - - 3.2 Other 3,476,778 3,568,733 4. Commitments to repurchase own equity instruments - - 5. Other liabilities 41,658 186,876
Total 3,629,261 3,831,635
Fair value - level 1 - -
Fair value - level 2 - -
Fair value - level 3 3,618,270 3,831,635
Total fair value 3,618,270 3,831,635
2.1 Due to customers: breakdown
Due to customers includes € 36,107 thousand for the financing line obtained after the transfer of the loan portfolio from GE Capital Servizi Finanziari S.p.A. as part of the securitisation transaction described in Section C Part E of the Notes to the Consolidated Financial Statements. 2.2 Additional information on item 20 "Due to customers": subordinated loans (current regulations)
Transaction type/Amount
31.12.2013 Maturity date
Interest rate (nominal
annual rate in effect as at
31.12.2013)
Subordinated Loan Agreement "GE HUNGARY KFT" variable rate - lower Tier 2 Capital
200,225 10.10.2016 2.028%

Notes to the 2013 Consolidated Financial Statements
324
Section 3 Securities issued – Item 30
Level 1 Level 2 Level 3 Level 1 Level 2 Level 3
A. Securities
1. bonds 216,509 82,536 114,387 - 320,261 73,752 218,011 -
1.1 structured 83,016 82,536 - - 80,185 73,752 - - 1.2 other 133,493 - 114,387 - 240,076 - 218,011 - 2. other securities 3,196 - 3,196 - 5,738 - 5,738 -
2.1 structured - - - - - - - - 2.2 other 3,196 - 3,196 - 5,738 - 5,738 -
Total 219,705 82,536 117,583 - 325,999 73,752 223,749 -
Book Value
Fair Value
3.1 Securities issued: breakdown
Type of security/Amount
31.12.2013 31.12.2012
Book Value
Fair Value
31.12.2013 31.12.2012
1. Fair value hedge: securities held against exposure to 25.539 25.963
a) interest rate risk 25.539 25.963 b) currency risk - - c) multiple risks - - 2. Cash flow hedge: securities hedged against exposure to - -
a) interest rate risk - - b) currency risk - - c) other - -
Total 25.539 25.963
3.3 Securities issued: securities with specific hedges

Notes to the 2013 Consolidated Financial Statements
325
Section 4 Financial liabilities held for trading – Item 40
4.1 Financial liabilities held for trading: breakdown
L1 L2 L3 L1 L2 L3
A. Financial liabilities (non-derivatives)
1. Due to banks - - - - - - - - - - 2. Due to customers - - - - - - - - 3. Debt securities - - - - - - - - - - 3.1 Bonds - - - - - - - - - - 3.1.1 Structured - - - - x - - - - x 3.1.2 Other - - - - x - - - - x 3.2 Other securities - - - - - - - - - - 3.2.1 Structured - - - - x - - - - x 3.2.2 Other - - - - x - - - - x
Total A - - - - - - - - - -
B. Derivatives
1. Financial derivatives 339,737 - 53,668 - - 1,068,683 - 81,211 - - 1.1 Trading x - 53,668 - x x - 81,211 - x 1.2 Under the fair value option x - - - x x - - - x 1.3 Other x - - - x x - - - x 2. Credit derivatives - - - - - - - - - - 2.1 Trading x - - - x x - - - x 2.2 Under the fair value option x - - - x x - - - x 2.3 Other x - - - x x - - - x
Total B x - 53,668 - x x - 81,211 - x
Total (A+B) x - 53,668 - x x - 81,211 - x
FV = fair valueFV* = fair value calculation without adjustments for credit ratingNV = nominal or notional valueL1 = Level 1L2 = Level 2L3 = Level 3
31.12.2012
Transaction type/AmountNV FV*
31.12.2013
FV NV FV FV*

Notes to the 2013 Consolidated Financial Statements
326
Section 6 Hedging derivatives – Item 60
Level 1 Level 2 Level 3 Level 1 Level 2 Level 3
A) Financial derivatives - - - - - 103 - 11,681 1) Fair value - - - - - - - - 2) Cash flow - - - - - 103 - 11,681 3) Foreign investments - - - - - - - -
B) Credit derivatives - - - - - - - - 1) Fair value - - - - - - - - 2) Cash flow - - - - - - - -
Total - - - - - 103 - 11,681
Notional
value
31.12.2012
6.1 Hedging derivatives: breakdown by type of hedging and fair value hierarchies
Fair value 31.12.2013 Notional
value
31.12.2013
Fair value 31.12.2012
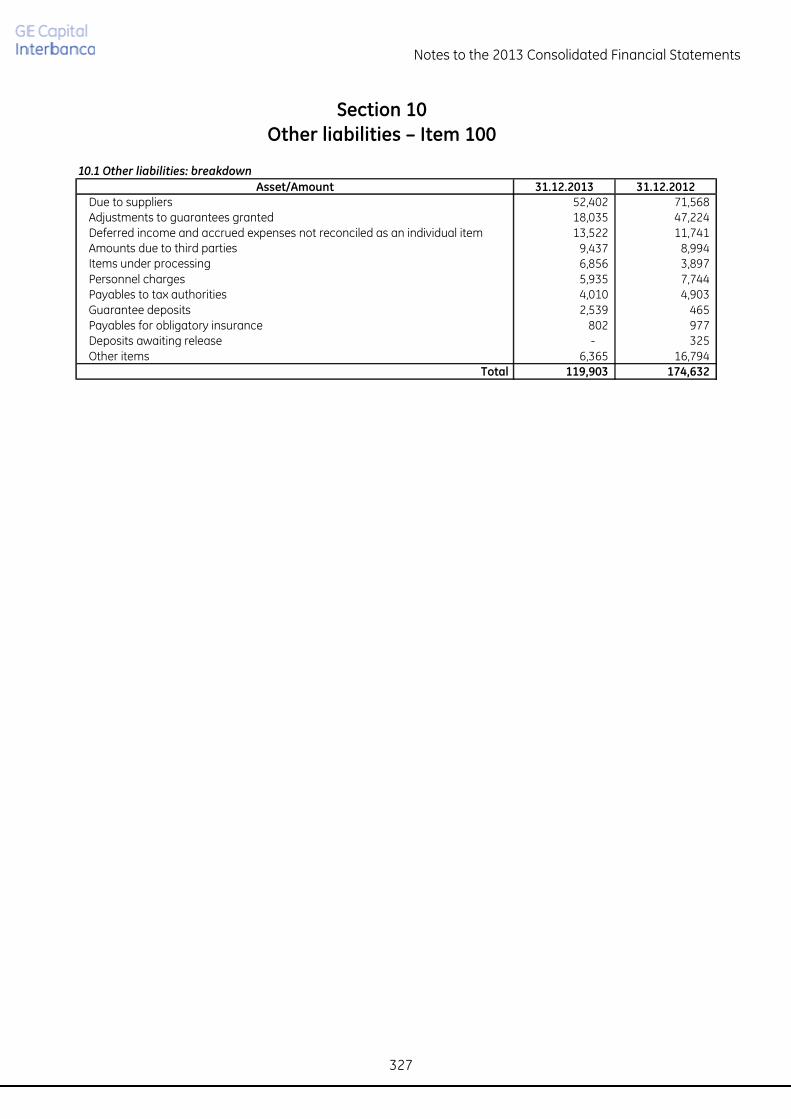
Notes to the 2013 Consolidated Financial Statements
327
Section 10 Other liabilities – Item 100
Asset/Amount 31.12.2013 31.12.2012
Due to suppliers 52,402 71,568 Adjustments to guarantees granted 18,035 47,224 Deferred income and accrued expenses not reconciled as an individual item 13,522 11,741 Amounts due to third parties 9,437 8,994 Items under processing 6,856 3,897 Personnel charges 5,935 7,744 Payables to tax authorities 4,010 4,903 Guarantee deposits 2,539 465 Payables for obligatory insurance 802 977 Deposits awaiting release - 325 Other items 6,365 16,794
Total 119,903 174,632
10.1 Other liabilities: breakdown
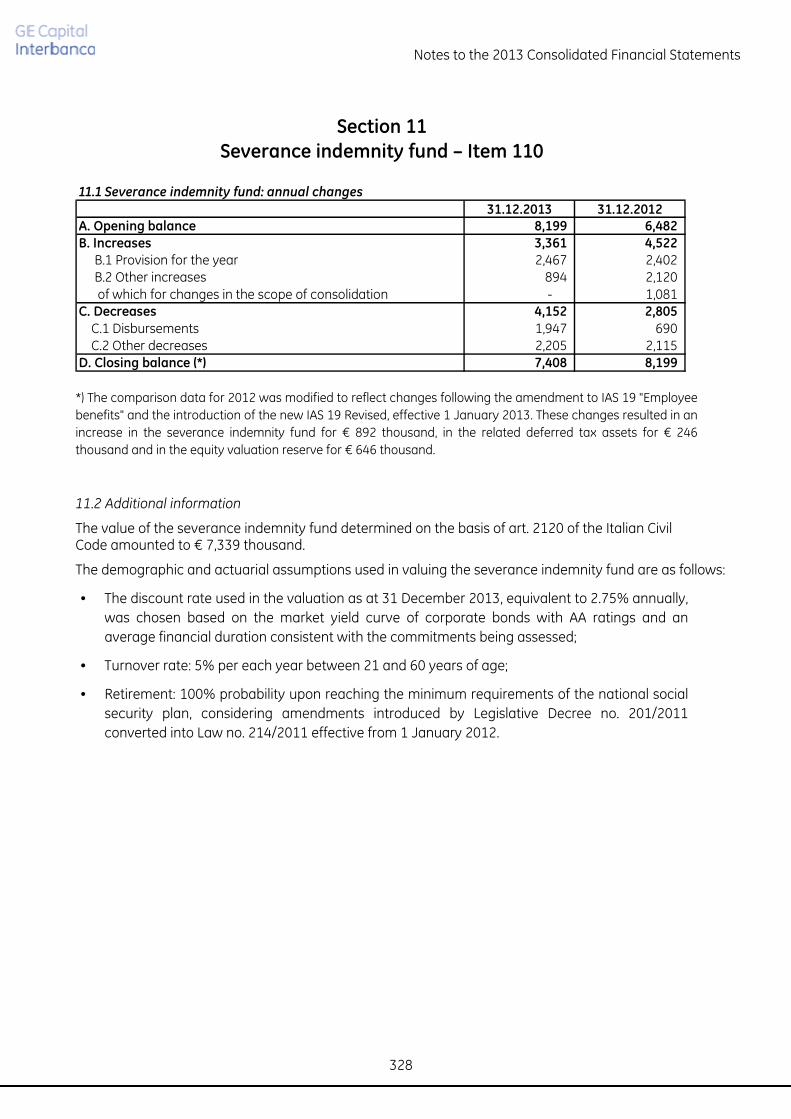
Notes to the 2013 Consolidated Financial Statements
328
Section 11 Severance indemnity fund – Item 110
11.1 Severance indemnity fund: annual changes
31.12.2013 31.12.2012A. Opening balance 8,199 6,482
B. Increases 3,361 4,522
B.1 Provision for the year 2,467 2,402 B.2 Other increases 894 2,120 of which for changes in the scope of consolidation - 1,081 C. Decreases 4,152 2,805
C.1 Disbursements 1,947 690 C.2 Other decreases 2,205 2,115 D. Closing balance (*) 7,408 8,199
*) The comparison data for 2012 was modified to reflect changes following the amendment to IAS 19 "Employee
benefits" and the introduction of the new IAS 19 Revised, effective 1 January 2013. These changes resulted in an
increase in the severance indemnity fund for € 892 thousand, in the related deferred tax assets for € 246
thousand and in the equity valuation reserve for € 646 thousand.
11.2 Additional information
The value of the severance indemnity fund determined on the basis of art. 2120 of the Italian Civil Code amounted to € 7,339 thousand.
The demographic and actuarial assumptions used in valuing the severance indemnity fund are as follows:
• The discount rate used in the valuation as at 31 December 2013, equivalent to 2.75% annually,
was chosen based on the market yield curve of corporate bonds with AA ratings and an
average financial duration consistent with the commitments being assessed;
• Turnover rate: 5% per each year between 21 and 60 years of age;
• Retirement: 100% probability upon reaching the minimum requirements of the national social
security plan, considering amendments introduced by Legislative Decree no. 201/2011
converted into Law no. 214/2011 effective from 1 January 2012.

Notes to the 2013 Consolidated Financial Statements
329
Section 12 Allowances for risks and charges – Item 120
12.1 Allowances for risks and charges: breakdown
Item/Amount 31.12.2013 31.12.20121. Staff retirement funds - - 2. Other allowances for risks and charges 45,542 46,613 2.1 legal disputes 9,995 7,514 2.2 personnel expenses 13,676 16,725 2.3 other 21,871 22,374
Total 45,542 46,613
12.2 Allowances for risks and charges: annual changes
Legal
disputes
Personnel
chargesOther
A. Opening balance - 7,514 16,725 22,374 46,613
B. Increases - 3,354 6,220 4,080 13,654
B.1 Provision for the year - 3,354 6,176 4,080 13,610 B.2 Changes due to time value - - - - -
B.3 Changes due to variations in the discount rate - - - - - B.4 Other increases - - 44 - 44 of which for changes in the scope of consolidation - - - - C. Decreases - 873 9,269 4,583 14,725
C.1 Utilisation during the year - 496 5,963 3,197 9,656
C.2 Changes due to variations in the discount rate - - - - - C.3 Other decreases - 377 3,306 1,386 5,069 D. Closing balance - 9,995 13,676 21,871 45,542
Retirement
funds
Other
Total
12.4 Allowances for risks and charges: other allowances The allowance for legal disputes was calculated using data provided primarily from the legal departments of each company. Provisions for personnel charges (Table 12.1-2-2.2) includes:
as regards the Parent Company: • € 7,388 thousand for the 2009 redundancy programme;
• € 3,401 thousand for incentive compensation;
• € 1,063 thousand for the staff loyalty fund;
• € 70 thousand for potential litigation with employees.
with regards to the other companies in the scope of consolidation: • € 1,755 thousand for incentive compensation.
“Other" provisions (Table 12.1-2-2.3) primarily include:
as regards the Parent Company: • € 2,785 thousand for potential recovery actions on sold loans;
• € 1,032 thousand for potential lack of recognition of receivables for loan application fees
associated with subsidised credit laws;

Notes to the 2013 Consolidated Financial Statements
330
• € 878 thousand for potential recovery actions by the Ministry undertaken to claw back
funds related to activities performed under Law 488;
• € 237 thousand for potential recovery actions on M&A positions;
• € 192 thousand for an outstanding invoice not related to lending activity;
• € 191 thousand for corporate litigation;
with regards to the other companies in the scope of consolidation:
• GE Capital Servizi Finanziari - € 2,971 thousand for the Supplementary Customer Indemnity
(FISC) Fund and € 683 thousand for automobile taxes;
• GE Capital Services - € 12,093 for implicit risks associated with rental assets and € 463
thousand for legal and tax disputes.
Both the amounts and the timing are the result of a prudent assessment by the Parent Company’s
directors.
Additionally, below are listed the Parent Company’s potential liabilities of a relevant amount, that are
considered not probable and, therefore, no provisions have been set aside in the financial
statements:
• Litigation brought against the Parent Company in 2010 in relation to a position for which it
had stipulated a settlement agreement in 2005 with the then-special commissioner
appointed for procedure for extraordinary administration. The agreement’s validity was
brought into question by the new special commissioner, who presented a claim for damages
of € 168 million. The risk assessment considers the opinions of external attorneys, as well as
the initial positive indications from the proceedings at first instance for this dispute;
• At the beginning of 2012, the Parent Company was notified, along with more than 60 other
defendants, of litigation related to a previous indirect equity investment, the remedy for
which is at least € 388 million, jointly and severally.
During 2013, the request for damages for failure to reduce a prior environmental hazard was
also extended to the Bank, jointly with the other defendants, allegedly ascribable to a
company the Bank had previously indirectly owned, in the amount of € 3,400 million. To date,
despite the uncertainties normally associated with the initial phases of a dispute of this
complexity, the Bank considers that a precise valuation of the dispute would be random and
premature at this point, based on the opinion expressed by the attorneys and in
consideration of the initial phases of the dispute and of the still potential nature of the key
element of the damages requested (environmental damages). The Bank holds that the claims
advanced by the plaintiff are, ex multis, completely baseless and lacking proof of the causal
relationship between the damages and the Bank's conduct

Notes to the 2013 Consolidated Financial Statements
331
Moreover, a tax assessment notice and a notification of penalty were received related to the claim
that the following Group companies had not properly applied withholding taxes as follows:
GE Capital Servizi Finanziari S.p.A.:
• for € 18.2 million, in addition to penalties of € 27.3 million, on interest paid in 2007 and 2008
by the Company to its Hungarian lender in the amount of € 67.5 million;
• for € 5.9 million, in addition to penalties of € 8.9 million, on interest paid in 2008 by GE Capital
Bank (a business unit transferred to the Company) to its Hungarian lender in the amount of €
22.0 million;
• for € 1.9 million, in addition to penalties of € 2.8 million, on interest paid in 2007 and 2008 by
the merged company GE Leasing Italia S.p.A to its Hungarian lender in the amount of € 6.9
million;
GE Capital Services S.r.l.:
• for € 5.5 million, in addition to penalties of € 8.2 million, on interest paid in 2008 by the
Company to its Hungarian lender in the amount of € 20.3 million;
• for € 2.3 million, in addition to penalties of € 3.5 million, on interest paid in 2008 by the
merged company GE Noleggi S.p.A to its Hungarian lender in the amount of € 8.7 million;
Furthermore, note that the other Group companies, including the Parent Company have responded
to questionnaires received from the Revenue Agency in reference to interest paid in 2009.
At the time these financial statements were being drawn up, the aforementioned companies
submitted, in a timely manner, tax settlement proposals, together with statements in their defence in
relation to the penalties applied, and paid one-third of the tax amount pending the resolution of the
dispute.
Given the wording, substance and foundation of the notification, the companies maintain that the
findings were baseless, and are convinced that their factual and legal grounds will be upheld in the
related hearings. As such, no specific allowances were made in the relative separate financial
statements or in these consolidated financial statements.

Notes to the 2013 Consolidated Financial Statements
332
Section 15 Group Equity – Items 140, 160, 170, 180, 190, 200 and 220
15.1 Share capital and Treasury shares: breakdown
Item/Amount 31.12.2013 31.12.20121. Share capital 217,335 217,335
2. Share premium reserve 354,148 354,148
3. Reserves 74,339 243,047
4. (Treasury shares) - -
a) Parent Company - -
b) subsidiaries - -
5. Valuation reserves (*) 43,451 39,133
6. Equity instruments - -
7. Profit (Loss) for the year (118,977) (168,707)
Total 570,296 684,956
*) The comparison data for 2012 was modified to reflect changes following the amendment to IAS 19 "Employee
benefits" and the introduction of the new IAS 19 Revised, effective 1 January 2013. These changes resulted in an
increase in the severance indemnity fund for € 892 thousand, in the related deferred tax assets for € 246
thousand and in the equity valuation reserve for € 646 thousand.
Item/Type Ordinary Other
A. Shares outstanding at the beginning of the year 72,445,094 -
- fully paid 72,445,094 -
- not fully paid - -
A.1 Treasury shares (-) - -
A.2 Outstanding shares: opening balance 72,445,094 -
B. Increases - -
B.1 New issues - -
- for cash: - -
- business combinations - -
- conversion of bonds - -
- exercise of warrants - -
- other - -
- granted: - -
- to employees - -
- to directors - -
- other - -
B.2 Disposal of treasury shares - -
B.3 Other changes - -
C. Decreases - -
C.1 Redeemable shares - -
C.2 Purchase of treasury shares - -
C.3 Transfer of businesses - -
C.4 Other changes - -
D. Outstanding shares: closing balance 72,445,094 -
D.1 Treasury shares (+) - -
D.2 Shares outstanding at the end of the year 72,445,094 -
- fully paid 72,445,094 -
- not fully paid - -
15.2 Share capital - Number of Parent Company's shares: annual changes

Notes to the 2013 Consolidated Financial Statements
333
ADDITIONAL INFORMATION
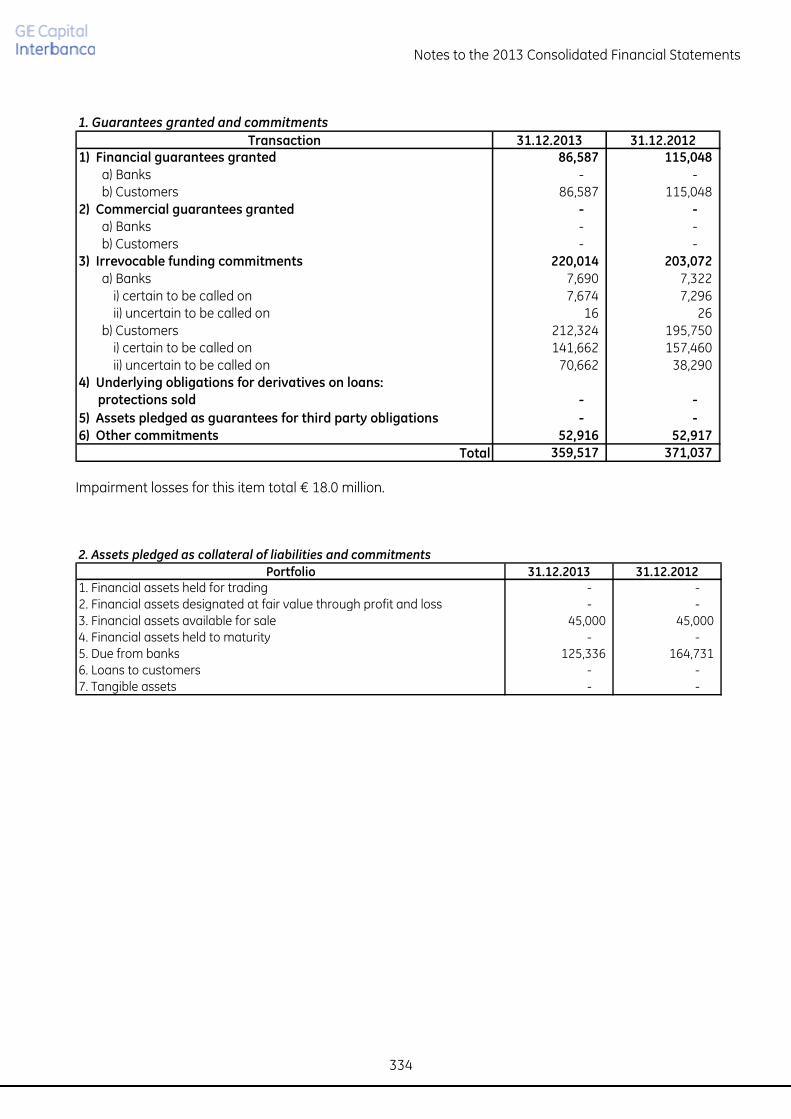
Notes to the 2013 Consolidated Financial Statements
334
Transaction 31.12.2013 31.12.20121) Financial guarantees granted 86,587 115,048
a) Banks - - b) Customers 86,587 115,048
2) Commercial guarantees granted - -
a) Banks - - b) Customers - -
3) Irrevocable funding commitments 220,014 203,072
a) Banks 7,690 7,322 i) certain to be called on 7,674 7,296 ii) uncertain to be called on 16 26
b) Customers 212,324 195,750 i) certain to be called on 141,662 157,460 ii) uncertain to be called on 70,662 38,290
4) Underlying obligations for derivatives on loans:
protections sold - -
5) Assets pledged as guarantees for third party obligations - -
6) Other commitments 52,916 52,917
Total 359,517 371,037
1. Guarantees granted and commitments
Impairment losses for this item total € 18.0 million.
Portfolio 31.12.2013 31.12.20121. Financial assets held for trading - - 2. Financial assets designated at fair value through profit and loss - - 3. Financial assets available for sale 45,000 45,000 4. Financial assets held to maturity - - 5. Due from banks 125,336 164,731 6. Loans to customers - - 7. Tangible assets - -
2. Assets pledged as collateral of liabilities and commitments

Notes to the 2013 Consolidated Financial Statements
335
5. Management and brokerage of securities on behalf of third parties
Type of service 31.12.2013 31.12.2012
1. Trading of financial instruments on behalf of third parties - 5,551
a) Purchases - 5,501
1. settled - 5,501 2. to be settled - -
b) Sales - 50
1. settled - 50 2. to be settled - -
2. Asset management - -
a) Individual - - b) Collective - -
3. Custody and administration of securities 2,958,727 3,383,255
a) Third-party securities under custody: associated with
custodial activities (excluding asset management) - -
1. securities issued by the bank preparing the financial statements - - 2. other securities - -
b) Third-party securities under custody (excluding asset management): other 1,478,723 1,724,679
1. securities issued by the bank preparing the financial statements 220,812 223,049 2. other securities 1,257,911 1,501,630
c) Third-party securities held by other depositories 1,252,720 1,411,644
d) Own securities held by other depositories 227,284 246,932
4. Other transactions - -

Notes to the 2013 Consolidated Financial Statements
336
(empty page)

Notes to the 2013 Consolidated Financial Statements
337
Part C
INFORMATION ON THE INCOME STATEMENT
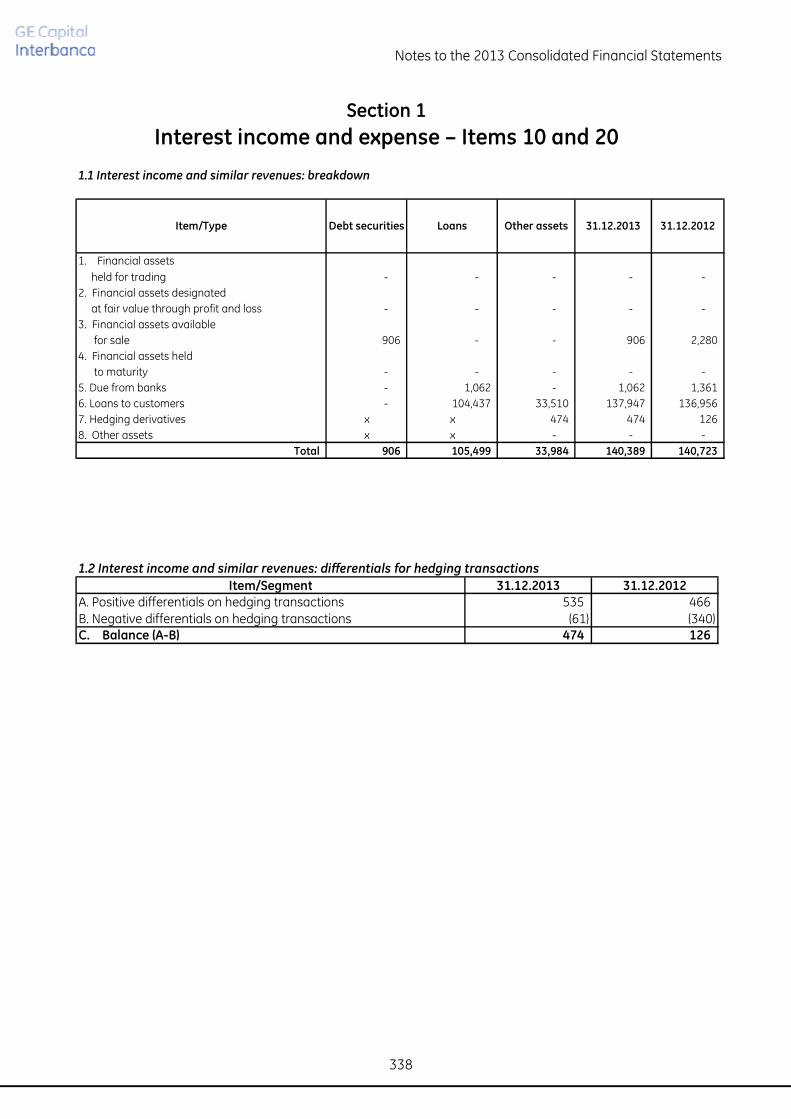
Notes to the 2013 Consolidated Financial Statements
338
Section 1
Interest income and expense – Items 10 and 20
1.1 Interest income and similar revenues: breakdown
1. Financial assets
held for trading - - - - -
2. Financial assets designated
at fair value through profit and loss - - - - -
3. Financial assets available
for sale 906 - - 906 2,280
4. Financial assets held
to maturity - - - - -
5. Due from banks - 1,062 - 1,062 1,361
6. Loans to customers - 104,437 33,510 137,947 136,956
7. Hedging derivatives x x 474 474 126
8. Other assets x x - - -
Total 906 105,499 33,984 140,389 140,723
31.12.2012Item/Type Other assets 31.12.2013Debt securities Loans
Item/Segment 31.12.2013 31.12.2012
A. Positive differentials on hedging transactions 535 466 B. Negative differentials on hedging transactions (61) (340) C. Balance (A-B) 474 126
1.2 Interest income and similar revenues: differentials for hedging transactions

Notes to the 2013 Consolidated Financial Statements
339
31.12.2013 31.12.2012
a) financial assets in foreign currencies 5,224 7,403
1.3.1 Interest income on financial assets denominated in foreign currencies
31.12.2013 31.12.2012
Interest income on financial leasing transactions 30,993 29,779
1.3.2 Interest income on financial leasing transactions
Item/Type Liabilities SecuritiesOther
transactions31.12.2013 31.12.2012
1. Due to Central Banks - x - - -
2. Due to banks (229) x - (229) (477) 3. Due to customers (30,097) x (9,992) (40,089) (49,009) 4. Securities issued x (9,781) - (9,781) (12,555) 5. Financial liabilities held for trading - - - - - 6. Financial liabilities designated at fair value through profit and loss - - - - - 7. Other liabilities and allowances x x (3) (3) (13) 8. Hedging derivatives x x - - -
Total (30,326) (9,781) (13) (50,102) (62,054)
1.4 Interest expense and similar charges: breakdown
31.12.2013 31.12.2012
a) financial liabilities in foreign currencies (1,254) (2,541)
1.6.1 Interest expense on liabilities denominated in foreign currencies
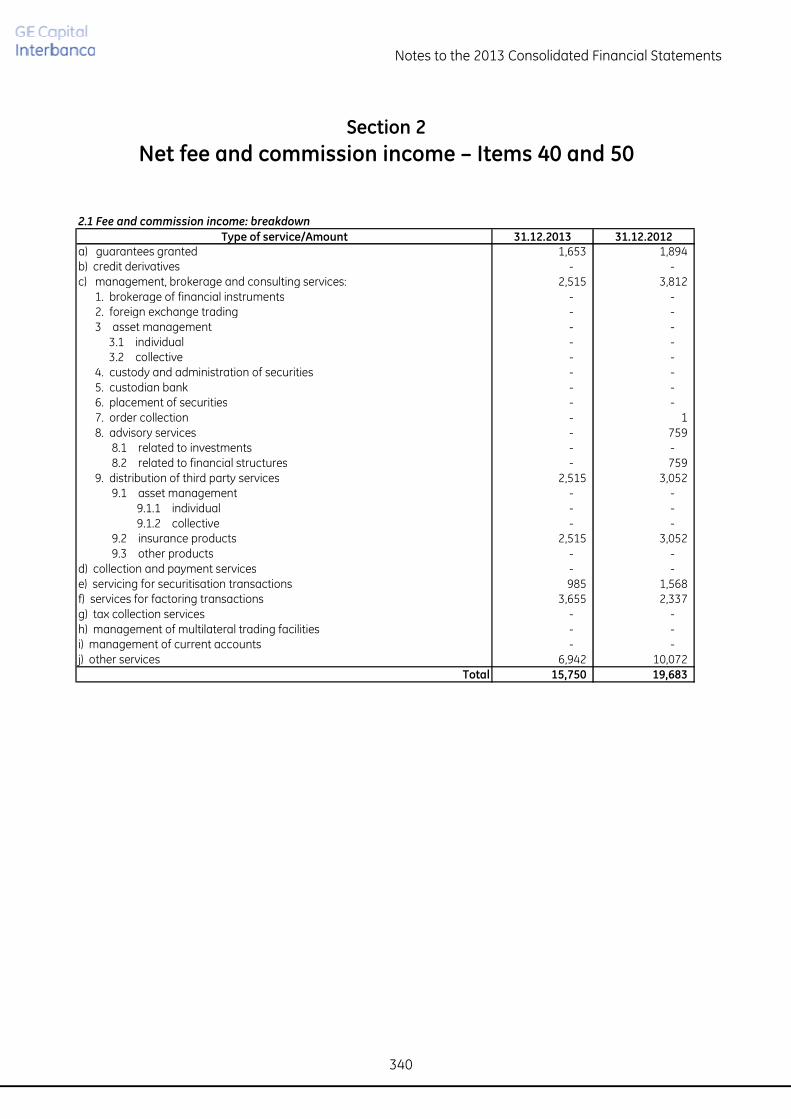
Notes to the 2013 Consolidated Financial Statements
340
Section 2
Net fee and commission income – Items 40 and 50
2.1 Fee and commission income: breakdown
Type of service/Amount 31.12.2013 31.12.2012a) guarantees granted 1,653 1,894 b) credit derivatives - - c) management, brokerage and consulting services: 2,515 3,812 1. brokerage of financial instruments - - 2. foreign exchange trading - - 3 asset management - - 3.1 individual - - 3.2 collective - - 4. custody and administration of securities - - 5. custodian bank - - 6. placement of securities - - 7. order collection - 1 8. advisory services - 759 8.1 related to investments - - 8.2 related to financial structures - 759 9. distribution of third party services 2,515 3,052 9.1 asset management - - 9.1.1 individual - - 9.1.2 collective - - 9.2 insurance products 2,515 3,052 9.3 other products - - d) collection and payment services - - e) servicing for securitisation transactions 985 1,568 f) services for factoring transactions 3,655 2,337 g) tax collection services - - h) management of multilateral trading facilities - - i) management of current accounts - - j) other services 6,942 10,072
Total 15,750 19,683

Notes to the 2013 Consolidated Financial Statements
341
Type of service/Amount 31.12.2012 31.12.2012
a) guarantees received - (1) b) credit derivatives - - c) management and brokerage activities: (48) (75) 1. brokerage of financial instruments (2) (1) 2. foreign exchange trading (4) (4) 3. asset management: - - 3.1 own portfolio - - 3.2 customers' portfolios - - 4. custody and administration of securities (41) (69) 5. placement of financial instruments (1) (1) 6. door-to-door selling of financial instruments, products and services - - d) collection and payment services (351) (341) e) other services (3,018) (4,822)
Total (3,417) (5,239)
2.2 Fee and commission expense: breakdown

Notes to the 2013 Consolidated Financial Statements
342
Section 3 Dividends and similar revenues – Item 70
Dividends
Income from
investment
fund units
Dividends
Income from
investment
fund units
A. Financial assets held for trading - - - - B. Financial assets available for sale 2,136 - 28 - C. Financial assets designated at fair value through profit and loss - - - - D. Equity investments - x - x
Total 2,136 - 28 -
Item/Amount
31.12.2013 31.12.2012
3.1 Dividends and similar revenues: breakdown
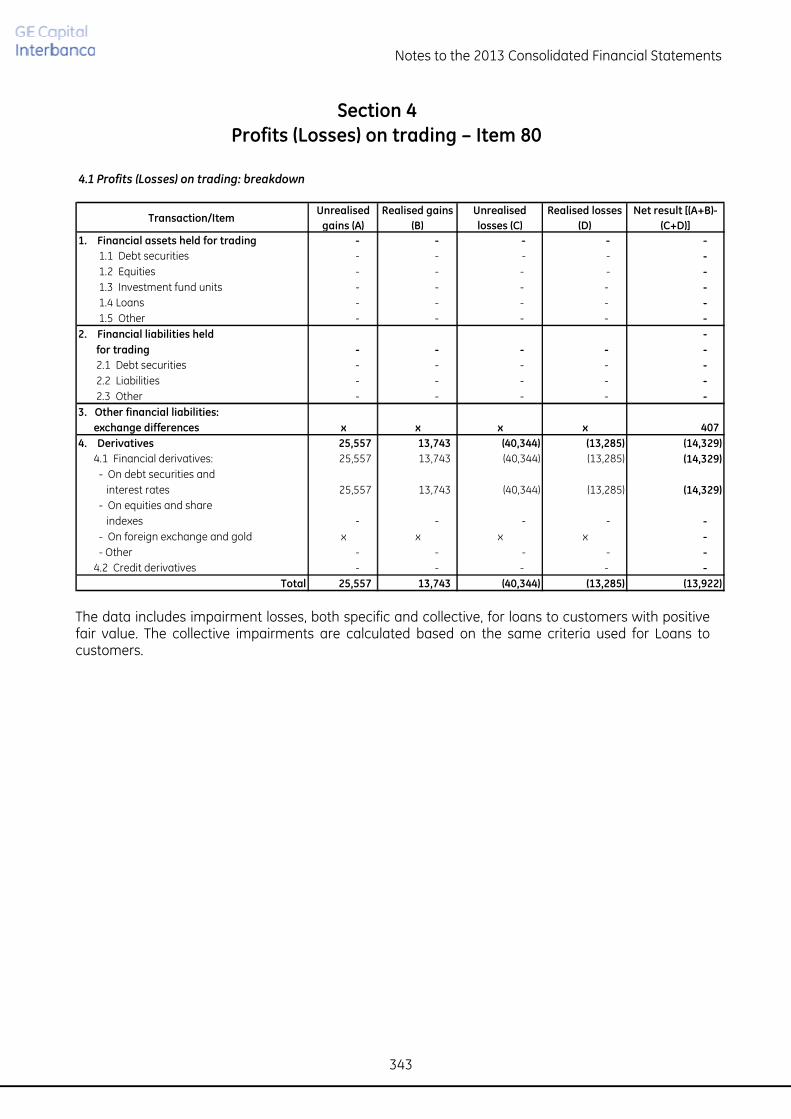
Notes to the 2013 Consolidated Financial Statements
343
Section 4 Profits (Losses) on trading – Item 80
Transaction/Item Unrealised
gains (A)
Realised gains
(B)
Unrealised
losses (C)
Realised losses
(D)
Net result [(A+B)-
(C+D)]
1. Financial assets held for trading - - - - -
1.1 Debt securities - - - - -
1.2 Equities - - - - -
1.3 Investment fund units - - - - -
1.4 Loans - - - - -
1.5 Other - - - - -
2. Financial liabilities held -
for trading - - - - -
2.1 Debt securities - - - - -
2.2 Liabilities - - - - -
2.3 Other - - - - -
3. Other financial liabilities:
exchange differences x x x x 407
4. Derivatives 25,557 13,743 (40,344) (13,285) (14,329)
4.1 Financial derivatives: 25,557 13,743 (40,344) (13,285) (14,329)
- On debt securities and
interest rates 25,557 13,743 (40,344) (13,285) (14,329)
- On equities and share
indexes - - - - -
- On foreign exchange and gold x x x x -
- Other - - - - -
4.2 Credit derivatives - - - - -
Total 25,557 13,743 (40,344) (13,285) (13,922)
4.1 Profits (Losses) on trading: breakdown
The data includes impairment losses, both specific and collective, for loans to customers with positive fair value. The collective impairments are calculated based on the same criteria used for Loans to customers.

Notes to the 2013 Consolidated Financial Statements
344
Section 5 Net result of hedge accounting – Item 90
Item/Amount 31.12.2013 31.12.2012
A. Income relating to:
A.1 Fair value hedging derivatives - 274
A.2 Financial assets hedged (fair value) - -
A.3 Financial liabilities hedged (fair value) 391 87
A.4 Derivatives designated as cash flow hedges - -
A.5 Assets and liabilities denominated in foreign currencies - -
Total income from hedging operations (A) 391 361
B. Charges relating to:
B.1 Fair value hedging derivatives (488) (95)
B.2 Financial assets hedged (fair value) - -
B.3 Financial liabilities hedged (fair value) - (273)
B.4 Derivatives designated as cash flow hedges - -
B.5 Assets and liabilities denominated in foreign currencies - -
Total charges from hedging operations (B) (488) (368)
C. Net result of hedge accounting (A - B) (97) (7)
5.1 Net result of hedge accounting: breakdown

Notes to the 2013 Consolidated Financial Statements
345
Section 6 Profits (Losses) on disposals/repurchases – Item 100
Profits LossesNet
resultProfits Losses
Net
result
Financial assets
1. Due from banks - - - - - - 2. Loans to customers - - - - - - 3. Financial assets available for sale 562 - 562 27 - 27 3.1 Debt securities 222 - 222 - - - 3.2 Equities 340 - 340 27 - 27 3.3 Investment fund units - - - - - - 3.4 Loans - - - - - - 4. Financial assets held to maturity - - - - - -
Total assets 562 - 562 27 - 27
Financial liabilities
1. Due to banks - - - - - - 2. Due to customers - - - - - - 3. Securities issued - - - - (18) (18)
Total liabilities - - - - (18) (18)
Asset/Item
31.12.2013 31.12.2012
6.1 Profits (Losses) on disposals/repurchases: breakdown
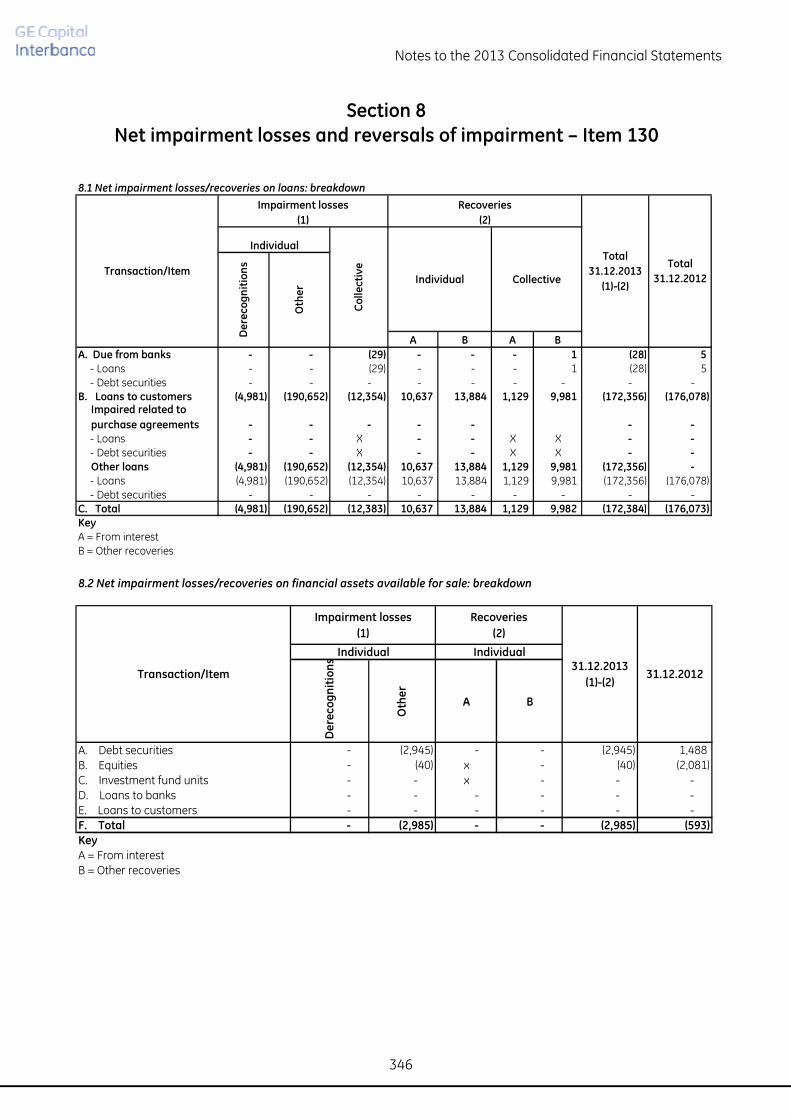
Notes to the 2013 Consolidated Financial Statements
346
Section 8 Net impairment losses and reversals of impairment – Item 130
A B A B
A. Due from banks - - (29) - - - 1 (28) 5
- Loans - - (29) - - - 1 (28) 5 - Debt securities - - - - - - - - -
B. Loans to customers (4,981) (190,652) (12,354) 10,637 13,884 1,129 9,981 (172,356) (176,078) Impaired related to
purchase agreements - - - - - - -
- Loans - - X - - X X - -
- Debt securities - - X - - X X - -
Other loans (4,981) (190,652) (12,354) 10,637 13,884 1,129 9,981 (172,356) -
- Loans (4,981) (190,652) (12,354) 10,637 13,884 1,129 9,981 (172,356) (176,078) - Debt securities - - - - - - - - -
C. Total (4,981) (190,652) (12,383) 10,637 13,884 1,129 9,982 (172,384) (176,073)
Key
A = From interestB = Other recoveries
8.1 Net impairment losses/recoveries on loans: breakdown
Transaction/Item
Impairment losses
(1)
IndividualD
ere
cog
nit
ion
s
Oth
er
Co
lle
ctiv
e
Collective
Total
31.12.2013
(1)-(2)
Total
31.12.2012Individual
Recoveries
(2)
De
rec
og
nit
ion
s
Oth
er
A B
A. Debt securities - (2,945) - - (2,945) 1,488 B. Equities - (40) x - (40) (2,081) C. Investment fund units - - x - - - D. Loans to banks - - - - - - E. Loans to customers - - - - - - F. Total - (2,985) - - (2,985) (593)
Key
A = From interestB = Other recoveries
8.2 Net impairment losses/recoveries on financial assets available for sale: breakdown
31.12.2013
(1)-(2)31.12.2012Transaction/Item
Individual Individual
Impairment losses
(1)
Recoveries
(2)
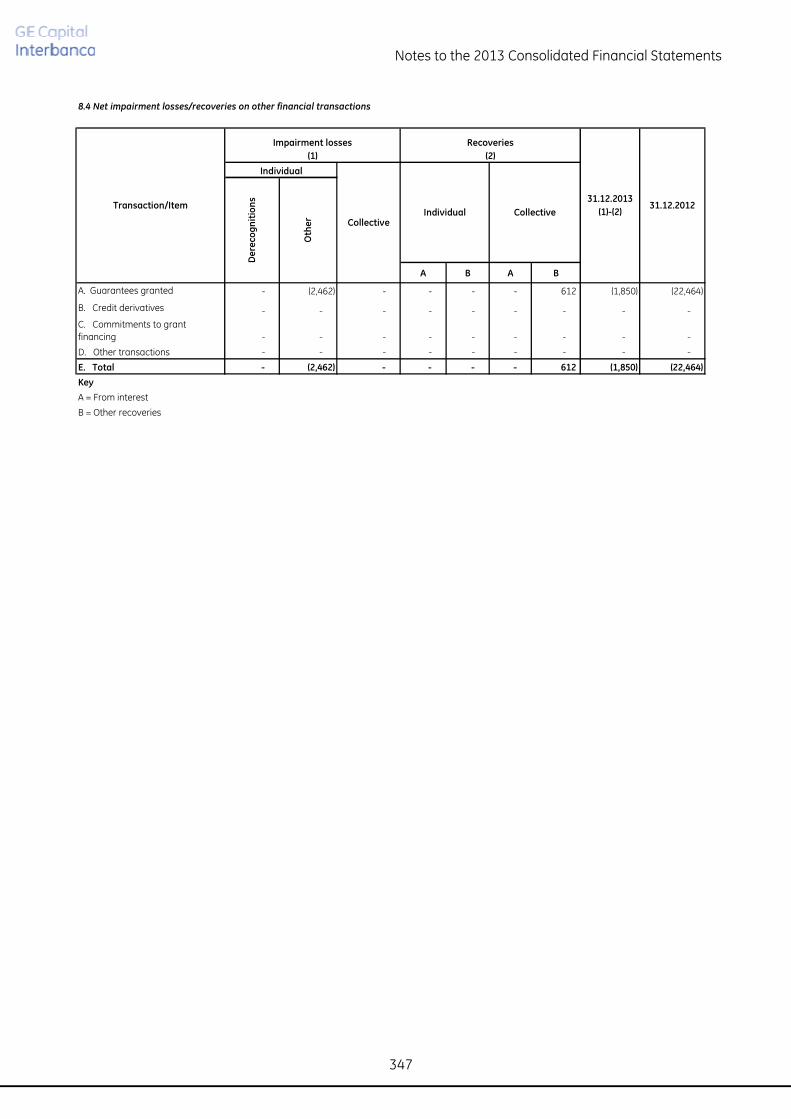
Notes to the 2013 Consolidated Financial Statements
347
A B A B
A. Guarantees granted - (2,462) - - - - 612 (1,850) (22,464)
B. Credit derivatives - - - - - - - - -
C. Commitments to grant
financing - - - - - - - - -
D. Other transactions - - - - - - - - -
E. Total - (2,462) - - - - 612 (1,850) (22,464)
Key
A = From interest
B = Other recoveries
31.12.2013
(1)-(2)31.12.2012
Individual
CollectiveIndividual Collective
De
reco
gn
itio
ns
Oth
er
8.4 Net impairment losses/recoveries on other financial transactions
Transaction/Item
Impairment losses
(1)
Recoveries
(2)

Notes to the 2013 Consolidated Financial Statements
348
Section 11 Administrative expenses – Item 180
11.1 Personnel expenses: breakdown
Expense type/Amount 31.12.2013 31.12.2012
1) Personnel expenses (57,601) (51,714) a) salaries and wages (34,757) (32,942) b) social security contributions (9,967) (9,108) c) provision for post-retirement benefits - (63) d) insurance contributions (38) (86) e) provisions to staff severance indemnity fund (2,443) (2,402) f) provisions to the pension fund and similar obligations: - - - defined contribution - - - defined benefit - - g) contributions to supplemental external pension funds: (543) (621) - defined contribution (543) (621) - defined benefit - - h) costs related to share-based payments - - i) other employee benefits (9,853) (6,492) 2) Other personnel - 2 3) Directors and Statutory Auditors (687) (677) 4) Early retirement costs - - 5) Recovery of expenses for Bank employees seconded to other companies 1,190 1,127
6) Reimbursement of expenses for employees of other entities seconded to the Bank (2,052) (3,013) Total (59,150) (54,275)
11.2 Average number of personnel by category
31.12.2013 31.12.2012
Employees 606 577
a) Senior managers 58 68
b) Managers 243 246
c) Other personnel 305 263
Other personnel 18 11
Total 624 589

Notes to the 2013 Consolidated Financial Statements
349
Expense type/Amount 31.12.2013 31.12.2012Leaving incentives ("una - tantum") (6,302) (3,792) Social contributions (1,269) (1,194) Training and follow-up courses (77) (444) Stock options (384) (163) Other (1,821) (899)
Total (9,853) (6,492)
11.4 Other benefits in favour of employees
11.5 Other administrative expenses: breakdown
31.12.2013 31.12.2012
Costs for services from Group companies (18,101) (22,516) External consulting and professional services (10,068) (10,978) Leasing of equipment and software (4,660) (5,152) Outsourcing (4,291) (3,256) Rental and office expenses (3,132) (1,797) Postage and telephone expenses (1,645) (1,172) Information expenses (1,422) (1,076) Maintenance expenses (978) (1,123) Advertising and other promotional expenses (823) (526) Other costs (1,603) (1,752)
(46,723) (49,348)
Indirect taxes and duties: - stamp duty (724) (780) - substitute tax (DPR 601/73) (710) (639) - municipal property tax (383) (382) - other (426) (423)
(2,243) (2,224)
Total (48,966) (51,572)

Notes to the 2013 Consolidated Financial Statements
350
Section 12 Net provisions for risks and charges – Item 190
31.12.2013 31.12.2012
Provision for corporate and tax litigation (7,564) (6,569)
Reversals of the year 5,375 607 Total (2,189) (5,962)
12.1 Net provision for risks and charges: breakdown

Notes to the 2013 Consolidated Financial Statements
351
Section 13 Net adjustments to/recoveries on tangible assets – Item 200
Asset/ItemAmortisation
(a)
Impairment
losses (b)
Recoveries
(c)
Net result (a+b-
c)
A. Tangible assets
A.1 Owned (37,080) - - (37,080)
- for use (37,080) - - (37,080)
- for investment - - - -
A.2 Leased - - - -
- for use - - - -
- for investment - - - -
Total (37,080) - - (37,080)
13.1 Net adjustments to tangible assets: breakdown

Notes to the 2013 Consolidated Financial Statements
352
Section 14 Net adjustments to/recoveries on intangible assets – Item 210
Asset/ItemAmortisation
(a)
Impairment
losses (b)Recoveries (c)
Net result
(a+b-c)A. Intangible assets A.1 Owned (1,036) - - (1,036) - Internally generated - - - - Other (1,036) - - (1,036) A.2 Leased - - - -
Total (1,036) - - (1,036)
14.1 Net adjustments to intangible assets: breakdown

Notes to the 2013 Consolidated Financial Statements
353
Section 15 Other operating expense/income – Item 220
31.12.2013 31.12.2012
Other rental operating expenses (46,763) - Other leasing operating expenses (10,659) (8,137) Other expenses for leasing credit recovery (4,296) (6,364) Expenses for settlement of tax claim (2,870) Other charges (3,401) (1,339)
Total (67,989) (15,840)
15.1 Other operating expense: breakdown
31.12.2013 31.12.2012
Revenue from recovery of rental assets 99,332 - Recovery of loan expenses and charges 14,065 11,103 Revenue from recovery of leased assets 6,842 7,272 Revenue from loan recovery 2,975 3,777 Revenues for services provided to subsidiaries 56 1,606 Other income 3,091 1,808
Total 126,361 25,566
15.2 Other operating income: breakdown
The expenses and income from rental activities refer to GE Capital Services S.r.l., consolidated in the income statement from 2013.
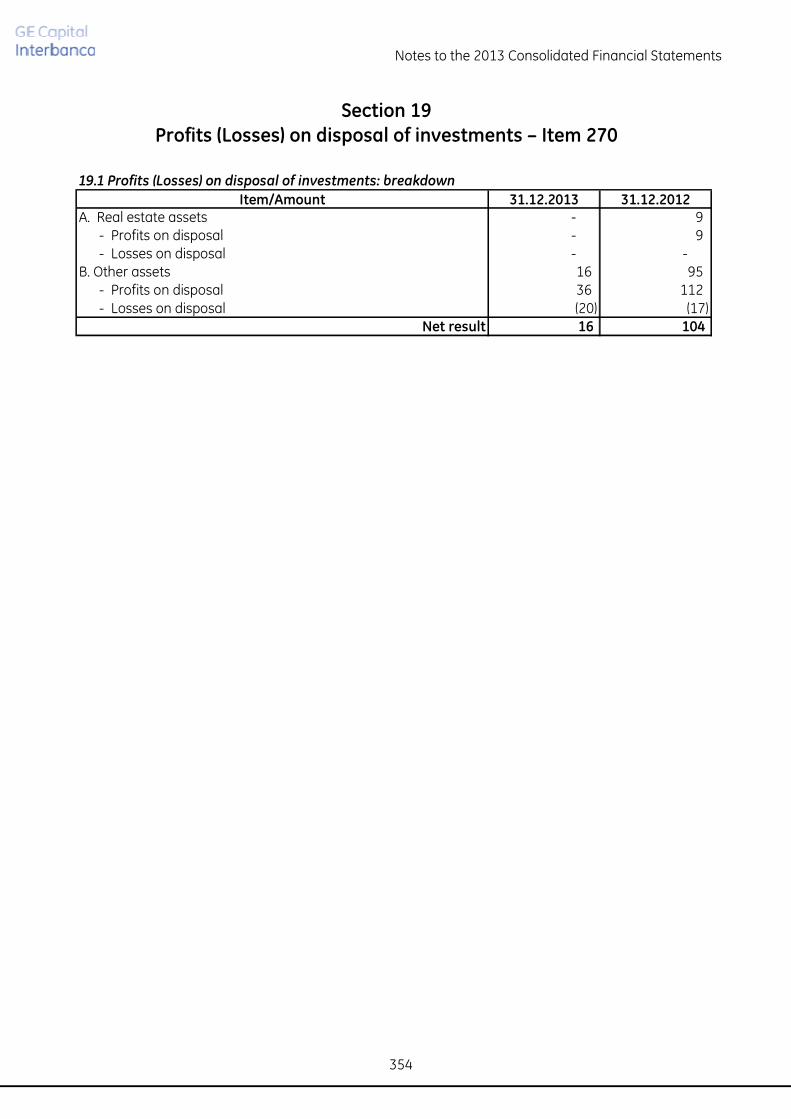
Notes to the 2013 Consolidated Financial Statements
354
Section 19 Profits (Losses) on disposal of investments – Item 270
Item/Amount 31.12.2013 31.12.2012A. Real estate assets - 9 - Profits on disposal - 9 - Losses on disposal - - B. Other assets 16 95 - Profits on disposal 36 112 - Losses on disposal (20) (17)
Net result 16 104
19.1 Profits (Losses) on disposal of investments: breakdown

Notes to the 2013 Consolidated Financial Statements
355
Section 20 Taxes on income from continuing operations – Item 290
Item/Amount 31.12.2013 31.12.2012
1. Current taxes (-) (2,621) (2,244) 2. Adjustments in current tax expense for prior years (+/-) 3,322 - 3. Reduction in tax rates (+) - -
3.bis Reduction in tax rates for tax credits as per Law no. 214/2011 (+) - 32 4. Changes in deferred tax assets (+/-) 56,265 48,808 5. Changes in deferred tax liabilities (+/-) 10 1 6. Income tax for the year (-) (-1+/-2+3+/-4+/-5) 56,976 46,597
20.1 Taxes on income from continuing operations: breakdown
As a result of regulations on deferred tax assets and in consideration of contractual agreements
resulting from the Parent Company’s participation in the National Tax Consolidation Scheme,
regulated companies recognised deferred tax assets, for both IRES and IRAP purposes, exclusively
for impairments and write-downs on loans deductible over 5 years at a constant rate, as
established in the 2013 Stability Law converted into Law no. 228/2013.
20.2 Reconciliation between theoretical tax expense and the effective tax expense recognised in the financial statements
The reconciliation is not provided as the financial statements show a tax loss and this information
at a consolidated level would not add any useful elements for a better understanding of the Group’s
tax burden. The effect on the tax item is essentially accounted for by changes in regulations
previously outlined regarding recognition of deferred tax assets.
In application of the National Tax Consolidation Scheme, the Parent Company offset, without
reimbursement, part of its 2013 estimated tax loss with the 2013 estimated tax profit of the
subsidiaries GE Capital Servizi Finanziari S.p.A. and GE Capital Services S.r.l. for a total of € 26.8
million.

Notes to the 2013 Consolidated Financial Statements
356
(empty page)
Notes to the 2013 Consolidated Financial Statements
357
Part D
CONSOLIDATED STATEMENT OF
COMPREHENSIVE INCOME

Notes to the 2013 Consolidated Financial Statements
358
Items Gross amount Income tax Net amount
10. Net profit (loss) for the year (175,953) 56,976 (118,977)
Other comprehensive income not reclassified to profit or loss: (125) 34 (91)
20. Property, plant and equipment - - -
30. Intangible assets - - -
40. Defined benefit plans (125) 34 (91)
50. Non-current assets classified as held for sale - - -
60. Portion of revaluation reserves from investments valued at equity- - -
Other comprehensive income after tax that may be reclassified to profit or loss:3,439 969 4,408
70. Hedges of foreign investments: - - -
a) fair value changes - - -
b) reclassification to profit or loss - - -
c) other changes - - -
80. Exchange differences: - - -
a) changes in value - - -
b) reclassification to profit or loss - - -
c) other changes - - -
90. Cash flow hedges: 60 (20) 40
a) fair value changes 60 (20) 40
b) reclassification to profit or loss - - -
c) other changes - - -
100. Available-for-sale financial assets: 3,379 989 4,368
a) fair value changes 3,379 989 4,368
b) reclassification to profit or loss - - -
- impairment losses - - -
- gains/losses on disposals - - -
c) other changes - - -
110. Non-current assets classified as held for sale: - - -
a) fair value changes - - -
b) reclassification to profit or loss - - -
c) other changes - - -
120. Portion of revaluation reserves from investments valued at equity:- - -
a) fair value changes - - -
b) reclassification to profit or loss - - -
- impairment losses - - -
- gains/losses on disposals - - -
c) other changes - - -
130. Total of other comprehensive income 3,314 1,003 4,318
140. Comprehensive income (Item 10+130) (172,639) 57,979 (114,659)
Analytical Statement of Comprehensive Income

NOTES TO THE 2013 CONSOLIDATED FINANCIAL STATEMENTS
359
Part E
INFORMATION ON RISKS AND RISK MANAGEMENT POLICIES

NOTES TO THE 2013 CONSOLIDATED FINANCIAL STATEMENTS
360
INTRODUCTION
The corporate governance bodies assume an essential role in risk management and control,
ensuring that the risks to which the Parent Company is exposed have been identified in terms of
sources, possible trends and necessary oversight. Specifically, these bodies formalise the reference
framework for determining risk propensity, risk management policies, and the risk management
process, ensure they are applied and periodically review them to ensure they are effective over time.
The Parent Company’s Board of Directors has the exclusive responsibility, which cannot be
delegated, for the strategic supervision and management of the Group, which it exercises through
the Chief Executive Officer. The Board of Directors sets the general management guidelines and the
strategic business objectives for the Parent Company and the Banking Group, and develops the
business and financial plans, ensuring their implementation. In particular, the Board of Directors
defines and approves: (i) the Group’s business model, (ii) the Group’s strategic objectives, (iii) the risk
objectives, the tolerance threshold and the risk governance policies and (iv) guidelines for the internal
control system.
The Parent Company’s Board of Statutory Auditors, who ensure adequate control, are responsible for
overseeing the accuracy, adequacy, functionality and reliability of the internal control system and the
reference framework for determining risk propensity.
The Chief Executive Officer (who also performs the role of General Manager), and senior
management with powers delegated by the Parent Company, are responsible for strategic
objectives, the reference framework for determining risk propensity and the risk governance policies
defined by the strategic supervision body.
Additionally, specific internal committees were set up in the Parent Company that are primarily
focused on integrated risk control and validating that established objectives are met.
Specifically, the following committees are involved in risk management and control:
• Management Committee, which is primarily responsible for implementing the strategic initiatives
of the Board of Directors, assisting in the definition of management strategies, and evaluating
the risk/return profile and variances from the objectives;
• Investments Committee, which functions as a consulting and decision-making body in the areas
of credit risk assumption and management and equity investments;
• Risk Committee, responsible for monitoring overall risks as well as proposing and defining
related management policies and processes, and compliance with operational limits for risk
assumption; On 19 December 2013, the Parent Company’s Board of Directors resolved to approve the
establishment of the Compensation Committee, setting the number of members at 3.
The Committee was assigned the task of making proposals, consulting, and monitoring issues related
to compensation and internal policies
The performance of the respective control activities is ensured by the Parent Company’s control
functions. Additionally, specific control duties were delegated to the Supervisory Board, established
pursuant to Legislative Decree no. 231/2001, and to the Executive charged with preparing the
company’s financial reports.
NOTES TO THE 2013 CONSOLIDATED FINANCIAL STATEMENTS
361
PUBLIC DISCLOSURE
On its internet site (www.gecapitalinterbanca.it), the Parent Company publishes both the 2013
Financial Statements as well as "public disclosure" (3rd pillar of Basel II - Bank of Italy Circular no.
285), in which it provides information regarding capital adequacy, risk exposure and the general
characteristics of systems for identifying, measuring and managing risk.
NOTES TO THE 2013 CONSOLIDATED FINANCIAL STATEMENTS
362
Section 1 – Banking Group risks
Credit Risk
Qualitative disclosure
1.General characteristics
2013 was characterised by the continued consolidation of the Banking Group’s functional and
production structures as well as the standardisation of operating activities related to risk assumption,
specifically as related to prudential management and management of the current portfolio.
Specifically, the commitment was focused on stricter valuation parameters in the assumption of new
risk through initiatives aimed at achieving higher quality standards in the new portfolio, in light of
adverse conditions in the market, and re-launching the business through investments that
strengthen the commercial structure as well as the monitoring and control functions.
The role of Relationship Banker was further enhanced, as the single point of reference for the
customer.
The product range was expanded in order to meet market needs and commercial agreements were
put in place with financial counterparties to increase the distribution channels for Banking Group
products.
The activities and actions taken in terms of both organisation and process as part of risk
management and monitoring, as well as new specific tools for integrated measurement of credit and
financial risks to ensure more effective risk control, were important developments during the year.
2. Credit risk management policies
2.1 Organisational aspects
In general, the lending process as a whole follows the standard organisational criterion consisting of
the operating phases, roles and responsibilities described below, with certain specific characteristics
depending on different products/portfolios:
Credit approval:
o The Commercial unit identifies the possibility of new transactions in compliance with the
strike zone approved by the Board of Directors based on its defined risk appetite;
o The Underwriting unit analyses the requests for new loans from Commercial units and
develops a loan proposal to be submitted to the competent deliberating body, ensuring the
application of the Banking Group’s credit and risk management policies, expressing an
NOTES TO THE 2013 CONSOLIDATED FINANCIAL STATEMENTS
363
overall opinion based on the analyses performed of the proposed loan structure and any
guarantees provided; in this phase, a specific rating is assigned to each customer.
The controls envisaged by legislative and regulatory requirements related to “Related
Parties” and “banking representatives” are performed in the underwriting phase;
o The deliberating bodies make their decision on the requested loan based on their
respective authorisation level. A resolution by the Board of Directors is required for
credit approval to related/associated parties, with an opinion from the Independent
Director of the Banking Group when required.
The Loan execution process includes notifying the customer regarding the approval of the loan and
its characteristics, followed by the stipulation of the contract, activities related to acquiring any
guarantees and the disbursement of the approved loan. In these activities, the Risk Underwriting unit
is supported by the Legal and Operations departments, who are responsible for preparing the
approved contracts, as well as controlling for the proper fulfilment of all activities leading up to loan
disbursement.
Loan management is performed by the Risk – Portfolio Management unit for performing customers,
and principally includes activities related to:
o Reviewing, through periodic controls of credit positions to verify trends, any
variations from the valuations made in the underwriting phase or from the latest
revision of the position, with continual reference to timeliness of repayments, status
of the relationship, trends reported by the Italian Central Credit Register, and
updates to the reputational profile. During the periodic valuation of positions,
contractual covenant compliance is also reviewed and, on the basis of the analysis,
the customer’s rating or risk class may be changed. These activities are aimed at
anticipating problematic cases and providing adequate reporting to the competent
decision-taking bodies.
If a credit position shows objective signs of repayment problems, it is transferred to the Risk
- Workout & Credit Recovery unit, specialised in managing impaired transactions;
o Creation and management of a watchlist of customer names that, while still
considered performing, have given indications that warrant more stringent
monitoring;
o Periodic updating of the value of mortgage guarantees using assessments from
independent third parties;
o Valuation and preparation of change proposals (guarantee restrictions, new payment
schedules, assumptions, etc.) with respect to the original loan characteristics.
These proposals are then reviewed by the competent decision-taking body.
NOTES TO THE 2013 CONSOLIDATED FINANCIAL STATEMENTS
364
Monitoring and management of impaired loans is carried out by the Risk — Workout and Credit
Recovery team to optimise loan recovery.
The main activities involve:
o Management of impaired loans, carried out by:
− taking all initiatives deemed necessary for loan recovery, in collaboration with the
Bank’s Legal department and making use of external attorneys if necessary, with the
aim of returning the customer to performing status;
− adopting all extra-judicial actions necessary for loan recovery, including disposal and
restructuring transactions on said loans.
These activities are performed through the careful monitoring of customer performance, historical
trends in delinquent payments, issues reported to the Italian Central Credit Register, and the
updating of the reputational profile.
On basis of issues that arose during monitoring, the possibility of assigning a different regulatory risk
classification, consistent with the borrower's situation, is reviewed.
Impairment tests are carried out using the Discounted Cash Flow Method, for customers with issues
but who are still operational, or with the Liquidation Value Method, when the value of the guarantee
is a certain source for recovering the position. In this phase, recovery times are estimated and any
provision proposals are prepared.
Additionally, the value of the mortgage guarantee is periodically updated, using assessments
provided by independent third parties and adjusted where necessary to consider any losses that
would result from the disposal process.
The bodies and key functions of the Parent Company that preside over the lending process of the
Bank and the Group are listed below, with a brief description of their specific responsibilities.
• Board of Directors:
o Oversees the establishment of the Group’s strategic objectives, guiding proposals
formulated by other Group companies regarding lending policies;
o Defines criteria for recognising, assessing and managing risk;
o Approves authorisation levels and signatory powers attributed to bodies and functions of
the Parent Company with respect to approving and modifying loans;
o Sets its risk appetite through the delegation system, indicating excluded sectors and
approving a strike zone that identifies the characteristics of target products;
o Grants the Chief Risk Officer of the Parent Company the responsibility of ensuring the
consistency of the system of powers delegated to Group companies, as part of its
prerogatives of management and control, in accordance with the various attributes of
the products disbursed and the customer type.

NOTES TO THE 2013 CONSOLIDATED FINANCIAL STATEMENTS
365
• Senior Management:
o Implements the strategies and policies established by the Board of Directors;
o Develops the rules, procedures and organisational structures to ensure the
adoption and maintenance of an efficient lending process and the related risk
control framework;
o Takes decisions based on its independence, including through the appropriate
technical Committees;
o Guides and coordinates management activities of Group companies.
• Risk Committee of the Parent Company, with the following key responsibilities:
o Propose and define risk management policies, rating models, financial capital and,
more generally, capital adequacy;
o Ensure a single and global approach to risk governance, by applying the policies,
processes and controls approved by the Board of Directors, in order to contain, to
the extent possible, the risk of unexpected losses or damage to the Group's
image;
o Ensure compliance with envisaged limits and delegations by risk type for the Bank
and the Group, taking the necessary initiatives regarding the approach to risk
where necessary, specifically for credit risks in reference to the loan portfolio,
derivative products and equity investments, evaluating the triggers and proposals
for taking appropriate actions for risk mitigation;
o Monitor information flows on Banking Group risk performance, including
regulatory limits on credit risk concentration, evaluating actions deemed useful to
ensure capital adequacy for the Bank and the Banking Group.
• The Commercial Area is responsible for coordinating, monitoring and evaluating the commercial
and distribution activities of the Bank and Group. In this context, the commercial structure
manages the relationship with the customer in the loan process, and, through the Relationship
Banker, assumes the role of interfacing with specialised Group structures.
In general, the commercial structure activities are supported by the:
o Direct network, consisting of the branches and specialised teams of the Parent
Company dedicated to the Commercial Banking and Corporate Finance products;
o Indirect network for the development of the subsidiaries’ commercial activities.
The Commercial Area ensures that the commercial, profitability, risk and service level objectives
are met that the Bank established in its strike zone. This area also develops, through the Group’s
organisational units, commercial initiatives of various products and services for customers,
directly or through partnership agreements.
NOTES TO THE 2013 CONSOLIDATED FINANCIAL STATEMENTS
366
• Risk Area:
o Promotes the risk policies and develops the procedures and updated delegation
system, for the Board of Directors’ approval;
o Ensures the appropriate supervision of risk (acceptance, measurement, control
and reporting) as well as compliance with regulatory provisions;
o Manages credit litigation with the support of the Legal & Regulatory department.

NOTES TO THE 2013 CONSOLIDATED FINANCIAL STATEMENTS
367
2.2 Systems for management, measurement and monitoring
Activities related to approval, management, measurement and control of the loan portfolio depend
on the type of product/customer brokered.
The principles of prudence that guide loan approval policies are represented in the risk appetite
established by the Board of Directors regarding the general criteria and limits for credit risk
assumption.
Generally, the aforementioned criteria define:
o Standard characteristics of “commercialisable” products, included in approved lists by
the Board of Directors;
o Maximum permitted durations for loans;
o Geographic restrictions by country or region;
o Restrictions on industrial sectors that may be financed, for both profitability (risk-return)
reasons as well as ethical-reputational;
o Loan approval methodologies and allowable delegations in the various process stages;
o Standing of the potential target customer, the reputational profile of the loan applicant
and the identification of the effective borrower;
o Specific decision-taking procedures in the event the potential target customer or the
legal/economic Group to which the customer belongs are included in the cases provided
by IAS 24, business representatives (art.136 Consolidated Banking Act), or related parties
(prudential supervision provisions – Circular no. 263, Heading V, Section V);
o Exposure of the loan applicant and the legal/financial Group to which the applicant
belongs:
- within GE Capital Group, in order to define the application of delegation of
powers;
- within the GE Capital Interbanca Banking Group, to monitor concentration limits;
o Creditworthiness of each transaction based on the expected recovery capacity of the
customer;
o General characteristic of the transaction, in particular reference to reviews conducted to
prohibit the financing of transactions that involve risks for the environment, or public
health and safety risks, or the reputation of the Banking Group, or money-laundering and,
more generally, financing terrorism or criminal activities;
o Financing approval methodologies developed for new products or industrial, market and
guarantee sectors;
o Classification methods of watchlist positions;
o Definitions used to classify and monitor problem positions;
o Rating level assigned to the customer, together with the related Probability of Default (PD)
and Loss Given Default (LGD) risk factors;

NOTES TO THE 2013 CONSOLIDATED FINANCIAL STATEMENTS
368
o Criteria for carrying out the impairment test and quantification of any allowances made
to credit risk provisions.
Internal controls
With regard to portfolio control activities, loans to customers are monitored by the Risk - Portfolio
Management & Workout area, which is responsible for continual and pro-active verification of
customers’ positions based on:
o Periodically reviewing credit positions in order to review performance;
o Assigning any changes to ratings and reputational profiles based on issues that
emerge after the contract stipulation;
o Reviewing covenants;
o Identifying and monitoring risk factors that may impact the ability of the customer to
repay the loan;
o Periodic monitoring of outstanding instalments in order to anticipate any issues that
may arise in terms of the customer’s solvency;
o Monitoring exposures with individual customers and their legal/financial groups with
respect to regulatory or internal individual/consolidated limits for risk concentration;
loans are monitored monthly in order to identify anomalous trends and anticipate
their negative effects.
The Parent Company requires each credit exposure of each customer to be classified in terms of its
risk, according to shared metrics that comply with regulatory risk classifications.
The risk classification is initially assigned during the approval phase of a new deal and is
subsequently updated on a continual basis as part of portfolio monitoring and management
activities.
The classification is assigned in respect of the regulatory risk classification standards, establishing for
each investment:
o The risk classification envisaged by Bank of Italy;
o The quality of any guarantees provided by the customer.
An internal rating is also assigned for all credit risk exposures.
The ratings assigned to each customer are part of the credit evaluation process in the stages of
approval, revision, management and monitoring of the portfolio, and are used to estimate expected
losses, as part of the capital allocation process, in stress tests, in various risk analyses and in
producing internal and external reports.
The Parent Company uses its own rating system (which is not, however, used to calculate the capital
needed to offset credit risks), consisting of seven levels. This system is based on qualitative criteria
and provides useful indications for the classification of structured finance transactions (project
finance, acquisition finance and real estate financing), and includes quantitative criteria that allow for
better management of the rating attribution process.

NOTES TO THE 2013 CONSOLIDATED FINANCIAL STATEMENTS
369
Ratings are assigned to the Parent Company’s performing customers upon each decision taken with
regard to the application (decision to grant a new loan, waiver or contractual amendment decision,
etc.). Periodically, assigned ratings are reviewed based on the latest financial statements, reports
made to the Italian Central Credit Register, or any other factor that may influence the
creditworthiness of the counterparty. Customers assigned a rating of “7 - Sufficient” are included in
the watchlist, which includes exposures to customers for which management has requested a higher
level of attention.
Along with the internal ratings described above, product ratings are also used by applying GE Group
methodologies, differentiated by product/borrower type. The primary model for Corporate customers
is Moody’s RiskCalc model, along with other models for smaller companies/customers or for specific
products.
The “letter” rating thus obtained, or a letter that reflects the attribution scale of the respective
international rating agencies, is then converted into the Obligor Rating (OR) value scale used
operationally within General Electric Group.
The Parent Company’s Enterprise Risk Management (ERM) department is completing an internal
project to develop a rating system for Italian Corporate customers based on insolvency risk
valuations provided by Cerved Group, which was granted ECAI recognition by Bank of Italy in
February 2010 in accordance with the prudential supervision provisions for banks, Circular no.
263/2006. In carrying out this project, the periodic reporting produced for the Board of Directors, the
Risk Committee and the Chief Risk Officer is particularly significant.
More specifically, information is produced on all outstanding transactions that analyse, for each
product/customer type:
o Trends in the key loan positions and/or portfolios;
o The loan portfolio positioning, providing various views of the breakdown of the entire
portfolio by type of business segment;
o Trends in performing and non-performing loans;
o Details on non-performing positions;
o Waivers on loan instalments or specific charge-offs made;
o Overall trend in provisions and forecasted valuation of the expected portfolio
performance, specifically with regard to expected losses.

NOTES TO THE 2013 CONSOLIDATED FINANCIAL STATEMENTS
370
2.3 Techniques for mitigating credit risk
In order to align credit risks with lending policies, the Parent Company seeks to support credit lines
with appropriate guarantees and other risk mitigation measures.
Generally, based on the specific product characteristics, the Parent Company obtains collateral
commensurate with the standing of the borrower and the type/duration of the credit exposure,
which includes mortgage guarantees, liens of plants and machinery, pledges, surety bonds, credit
insurance and collateral.
The Parent Company updates the value of mortgage guarantees using appraisals conducted by
independent third parties on an annual basis for significant transactions.
2.4 Non-performing financial assets
The Risk - Portfolio Management & Workout area ensures the timely updating of loans classified as
impaired in the various risk categories established by regulatory instructions and recorded in
financial statements as impaired loans.
Impaired loans are identified based on the impairment policy guidelines, in general due to significant
unfavourable events, such as considerable deterioration in company performance, restructuring of
contractual terms, or prolonged observation status.
After one or more of the aforementioned signs of deterioration have been verified, the amount of any
loan write-down is determined, using valuation techniques differentiated by type and condition of
the position under consideration. If the test does not confirm the existence of impairment, a
percentage of the write-down is applied to the position based on estimated lump-sum parameters.
The summary of proposed provisions is periodically reviewed by the Investments Committee, as are
the individual proposals that require, for subsequent approval, delegation levels assigned to the CRO,
to two Parent Company Directors or to the Board of Directors.
At regular intervals, the Parent Company’s Chief Risk Officer and Chief Financial Officer coordinate
the process to review the adequacy of provisions made, in order to ensure consistency with the
overall risk profile of the impaired portfolio.
Management activities for the impaired portfolio are distinguished based on the significance of the
position under consideration, through undertaking all activities to bring it back to performing status,
any restructuring of the positions, as well as necessary judicial and extra-judicial actions to recover
the non-performing positions.

NOTES TO THE 2013 CONSOLIDATED FINANCIAL STATEMENTS
371
Qualitative disclosure
A. Credit quality
A.1 Impaired and performing financial assets: amounts, impairments, changes,
distribution by business activity/region
No
n-
pe
rfo
rmin
g
Su
b-s
tan
da
rd
Re
stru
ctu
red
Imp
air
ed
Pa
st
du
e
No
t Im
pa
ire
d
Pa
st d
ue
Oth
er
ass
ets
Imp
air
ed
Oth
er
1. Financial assets held for trading 3 5,719 - - 230 44,058 - 50,010
2. Financial assets available for sale - - - - - 45,404 - - 45,404
3. Financial assets held to maturity - - - - - - - -
4. Due from banks - - - - 774 226,090 - 9,975 236,839
5. Loans to customers 148,096 331,426 58,085 87,226 1,267,486 1,444,369 17,922 303,698 3,658,308
6. Financial assets designated at fair value through profit and loss - - - - - - - -
7. Financial assets under disposal - - - - - - - -
8. Hedging derivatives - - - - - 494 - 494
Total 31.12.2013 148,099 337,145 58,085 87,226 1,268,490 1,760,415 17,922 313,673 3,991,055
Total 31.12.2012 164,494 291,095 50,171 118,170 449,804 3,139,171 8,592 322,811 4,544,308
Portfolio/Quality
Banking Group Other companies
Total
A.1.1 Breakdown of financial assets by portfolio classification and credit quality (book value)
Gro
ss e
xpo
sure
Ind
ivid
ua
l
ad
just
me
nts
Ne
t e
xpo
sure
Gro
ss e
xpo
sure
Co
lle
ctiv
e
ad
just
me
nts
Ne
t e
xpo
sure
A. Banking Group
1. Financial assets held for trading 11,656 5,934 5,722 x x 44,288 50,010
2. Financial assets available for sale 15,243 15,243 - 45,404 - 45,404 45,404
3. Financial assets held to maturity - - - - - - -
4. Due from banks - - - 226,867 3 226,864 226,864
5. Loans to customers 1,421,333 796,500 624,833 2,788,935 77,080 2,711,855 3,336,688
6. Financial assets designated at fair value through profit and loss - - - x x - -
7. Financial assets under disposal - - - - - - -
8. Hedging derivatives - - - x x 494 494
Total A 1,448,232 817,677 630,555 3,061,206 77,083 3,028,905 3,659,460
B. Other companies included in the consolidation
1. Financial assets held for trading - - - x x - -
2. Financial assets available for sale - - - - - - -
3. Financial assets held to maturity - - - - - - -
4. Due from banks - - - 10,210 235.00 9,975 9,975
5. Loans to customers 81,605 63,683 17,922 315,283 11,585 303,698 321,620
6. Financial assets designated at fair value through profit and loss - - - x x - -
7. Financial assets under disposal - - - - - - -
8. Hedging derivatives - - - x x - -
Total B 81,605 63,683 17,922 325,493 11,820 313,673 331,595
Total 31.12.2013 1,529,837 881,360 648,477 3,386,699 88,903 3,342,578 3,991,055
Total 31.12.2012 1,416,468 783,946 632,522 3,930,216 87,077 3,911,786 4,544,308
A.1.2 Breakdown of financial assets by portfolio classification and credit quality (gross and net values)
To
tal (
ne
t e
xpo
sure
)
Portfolio/Quality
Impaired assets Performing

NOTES TO THE 2013 CONSOLIDATED FINANCIAL STATEMENTS
372
Type of exposure/AmountGross
exposure
Individual
impairment
Collective
impairmentNet exposure
% on Net
exposure
% of
coverage
A. On-Balance Sheet exposures
a) Non-performing loans - - x - - - b) Sub-standard loans - - x - - - c) Restructured exposures - - x - - - d) Past due exposures - - x - - - e) Other assets 226,867 x 3 226,864 100 -
Total A 226,867 - 3 226,864 100 -
B. Off-Balance Sheet exposures a) Non-performing - - x - - - b) Other 12,590 x - 12,590 100 -
Total B 12,590 - - 12,590 100 -
Total (A+B) 239,457 - 3 239,454 -
A.1.3 Banking Group - On- and off-balance sheet exposures to banks: gross and net values
Type of exposure/Amount Gross exposureIndividual
impairment
Collective
impairmentNet exposure
A. ON-BALANCE SHEET EXPOSURES a) Non-performing loans 625,474 477,378 x 148,096
b) Sub-standard loans 596,012 264,586 x 331,426
c) Restructured exposures 109,018 50,933 x 58,085
d) Past due exposures 106,071 18,845 x 87,226
b) Other assets 2,834,339 x 77,080 2,757,259
TOTAL A 4,270,914 811,742 77,080 3,382,092
B. OFF-BALANCE SHEET EXPOSURES
a) Non-performing 104,470 21,697 x 82,773
b) Other 316,930 x 2,272 314,658
TOTAL B 421,400 21,697 2,272 397,431
TOTAL A + B 4,692,314 833,439 79,352 3,779,523
A.1.6 Banking Group - On- and off-balance sheet exposures to customers: gross and net values

NOTES TO THE 2013 CONSOLIDATED FINANCIAL STATEMENTS
373
Causes/Categories Non-performing Sub-standard Restructured Past due
A. Gross opening exposures 625,063 514,025 69,137 121,664 -of which: exposures sold not derecognised - - -
B. Increases 88,486 274,472 97,477 65,522 B.1 inflows from performing exposures 5,790 203,377 5,955 62,434 B.2 transfers from other categories of impaired exposures 76,067 63,370 60,890 1,847 B.3 other increases 6,629 7,725 30,632 1,241 of which for changes in the scope of consolidation - - - - C. Decreases 88,075 192,485 57,596 81,115 C.1 outflows to performing exposures 31 1,243 20,587 C.2 derecognitions 68,911 9,734 29,324 374 C.3 collections 17,653 44,038 6,876 6,076 C.4 losses on disposal - - C.5 transfers to other categories of impaired exposures 320 134,996 21,396 52,306 C.6 other decreases 1,160 2,474 - 1,772
D. Gross closing exposure 625,474 596,012 109,018 106,071
-of which: exposures sold not derecognised - - - -
A.1.7 Banking Group - On-balance sheet credit exposures to customers: changes in gross impaired
exposures
Causes/CategoriesNon-
performing
Sub-
standardRestructured Past due
A. Total adjustments: opening balance 460,569 226,923 19,270 16,513
-of which: exposures sold not derecognised - - - -
B. Increases 99,374 128,989 67,988 9,799
B.1 impairment losses 54,858 116,200 848 9,116
B.2 transfers from other categories
of impaired exposures 42,702 6,258 34,124 109
B.3 other increases 1,814 6,531 33,016 574
of which for changes in the scope of consolidation
C. Decreases 82,565 91,326 36,325 7,467
C.1 reversals of impairment losses 9,985 3,406 484 640
C.2 recoveries on repayments 4,004 3,333 2,250 318
C.2 Bis gain on disposal - - - -
C.3 derecognitions 67,977 8,960 29,324 718
C.4 transfers to other categories
of impaired exposures 513 75,238 4,267 3,176
C.5 other decreases 86 389 - 2,615
D. Total adjustments 477,378 264,586 50,933 18,845
-of which: exposures sold not derecognised - - - -
A.1.8 Banking Group - On-balance sheet credit exposures to customers: changes in total
adjustments to loans

NOTES TO THE 2013 CONSOLIDATED FINANCIAL STATEMENTS
374
A.3 Distribution of secured credit exposures by type of security
A.3.2 Banking Group - Guaranteed credit exposures with customers
Go
ve
rnm
en
ts a
nd
Ce
ntr
al
Ba
nk
s
Oth
er
pu
bli
c s
ect
or
en
titi
es
Ba
nk
s
Oth
er
en
titi
es
1. On-balance sheet credit
exposures
guaranteed: 2,587,159 1,594,877 186,341 209,745 673,505 - - - - 1,093 - - 56 68,182 2,733,799
1.1 fully guaranteed 1,530,177 1,119,236 92,737 41,209 673,505 - - - - - - - - 64,569 1,991,256
- of which impaired 280,045 391,066 14,886 36,800 21,513 - - - - - - - - 64,099 528,364
1.2 partially guaranteed 1,056,982 475,641 93,604 168,536 - - - - - 1,093 - - 56 3,613 742,543
- of which impaired 223,961 159,161 8,673 4,988 - - - - - - - - 56 863 173,741
2. Off-balance sheet credit
exposures
guaranteed: 46,891 9,800 16,936 13 - - - - - - - - - - 26,749
2.1 fully guaranteed 26,749 9,800 16,936 13 - - - - - - - - - - 26,749
- of which impaired 4,766 4,753 - 13 - - - - - - - - - - 4,766
2.2 partially guaranteed 20,142 - - - - - - - - - - - - - -
- of which impaired 7,012 - - - - - - - - - - - - - -
Oth
er
pu
bli
c se
cto
r e
nti
tie
s
Collateral
(1)
Ne
t v
alu
e o
f e
xpo
sure
s
Personal Guarantees
(2)
Ba
nk
s
Oth
er
en
titi
es
Re
al
est
ate
- f
ina
nce
le
ase
s
Total
(1)+(2)
Credit derivatives Endorsements
Re
al
est
ate
Se
curi
tie
s
Oth
er
coll
ate
ral
C L
N
Other derivatives
Go
ve
rnm
en
ts a
nd
Ce
ntr
al
Ba
nk
s
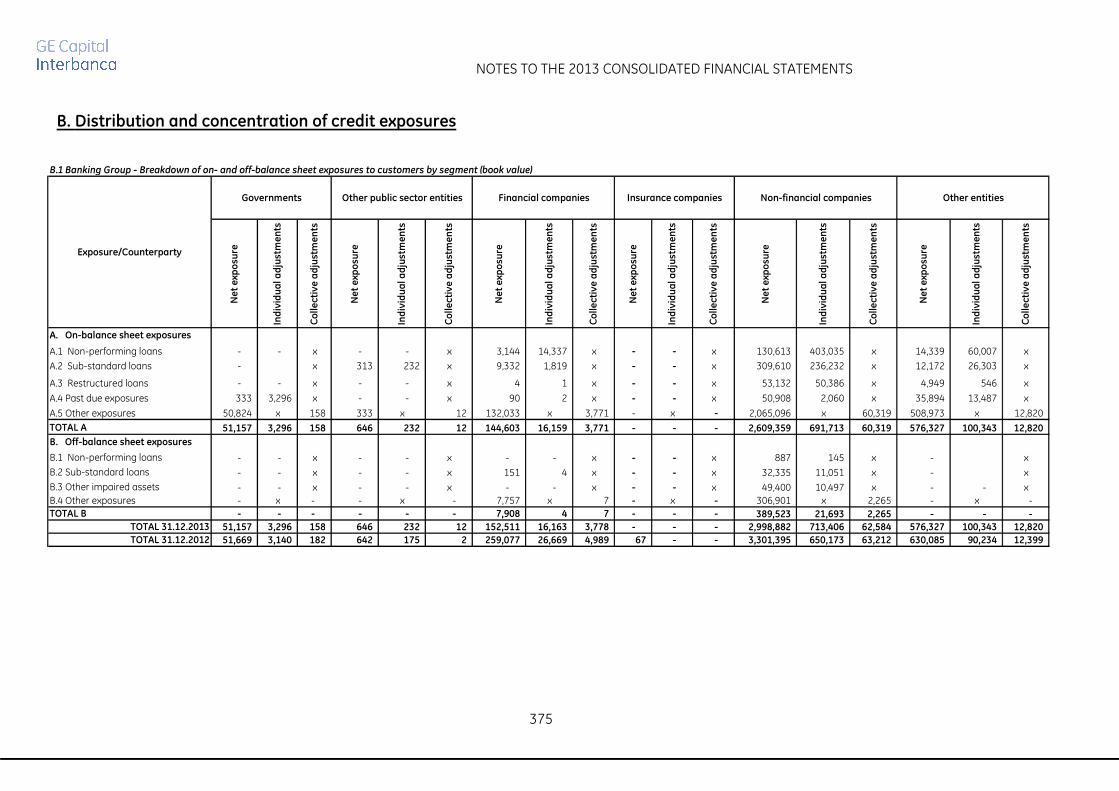
NOTES TO THE 2013 CONSOLIDATED FINANCIAL STATEMENTS
375
B. Distribution and concentration of credit exposures
Ne
t e
xpo
sure
Ind
ivid
ua
l a
dju
stm
en
ts
Co
lle
ctiv
e a
dju
stm
en
ts
Ne
t e
xpo
sure
Ind
ivid
ua
l a
dju
stm
en
ts
Co
lle
ctiv
e a
dju
stm
en
ts
Ne
t e
xpo
sure
Ind
ivid
ua
l a
dju
stm
en
ts
Co
lle
ctiv
e a
dju
stm
en
ts
Ne
t e
xpo
sure
Ind
ivid
ua
l a
dju
stm
en
ts
Co
lle
ctiv
e a
dju
stm
en
ts
Ne
t e
xpo
sure
Ind
ivid
ua
l a
dju
stm
en
ts
Co
lle
ctiv
e a
dju
stm
en
ts
Ne
t e
xpo
sure
Ind
ivid
ua
l a
dju
stm
en
ts
Co
lle
ctiv
e a
dju
stm
en
ts
A. On-balance sheet exposures
A.1 Non-performing loans - - x - - x 3,144 14,337 x - - x 130,613 403,035 x 14,339 60,007 x
A.2 Sub-standard loans - x 313 232 x 9,332 1,819 x - - x 309,610 236,232 x 12,172 26,303 x
A.3 Restructured loans - - x - - x 4 1 x - - x 53,132 50,386 x 4,949 546 x
A.4 Past due exposures 333 3,296 x - - x 90 2 x - - x 50,908 2,060 x 35,894 13,487 x
A.5 Other exposures 50,824 x 158 333 x 12 132,033 x 3,771 - x - 2,065,096 x 60,319 508,973 x 12,820
TOTAL A 51,157 3,296 158 646 232 12 144,603 16,159 3,771 - - - 2,609,359 691,713 60,319 576,327 100,343 12,820
B. Off-balance sheet exposures
B.1 Non-performing loans - - x - - x - - x - - x 887 145 x - x
B.2 Sub-standard loans - - x - - x 151 4 x - - x 32,335 11,051 x - x
B.3 Other impaired assets - - x - - x - - x - - x 49,400 10,497 x - - x
B.4 Other exposures - x - - x - 7,757 x 7 - x - 306,901 x 2,265 - x -
TOTAL B - - - - - - 7,908 4 7 - - - 389,523 21,693 2,265 - - -
TOTAL 31.12.2013 51,157 3,296 158 646 232 12 152,511 16,163 3,778 - - - 2,998,882 713,406 62,584 576,327 100,343 12,820
TOTAL 31.12.2012 51,669 3,140 182 642 175 2 259,077 26,669 4,989 67 - - 3,301,395 650,173 63,212 630,085 90,234 12,399
B.1 Banking Group - Breakdown of on- and off-balance sheet exposures to customers by segment (book value)
Exposure/Counterparty
Governments Other public sector entities Financial companies Insurance companies Non-financial companies Other entities
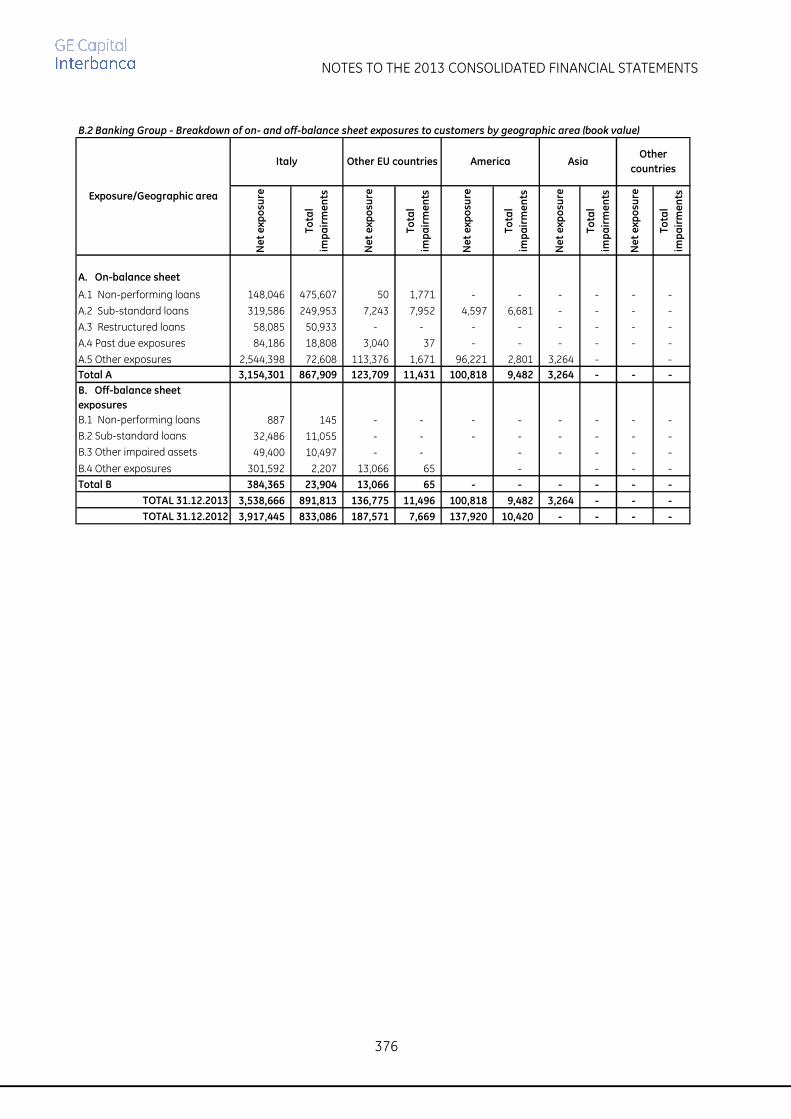
NOTES TO THE 2013 CONSOLIDATED FINANCIAL STATEMENTS
376
Ne
t e
xpo
sure
To
tal
imp
air
me
nts
Ne
t e
xpo
sure
To
tal
imp
air
me
nts
Ne
t e
xpo
sure
To
tal
imp
air
me
nts
Ne
t e
xpo
sure
To
tal
imp
air
me
nts
Ne
t e
xpo
sure
To
tal
imp
air
me
nts
A. On-balance sheet
exposures A.1 Non-performing loans 148,046 475,607 50 1,771 - - - - - -
A.2 Sub-standard loans 319,586 249,953 7,243 7,952 4,597 6,681 - - - -
A.3 Restructured loans 58,085 50,933 - - - - - - - -
A.4 Past due exposures 84,186 18,808 3,040 37 - - - - - -
A.5 Other exposures 2,544,398 72,608 113,376 1,671 96,221 2,801 3,264 - -
Total A 3,154,301 867,909 123,709 11,431 100,818 9,482 3,264 - - -
B. Off-balance sheet
exposures
B.1 Non-performing loans 887 145 - - - - - - - -
B.2 Sub-standard loans 32,486 11,055 - - - - - - - -
B.3 Other impaired assets 49,400 10,497 - - - - - - -
B.4 Other exposures 301,592 2,207 13,066 65 - - - -
Total B 384,365 23,904 13,066 65 - - - - - -
TOTAL 31.12.2013 3,538,666 891,813 136,775 11,496 100,818 9,482 3,264 - - -
TOTAL 31.12.2012 3,917,445 833,086 187,571 7,669 137,920 10,420 - - - -
B.2 Banking Group - Breakdown of on- and off-balance sheet exposures to customers by geographic area (book value)
Exposure/Geographic area
Italy Other EU countries America AsiaOther
countries

NOTES TO THE 2013 CONSOLIDATED FINANCIAL STATEMENTS
377
Ne
t e
xpo
sure
To
tal
imp
air
me
nts
Ne
t e
xpo
sure
To
tal
imp
air
me
nts
Ne
t e
xpo
sure
To
tal
imp
air
me
nts
Ne
t e
xpo
sure
To
tal
imp
air
me
nts
Ne
t e
xpo
sure
To
tal
imp
air
me
nts
A. On-balance sheet exposures
A.1 Non-performing loans - - - - - - - - - -
A.2 Sub-standard loans - - - - - - - - - -
A.3 Restructured loans - - - - - - - - - -
A.4 Past due exposures - - - - - - - - - -
A.5 Other exposures 193,703 3 21,372 - 11,789 - - - - -
TOTAL A 193,703 3 21,372 - 11,789 - - - - -
B. Off-balance sheet exposures
B.1 Non-performing loans - - - - - - - - - -
B.2 Sub-standard loans - - - - - - - - - -
B.3 Other impaired assets - - - - - - - - - -
B.4 Other exposures 7,482 - 4,865 - 243 - - - - -
TOTAL B 7,482 - 4,865 - 243 - - - - -
TOTAL 31.12.2013 201,185 3 26,237 - 12,032 - - - - -
TOTAL 31.12.2012 291,530 2 34,283 - 15,194 - - - - -
B.3 Banking Group - Breakdown of on- and off-balance sheet exposures to banks by geographic area (book value)
AsiaOther
countries
Exposure/Geographic area
ItalyOther EU
countriesAmerica
31.12.2013 31.12.2012a1) Book value 369,094 486,512 a2) Weighted value 274,778 336,583 b) Number of positions 4 4
B.4 Large risks

NOTES TO THE 2013 CONSOLIDATED FINANCIAL STATEMENTS
378
C.Securitisation transactions and sale of business units
C.1 Securitisation transactions
Qualitative disclosure
During 2013, the Company managed the securitisation transaction, which began its run-off phase in
June 2012. This phase envisages the repayment of the Senior Notes consistent with the amortisation
of the underlying portfolio. According to forecasts, this transaction will be completed during the first
half of 2014.
The transferee vehicle company for the securitised loans is GE SPV S.r.l., with registered office in
Conegliano - Via Alfieri 1, enrolled in the Special Register managed by the Bank of Italy pursuant to
art. 107 of the Consolidated Banking Act, whose sole business purpose is to carry out loan
securitisation transactions.
GE Capital Servizi Finanziari S.p.A. has full ownership of the vehicle company.
Customer relations management, from instalment collection to in and out-of-court management,
was retained by the transferring company through a servicing contract.
The parties involved in the transaction are:
• Issuer GE SPV S.r.l.
• Initial Notes Subscriber Duomo Funsing PLC
• Originator GE Capital Servizi Finanziari S.p.A.
• Servicer GE Capital Servizi Finanziari S.p.A.
• Junior Securities Holder GE Capital Servizi Finanziari S.p.A.
• Cash Manager Bank of New York Mellon - London
• English Account Bank Bank of New York Mellon - London
• Account Bank Bank of New York Mellon - London
• Agent Bank Bank of New York Mellon - London
• Paying Agent Bank of New York Mellon - London
• Calculation Agent Securitisation Services S.p.A.
• Corporate Servicer Securitisation Services S.p.A.
• Representative of the Noteholders Securitisation Services S.p.A.
The transaction was handled by Banca San Paolo IMI, a leading international financial institution,
through its specialised unit in Milan, as sole arranger and financing bank.
The assessment transactions of the credit enhancement were handled by Standard & Poor’s, while
the review of the sold portfolio was handled by KPMG.

NOTES TO THE 2013 CONSOLIDATED FINANCIAL STATEMENTS
379
Risks
The Originator risk is normally represented by the possibility that the Vehicle is not able to fully
liquidate the interest periodically accrued on the senior securities that include a subordinated
repayment to those of other types.
Performance of the securitised portfolio is constantly monitored. Specific indicators are monitored
that provide oversight on the portfolio quality, such as the Portfolio Delinquency Ratio, Static Gross
Default Ratio and the Dynamic Gross Default Ratio, which did not present any anomalies during the
year.
As provided for in IAS 39, derecognition analyses were conducted as necessary, from which it
emerged that the substantial risks and benefits associated with the portfolio of sold loans was not
transferred and therefore the assets were not derecognised from the GE Capital Servizi Finanziari
S.p.A. financial statements.
Quantitative disclosure
Gro
ss e
xpo
sure
Ne
t e
xpo
sure
Gro
ss e
xpo
sure
Ne
t e
xpo
sure
Gro
ss e
xpo
sure
Ne
t e
xpo
sure
Gro
ss e
xpo
sure
Ne
t e
xpo
sure
Gro
ss e
xpo
sure
Ne
t e
xpo
sure
Gro
ss e
xpo
sure
Ne
t e
xpo
sure
Gro
ss e
xpo
sure
Ne
t e
xpo
sure
Gro
ss e
xpo
sure
Ne
t e
xpo
sure
Gro
ss e
xpo
sure
Ne
t e
xpo
sure
A. With own underlying
assets: - - - - 112,098 99,478 - - - - - - - - - - - -
a) Non-performing - - - - 16,669 5,732 - - - - - - - - - - - -
b) Other - - - - 95,429 93,746 - - - - - - - - - - - -
B. With third-party underlying
assets: - - - - - - - - - - - - - - - - - -
a) Non-performing - - - - - - - - - - - - - - - - - -
b) Other - - - - - - - - - - - - - - - - - -
Credit lines
Senior Mezzanine Junior
C.1.1 Banking Group - Exposures from securitisation transactions broken down by quality of underlying asset
Mezzanine Junior
Guarantees provided
Senior Mezzanine Junior
Underlying asset quality /
Exposure
On-balance sheet exposures
Senior
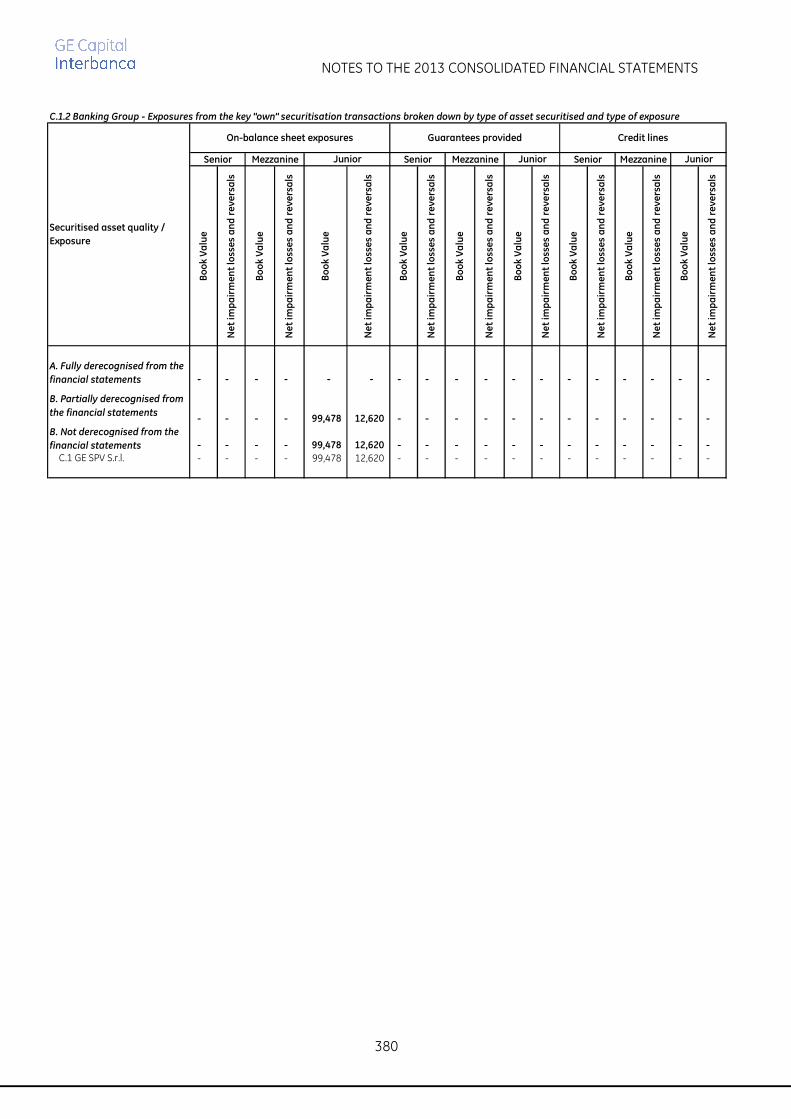
NOTES TO THE 2013 CONSOLIDATED FINANCIAL STATEMENTS
380
Bo
ok
Va
lue
Ne
t im
pa
irm
en
t lo
sse
s a
nd
re
ve
rsa
ls
Bo
ok
Va
lue
Ne
t im
pa
irm
en
t lo
sse
s a
nd
re
ve
rsa
ls
Bo
ok
Va
lue
Ne
t im
pa
irm
en
t lo
sse
s a
nd
re
ve
rsa
ls
Bo
ok
Va
lue
Ne
t im
pa
irm
en
t lo
sse
s a
nd
re
ve
rsa
ls
Bo
ok
Va
lue
Ne
t im
pa
irm
en
t lo
sse
s a
nd
re
ve
rsa
ls
Bo
ok
Va
lue
Ne
t im
pa
irm
en
t lo
sse
s a
nd
re
ve
rsa
ls
Bo
ok
Va
lue
Ne
t im
pa
irm
en
t lo
sse
s a
nd
re
ve
rsa
ls
Bo
ok
Va
lue
Ne
t im
pa
irm
en
t lo
sse
s a
nd
re
ve
rsa
ls
Bo
ok
Va
lue
Ne
t im
pa
irm
en
t lo
sse
s a
nd
re
ve
rsa
ls
A. Fully derecognised from the
financial statements - - - - - - - - - - - - - - - - - -
B. Partially derecognised from
the financial statements- - - - 99,478 12,620 - - - - - - - - - - - -
B. Not derecognised from the
financial statements - - - - 99,478 12,620 - - - - - - - - - - - -
C.1 GE SPV S.r.l. - - - - 99,478 12,620 - - - - - - - - - - - -
C.1.2 Banking Group - Exposures from the key "own" securitisation transactions broken down by type of asset securitised and type of exposure
Mezzanine Junior
Guarantees provided
Senior Mezzanine Junior
Securitised asset quality /
Exposure
On-balance sheet exposures
Senior
Credit lines
Senior Mezzanine Junior

NOTES TO THE 2013 CONSOLIDATED FINANCIAL STATEMENTS
381
Asset/Amount Traditional securitisations Synthetic securitisations
A. With own underlying assets: 99,478 -
A.1 Fully derecognised - -
1. Non-performing - X
2. Sub-standard - X
3. Restructured - X
4. Past due - X
5. Other assets - X
A.2 Partially derecognised - -
1. Non-performing - X
2. Sub-standard - X
3. Restructured - X
4. Past due - X
5. Other assets - X
A.3 Not derecognised 99,478 -
1. Non-performing 1,069 -
2. Sub-standard 3,337 -
3. Restructured - -
4. Past due 1,326 -
5. Other assets 93,746 -
B. Third-party underlying assets: - -
B.1 Non-performing loans - -
B.2 Sub-standard loans - -
B.3 Restructured exposures - -
B.4 Past due exposures - -
B.5 Other assets - -
C.1.5 Banking Group - Total amount of securitised assets underlying junior or other forms of credit support
Name Registered office % Interest
GE SPV S.r.l Conegliano (TV) 100%
C.1.6 Banking Group - Investments in vehicle companies

NOTES TO THE 2013 CONSOLIDATED FINANCIAL STATEMENTS
382
Imp
air
ed
Pe
rfo
rmin
g
Imp
air
ed
Pe
rfo
rmin
g
Imp
air
ed
Pe
rfo
rmin
g
GE Capital Servizi Finanziari S.p.A GE SPV S.r.l 8,383 139,199 10,078 139,199
Mezzanin
eJunior
Imp
air
ed
Per
form
ing
Imp
air
ed
Per
form
ing
Vehicle
company
C.1.7 Banking Group - Servicer activities - collections of securitised loans and repayments of securities issued by vehicle companies
Servicer
Securitised assets (year-
end date)
Loan collections during
the year
Percentage share of repaid
securities (year-end date)
Senior
Name Registered office % Interest
GE SPV S.r.l Conegliano (Treviso) 100%
C.1.8 Banking Group - Subsidiary vehicle companies

NOTES TO THE 2013 CONSOLIDATED FINANCIAL STATEMENTS
383
D. BANKING GROUP – MODELS FOR CREDIT RISK MEASUREMENT
1.2 Banking Group – Market risk
1.2.1 Interest rate risk and price risk – Trading book for regulatory
capital purposes
Qualitative disclosure
A. General characteristics
The trading book is managed to contain the risk position, with no speculative transactions being
made.
In 2013, consistent with the ALCO policy prohibiting any type of speculative transaction, the trading
book was made up of residual transactions from Corporate Desk activities (concluded in 2009), in
which derivative contracts were offered to customers to hedge financial risks that they had
assumed. These transactions were simultaneously hedged, in order to cancel the market risk on the
Parent Company’s books, with back-to-back transactions.
B. Management procedures and measurement of interest rate risk
The process of managing and controlling market risk is carried out on different levels of the
organisational structure. The essential role of managing and controlling market risk is the
responsibility of the Board of Directors, who defines the objectives and strategies for risk assumption.
Upon proposal of the Risk Committee, the Parent Company’s Board of Directors approves the ALCO
Policy that defines the guidelines, risk limits and market risk control procedures.
The ALCO policy is implemented in the operations:
� By the Risk Committee, for defining the monitoring and control policies and for planning and
defining any actions to return to the defined limits;
� By the ALCO Technical Committee, for the monitoring and control of risk positions;
� By the Parent Company’s Treasury Department, for operational functions;
� By Risk, for second-level monitoring and controlling of market risks.
The ALCO Technical Committee meets monthly, or whenever it is deemed necessary, and supervises
the market risk monitoring activities.
GE Capital Interbanca S.p.A.’s trading book is monitored daily in terms of the VaR model Market Risk.
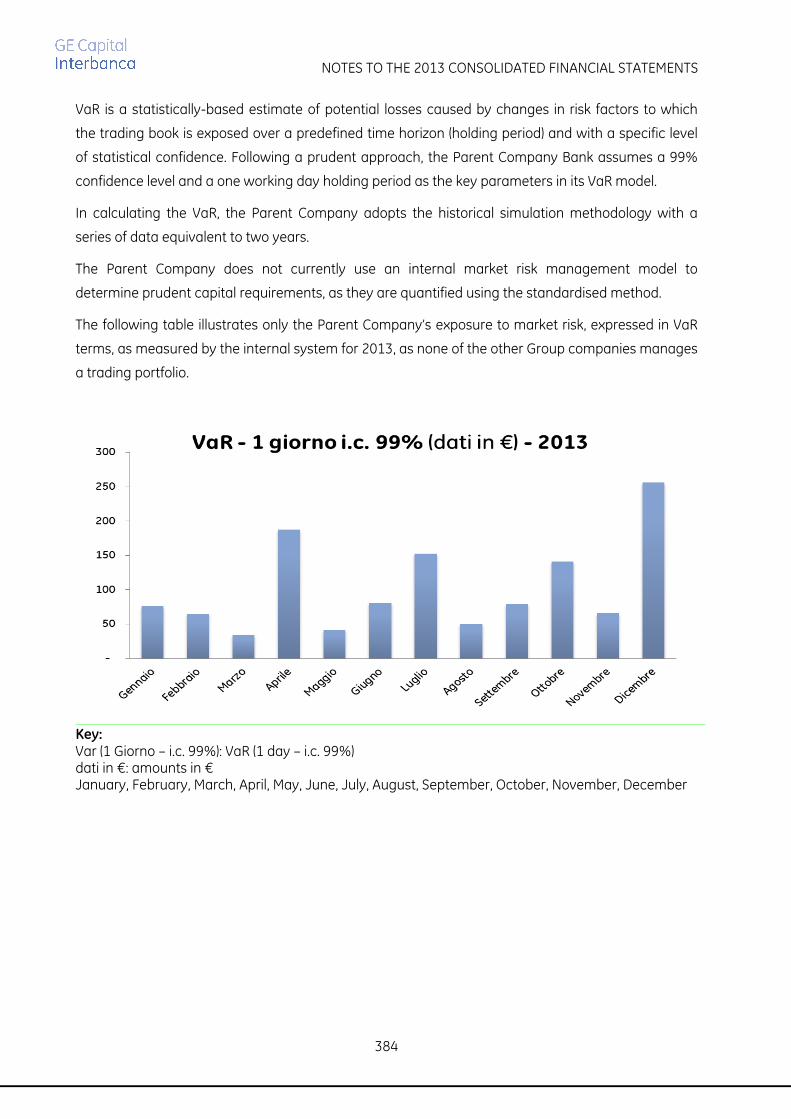
NOTES TO THE 2013 CONSOLIDATED FINANCIAL STATEMENTS
384
VaR is a statistically-based estimate of potential losses caused by changes in risk factors to which
the trading book is exposed over a predefined time horizon (holding period) and with a specific level
of statistical confidence. Following a prudent approach, the Parent Company Bank assumes a 99%
confidence level and a one working day holding period as the key parameters in its VaR model.
In calculating the VaR, the Parent Company adopts the historical simulation methodology with a
series of data equivalent to two years.
The Parent Company does not currently use an internal market risk management model to
determine prudent capital requirements, as they are quantified using the standardised method.
The following table illustrates only the Parent Company’s exposure to market risk, expressed in VaR
terms, as measured by the internal system for 2013, as none of the other Group companies manages
a trading portfolio.
Key: Var (1 Giorno – i.c. 99%): VaR (1 day – i.c. 99%) dati in €: amounts in € January, February, March, April, May, June, July, August, September, October, November, December
NOTES TO THE 2013 CONSOLIDATED FINANCIAL STATEMENTS
385
Price risk
Qualitative disclosure
A. General characteristics
In 2013, activity involving equity securities was nil, in line with ALCO policy.
B. Management procedures and measurement methodologies of price risk
Please refer to the description of interest rate risk in the previous section.
Quantitative disclosure
Not applicable.
NOTES TO THE 2013 CONSOLIDATED FINANCIAL STATEMENTS
386
1.2.2 – Interest rate risk and price risk – Banking book
Interest rate risk Qualitative disclosure
A. General characteristics, interest rate management processes and
measurement methods
In 2013, the Banking Group’s exposure to structural interest rate risk was consistent with the
established regulatory limits.
Exposure to interest rate risk is limited both in terms of potential impact on the Economic Value and
the Interest Margin under the hypothetical conditions of interest rate stress.
Additionally, the Banking Group managed the exposure to basis risk consistent with the level and
volatility of money market rates, maintaining the risk position within the general limits established for
interest rate risk.
Illustration of the internal model
The system guarantees an integrated approach to interest rate risk monitoring and management,
with particular attention to the:
1. Module for the statistical analysis of risk exposure, through which the Banking Group’s current
and future exposure to financial risks is assessed in a crisis scenario. This module is currently
used to evaluate:
a. Liquidity risk, through the evaluation of all cash flows (both capital and interest)
generated by the Bank’s operations in relation to the banking book (maturity gap
analysis);
b. The effects of an interest rate shock on the net interest margin simultaneous with and
parallel to the cut-off date (shock sensitivity analysis +/- 200 basis points).
2. Module for fixing analysis, through which the effective risk position for variable rate transactions
is obtained with an indication of the period in which interest rate re-fixing will occur.
3. Module for simulation analysis, through which the effects of corporate strategies on profitability
are evaluated and, at the same time, sensitivity of the net interest margin to various scenarios of
forecasted interest rates; thus, the model:
a. Enables the ALM department to conduct an inertial simulation of the income statement
and balance sheet by calculating the relevant average capital, average and actual
month-end interest rates, and real interest rates;
b. Analyses different scenarios of new volumes with segmentation by type and pricing rules
and obtains details for individual transactions;
c. Defines liquidity mismatches (of capital and interest) by calculating the capitalisation
effect on the Banking Group’s income statement.

NOTES TO THE 2013 CONSOLIDATED FINANCIAL STATEMENTS
387
B. Hedging
In accordance with the ALCO policy, fixed-rate loans are subject to specific hedging through “match
funding”, or through transactions having the same financial characteristics of the loan. There were
no hedging transactions conducted through derivative instruments during 2013.
C. Cash flow hedges
Risks from the Banking Group’s exposure to cash flow volatility are constantly monitored by ALM; no
specific cash flow hedges against interest rate risk were executed in 2013.
Quantitative disclosure
2. Banking book – internal models and other methodologies for sensitivity analysis
Historical analysis of interest margin risk indicators
The following table illustrates the effect of a 200 basis point shock in the interest rate on the Banking
Group’s balance sheet.
Key:
Impatto valore economico – Anno 2013: Impact on the economic value – 2013
Jan-13, Feb-13, Mar-13, Apr-13, May-13, Jun-13, Jul-13, Aug-13, Sep-13, Oct-13, Nov-13, Dec-13

NOTES TO THE 2013 CONSOLIDATED FINANCIAL STATEMENTS
388
Price risk - Equity investments
Qualitative disclosure
A.General characteristics, price risk management processes and measurement methods
Equity investment activities are carried out solely by the Parent Company GE Capital Interbanca
S.p.A.; therefore refer to the appropriate section of the Company’s Notes to the Separate Financial
Statements.

NOTES TO THE 2013 CONSOLIDATED FINANCIAL STATEMENTS
389
1.2.3 - Currency risk
Qualitative disclosure
A.General characteristics, currency risk management processes and
measurement methods
Structural foreign exchange risk at the Group level is mitigated by offsetting transactions, typically
raising funding in the same currency.
Positions in foreign currency are monitored using the reports produced by ALM.
B.Hedging of currency risk There were no over-the-counter derivative transactions to hedge currency risk during 2013.
Quantitative disclosure 2. Internal models and other methodologies for sensitivity analysis
The currency risk for the trading book was nil in 2013.
The following graph shows the trend in the relationship between open positions in the banking book
and equity.
0,00%
0,01%
0,01%
0,02%
0,02%
0,03%
0,03%
Rischio di cambio Portafoglio bancario
Net Position/PDV
Key: Rischio di cambio Portafoglio bancario: Banking book credit risk Mar-13, Jun-13, Sep-13, Dec-13

NOTES TO THE 2013 CONSOLIDATED FINANCIAL STATEMENTS
390
1. Breakdown of assets, liabilities and derivatives by currency of denomination
US Dollar GB PoundPolish
Zloty
Czech
Republic
Koruna
Swiss
Franc
Other
currencies
A. Financial assets 201,841 243 3,537 - 1,320 964
A.1 Debt securities - - - - - - A.2 Equities - - - - - - A.3 Loans to banks 5,638 159 - - 442 51 A.4 Loans to customers 196,203 84 3,537 - 878 913 A.5 Other financial assets - - - - B. Other assets 12 - - - - -
C. Financial liabilities (212,967) (79) (3,480) - (1,280) (946)
C.1 Due to banks - (193) - - - C.2 Due to customers (212,967) (79) (3,287) - (1,280) (946) C.3 Securities issued - - - - - - C.4 Other financial liabilities - - D. Other liabilities (399) (187) - - - -
E. Financial derivatives - - - - - -
- Options - - - - - - + Long positions - - - - - - + Short positions - - - - - -
- Other - - - - - - + Long positions - - - - - - + Short positions - - - - - -
Total assets 201,853 243 3,537 - 1,320 964
Total liabilities (213,366) (266) (3,480) - (1,280) (946)
Gap (+/-) (11,513) (23) 57 - 40 18
Item
Currencies
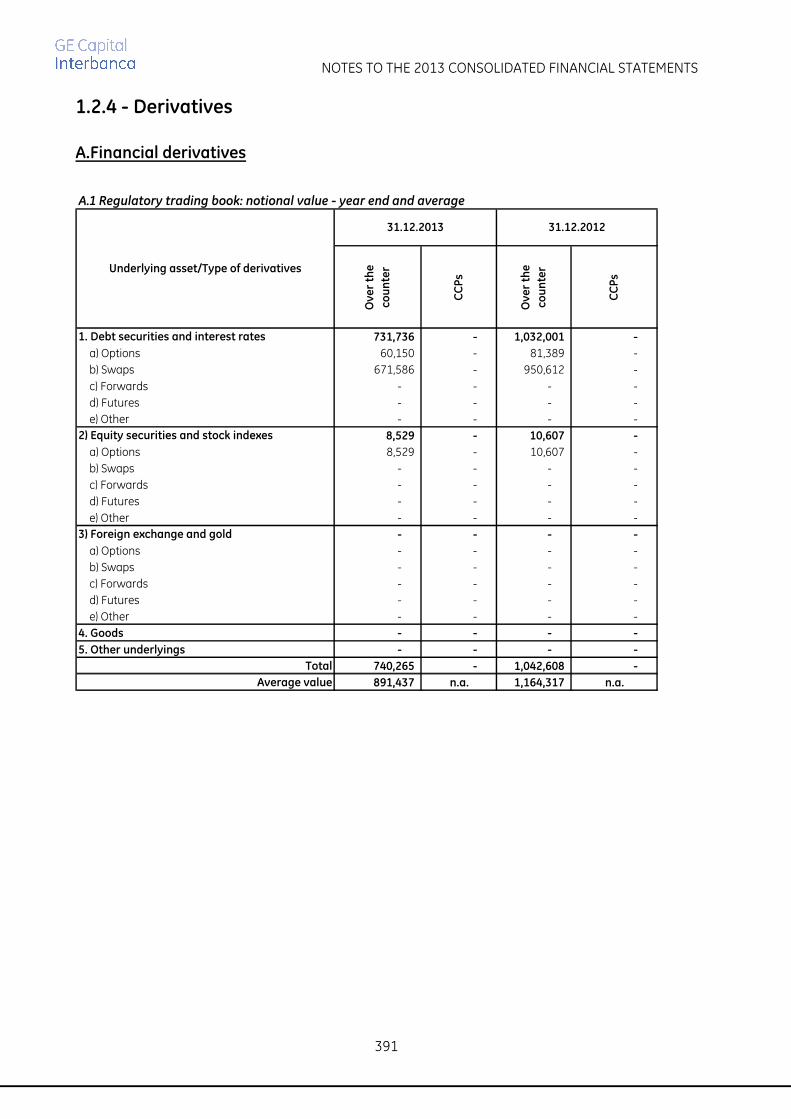
NOTES TO THE 2013 CONSOLIDATED FINANCIAL STATEMENTS
391
1.2.4 - Derivatives A.Financial derivatives
Ov
er
the
cou
nte
r
CC
Ps
Ov
er
the
cou
nte
r
CC
Ps
1. Debt securities and interest rates 731,736 - 1,032,001 -
a) Options 60,150 - 81,389 -
b) Swaps 671,586 - 950,612 -
c) Forwards - - - -
d) Futures - - - -
e) Other - - - -
2) Equity securities and stock indexes 8,529 - 10,607 -
a) Options 8,529 - 10,607 -
b) Swaps - - - -
c) Forwards - - - -
d) Futures - - - -
e) Other - - - -
3) Foreign exchange and gold - - - -
a) Options - - - -
b) Swaps - - - -
c) Forwards - - - -
d) Futures - - - -
e) Other - - - -
4. Goods - - - -
5. Other underlyings - - - -
Total 740,265 - 1,042,608 -
Average value 891,437 n.a. 1,164,317 n.a.
A.1 Regulatory trading book: notional value - year end and average
Underlying asset/Type of derivatives
31.12.2013 31.12.2012
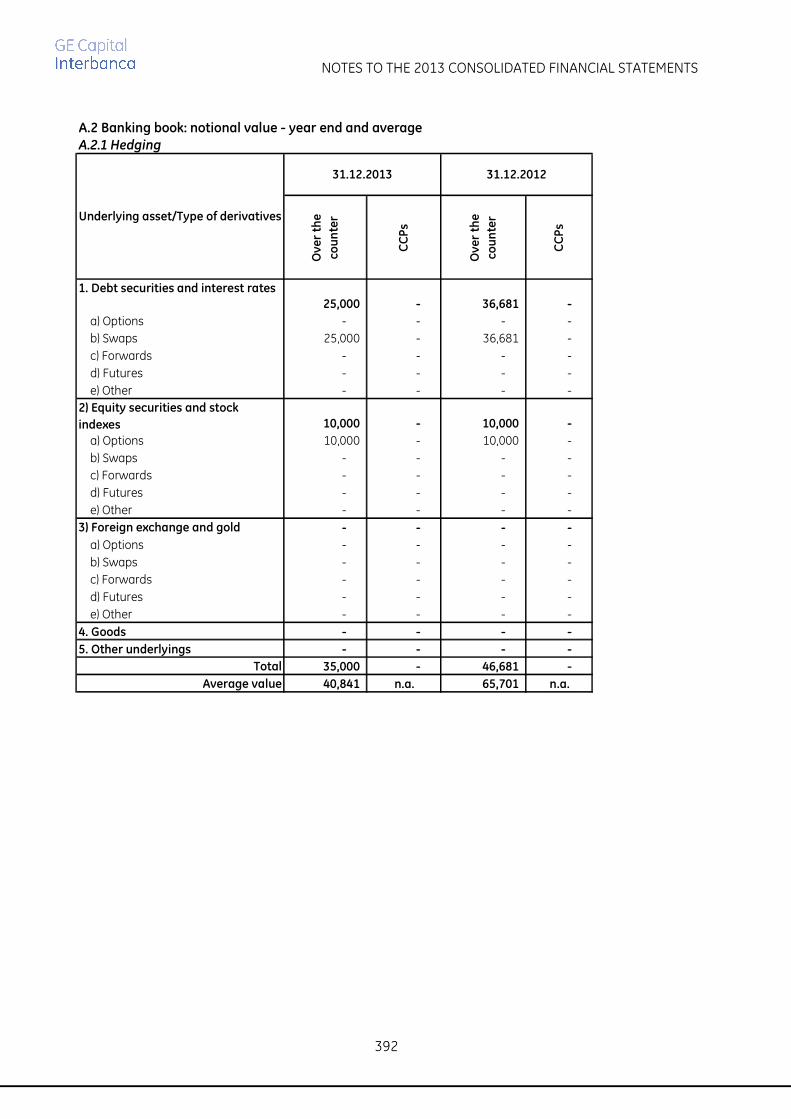
NOTES TO THE 2013 CONSOLIDATED FINANCIAL STATEMENTS
392
A.2 Banking book: notional value - year end and average
Ov
er
the
cou
nte
r
CC
Ps
Ov
er
the
cou
nte
r
CC
Ps
1. Debt securities and interest rates
25,000 - 36,681 -
a) Options - - - -
b) Swaps 25,000 - 36,681 -
c) Forwards - - - -
d) Futures - - - -
e) Other - - - -
2) Equity securities and stock
indexes 10,000 - 10,000 -
a) Options 10,000 - 10,000 -
b) Swaps - - - -
c) Forwards - - - -
d) Futures - - - -
e) Other - - - -
3) Foreign exchange and gold - - - -
a) Options - - - -
b) Swaps - - - -
c) Forwards - - - -
d) Futures - - - -
e) Other - - - -
4. Goods - - - -
5. Other underlyings - - - -
Total 35,000 - 46,681 -
Average value 40,841 n.a. 65,701 n.a.
A.2.1 Hedging
Underlying asset/Type of derivatives
31.12.2013 31.12.2012
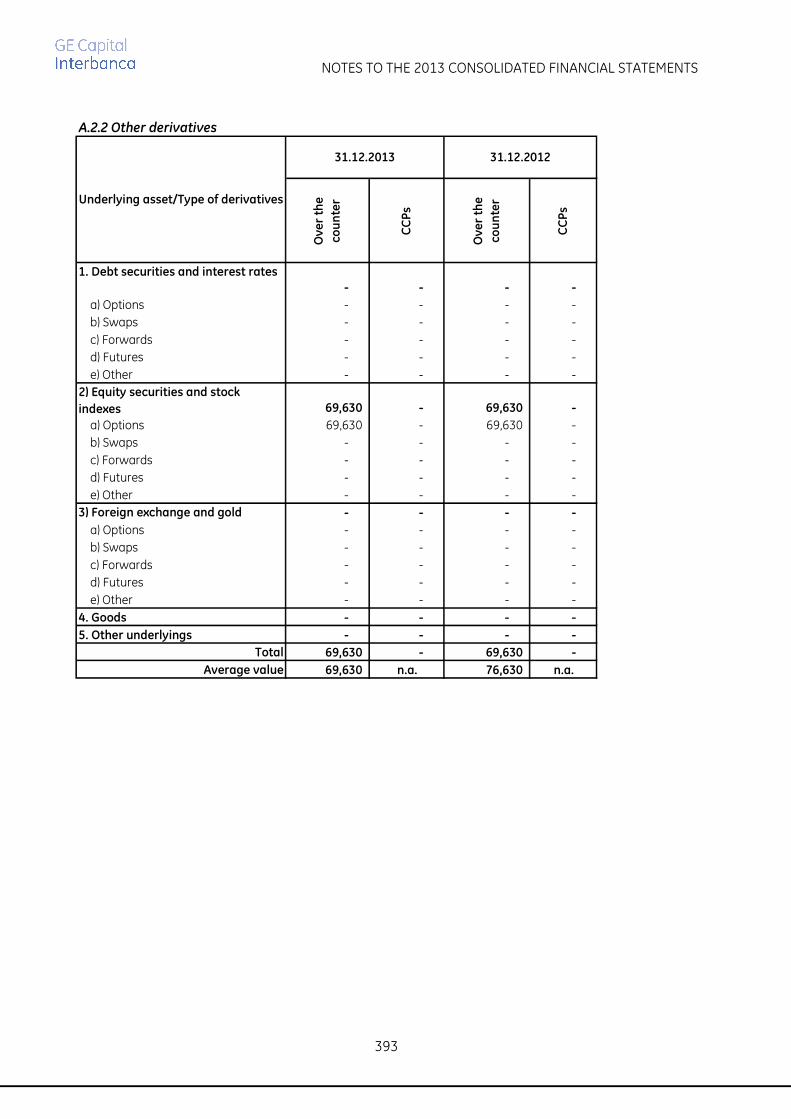
NOTES TO THE 2013 CONSOLIDATED FINANCIAL STATEMENTS
393
Ov
er
the
cou
nte
r
CC
Ps
Ov
er
the
cou
nte
r
CC
Ps
1. Debt securities and interest rates
- - - -
a) Options - - - -
b) Swaps - - - -
c) Forwards - - - -
d) Futures - - - -
e) Other - - - -
2) Equity securities and stock
indexes 69,630 - 69,630 -
a) Options 69,630 - 69,630 -
b) Swaps - - - -
c) Forwards - - - -
d) Futures - - - -
e) Other - - - -
3) Foreign exchange and gold - - - -
a) Options - - - -
b) Swaps - - - -
c) Forwards - - - -
d) Futures - - - -
e) Other - - - -
4. Goods - - - -
5. Other underlyings - - - -
Total 69,630 - 69,630 -
Average value 69,630 n.a. 76,630 n.a.
A.2.2 Other derivatives
Underlying asset/Type of derivatives
31.12.2013 31.12.2012

NOTES TO THE 2013 CONSOLIDATED FINANCIAL STATEMENTS
394
Ov
er
the
cou
nte
r
CC
Ps
Ov
er
the
cou
nte
r
CC
Ps
A. Regulatory trading portfolio 50,010 - 85,032 -
a) Options 44 - 305 -
b) Interest rate swaps 49,966 - 84,727 -
c) Cross currency swaps - - - -
d) Equity swaps - - - -
e) Forwards - - - -
f) Futures - - - -
g) Others - - - -
B. Banking book - hedging 494 - 931 -
a) Options - - - -
b) Interest rate swaps 494 - 931 -
c) Cross currency swaps - - - -
d) Equity swaps - - - -
e) Forwards - - - -
f) Futures - - - -
g) Others - - - -
C. Banking book - other derivatives - - - -
a) Options - - - -
b) Interest rate swaps - - - -
c) Cross currency swaps - - - -
d) Equity swaps - - - -
e) Forwards - - - -
f) Futures - - - -
g) Others - - - -
Total 50,504 - 85,963 -
A.3 Financial derivatives: positive gross fair value - breakdown by products
31.12.2013 31.12.2012
Portfolios/Types of derivatives
Positive fair value

NOTES TO THE 2013 CONSOLIDATED FINANCIAL STATEMENTS
395
Ov
er
the
cou
nte
r
CC
Ps
Ov
er
the
cou
nte
r
CC
Ps
A. Regulatory trading portfolio 53,668 - 81,211 -
a) Options 76 - 306 -
b) Interest rate swaps 53,592 - 80,905 -
c) Cross currency swaps - - - -
d) Equity swaps - - - -
e) Forwards - - - -
f) Futures - - - -
g) Others - - - -
B. Banking book - hedging - - 103 -
a) Options - - - -
b) Interest rate swaps - - 103 -
c) Cross currency swaps - - - -
d) Equity swaps - - - -
e) Forwards - - - -
f) Futures - - - -
g) Others - - - -
C. Banking book - other derivatives - - - -
a) Options - - - -
b) Interest rate swaps - - - -
c) Cross currency swaps - - - -
d) Equity swaps - - - -
e) Forwards - - - -
f) Futures - - - -
g) Others - - - -
Total 53,668 - 81,314 -
A.4 Financial derivatives: negative gross fair value - breakdown by products
31.12.2013 31.12.2012
Portfolios/Types of derivatives
Negative fair value

NOTES TO THE 2013 CONSOLIDATED FINANCIAL STATEMENTS
396
Contracts not included in netting agreements
Go
ve
rnm
en
ts a
nd
Ce
ntr
al B
an
ks
Oth
er
pu
bli
c se
cto
r
en
titi
es
Ba
nk
s
Fin
an
cia
l
com
pa
nie
s
Insu
ran
ce
com
pa
nie
s
No
n-f
ina
nci
al
com
pa
nie
s
Oth
er
en
titi
es
1) Debt securities and interest rate indexes
- notional amount - - 403,726 25,131 - 302,879 -
- positive fair value - - 4,407 7,270 - 38,333 -
- negative fair value - - 53,668 - - - -
- future exposure - - 3,565 343 - 2,583 -
2) Equity securities and stock indexes
- notional amount - - - - - 8,529 -
- positive fair value - - - - - - -
- negative fair value - - - - - - -
- future exposure - - - - - 117 -
3) Gold and currencies
- notional amount - - - - - - -
- positive fair value - - - - - - -
- negative fair value - - - - - - -
- future exposure - - - - - - -
4) Other instruments
- notional amount - - - - - - -
- positive fair value - - - - - - -
- negative fair value - - - - - - -
- future exposure - - - - - - -
A.5 OTC financial derivatives - regulatory book: notional amount, gross positive and negative fair values by
counterparty -
contracts not included in netting agreements

NOTES TO THE 2013 CONSOLIDATED FINANCIAL STATEMENTS
397
Contracts not included in netting agreements
Go
ve
rnm
en
ts a
nd
Ce
ntr
al B
an
ks
Oth
er
pu
bli
c se
cto
r
en
titi
es
Ba
nk
s
Fin
an
cia
l
com
pa
nie
s
Insu
ran
ce
com
pa
nie
s
No
n-f
ina
nci
al
com
pa
nie
s
Oth
er
en
titi
es
1) Debt securities and interest rate indexes
- notional amount - - 25,000 - - - -
- positive fair value - - 494 - - - -
- negative fair value - - - - - - -
- future exposure - - - - - - -
2) Equity securities and stock indexes
- notional amount - - 79,630 - - - -
- positive fair value - - - - - - -
- negative fair value - - - - - - -
- future exposure - - 800 - - - -
3) Gold and currencies
- notional amount - - - - - - -
- positive fair value - - - - - - -
- negative fair value - - - - - - -
- future exposure - - - - - - -
4) Other instruments
- notional amount - - - - - - -
- positive fair value - - - - - - -
- negative fair value - - - - - - -
- future exposure - - - - - - -
A.7 OTC financial derivatives - banking book: notional amount, gross positive and negative fair values by counterparty -
contracts not included in netting agreements
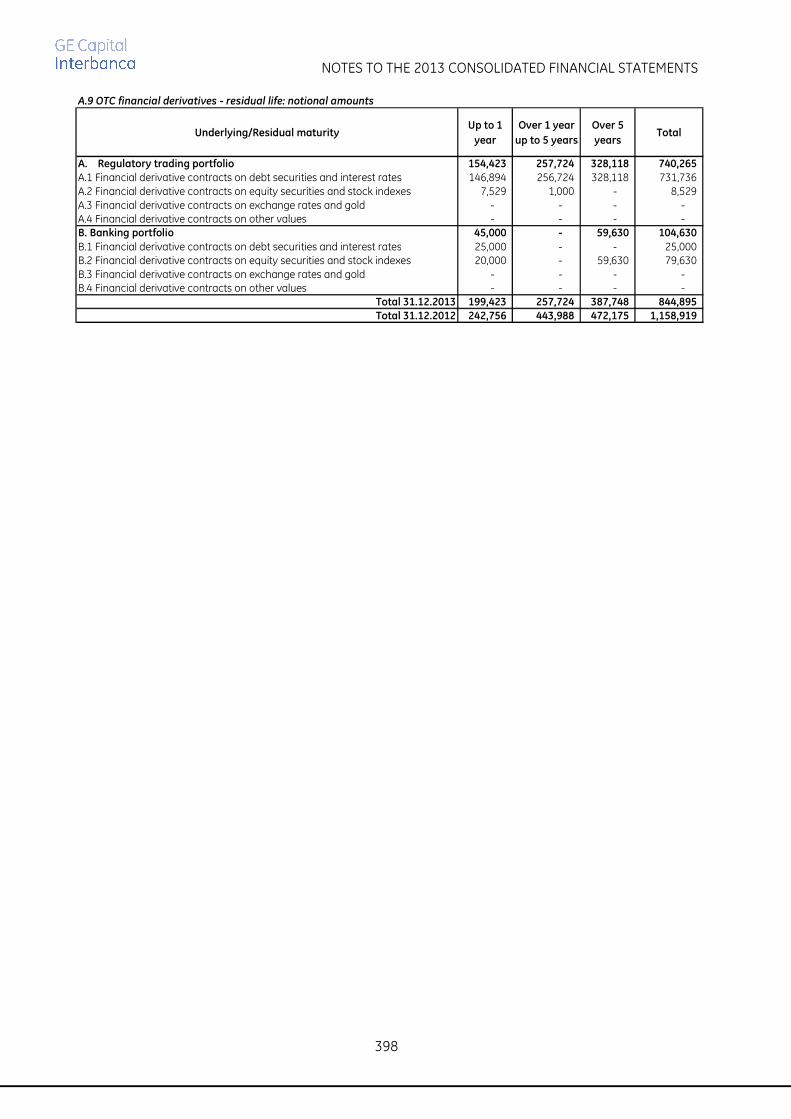
NOTES TO THE 2013 CONSOLIDATED FINANCIAL STATEMENTS
398
Underlying/Residual maturityUp to 1
year
Over 1 year
up to 5 years
Over 5
yearsTotal
A. Regulatory trading portfolio 154,423 257,724 328,118 740,265
A.1 Financial derivative contracts on debt securities and interest rates 146,894 256,724 328,118 731,736 A.2 Financial derivative contracts on equity securities and stock indexes 7,529 1,000 - 8,529 A.3 Financial derivative contracts on exchange rates and gold - - - - A.4 Financial derivative contracts on other values - - - - B. Banking portfolio 45,000 - 59,630 104,630
B.1 Financial derivative contracts on debt securities and interest rates 25,000 - - 25,000 B.2 Financial derivative contracts on equity securities and stock indexes 20,000 - 59,630 79,630 B.3 Financial derivative contracts on exchange rates and gold - - - - B.4 Financial derivative contracts on other values - - - -
Total 31.12.2013 199,423 257,724 387,748 844,895
Total 31.12.2012 242,756 443,988 472,175 1,158,919
A.9 OTC financial derivatives - residual life: notional amounts

NOTES TO THE 2013 CONSOLIDATED FINANCIAL STATEMENTS
399
1.3 Banking Group - Liquidity Risk
Qualitative disclosure
A.General characteristics, liquidity risk management processes and measurement
methods
As in prior years, the Banking Group’s structural liquidity profile in 2013 was aligned with criteria for
sound and prudent management.
82% of the Group’s financial needs are met through funding provided by General Electric Group
financial companies.
As regards short-term liquidity, the Banking Group must ensure a survival period of not less than 45
days.
In addition, the Banking Group’s ability to handle various stress scenarios (market and/or
idiosyncratic) is monitored every month; the LCR and NSFR ratios set out by the new Basel III
regulation are calculated every quarter.
Analysis of cumulative cash flows from the Banking Group’s inertial liquidity position showed a
substantial liquidity surplus in 2013, which resulted in the early repayment of certain lines provided
by GE.
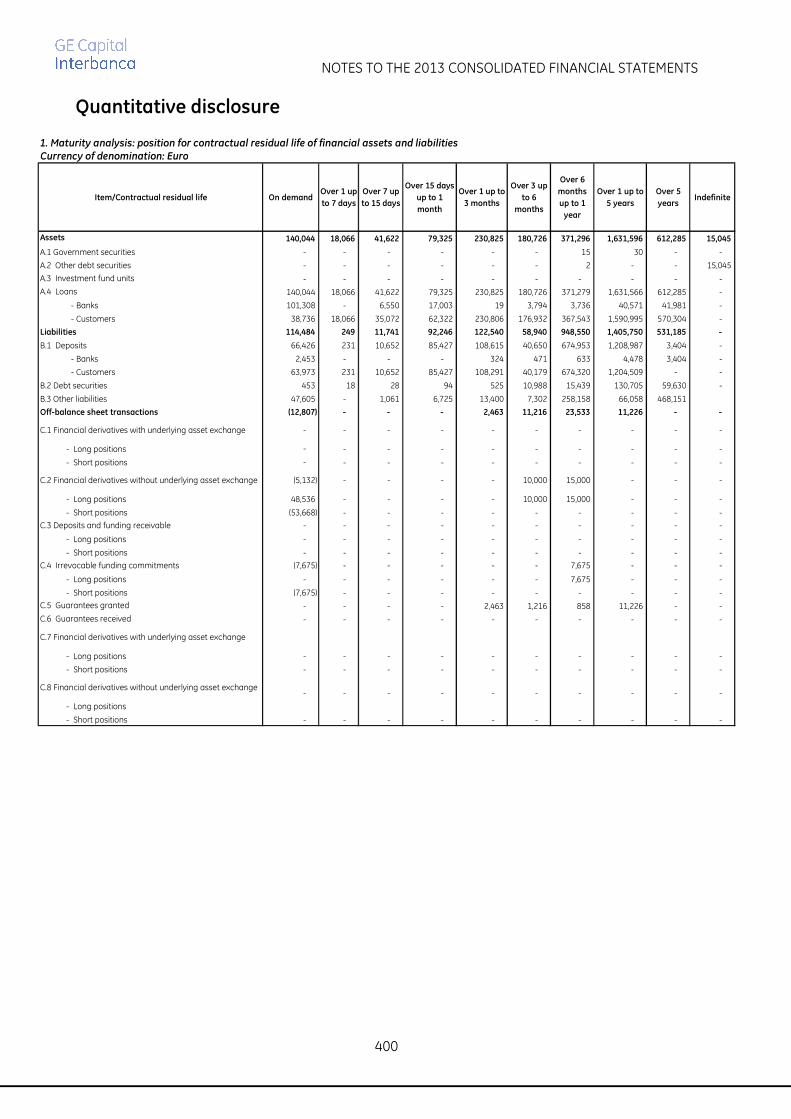
NOTES TO THE 2013 CONSOLIDATED FINANCIAL STATEMENTS
400
Quantitative disclosure
1. Maturity analysis: position for contractual residual life of financial assets and liabilities
Item/Contractual residual life On demandOver 1 up
to 7 days
Over 7 up
to 15 days
Over 15 days
up to 1
month
Over 1 up to
3 months
Over 3 up
to 6
months
Over 6
months
up to 1
year
Over 1 up to
5 years
Over 5
yearsIndefinite
Assets 140,044 18,066 41,622 79,325 230,825 180,726 371,296 1,631,596 612,285 15,045
A.1 Government securities - - - - - - 15 30 - -
A.2 Other debt securities - - - - - - 2 - - 15,045
A.3 Investment fund units - - - - - - - - - -
A.4 Loans 140,044 18,066 41,622 79,325 230,825 180,726 371,279 1,631,566 612,285 -
- Banks 101,308 - 6,550 17,003 19 3,794 3,736 40,571 41,981 -
- Customers 38,736 18,066 35,072 62,322 230,806 176,932 367,543 1,590,995 570,304 -
Liabilities 114,484 249 11,741 92,246 122,540 58,940 948,550 1,405,750 531,185 -
B.1 Deposits 66,426 231 10,652 85,427 108,615 40,650 674,953 1,208,987 3,404 -
- Banks 2,453 - - - 324 471 633 4,478 3,404 -
- Customers 63,973 231 10,652 85,427 108,291 40,179 674,320 1,204,509 - -
B.2 Debt securities 453 18 28 94 525 10,988 15,439 130,705 59,630 -
B.3 Other liabilities 47,605 - 1,061 6,725 13,400 7,302 258,158 66,058 468,151
Off-balance sheet transactions (12,807) - - - 2,463 11,216 23,533 11,226 - -
C.1 Financial derivatives with underlying asset exchange - - - - - - - - - -
Long positions - - - - - - - - - -
Short positions - - - - - - - - - -
C.2 Financial derivatives without underlying asset exchange (5,132) - - - - 10,000 15,000 - - -
Long positions 48,536 - - - - 10,000 15,000 - - -
Short positions (53,668) - - - - - - - - -
C.3 Deposits and funding receivable - - - - - - - - - -
Long positions - - - - - - - - - -
Short positions - - - - - - - - - -
C.4 Irrevocable funding commitments (7,675) - - - - - 7,675 - - -
Long positions - - - - - - 7,675 - - -
Short positions (7,675) - - - - - - - - -
C.5 Guarantees granted - - - - 2,463 1,216 858 11,226 - -
C.6 Guarantees received - - - - - - - - - -
C.7 Financial derivatives with underlying asset exchange
Long positions - - - - - - - - - -
Short positions - - - - - - - - - -
C.8 Financial derivatives without underlying asset exchange- - - - - - - - - -
Long positions
Short positions - - - - - - - - - -
Currency of denomination: Euro

NOTES TO THE 2013 CONSOLIDATED FINANCIAL STATEMENTS
401
Item/Contractual residual lifeOn
demand
Over 1 up
to 7 days
Over 7 up
to 15 days
Over 15
days up
to 1
month
Over 1 up
to 3
months
Over 3 up
to 6
months
Over 6
months up
to 1 year
Over 1 up to
5 years
Over 5
yearsIndefinite
Assets 8,107 1,582 6,136 4,091 13,860 9,375 11,883 117,556 75,144 -
A.1 Government securities - - - - - - - - - -
A.2 Other debt securities - - - - - - - - - -
A.3 Investment fund units - - - - - - - - - -
A.4 Loans 8,107 1,582 6,136 4,091 13,860 9,375 11,883 117,556 75,144 -
- Banks 5,638 - - - - - - - - -
- Customers 2,469 1,582 6,136 4,091 13,860 9,375 11,883 117,556 75,144 -
Liabilities 3,425 1,305 2,947 16,125 - - 185,998 2,900 - -
B.1 Deposits 3,404 1,305 2,947 16,125 - - 185,991 2,900 - -
- Banks - - - - - - - - - -
- Customers 3,404 1,305 2,947 16,125 - - 185,991 2,900 - -
B.2 Debt securities - - - - - - - - - -
B.3 Other liabilities 21 - - - - - 7 - - -
Off-balance sheet transactions - - - - - - - - - -
C.1 Financial derivatives with underlying asset exchange - - - - - - - - - -
Long positions - - - - - - - - - -
Short positions - - - - - - - - - -
C.2 Financial derivatives without underlying asset exchange - - - - - - - - - -
Long positions - - - - - - - - - -
Short positions - - - - - - - - - -
C.3 Deposits and funding receivable - - - - - - - - - -
Long positions - - - - - - - - - -
Short positions - - - - - - - - - -
C.4 Irrevocable funding commitments - - - - - - - - - -
Long positions - - - - - - - - - -
Short positions - - - - - - - - - -
C.5 Guarantees granted - - - - - - - - - -
C.6 Guarantees received - - - - - - - - - -
C.7 Financial derivatives with underlying asset exchange
Long positions - - - - - - - - - -
Short positions - - - - - - - - - -
C.8 Financial derivatives without underlying asset exchange- - - - - - - - - -
Long positions
Short positions - - - - - - - - - -
1. Maturity analysis: position for contractual residual life of financial assets and liabilities Currency of denomination: US Dollar

NOTES TO THE 2013 CONSOLIDATED FINANCIAL STATEMENTS
402
Item/Contractual residual lifeOn
demand
Over 1 up
to 7 days
Over 7 up
to 15
days
Over 15
days up
to 1
month
Over 1 up
to 3
months
Over 3 up
to 6
months
Over 6
months
up to 1
year
Over 1 up
to 5
years
Over 5
yearsIndefinite
Assets 159 - - 84 - - - - - -
A.1 Government securities - - - - - - - - - -
A.2 Other debt securities - - - - - - - - - -
A.3 Investment fund units - - - - - - - - - -
A.4 Loans 159 - - 84 - - - - - -
- Banks 159 - - - - - - - - -
- Customers - - - 84 - - - - - -
Liabilities 186 - - 78 - - - - - -
B.1 Deposits - - - 78 - - - - - -
- Banks - - - - - - - - - -
- Customers - - - 78 - - - - - -
B.2 Debt securities - - - - - - - - - -
B.3 Other liabilities 186 - - - - - - - - -
Off-balance sheet transactions - - - - - - - - - -
C.1 Financial derivatives with underlying asset exchange - - - - - - - - - -
Long positions - - - - - - - - - -
Short positions - - - - - - - - - -
C.2 Financial derivatives without underlying asset exchange - - - - - - - - - -
Long positions - - - - - - - - - -
Short positions - - - - - - - - - -
C.3 Deposits and funding receivable - - - - - - - - - -
Long positions - - - - - - - - - -
Short positions - - - - - - - - - -
C.4 Irrevocable funding commitments - - - - - - - - - -
Long positions - - - - - - - - - -
Short positions - - - - - - - - - -
C.5 Guarantees granted - - - - - - - - - -
C.6 Guarantees received - - - - - - - - - -
C.7 Financial derivatives with underlying asset exchange
Long positions - - - - - - - - - -
Short positions - - - - - - - - - -
C.8 Financial derivatives without underlying asset exchange - - - - - - - - - -
Long positions
Short positions - - - - - - - - - -
1. Maturity analysis: position for contractual residual life of financial assets and liabilities Currency of denomination: GB Pound
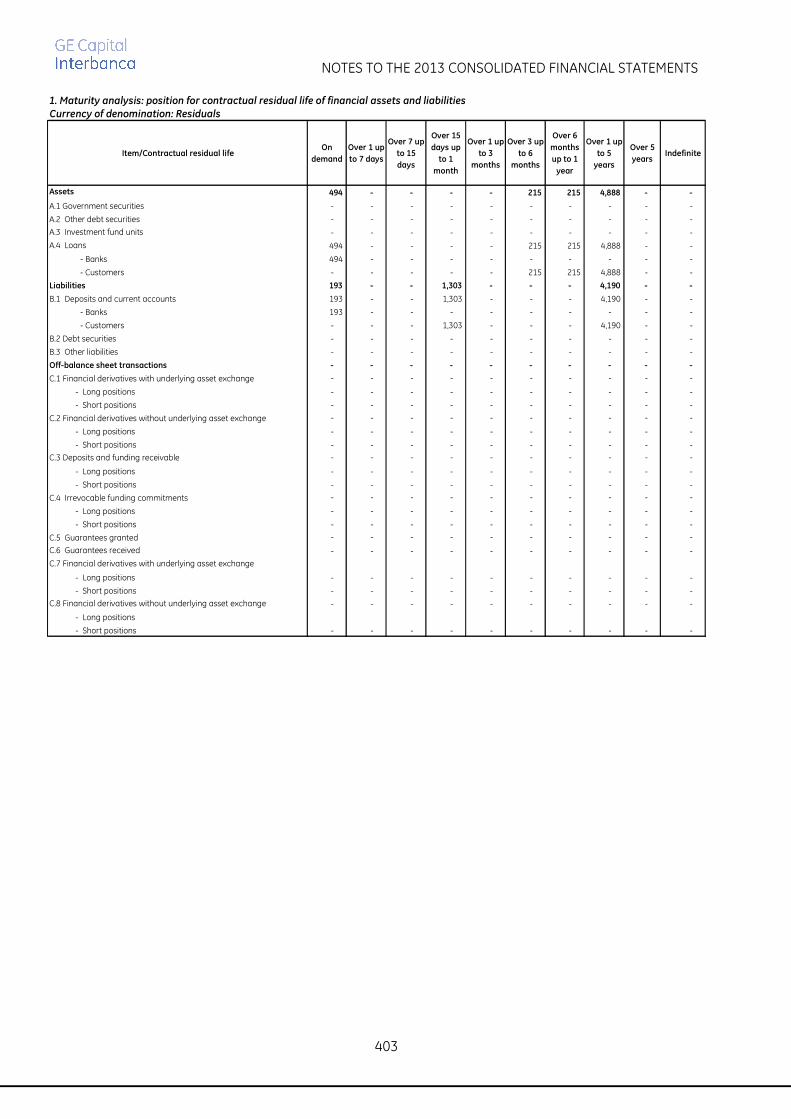
NOTES TO THE 2013 CONSOLIDATED FINANCIAL STATEMENTS
403
Item/Contractual residual lifeOn
demand
Over 1 up
to 7 days
Over 7 up
to 15
days
Over 15
days up
to 1
month
Over 1 up
to 3
months
Over 3 up
to 6
months
Over 6
months
up to 1
year
Over 1 up
to 5
years
Over 5
yearsIndefinite
Assets 494 - - - - 215 215 4,888 - -
A.1 Government securities - - - - - - - - - -
A.2 Other debt securities - - - - - - - - - -
A.3 Investment fund units - - - - - - - - - -
A.4 Loans 494 - - - - 215 215 4,888 - -
- Banks 494 - - - - - - - - -
- Customers - - - - - 215 215 4,888 - -
Liabilities 193 - - 1,303 - - - 4,190 - -
B.1 Deposits and current accounts 193 - - 1,303 - - - 4,190 - -
- Banks 193 - - - - - - - - -
- Customers - - - 1,303 - - - 4,190 - -
B.2 Debt securities - - - - - - - - - -
B.3 Other liabilities - - - - - - - - - -
Off-balance sheet transactions - - - - - - - - - -
C.1 Financial derivatives with underlying asset exchange - - - - - - - - - -
Long positions - - - - - - - - - -
Short positions - - - - - - - - - -
C.2 Financial derivatives without underlying asset exchange - - - - - - - - - -
Long positions - - - - - - - - - -
Short positions - - - - - - - - - -
C.3 Deposits and funding receivable - - - - - - - - - -
Long positions - - - - - - - - - -
Short positions - - - - - - - - - -
C.4 Irrevocable funding commitments - - - - - - - - - -
Long positions - - - - - - - - - -
Short positions - - - - - - - - - -
C.5 Guarantees granted - - - - - - - - - -
C.6 Guarantees received - - - - - - - - - -
C.7 Financial derivatives with underlying asset exchange
Long positions - - - - - - - - - -
Short positions - - - - - - - - - -
C.8 Financial derivatives without underlying asset exchange - - - - - - - - - -
Long positions
Short positions - - - - - - - - - -
1. Maturity analysis: position for contractual residual life of financial assets and liabilities Currency of denomination: Residuals
NOTES TO THE 2013 CONSOLIDATED FINANCIAL STATEMENTS
404
1.4 Banking Group - Operational Risks
Qualitative disclosure
A.General characteristics, operational risk management processes and
measurement methods
Operational risk (in reference to Basel II provisions) relates to the risk of suffering losses due to the
following categories of causal factors: human resources, processes, technology systems and external
events. Operational risk includes legal risk, or the risk of losses resulting from violations of law or
regulations, from contractual or extra-contractual liability or from other disputes. Strategic risk and
reputational risk are not included in operational risk.
To determine minimal capital requirements for operational risks, GE Capital Interbanca Group
adopted the Basic Indicator Approach (BIA) methodology. According to regulatory instructions, the
minimum compulsory capital requirement is calculated as 15% of the average of the net interest and
other banking income over the last three years.
The operational risk management framework adopted by GE Capital Interbanca Group reflects the
requirements of the Parent Company GE Capital Corporation (GECC), which defines the overall
operational risk management framework and establishes the rules and organisational processes for
measuring, managing and controlling these risks.
The Banking Group’s operational risk management processes are coordinated by the Operational
Risk Department, which is part of Enterprise Risk Management and Risk Analytics (ERM – RA).
The processes activated within the Banking Group as part of the operational risk management
framework are:
• Internal Loss Data (ILD): structured process for collecting data on the Banking Group’s
operational losses;
• Risk Control Self Assessment (RCSA): a prospective valuation of the potential operational risks
to which the Banking Group is exposed;
• Issue Management: process in which the operational anomalies that emerged from LDC and
RCSA are managed and resolved.
In 2013, the Operational Risk Department supported the implementation project for a new
technology platform dedicated to managing information related to Enterprise Risk Management. The
project was coordinated by the Parent Company GECC and included the adoption of a modular
technology solution to replace the current tools used by Enterprise Risk Management, Internal Audit
and Compliance, developed by a third party and to be extended to all subsidiary legal entities. With
regards to Enterprise Risk Management, the system will become the primary tool for managing the
processes of the operational risk framework, including the implementation of modules for the RCSA
process, for the collection of information on events and operational losses, for reporting of the Key

NOTES TO THE 2013 CONSOLIDATED FINANCIAL STATEMENTS
405
Risk Indicators and for managing issues that emerge from the detection and measurement
processes.
During 2013, the Issue Management module was released into production and the first user
acceptance tests were conducted on the RCSA module. At the same time the ERM – RA OpRisk
Department began activities to adapt the RCSA process and the related management tools currently
in place, in order to integrate them into the new system, with the objective of enhancing the system
functionality that doesn’t fully meet the needs of GE Capital Interbanca Group.
The Internal Loss Data Collection process currently in use classifies operational losses according to
risk categories defined by regulatory authorities, listed below:
• Internal fraud: losses due to unauthorised activities, fraud, misappropriation of funds or
violations of law, regulations, or company directives that involve at least one internal
resource of the intermediary;
• External fraud: losses due to fraud, misappropriation of funds or violations of law by parties
external to the intermediary;
• Employee relations and work-place safety: losses from actions that do not comply with the
law or contracts regarding employment, health and work-place safety, from the payment of
damages from personal injuries or from discrimination or the lack of application of equal
conditions;
• Customers, products and operational practices: losses from non-compliance with
professional obligations to customers or from the nature or characteristics of the product or
service provided;
• Damage to property: losses from external events, such as natural catastrophes, vandalism,
terrorism, etc.;
• Interruption of operations and system malfunctions: losses from interruptions to operations
and system malfunctions or unavailability;
• Process execution, delivery and management: losses due to issues in completing transactions
or process management, as well as losses due to relationships with commercial, seller or
supplier counterparties.
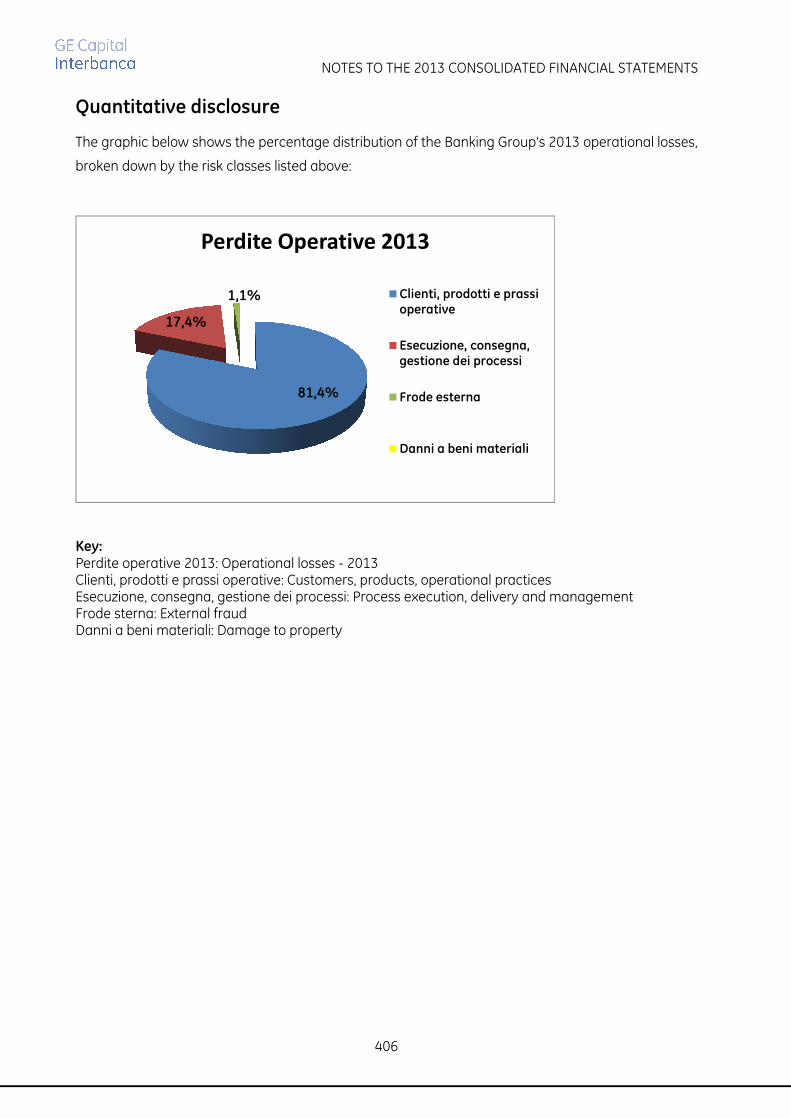
NOTES TO THE 2013 CONSOLIDATED FINANCIAL STATEMENTS
406
Quantitative disclosure
The graphic below shows the percentage distribution of the Banking Group’s 2013 operational losses,
broken down by the risk classes listed above:
81,4%
17,4%
1,1%
Perdite Operative 2013
Clienti, prodotti e prassioperative
Esecuzione, consegna,gestione dei processi
Frode esterna
Danni a beni materiali
Key: Perdite operative 2013: Operational losses - 2013 Clienti, prodotti e prassi operative: Customers, products, operational practices Esecuzione, consegna, gestione dei processi: Process execution, delivery and management Frode sterna: External fraud Danni a beni materiali: Damage to property
NOTES TO THE 2013 CONSOLIDATED FINANCIAL STATEMENTS
407
Part F
INFORMATION ON CAPITAL

NOTES TO THE 2013 CONSOLIDATED FINANCIAL STATEMENTS
408
Section 1
Equity
Qualitative disclosure
As part of its capital management activities, the Group must ensure that the capital endowment and
the related capital ratios are consistent with the risk profile assumed and are compliant with
regulatory requirements.
The objective of the Capital Planning process is to forecast the internal allocation of capital as a
result of risks related to 2013 activities, in line with the operating plan.
The analysis relates to trends in the Banking Group’s financial situation. Based on the forecasted
results for the following year, the Parent Company decides if implementing its business plan would
required an increase in capital to maintain an adequate capital level.
Based on the analysis described above, the Group’s strategic planning process consists of the
following phases:
• Blue Print 2 (BP2) - carried out in the first quarter to confirm or revise the budgeted financial
results for the year in progress and provide a forecast of the objectives for the following 2
years and the strategies for achieving them;
• Mid Year Stress Test (MYST) - carried out in the second quarter to provide a forecast of the
objectives for the year in progress and the following 2 years under one or more macro-
economic stress scenarios;
• Blue Print 4 (BP4) - carried out in the third quarter to confirm or revise the budgeted financial
results for the year in progress and determine the investments and growth plans for the
following 2 years; in addition, the financial results for the subsequent year are determined.
• Year End Stress Test (YEST) - carried out in the fourth quarter to provide a forecast of the
objectives for the year in progress and the following 2 years under one or more macro-
economic stress scenarios;
In order to significantly strengthen the Group’s capital position, the General Electric Group has
transferred all of its equity investments in financial companies in Italy to the Bank, between 2010 and
the present.
As a result of this change, capital management at the Group level is even more important and
strategic, given that the quality and level of capital resources of the individual companies that make
up the Group must be defined as part of the more general objectives of the Group.
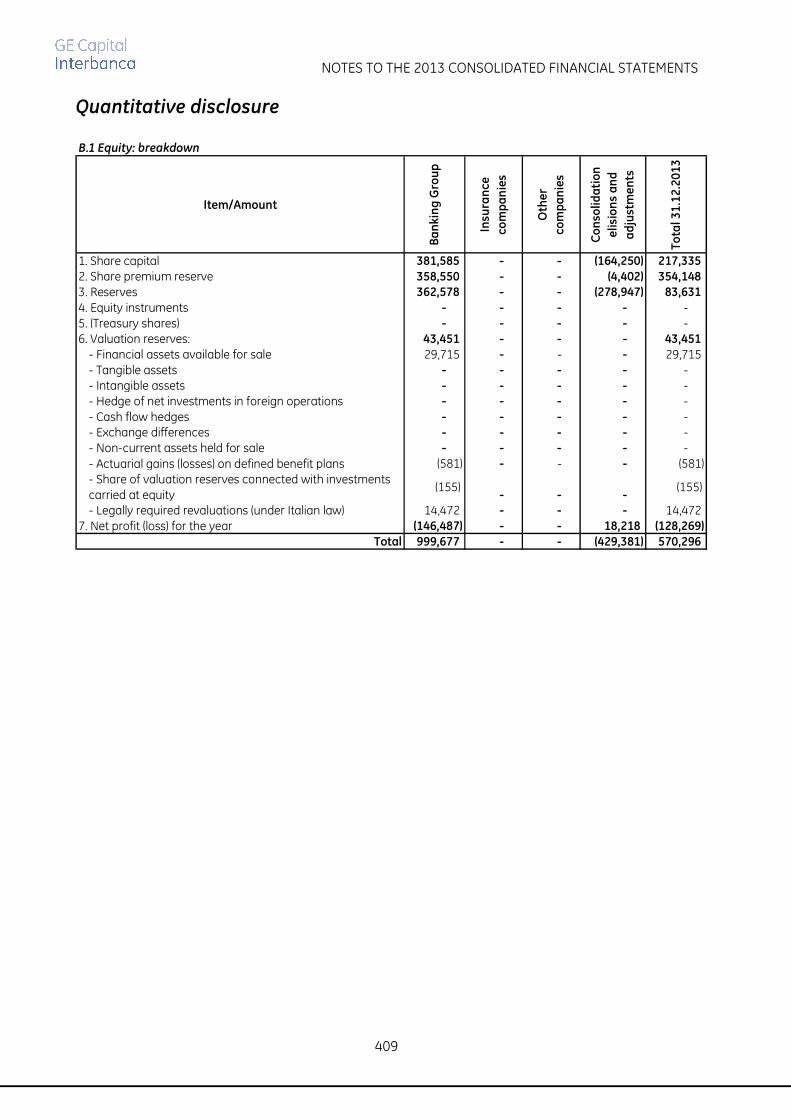
NOTES TO THE 2013 CONSOLIDATED FINANCIAL STATEMENTS
409
Quantitative disclosure
B.1 Equity: breakdown
Item/Amount
Ba
nk
ing
Gro
up
Insu
ran
ce
co
mp
an
ies
Oth
er
co
mp
an
ies
Co
nso
lid
ati
on
eli
sio
ns
an
d
ad
just
me
nts
To
tal
31
.12
.20
13
1. Share capital 381,585 - - (164,250) 217,335
2. Share premium reserve 358,550 - - (4,402) 354,148
3. Reserves 362,578 - - (278,947) 83,631
4. Equity instruments - - - - - 5. (Treasury shares) - - - - - 6. Valuation reserves: 43,451 - - - 43,451
- Financial assets available for sale 29,715 - - - 29,715 - Tangible assets - - - - - - Intangible assets - - - - - - Hedge of net investments in foreign operations - - - - - - Cash flow hedges - - - - - - Exchange differences - - - - - - Non-current assets held for sale - - - - -
- Actuarial gains (losses) on defined benefit plans (581) - - - (581) - Share of valuation reserves connected with investments carried at equity
(155)- - -
(155)
- Legally required revaluations (under Italian law) 14,472 - - - 14,472 7. Net profit (loss) for the year (146,487) - - 18,218 (128,269)
Total 999,677 - - (429,381) 570,296

NOTES TO THE 2013 CONSOLIDATED FINANCIAL STATEMENTS
410
B.2 Valuation reserves for financial assets available for sale: breakdown
Positive
Reserve
Negative
Reserve
Positive
Reserve
Negative
Reserve
1. Debt securities 35 (321) 258 (1,096)
2. Equities 30,002 - 26,185 -
3. Investment fund units - - - -
4. Loans - - - -
Total 30,037 (321) 26,443 (1,096)
Asset/Amount
Total 31.12.2013 Total 31.12.2012
B.3 Valuation reserves for financial assets available for sale: annual changes
Debt securities EquitiesInvestment
Fund UnitsLoans
1. Opening balance (838) 26,185 - -
2. Positive changes 809 7,171 - -
2.1 Increases in fair value 809 6,008 - -
2.2 Reversal of negative reserves through the income statement - - - -
- from impairment - - - -
- realised - - - -
2.3 Other changes - 1,163 - -
3. Negative changes 257 3,354 - -
3.1 Decreases in fair value 257 3,354 - -
3.2 Impairment recoveries - - - -
3.3 Reversal of positive reserves: through the income statement - - - -
3.4 Other changes - - - -
4. Closing balance (286) 30,002 - -
NOTES TO THE 2013 CONSOLIDATED FINANCIAL STATEMENTS
411
Section 2
Regulatory Capital and Ratios
Qualitative disclosure
Regulatory capital represents a much broader definition of capital than the legal notion of
shareholders’ equity; in addition to share capital and reserves, it also includes a range of positive and
negative elements which are admissible within certain limitations.
1. Tier 1 Capital
The main items in the consolidated Tier 1 Capital are share capital, reserves and share premium
reserves, net of intangible assets and negative reserves on available-for-sale instruments.
This figure does not include any innovative capital instruments admissible as regulatory capital, as
the Banking Group does not currently have any in issue.
2. Tier 2 Capital
Consolidated Tier 2 Capital includes real estate valuation reserves, 50% of the positive reserves on
available-for-sale instruments and subordinated liabilities.
A brief description of the main contractual characteristics of the outstanding subordinated
instrument as at 31 December 2013 is given below.
� It is denominated in Euro and was issued for a total of € 200 million, which is its value as at
31 December 2013. The expiration date is 10 October 2016;
� Interest is paid quarterly at a variable rate based on the 3-month Euribor plus a spread of
0.28%;
� The loan may be repaid entirely or partially after the fifth anniversary of the disbursement
date;
� In the event of liquidation of GE Capital Interbanca S.p.A., the loan qualifies as subordinated
as it is to be repaid only after the claims of all other creditors have been fully met.

NOTES TO THE 2013 CONSOLIDATED FINANCIAL STATEMENTS
412
Quantitative disclosure
31.12.2013 31.12.2012A. Tier 1 Capital before application of prudential filters 523,126 643,317
B. Tier 1 Capital prudential filters (286) (838) - Positive IAS/IFRS prudential filters - Negative IAS/IFRS prudential filters (286) (838) C. Tier 1 Capital after application of prudential filters 522,840 642,479
D. Items to be deducted from Tier 1 CapitalE. Total Tier 1 Capital 522,840 642,479
F. Tier 2 Capital before application of prudential filters 164,474 200,657
G. Tier 2 Capital prudential filters (15,001) (13,092) - Positive IAS/IFRS prudential filters - - - Negative IAS/IFRS prudential filters (15,001) (13,092) H. Tier 2 Capital after application of prudential filters 149,473 187,565
I. Items to be deducted from Tier 2 Capital - -
L. Total Tier 2 Capital 149,473 187,565
M. Items to be deducted from Total Tier 1 and Tier 2 Capital - -
N. Regulatory capital 672,313 830,044
O. Tier 3 Capital - -
P. Regulatory capital including Tier 3 Capital 672,313 830,044

NOTES TO THE 2013 CONSOLIDATED FINANCIAL STATEMENTS
413
2.3 – Capital adequacy
Qualitative disclosure
Regulatory capital represents the first defence against the various risks connected with banking
activity and, with a forward-looking perspective, the capital level constitutes a fundamental tool in
developing business independence while protecting the Group’s stability.
Through 31 December 2013, the Banking Group was subject to the capital adequacy requirements
established by the Basel Committee according to the rules defined by Bank of Italy in Circular no. 263
of 27 December 2006, “New provisions of prudential supervision for banks” and subsequent
amendments.
Regulatory Instructions require the measurement/valuation of risks to which the Group is exposed
both currently (end of the previous financial year) and prospectively (end of the current financial year)
and under stress assumptions (negative scenarios that may occur under future risks) as well as self-
evaluation of capital adequacy (total capital) against total risk (total internal capital). These activities
make up the ICAAP process.
The ICAAP process adopted by the GE Capital Interbanca Banking Group has a risk-based
methodology. The Group determines its risk profile, evaluating the primary risks and controls and
then establishes its risk propensity for each risk.
After defining its risk propensity, the Group assesses the risks deemed relevant and the need to
allocate capital. In order to anticipate any changes in the portfolio structure, the Group projects
capital absorption for each risk for the subsequent year. Based on the forecasted capital absorption,
the Group defines its capital objective (Target Solvency Ration – TSR), which represents the total
capital to be held in relation to its risk profile.
Additionally, the Group prepares a hypothetical worst-case scenario to verify its capital adequacy
under stress, and if necessary, identify the necessary actions to maintain the desired capital level.
The ICAAP Report as at 31 December 2012 defined the Target Solvency Ratio at 9.5%, following
adequacy analyses on internal capital measured on First and Second Pillar risks.
Following the Supervisory Review and Evaluation Process (SREP) conducted in 2013, the Bank of Italy,
in reviewing the capital objectives for the leading intermediaries in the banking system, requested
the Bank (in Protocol no. 144784/14 of 10 February 2014), as Parent Company, to maintain a
consolidated Common Equity Tier 1 ratio greater than 9.5% and a consolidated Total Capital ratio of
at least 11.5%.
As at 31 December 2013, GE Capital Interbanca S.p.A., as Parent Company of the Banking Group with
the same name, meets the capital requirements indicated above, with a consolidated Common
Equity Tier 1 ratio of 13.2% and Total Capital ratio of 17.0%.

NOTES TO THE 2013 CONSOLIDATED FINANCIAL STATEMENTS
414
Quantitative disclosure
B. Quantitative disclosure
Total 31.12.2013Total
31.12.2012Total 31.12.2013 Total 31.12.2012
A. RISK ASSETS
A.1 CREDIT AND COUNTERPARTY RISKS 4,455,881 5,011,531 3,792,660 4,346,110
1. Standard methodology 4,455,881 5,011,531 3,792,660 4,346,110
2. Internal rating methodology - - - -
2.1 Basic - - - -
2.2 Advanced - - - -
3. Securitisation - - - -
B. CAPITAL REQUIREMENTS
B.1 CREDIT AND COUNTERPARTY RISKS 303,413 347,688
B.2 MARKET RISKS 632 592
1. Standard methodology 632 592
2. Internal models - -
3. Concentration risk - -
B.3 OPERATIONAL RISK 12,513 14,083
1. Basic method 12,513 14,083
2. Standard method
3. Advanced method
B.4 OTHER CAPITAL REQUIREMENTS - -
B.5 OTHER CALCULATION ELEMENTS - -
B.6 TOTAL CAPITAL REQUIREMENTS 316,558 362,363
C. RISK ASSETS AND REGULATORY RATIOS
C.1 Risk-weighted assets 3,956,976 4,529,550
C.2 Tier 1 Capital/Risk-weighted assets
(Tier 1 Capital ratio) 13.2% 14.2%
C.3 Regulatory Capital/Risk-weighted assets
(Total Capital ratio) 17.0% 18.3%
Category/Amount
Unweighted amounts Weighted amounts/requirements
Notes to the 2013 Consolidated Financial Statements
415
Part G
BUSINESS COMBINATIONS Not applicable

Notes to the 2013 Consolidated Financial Statements
416
(empty page)

Notes to the 2013 Consolidated Financial Statements
417
Part H
RELATED PARTY TRANSACTIONS

Notes to the 2013 Consolidated Financial Statements
418
1. Compensation for key management personnel
In thousands of Euros 31.12.2013
Directors 62
Board of Statutory Auditors & Supervisory Board 618
Managers 4,505
of which: short-term employee benefits 4,300
post-employment benefits 198
stock options 7
Total 5,185
The compensation indicated above refers to the Directors and Auditors of the companies in the
scope of consolidation as well as Parent Company Managers with strategic responsibilities, as
defined by the Regulation on Related Parties, who held such offices even for only a portion of 2013,
and is disclosed in accordance with the requirements of IAS 24, paragraph 16.
2. Information on transactions with related parties
PARENT COMPANY
GE Capital Corporation Inc. SUBSIDIARIES OF THE BANKING GROUP
GE Capital Interbanca S.p.A. - Parent Company of the Banking Group;
GE Capital Servizi Finanziari S.p.A.
GE Capital Finance S.r.l.
GE SPV S.r.l.
SUBSIDIARIES NOT BELONGING TO THE BANKING GROUP, INCLUDED IN THE SCOPE OF CONSOLIDATION
GE Capital Services S.r.l.

Notes to the 2013 Consolidated Financial Statements
419
RELATED PARTIES - SUMMARY AS AT 31 DECEMBER 2013
DescriptionControlling
entity
Entities
exercising
significant
influence
Subsidiaries Associates Joint ventures
Key
management
personnel
Other
related
parties
TOTAL
RELATED
PARTIES (A)
TOTAL GE CAPITAL
SPA GROUP (B)% A/B
FINANCIAL ASSETS AVAILABLE FOR
SALE53,263 53,263 115,228 46.2
LOANS TO CUSTOMERS 1,527 2,869 4,396 3,658,308 0.1
OTHER ASSETS 2,358 2,358 92,311 2.6
TOTAL - - - 53,263 - 1,527 5,227 60,017 3,865,847 1.6
DUE TO CUSTOMERS 123,502 3,342,936 3,466,438 3,629,261 95.5
OTHER LIABILITIES 378 1,977 2,355 119,903 2.0
TOTAL 123,880 - - - - - 3,344,913 3,468,793 3,968,869 87.4
GUARANTEES 52,916 52,916 139,503 37.9
INCOME 17 19 36 140,389 0.0
EXPENSE (37,299) (37,299) (50,102) 74.4 COMMISSION INCOME AND SIMILAR
REVENUES3,058 2,064 5,122 15,750 32.5
COMMISSION EXPENSE AND SIMILAR
CHARGES(671) (671) (3,417) 19.6
ADMINISTRATIVE EXPENSES 21 (4,505) (18,252) (22,736) (108,116) 21.0
GAINS/LOSSES ON DISPOSAL 336 336 562 59.8
OTHER EXPENSE/INCOME 3 (874) (871) 58,372 (1.5)
TOTAL 3,082 - - 336 - (4,488) (55,013) (56,083) (123,781) 45.3
OTHER
ASSETS
LIABILITIES
INTEREST
FEES AND
COMMISSIONS

Notes to the 2013 Consolidated Financial Statements
420
(empty page)

Notes to the 2013 Consolidated Financial Statements
421
Part I
SHARE-BASED PAYMENTS
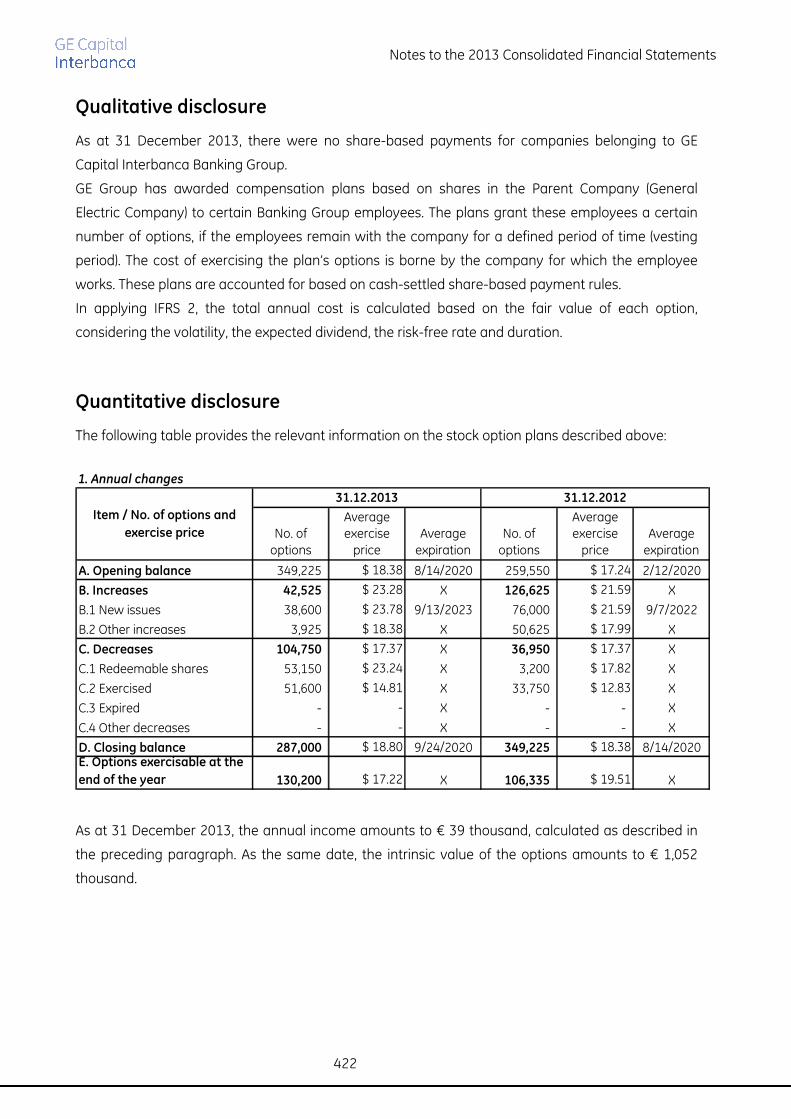
Notes to the 2013 Consolidated Financial Statements
422
Qualitative disclosure
As at 31 December 2013, there were no share-based payments for companies belonging to GE
Capital Interbanca Banking Group.
GE Group has awarded compensation plans based on shares in the Parent Company (General
Electric Company) to certain Banking Group employees. The plans grant these employees a certain
number of options, if the employees remain with the company for a defined period of time (vesting
period). The cost of exercising the plan’s options is borne by the company for which the employee
works. These plans are accounted for based on cash-settled share-based payment rules.
In applying IFRS 2, the total annual cost is calculated based on the fair value of each option,
considering the volatility, the expected dividend, the risk-free rate and duration.
Quantitative disclosure
The following table provides the relevant information on the stock option plans described above:
1. Annual changes
No. of options
Average exercise
priceAverage
expirationNo. of
options
Average exercise
priceAverage
expiration
A. Opening balance 349,225 $ 18.38 8/14/2020 259,550 $ 17.24 2/12/2020
B. Increases 42,525 $ 23.28 X 126,625 $ 21.59 X
B.1 New issues 38,600 $ 23.78 9/13/2023 76,000 $ 21.59 9/7/2022
B.2 Other increases 3,925 $ 18.38 X 50,625 $ 17.99 X
C. Decreases 104,750 $ 17.37 X 36,950 $ 17.37 X
C.1 Redeemable shares 53,150 $ 23.24 X 3,200 $ 17.82 X
C.2 Exercised 51,600 $ 14.81 X 33,750 $ 12.83 X
C.3 Expired - - X - - X
C.4 Other decreases - - X - - X
D. Closing balance 287,000 $ 18.80 9/24/2020 349,225 $ 18.38 8/14/2020E. Options exercisable at the
end of the year 130,200 $ 17.22 X 106,335 $ 19.51 X
Item / No. of options and
exercise price
31.12.2013 31.12.2012
As at 31 December 2013, the annual income amounts to € 39 thousand, calculated as described in
the preceding paragraph. As the same date, the intrinsic value of the options amounts to € 1,052
thousand.

Notes to the 2013 Consolidated Financial Statements
423
Part L
SEGMENT REPORTING

Notes to the 2013 Consolidated Financial Statements
424
SEGMENT REPORTING
Segment reporting reflects the organisational structure used in reporting Banking Group results,
broken down into the following activities: corporate & investment banking, leasing and factoring.
A.1 - Segment reporting: financial data
In thousands of Euros
CORPORATE &
INVESTMENT
BANKING
LEASING
(REGULATED)
LEASING
(NOT REGULATED)FACTORING
OTHER
COMPANIES
INCLUDING
ELISIONS AND
ADJUSTMENTS
TOTAL
CONSOLIDATED AS
AT 31.12.2013
Net interest margin 44,567 23,032 20,744 1,863 81 90,287
Net fee and commission income 5,662 4,835 (889) 2,725 - 12,333
Dividends and similar revenues 2,136 - 2,136 Profits (Losses) on trading (13,922) - - - (13,922) Net result of hedge accounting (97) - - - (97) Gains on disposal of merchant banking assets 562 - - - 562 Net result of assets and liabilities recognised at fair value - - - - - Net interest and other banking income 38,908 27,867 19,855 4,588 81 91,299
Operating income (97,065) 283 6,558 4,223 81 (85,920)
Personnel expenses (31,375) (12,496) (11,412) (3,879) 12 (59,150) Other administrative expenses (29,072) (13,045) (9,538) (3,693) 6,382 (48,966) Net provisions for risks and charges (710) 59 (1,210) (328) - (2,189) Amortisation, depreciation and property disposals (2,057) (645) (35,150) (248) - (38,100) Other operating expense/income 4,795 6,276 53,616 135 (6,450) 58,372 Operating expenses (58,419) (19,851) (3,694) (8,013) (56) (90,033)
Gain (Loss) on equity investments (16,851) (1,367) - 18,218 - Pre-tax profit (loss) (172,335) (20,935) 2,864 (3,790) 18,243 (175,953)
Income tax 44,066 6,135 6,411 372 (8) 56,976 Profit (Loss) for the year (128,269) (14,800) 9,275 (3,418) 18,235 (118,977)
A.2 - Segment reporting: balance sheet data and total risk-weighted assets (RWA)
In thousands of Euros
CORPORATE &
INVESTMENT
BANKING
LEASING
(REGULATED)
LEASING
(NOT REGULATED)FACTORING
OTHER
COMPANIES
INCLUDING
ELISIONS AND
ADJUSTMENTS
TOTAL
CONSOLIDATED AS
AT 31.12.2013
Due from banks and loans to customers 2,341,225 990,876 332,050 231,635 (639) 3,895,147
Due to banks and customers 2,298,248 860,721 369,023 113,874 (648) 3,641,218
Total risk-weighted assets (Basel II) 2,917,800 804,477 N/A 234,797 3,957,073
(177,219)
Net impairments / reversals on loans, financial assets and guarantees issued (135,973) (27,584) (365) - (13,297)
In reference to the revenue breakdown by geographic area, the figures indicated above are
produced almost exclusively in Italy based on relationships with Italian customers. Parent Company
properties are also located exclusively in Italy.
There are no individual customers whose revenues represent 10% of the total Group revenues.
Notes to the 2013 Consolidated Financial Statements
425
Certification of the Financial Statements pursuant to article 154-bis of
Legislative Decree no. 58 of 24 February 1998
The undersigned, Paolo Braghieri and Ettore Colombo, in their capacities as Chief Executive Officer and
Executive charged with preparing the financial reports of GE Capital Interbanca S.p.A., in accordance
with the provisions of art. 154-bis, paragraphs 3 and 4 of Legislative Decree no. 58 of 24 February
1998, do certify:
• The adequacy of the financial reports with regard to the characteristics of the business, and
• The actual implementation of the administrative and accounting procedures for preparing the
2013 Financial Statements.
Furthermore, we attest that the Consolidated Financial Statements as at 31 December 2013:
a) Have been prepared under international accounting standards recognised by the European
Community in compliance with EC Regulation no. 1606/2002 of the European Parliament and
European Council decision of 19 July 2002, as well as implementing regulations issued in relation
to art. 9 of Legislative Decree no. 38 of 28 February 2005;
b) Correspond to the books and accounting entries;
c) Provide a true and correct representation of the equity, economic and financial position of the
Issuer and the companies includes in the scope of consolidation.
The Directors’ Report on Operations includes an accurate analysis of performance and operating results,
as well as the situation of the Issuer and the companies included in the scope of consolidation, together
with a description of the principal risks and uncertainties to which they are exposed.
Milan, 13 March 2014
Paolo Braghieri Ettore Colombo
Chief Executive Officer Executive charged with preparing
[signature] the company's financial statements
[signature]

Notes to the 2013 Consolidated Financial Statements
426
(empty page)

Notes to the 2013 Consolidated Financial Statements
427
REPORT OF THE ACCOUNTING AUDIT FIRM
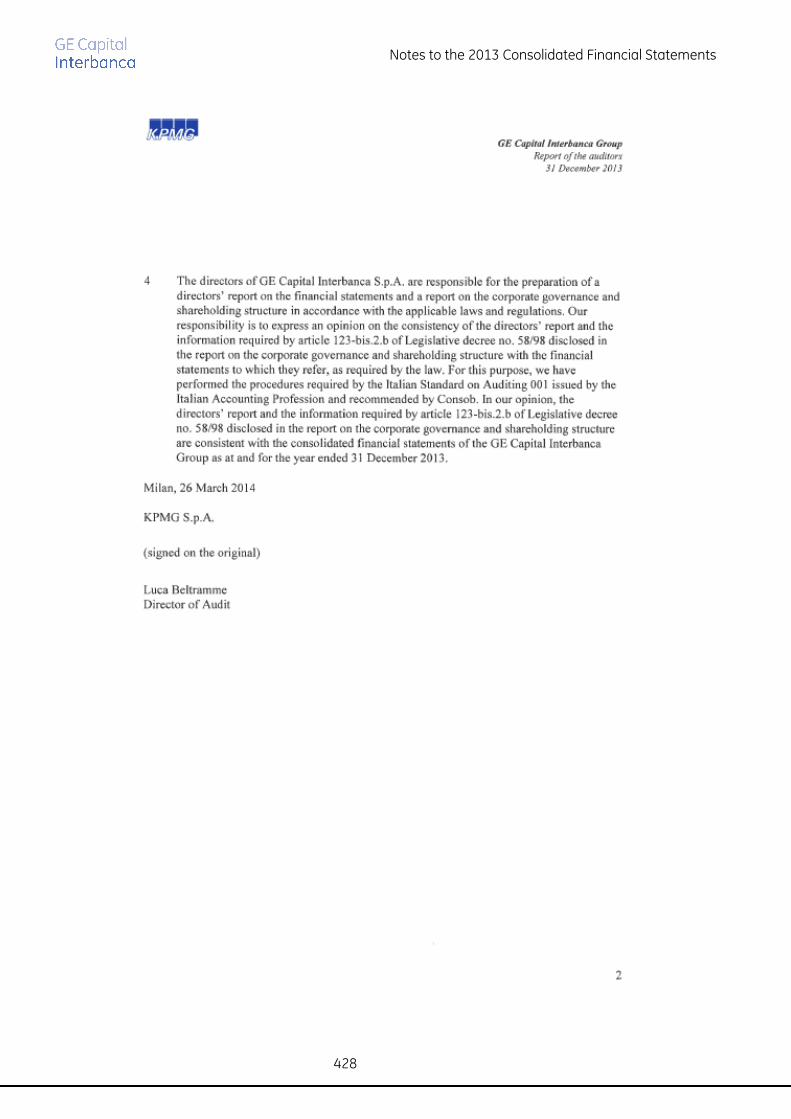
Notes to the 2013 Consolidated Financial Statements
428
Notes to the 2013 Consolidated Financial Statements
429
OFFICES
GE Capital Interbanca S.p.A.
Registered office and General Management Corso Venezia 56 – 20121 Milan, Italy
North West Area Branch - Corso Venezia, 56 – 20121 Milan
North East Area Branch - Via Fornace Morandi, 24 – 35133 Padua
Central South Area Branch - Via F. Cesi, 72– 00193 Rome
Bologna Branch - Via Emilia Ponente, 317– 40125 Bologna
Brescia Branch – Viale Venezia, 210 – 25123 Brescia
GE Capital Finance S.r.l. Registered office Via Borghetto 5 – 20122 Milan
Operating headquarters Piazza Indro Montanelli 20 – 20099 Sesto San Giovanni (Milan)
GE Capital Servizi Finanziari S.p.A. Registered office and operating headquarters Via Vecchia di Cuneo 136 – 12084 Loc. Pogliola
Mondovì (Cuneo)
GE Capital Services S.r.l. Registered office Via Giuseppe Rosaccio, 33 - 00156 Rome
Operating headquarters Piazza Indro Montanelli 20 – 20099 Sesto San Giovanni (Milan)