Embed Size (px)
Citation preview

Senvion SA
Annual Results Presentation 2017 March 15, 2018

1
Disclaimer
This presentation (the “Presentation”) has been prepared by Senvion S.A. (“Senvion” and together with its subsidiaries, “we,” “us” or the “Group”)
solely for informational purposes and has not been independently verified, and no representation or warranty, express or implied, is made or given
by or on behalf of the Group. Senvion reserves the right to amend or replace this Presentation at any time. This Presentation is valid only as of its
date, and Senvion undertakes no obligation to update the information in this Presentation to reflect subsequent events or conditions. This
Presentation may not be redistributed or reproduced in whole or in part without the consent of Senvion. Any copyrights that may derive from this
Presentation shall remain the sole property of Senvion.
This Presentation does not constitute or form part of, and should not be construed as, an offer or invitation or inducement to subscribe for,
underwrite or otherwise acquire, any securities of Senvion, nor should it or any part of it form the basis of, or be relied on in connection with, any
investment decision with respect to securities of Senvion or any other company.
Certain statements in this Presentation are forward-looking statements. By their nature, forward-looking statements involve a number of risks,
uncertainties and assumptions that could cause actual results or events to differ materially from those expressed or implied by the forward-looking
statements. These risks, uncertainties and assumptions could adversely affect the outcome and financial consequences of the plans and events
described herein. Actual results may differ from those set forth in the forward-looking statements as a result of various factors (including, but not
limited to, future global economic conditions, changed market conditions affecting the wind industry, intense competition in the markets in which the
Group operates, costs of compliance with applicable laws, regulations and standards, diverse political, legal, economic and other conditions
affecting the Group’s markets, and other factors beyond the control of the Group). Neither Senvion nor any of its respective directors, officers,
employees, advisors, or any other person is under any obligation to update or revise any forward-looking statements, whether as a result of new
information, future events or otherwise. You should not place undue reliance on forward-looking statements, which speak of the date of this
Presentation. Statements contained in this Presentation regarding past trends or events should not be taken as a representation that such trends or
events will continue in the future. In particular, no statements in this Presentation should be construed as concrete guidance as to the results of
operations, cash-flows, balance sheet data or any non-financial metrics as of or for the financial year ending December 31, 2017 or any subsequent
financial period.
Certain financial data included in the presentation consists of “non-IFRS financial measures”. These non-IFRS financial measures may not be
comparable to similarly titled measures presented by other companies, nor should they be construed as an alternative to financial measures
determined in accordance with IFRS. You are cautioned not to place undue reliance on any non-IFRS financial measures and ratios included herein.
This Presentation does not constitute or contain any investment, legal, accounting, regulatory, taxation or other advice.
Due to rounding, numbers presented through out this and other documents may not add up precisely to the totals provided and percentages may not
precisely reflect the absolute figures.
2
Strategic roadmap and guidance 2018 4
Financials 2017 3
Orders and installations 2
Key achievements 2017 1
Agenda
Key takeaways 5

Key achievements 2017 Building a growth platform for 2019
1

4
2017 – key highlights at a glance Making progress against continuing industry headwinds
CY17 revenues at €1,890mn with adjusted EBITDA of €152mn
Cash on hand improved to € 235mm; net cash generation of €47mn in Q4
Working capital at 2.5% ; likely to become negative by Q2 on commissioning of the Chile project
Financials
1
36% growth yoy in firm orders; 393% growth in new markets
Ranked 4th largest2 in EMEA in 2017; market share gains in key regions Orders
2
3.6M140 EBC rated as one of the top 3MW+ turbines by WPM1
Progressing on moving supply chain footprint to low cost countries Products
3
Opex savings of 19% from efficiency program;
Interest cost lower by c.28% post refinancing; cash interest cost at €30mn/yr Efficiency
4
Service generates 16% of total revenues with double digit growth
10+ years of contract tenors and renewal rate of ~75% Services
5
+393%
2017 2016
Orders from new markets
Int reduction
(28%)
Opex reduction
(19%)
Reductions in 2017
+15%
2017 2016 2015
Revenue development
2
1 Wind Power Monthly, 2. BNEF Feb 2018 for combined market share in onshore and offshore
Building platform for 2019

5
Achieved
Key highlights Performance in line with guidance
Revenues
Guidance 2017 Achieved
Revenue slightly
lower than expected
due to minor project
delays
Financial targets in 2017 achieved
Adj. EBITDA
at 8.0%
Adj. EBITDA
around 8.0-8.5% Margins
Firm order Intake
1
2017
€1.90-1.95bn
2017
€1.89bn
~€2.0bn
2017
~€1.8bn
2017
Two key order
conversions
delayed
350 MW+ orders
already converted
in India & ANZ

6
Senvion in EMEA and globally Senvion gaining market shares in key regions
2
Market share gains in Germany and France – key current markets
Source – BNEF Report Feb 2018 based on commissioned windfarms; 1. Onshore and Offshore combined
EMEA Region – 2017 market share1 Global (Ex China) – 2017 market share1
11.0%
(2016: 9.6%)
Others
89%
5.7%
(2016: 4.9%)
Others
94.3%
Selective global approach
Aiming for significant market share gains in targeted new markets by 2019
Large player in all key markets
17
GW
34
GW
4 6
7
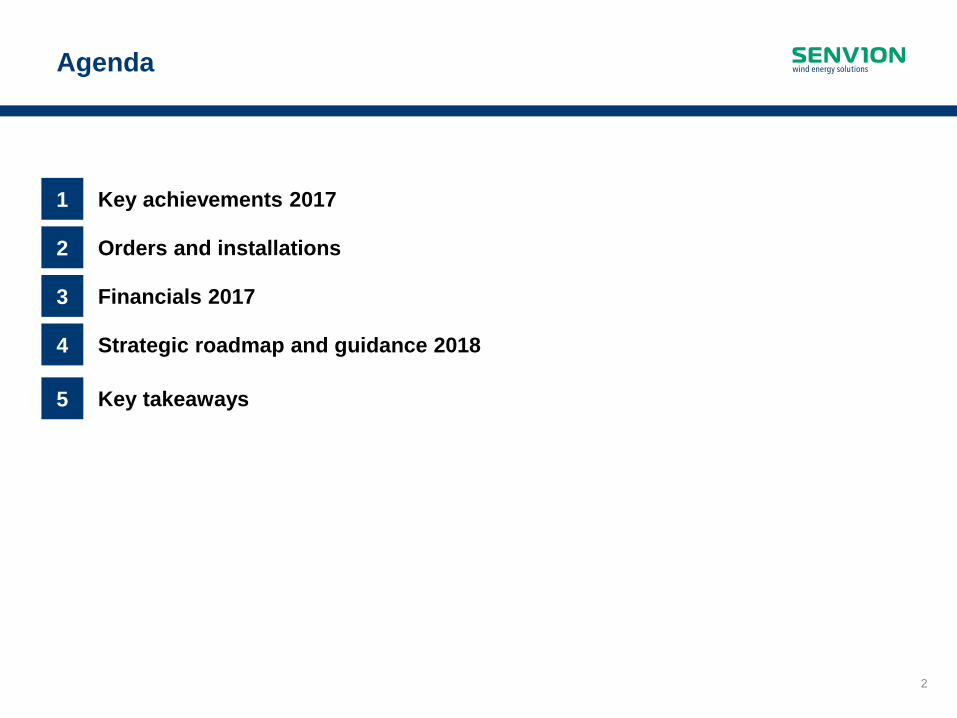
Focus on higher growth markets 393% growth in orders from new markets
Annual Installations (GW)
Current markets Offshore
New markets
Current markets
(Includes firm and conditional orders as of December 2017 plus announced orders as of 15th of March 2018)
Order intake (€m)
New markets
710
2017
-8.7%
2020
28
17
2017
+18.4%
2020
715
145
755
CY 2016
306
1,159
1,304
1,776
~4x
+36%
CY 2017
Current markets: Austria, Belgium, Canada, Germany, France, Italy, Netherlands, Poland, Portugal, UK, New markets: Australia, Eastern EU countries, Egypt, India, Ireland, Japan, LatAm excl. Brazil, MENA, Nordics, Serbia
Source: MAKE consulting, Q4 2017 1. Nordics = Sweden, Norway, Finland, 2. South Cone = LatAm ex Brazil, 3.Others = Eastern Europe, Japan, Ireland, Middle East and Africa, 4. Order pipeline is subject to usual market risks and is not a
guarantee for further market share gains or final conversion into firm orders. *Nordics firm order contract won in 2016 and booked in revenues in 2017
2
CAGR
Strong project pipeline with exclusivity agreements further supports 2019 outlook
Others3 156 MW
India 131 MW
395 MW South
Cone2
Nordics1 117 MW*
Australia Conditional orders
380 MW 432 MW
Total
Progress in new markets leading to achievement of 2019 targets
Country Firm orders Order pipeline4
1,230 MW+ 1,500 MW+
Focused growth strategy
in new markets Firm WTG order intake (€m): + 36% growth yoy
Multiple
exclusivities and
preferred supplier
status in place for
future volumes
Aim to gain market
share in key regions

8
Product philosophy driven by high level of modularity New modular products to drive margin recovery
3MW+ 2.xM
3
Evolution of onshore turbines
2.M 1xx
IEC I
IEC II
IEC
III
2003 - 2014
3MW+ 2.xM
2015 – 2017 (with modular approach)
3MW+ 2.xM
4.M 14x
4.M 14x
2.M 1xx
2018 pipeline
Higher AEP increase with
much lower cost increase
More product variety, with
less component variety
IRR multiplying
effect
Targeting cost
reductions
Competitive offering Project optimized
turbines
Region specific
product fit
4.M 11x

9
MOVE FORWARD Progress card – €52mn fixed cost savings achieved
Consistent and sustainable reduction
in Opex
42363539
5347^
Q4
16
-20%
Q2
16
44^
Q2
17
Q1
16
Q3
17
Q1
17
Q4
17
-18%
-22%
-17%
Q3
16
45^
-28%
56*
2016
40**
2017
^ Adjusted for IPO costs/transaction costs
* Adjusted by shareholder loan interest
** Underlying interest costs without pre payment premium of earlier High yield bond and other related one time expenses of refinancing
LCC = Low cost countries
4
Net interest down by 28%
42% reduction in annual interest
costs of high yield bond
Net Interest (€m) Opex (€m)
DONE
2.7 GW capacity; sufficient for growth
Closed three factories in Germany
Increasing sourcing from LCC
(from sub 5% to 30%+)
Increased
proximity
to growth
markets
DONE
Opex run rate Interest costs Supply chain transformation

10
Key results Key attributes
Growing Service business Efficient set-up to drive resilient and profitable growth
5
Service provides a growing, annuity-like cash flow stream to the business
Significant
growth
Consistent, high growth
Increasing relevance of service
offering
High
visibility
High visibility from €2.5bn service
order book
10+ years2 average duration
providing annuity-like revenue
High renewal rate1 (~75% last 3
years)
High
margins and
cash flow
contribution
Stronger contribution margin v/s
turbine business
~16% share of revenues
Higher FCF contribution
Notes:
1.Turbine renewal rate of service contracts since 2016 based on quarterly data
2.Only includes active contracts and tenors weighted by no. of WTGs
+11.6%
Service revenue (€mn)
GW under service
CY17: €308m CY16: €276m
88.8
68.278.872.672.8
65.565.472.6
Dec-17 Sept-17 Jun-17 Mar-17 Dec-16 Sept-16 Jun-16 Mar-16
13.612.712.112.111.911.410.812.8
+12.4%
Dec-17 Sep-17 Jun-17 Mar-17 Dec-16 Sep-16 Jun-16 Mar-16

Orders and installations
2

12
Senvion installations Installation rate in line with revenue plan
Installations (MW)
Decline in installations
in line with revenue
guidance
Q4 installation rate
mainly impacted by
installation shifts from
the 299 MW order in
Chile to 2018
Final commissioning of
Nordergrunde and
Nordsee One offshore
windfarms achieved in
Q4 2017 591
155
485
141
217
185
351
480
185
6
-16.1%
CY 17
1,478
332
CY 16
1,762
112
Annual Installation Q1-Q4 2017 installations
5598
40
68
31
43
79
52
108
183
133
35
55
2642
56
Q4 17
292
29
Q3 17
571
141
Q2 17
372
141
0
Q1 17
243
49 4
12
Offshore Other new markets Other current markets UK France Germany

13
Note: Figures prior Dec 15 relate to Senvion GmbH
Net Firm orders are confirmed orders minus PoC revenues already booked.
Conditional orders are signed contracts where either building permit and/or grid connection and/or financing is missing.
Q4 15 1.8 0.6 1.2
Q1 16 1.8 0.6 1.2
Q2 16 1.7 0.6 1.1
Q3 16 1.5 0.7 0.8
Q4 16 1.3 0.4 0.9
Q1 17 1.3 0.3 1.0
Q2 17 1.6 0.5 1.1
Q3 17 1.5 0.5 1.0
Q4 17 1.5 0.3 1.2
Order book of €5.0bn Onshore order book improving
Net firm orders at €1.5bn
Order book (€bn) Q4 2017 split by geography
Others
France
UK
Germany
New markets
Offshore
Q4 17
1,471
69
97
186
154
659
306
1.9
2.0
2.1
2.1
2.2
2.3
2.3
2.5
2.5
5.6
5.6
5.4
5.4
5.3
5.5
Figures in €mn
5.5
Onshore
€1.2bn
5.3
1.7
1.9 0.3 1.6
1.8 0.3 1.5
1.6 0.3 1.3
1.4
1.6
1.7
1.3
1.0
Onshore Offshore
5.0
Net Firm Orders Conditional Service Total
14
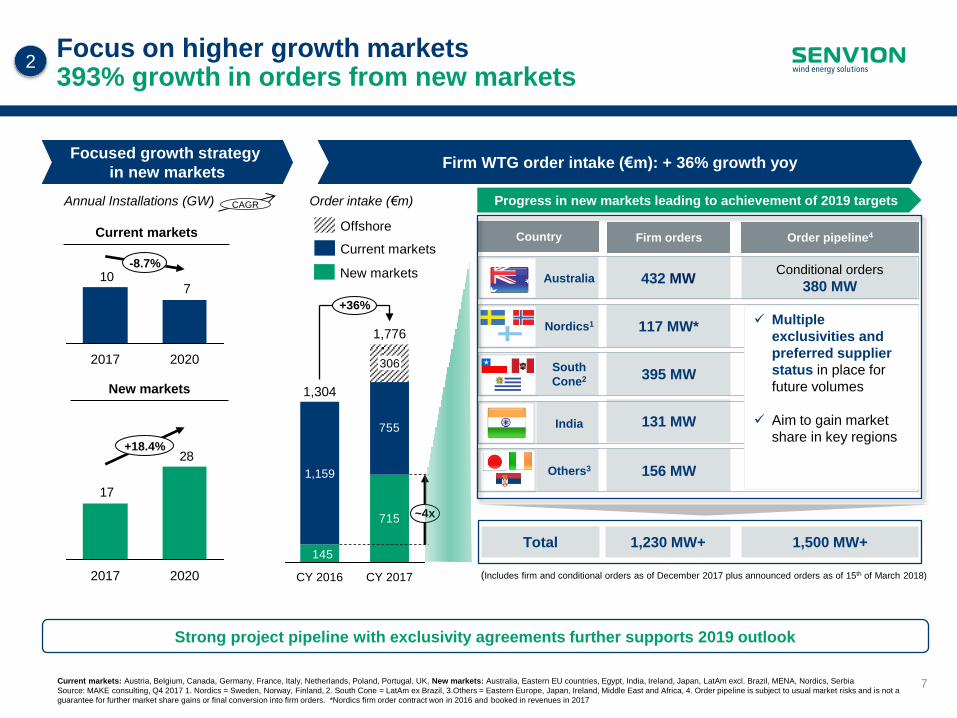
Order intake growth of more than 36% yoy Growth mainly driven by new markets
Firm WTG order intake (€mn)
86
265365
61122
147149 169 119
45
49
54
73
11397142
84
155
117
59
534112
27
1314
20
353
31
36
Dec-16 Mar-17 Sep-16
292
Sept 17
337
458 500
Jun 17
586
11
306
Q4 +9%
Q1 +31%
Q2 +106%
Q3 +15%
Dec-17
39
Jun-16
284
5
Mar-16
269
France
Others
New markets
Germany
Offshore
Pipeline continues to be strong
+393%
+36%
715
755
306
CY 2017
1,776
CY 2016
1,159
1,304
145
36% growth yoy
New markets growth
of 393%
397 MW in LatAm
206 MW in ANZ
156 MW in
Ireland, Eastern
EU countries and
Japan
Onshore new markets
Onshore current markets
Offshore

Financials 2017 Delivering on promises made
3
16
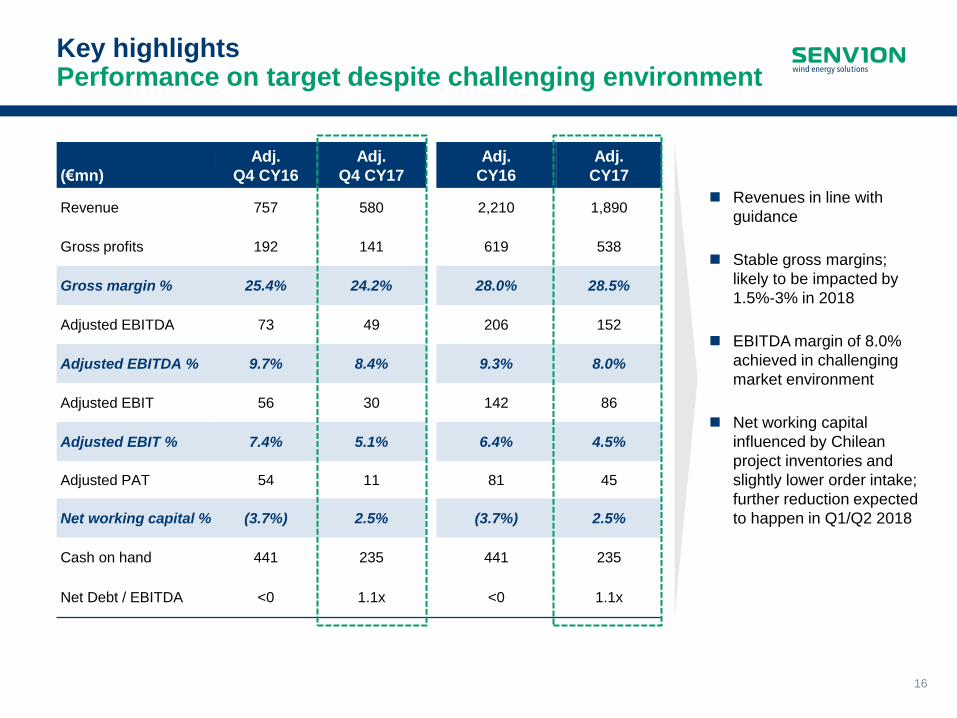
Key highlights Performance on target despite challenging environment
Revenues in line with
guidance
Stable gross margins;
likely to be impacted by
1.5%-3% in 2018
EBITDA margin of 8.0%
achieved in challenging
market environment
Net working capital
influenced by Chilean
project inventories and
slightly lower order intake;
further reduction expected
to happen in Q1/Q2 2018
(€mn)
Adj.
Q4 CY16
Adj.
Q4 CY17
Adj.
CY16
Adj.
CY17
Revenue 757 580 2,210 1,890
Gross profits 192 141 619 538
Gross margin % 25.4% 24.2% 28.0% 28.5%
Adjusted EBITDA 73 49 206 152
Adjusted EBITDA % 9.7% 8.4% 9.3% 8.0%
Adjusted EBIT 56 30 142 86
Adjusted EBIT % 7.4% 5.1% 6.4% 4.5%
Adjusted PAT 54 11 81 45
Net working capital % (3.7%) 2.5% (3.7%) 2.5%
Cash on hand 441 235 441 235
Net Debt / EBITDA <0 1.1x <0 1.1x

17
Revenue development New markets starting to grow at a fast clip
Onshore revenue breakup (€mn)
Other revenues at €5m for 2016 and €9m for 2017
-36%
CY17
1.028
516
185 162
166
CY16
1.619
420
192
397
610
2017: Current market
revenues declined led
by UK & Canada
2018: Revenues in
Germany to shrink due
to issues with auction
systems
Revenues from New
markets grew led by
Nordics
Revenues likely to
grow at a fast rate in
2018 led by Chile and
Australia
Revenue split 2017: €1.9bn
Onshore – €1.2bn Offshore – €0.3bn Service – €0.3bn
393 430544
227 263 377359
137263
Q4 17
89 128
Q3 17
68 33
Q2 17
79 94
Q1 17
364
73 91
Q4 16
436
73
Q3 16
478
66 88
Q2 16
577
65 47
Q1 16
73 29
391
754
584 505
Service Offshore Onshore
Revenue split 2016: €2.2bn
Onshore – €1.6bn Offshore – €0.3bn Service – €0.3bn
New Markets Current markets
37
89
+1,704%
CY17
198
21
52
CY16
11
ANZ South Cone Nordics Others
All figures in €mn
Germany France UK Others
18
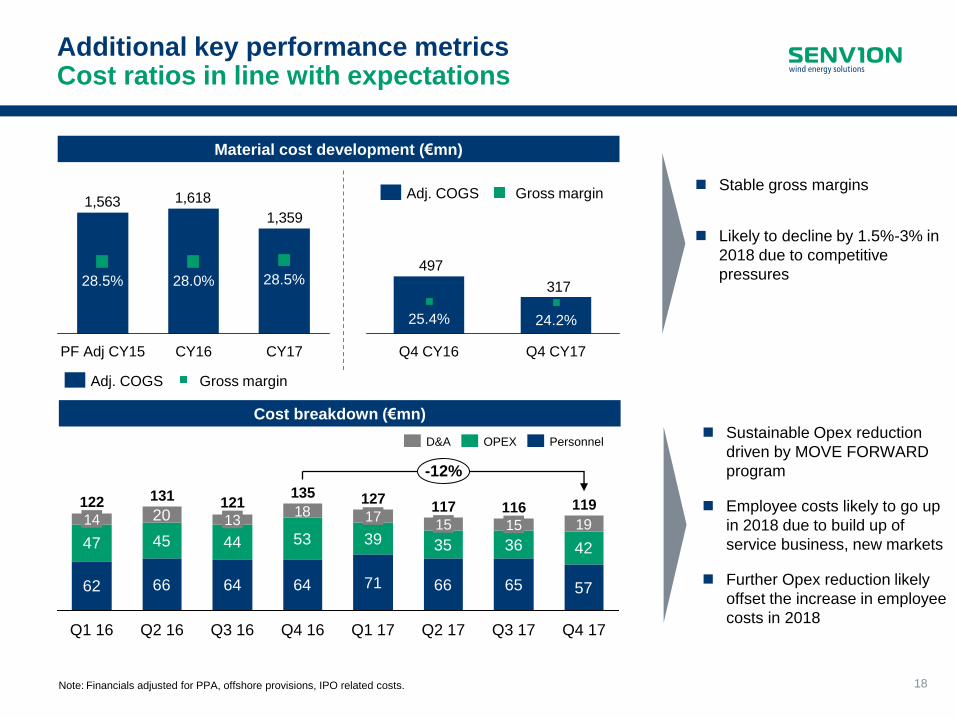
Additional key performance metrics Cost ratios in line with expectations
Material cost development (€mn)
Stable gross margins
Likely to decline by 1.5%-3% in
2018 due to competitive
pressures
1,359
1,6181,563
CY17
28.5%
CY16
28.0%
PF Adj CY15
28.5%
Gross margin Adj. COGS
Cost breakdown (€mn)
62 66 64 64 71 66 65 57
47 45 44 53 39 35 36 42
191820
Q1 16
122
14
-12%
Q4 17
119
Q3 17
116
15
Q2 17
117
15
Q1 17
127
17
Q4 16
135
Q3 16
121
13
Q2 16
131
Personnel OPEX D&A
Note: Financials adjusted for PPA, offshore provisions, IPO related costs.
Sustainable Opex reduction
driven by MOVE FORWARD
program
Employee costs likely to go up
in 2018 due to build up of
service business, new markets
Further Opex reduction likely
offset the increase in employee
costs in 2018
317
497
24.2%
Q4 CY16
25.4%
Q4 CY17
Gross margin Adj. COGS

19
Breakup of total Capex and R&D Achieving more within similar cost budgets
R&D expenditure (€mn)
2.6% 3.1% 3.0% 3.1%
Total intangible and tangible capex1 (€mn)
1.8%
Senvion GmbH Senvion S.A.
Investments focused on the expansion
of the blade facility and consolidation of
nacelle facility in Portugal
1.5% 2.2%
Senvion GmbH
2.7% 2.6% 1.4%
Senvion S.A.
39 45 45 4222 21
1922 23 26
2320
Mar-15
58
Mar-14
45
Mar-13
42
CY17 CY16
68
PF adj
CY15
67 68
R&D spending in line with previous year
Key R&D spending focused on
development of 3xM, 2XM platform
Increasing product portfolio within
the same R&D costs thanks to
modularity and cost savings due to
various measures such as insourcing of
project managers, efficient certification
management etc
Note: 1. Excluding capitalised R&D.
[%] Capex over LTM sales
[%] R&D over LTM sales Expensed
5160
304346
35
März-14 März-13 CY17 CY16 PF adj
CY15
März-15
Capitalised
2.7%
2.9%

20
Net working capital and cash flow summary Working capital to improve by H1 2018
Quarterly net working capital1 evolution (€m)
Quarterly cash flow evolution (€m)
NWC1 % of trailing 12 months revenue Net working capital
Sep-17 Jun 17 Mar 17 Dec-16 Sep-16 Jun-16 Mar-16 Dec-15
Q4 impacted due to delayed order conversions
Likely to improve by Q1/Q2 2018 on the back of order intake and commissioning of Chilean project
Positive free cash flow in H2 2017
Consistent cash flow generation excluding exceptional items
Negative free cash flow in H1 2017 mainly driven by inventory for Chilean projects
Note:
1. Net working capital defined as current assets (adjusted for liquid funds and assets of disposal Group classified as held for sale) minus total current liabilities (adjusted for provisions, liabilities of disposal
Group classified as held for sale and short-term loans and current portion of long-term loans).
185 23 (68) 64 14 (109) (173) 44
Free cash flow Operating cash flow Investing cash flow
Dec-17
47
Sep-17 Jun 17 Mar 17 Dec-16 Sep-16 Jun-16 Mar-16 Dec-15 Dec-17
(101) (132)
(57)
(119) (83)
(5)
99
8 47
(4.7%) (6.4%) (2.7%) (5.8%) (3.7%) (0.2%)
4.6%
0.4%
2.5%

Strategic roadmap and financial goals Enhancing efficiency to achieve 2019 targets
4

22
2.442.432.643.46
4.50
2.85
Maha Febr.-
18
Gujarat Okt.-
17
Jan.-
17
FIT
+17%
New
mark
ets
Positive changes supporting 2019 outlook
Source: Bloomberg auction overview & MAKE regional reports, Senvion Market Intelligence
Prices correspond to the latest average auctions results in each country
Auction systems bring larger volumes at lower prices Prices stabilizing with Senvion gaining ground
Markets dominated by auctions Volumes growing and prices now stabilizing
46374357
70
+24%
Feb-18 Nov-17 Aug-17 May-17 FIT
€/MWh
INR/KWh
$/MWh
415359
2017 2016 2016
74 65
-12%
2018e FIT
709 MW with avg bid price going up by 24%
Govt discussing to add 1.4 GW extra auctions
in 2018
Senvion increasing market share
Stable market, auctions volume to flow into
2020
Senvion maintaining 10-20% market share
Indian government plans 10 GW of auctions
between 2018 – 2020
Senvion with 131 MW orders, a healthy
pipeline and increasing market share
Decent auction prices
Senvion gaining market share
100 MW of co-investment project
€/MWh
Cu
rren
t m
ark
ets
Onshore auction volumes (GW)
Wind auctions in 2017
Auctions in previous years, no wind activity in 2017
24
20
2017
+20.0%
2018E

23
High degree of comfort developing on 2019 volumes Closing gap on 2019 revenue targets
2019e Germany
upside
potential
New
markets
upside
Service+
offshore
2018
Guidance
€1.8-1.9bn
~35%
25%
~40%
1 Onshore market share as per BNEF market share file released in Feb 2018 and Feb 2017
Expanding pipeline with market share gains
Service and offshore growth largely covered by
firm orders
Improving order pipeline in new markets
India: Gaining market share, additional upside if
further auctions are conducted on time
Argentina: Large market share likely in RENOVA 2
auction
Australia: c. 600 MW of volume visibility based on
orders in hand for 2019
Chile and North Africa: Exclusivities for large volumes
Germany
Market share growing from 7% to 10% in 20171
Extra volume expected if proposal to expand auction
volumes by 50% go through
Key risks
Market developments delayed in India and Germany
Delays in order conversions/postponements
Key comments
1
2
3
Increasing visibility on 2019 revenues
1
2
3
€2.6-2.7bn
2017
€1.9bn
54%
11%
35%
Current markets
New markets
Service+Offshore
Current markets New markets Service+Offshore

24
LCoE roadmap in place with early stages of cost outs Intensive efforts required in light of pricing pressure
Cost out plans initiated, but execution risks remain
2020 2018 2016 2014
-16%
-12%
LCoE
-4%
LCoE calculation based on reference project for Germany (6.5m/s at 140m, 8WECs), including all project cost from customer perspective
3.xM12x at 139m hub height – 3.xM EBC at 130m/128m/126m hub height
1. LCC – Low Cost Countries
Product LCoE roadmap ready…
3.xM 12X
3.xM 14X EBC
Progress being made on cost outs
Increasing sourcing from LCC1
Agreements in place for generators
and blades from China
Sourcing agreements for towers and
Gearbox from China also in place
Simplifying processes
Lower transport costs
Lower crane and installation costs
Reduction in BoP costs
Reduced time for installation
Key Risks
Delays in new
component sourcing
Competition pressures
on new turbines and
components
Delays in new product
introductions
Risks of quality, testing
period delays cannot
be ruled out
25
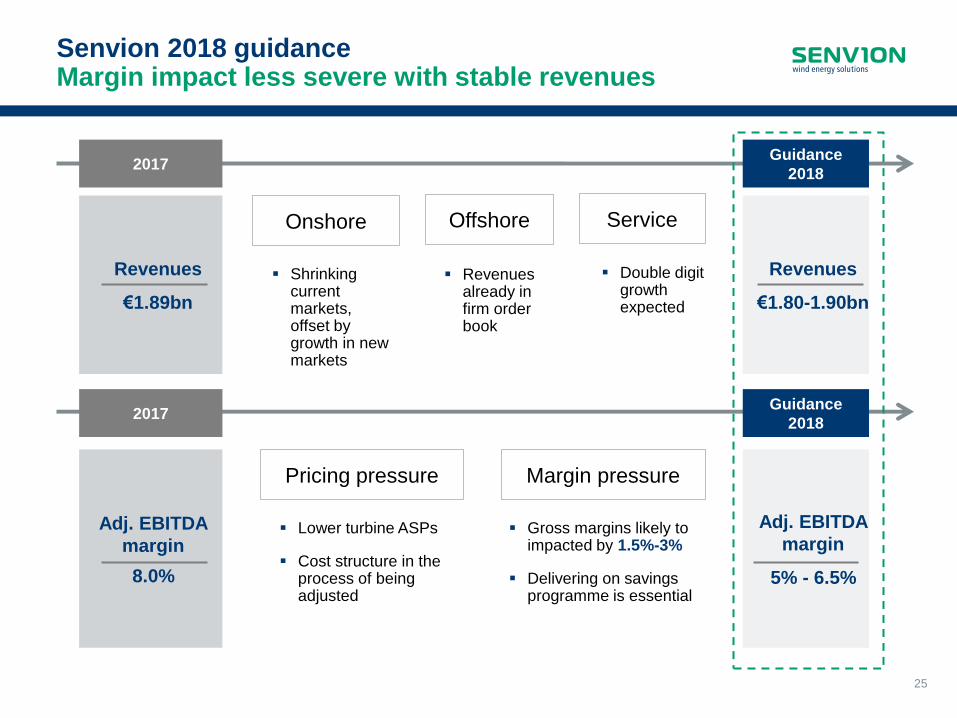
Senvion 2018 guidance Margin impact less severe with stable revenues
Increasing
profitability
Safeguarding
continuous
order intake
Choose the right battles
Minimise sunk costs
Etc.
Revenues
€1.80-1.90bn
Adj. EBITDA
margin
5% - 6.5%
Revenues
€1.89bn
Adj. EBITDA
margin
8.0%
2017 Guidance
2018
Onshore Offshore Service
Shrinking current markets, offset by growth in new markets
Revenues already in firm order book
Double digit growth expected
Pricing pressure
Lower turbine ASPs
Cost structure in the process of being adjusted
Margin pressure
Gross margins likely to impacted by 1.5%-3%
Delivering on savings programme is essential
2017 Guidance
2018
Key takeaways 5

27
Key takeaways
Expanding product portfolio within same R&D budgets and with a
healthy product pipeline
Service business continues to grow
Significant cost cuts achieved under MOVE FORWARD as promised
Market share gains followed by solid order intake from new markets 2
Performance in line with guidance 1
5
3
4

Appendix
MM tubines in France

29
Financial Calendar 2017
Event Date
Annual Results 2017 March 15, 2018
Q1 2018 Results May 15, 2018
Annual General Meeting May 31, 2018
Q2 2018 Results August 14, 2018
Q3 2018 Results November 14, 2018
Financial calendar
Your Investor Relations Team:
Dhaval Vakil
Vice President – Capital Markets and M&A
Phone UK: +44 20 7034 7992
Mobile: +44 7788390185
Email: [email protected]
Anja Siehler
Sr. Manager Capital Markets
Phone Lux: +352 26 00 5285
Mobile: +49 152 21817093
Email: [email protected]
For general queries: [email protected]

30
Income statement 2017 Bridge between reported and adjusted earnings
€mn Q4 17 Adj. Adj Q4 17 CY17 Adj. Adj CY17
Revenue 580 580 1,890 1,890
Total performance 458 458 1,893 1,893
Material expenses (317) (317) (1,355) (1,355)
Gross profit 141 141 538 538
Gross margin % 24.2% 24.2% 28.5% 28.5%
Other operating income 10 10 30 30
Personnel expenses (57) (57) (260) (260)
Opex (42) (42) (153) (153)
FX gain/loss (3) (3) (4) (4)
EBITDA 49 49 152 152
EBITDA % 8.4% 8.4% 8.0% 8.0%
D&A (34) 15 (19) (158) 92 (66)
EBIT 14 29 (6) 86
EBIT% 2.4% 5.0% (0.3%) 4.5%
Extraordinary Expenses 1 (1) (0) (54) 54 0
Net interest (10) (10) (61) 20 (41)
Taxes (3) (6) (8) 28 (28) (0)
Net profit (Con. Ops) 2 11 (93) 45
PAT % 0.3% 1.8% (4.9%) 2.4%
Key adjustments
1
Includes € 0.6mn restructuring
provision reversed
Includes PPA impact
of € 15.2mn
2
1
2
4
7
5
Includes € 54.1mn of
restructuring measures
Includes PPA impact
of € 92.1mn
Includes € 20.4mn of bond
refinancing costs
4
6
5
Q4 2017
CY 2017
3
Includes positive PPA
impact of € 5.5mn 3
6 Includes positive PPA
impact of € 28.3mn 7

31
Assets (€mn) Dec 17 Sep 17 Dec 16
Liquid Funds 235 190 441
Current Assets (excluding liquid funds) 774 804 814
Receivables 206 153 257
Inventories 490 560 430
Others 78 91 127
Property, plant & equipment 224 234 222
Other intangible assets 527 541 604
Other non current assets* 35 40 19
Deferred tax assets 13 0 0
Total 1,808 1,808 2,101
Liabilities (€mn) Dec 17 Sep 17 Dec 16
Loans (short term, long term and High Yield Bond) 400 401 407
Current liabilities (excluding provisions and short term loans) 728 796 897
Advance payments received 119 159 189
Trade payables 340 381 431
Gross amount due to customers for contract work as a liability 139 119 122
Others 131 137 155
Provisions 300 247 289
Deferred tax liability 150 140 173
Total equity capital 230 225 334
Total 1,808 1,808 2,101
Senvion S.A. Balance sheet
* - Includes assets held for sale

32
Senvion S.A. Cash flow summary
Senvion
S.A.
Senvion
S.A.
Senvion
S.A.
Senvion
S.A.
(€mn) Q4 CY16 Q4 CY17 CY16 CY17
Result before income taxes (38) 5 (89) (121)
Adjustments for Depreciation on property, plant and equipment, amortization of intangible assets and write-offs on
financial assets 43 35 167 158
Interest income (0) (2) (1) (4)
Interest expenses 14 13 64 65
Increase/decrease in provisions 76 53 71 10
Change in working capital (35) (27) (23) (100)
Interest received 0 3 1 4
Interest paid (14) (18) (40) (68)
Income tax paid/received (0) (3) (12) (36)
Cash flow from operating activities 46 57 138 (91)
Cash receipts from the sale of property, plant and equipment, intangible and other long-term assets 1 (0) 3 3
Cash payments for the purchase of intangible assets (13) (8) (50) (42)
Cash payments from purchase of property, plant and equipment and other long-term assets (20) (2) (58) (59)
Cash payments from loans granted to related parties 0 0 0 0
Acquisition of subsidiary: Net of cash acquired (0) (1) (0) (1)
Cash flow from investing activities (32) (11) (105) (99)
Acquisition of treasury shares (4) 0 (7) (8)
Net Cash repayments of amounts borrowed / repayments (1) (0) (5) (4)
Cash flow from financing activities (5) (0) (12) (12)
Increase/decrease in cash and cash equivalents 9 46 20 (203)
Cash and cash equivalents at the beginning of the period 425 184 413 434
Cash and cash equivalents at the end of the period 434 231 434 231
Liquid funds 441 235 441 235
Short-term bank liabilities (8) (5) (8) (5)
Cash and cash equivalents at the end of the period 434 231 434 231

33
Overview of PPA Adjustments
Expected yearly P&L effects1 (€mn)
Notes:
1. Including deferred tax impacts and is not the complete schedule; assumed group tax rate of 29.935% for calculations.
Source: Company information; Deloitte analysis.
27
28
28
64
Dec-20e
Dec-19e
Dec-18e
Dez.-17
Net PPA booked in CY17 (€mn)
18
18
18
10
64
Q4 17
Q3 17
Q2 17
Q1 17
CY 2017

© Senvion S.A.
All rights reserved. No part of this document may be
reproduced or transmitted in any form or by any means,
electronic or mechanical, including photography,
recording, or any information storage and retrieval
system, without permission from Senvion S.A.
Thank you for your participation