Embed Size (px)
Citation preview

Sentinel Water-Based Organisms as a Measure ofClimate Change
National Center for Environmental and Zoonotic Infectious Diseases
Division of Foodborne, Waterborne, and Environmental Diseases
Michael J. Beach, PhD
Waterborne Disease Prevention Branch
Great Lakes Beach Conference
Traverse City, MI
October 29, 2015

Climate Change and WaterImpacts
Increased or decreased wateravailability depending on location
Water stress for hundreds of millions
Extreme weather events
Droughts, floods
Increased use of recreational water
Increased water temperatures
Thermophilic organisms to track?

VIBRIO INFECTIONS

Climate Change and Water:Vibriosis
Infection with a species from the familyVibrionaceae Other than toxigenic V. cholerae O1 or O139, which causes cholera
First recognized in the 1970s
Nationally notifiable disease in U.S. in 2007
Characterized by either gastroenteritis, wound infection,or septicemia
Marine/estuarine habitat
Advantage in warm and low salinity seawater
Proliferate >15 °C /59 °F water) and low salinity (<30 ppt NaCl)

Climate Change and Water:Vibriosis
Risk factors
Consumption of raw or undercooked shellfish
Wound exposure to seawater
~1000 cases reported/year
Estimated annual impact in U.S.
80,000 infections
500 hospitalizations
100 deaths
Scallan, E., et al., Emerg Infect Dis, 2011. 17(1): 7-15.

Reports Are IncreasingReported Vibriosis Infections, 1988-2013
Nationallynotifiable
Newton, A et al., CDC COVIS Surveillance System, N=11,341

Changing Geographic Range
Vibrio parahaemolyticus in Alaskan waters,1000 kmfarther north than previously reported (2004)
Water temperatures had increased 0.21°C per year since 1997
Movement up east coast to Chesapeake Bay
Infections in Northern Europe (1994, 1997, 2003, 2006)
Coincides with unusual temperature peaks in Baltic Sea
Vibrio wound infections following Hurricane Katrina
Vibrio occurrence may track with El Nino events
McLaughlin JB. N Engl J Med. 2005;353(14):1463-70
Baker-Austin C, Environ Microbiol Rep. 2010;2(1):7-18
CDC. MMWR Morb Mortal Wkly Rep. 2005;54(37):928-31.
Martinez-Urtaza J, Epidemiol. 2008;19(6):829-37
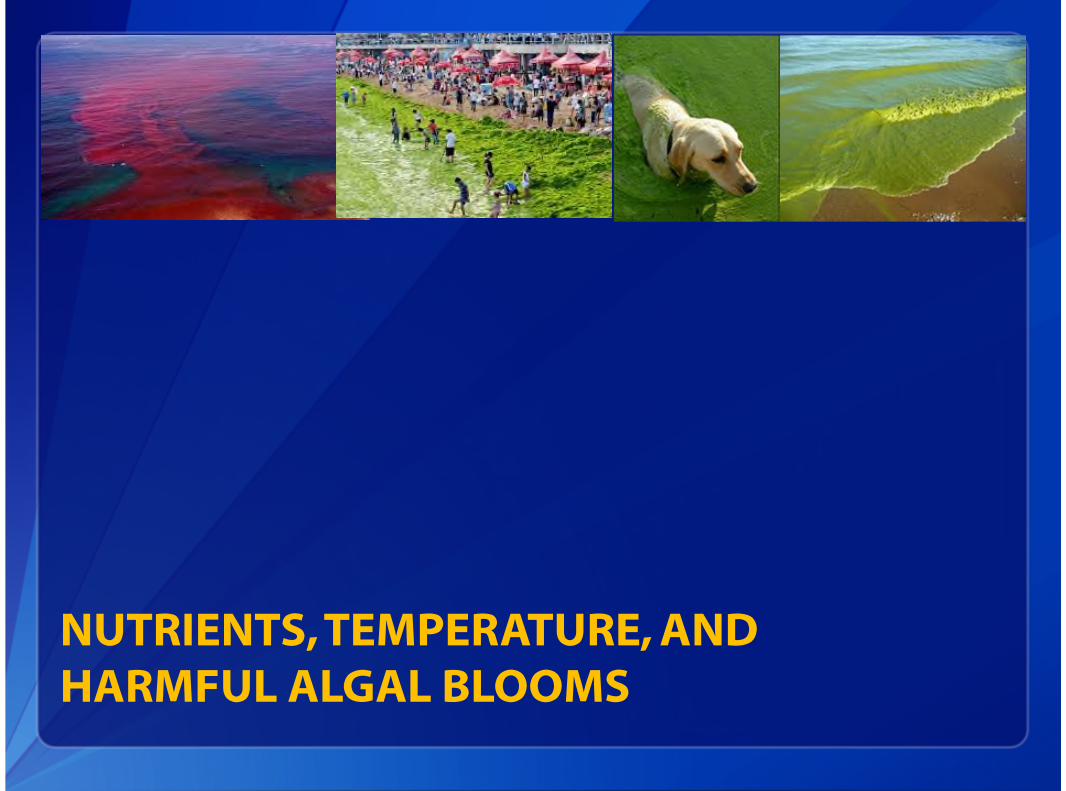
NUTRIENTS,TEMPERATURE, ANDHARMFUL ALGAL BLOOMS

Marine HABs
U.S. states on Atlantic and Pacific oceans
Respiratory illness (brevetoxins)
Foodborne illness
NORS data, 2009-2013
• Mostly foodborne
• 58 foodborne outbreaks, 209illnesses,
30 hospitalizations
Photography credit: CaliforniaDepartment of Public Health,Kai Schumann

Freshwater HABs
Cyanobacteria (“blue-green algae” or “cyanoHAB”)
World Health Organization has provisional guidelines for drinkingwater and recreational water exposures
No U.S. federal guidelines, criteria, standards, or regulations indrinking water or ambient recreational water
Toxins: microcystin, anatoxin-a, cylindrospermopsin, saxitoxin
Cases of illness are difficult to confirm in the absence of clinicaldiagnostic tests and rapid water sample tests
Photography credit: (L-R)Wisconsin Department of Health Services, Lorrie Backer (image height modified)

U.S Harmful Algal Bloom-Associated Outbreaks
Prior to 2009: 5 outbreaks reported (2 marine, 3freshwater)
2010-2011: 11 freshwater outbreaks in NY, OH, WA
2013: Toledo, OH is first US city reportedly exceedingWHO values for microcystin in finished drinking water
Increasing in frequency, intensity, and duration in allaquatic environments on a global scale
Role of climate change?
Impacted by increasing phosphorus, nitrogen levels
Issues with testing, monitoring in humans, environment
Piloting national surveillance systemhttp://www.cdc.gov/healthywater/surveillance/rec-water-surveillance-reports.htmlHilborn ED et al. MMWR 2014;63(1):11–5.

AMEBIC INFECTIONS:SHIFTING DISTRIBUTION, EMERGINGTRANSMISSION MODES

Primary Amebic Meningoencephalitis(PAM)
• Rare and serious brain infection
138 cases in U.S. from 1962-2015
• Most diagnostics come through CDC
Fatal: only 3 known US survivors
Acute disease: exposure to death in ~10 days
• Caused by free-living ameba, Naegleria fowleri
Most infections associated with swimming in lakes, rivers
Water containing Naegleria goes up nose to brain
• All infections in southern tier states in US until 2010

Organism: Naegleria fowleri
Distributed globally
Potential for being a climate-sensitive pathogen as watertemperatures rise globally
Thermophilic free-living ameba
Lives in temperatures up to 115oF (46oC)
• CDC has been tracking infections since 1962

Changing Geographic Range of PAM:2010-2013
• First 2 cases in MN
600 miles farther north than previous case in MO
During long, unusual heat spell
• First 2 cases reported in KS
• First case in VA reported since 1969
• First case in IN

Naegleria fowleri : Changing TransmissionRoutes Since 2011
• First documented infections from nasalirrigation
Neti pots (Louisiana, 2011)
Ritual ablutions (U.S.Virgin Islands, 2012)
• First death associated with colonization of a treated drinkingwater supply and colonization of a U.S. public water system(Louisiana, 2013) Testing shows other LA water systems colonized (2014-15)
• First death associated with overland piping of water in hightemperatures followed by household/recreational use (privatewater system, CA, 2015)

CONCLUSIONS

Conclusions: Water and Climate Change
Geographic ranges of pathogens shifting northward inmarine and fresh water
Some indicators show increasing numbers
Changing transmission routes for Naegleria
Drinking water systems and premise plumbing can alsobe impacted by warmer temperatures
Underscores need to continue tracking multiplemarkers of water-related impact of climate change
Trends, emerging issues, alerts
Data supports taking action

Acknowledgments
Ibne Ali Laurie Backer Jennifer Cope Anna Newton Virginia Roberts Jonathan Yoder Joanna Yu State/Local Public Health Partners EPA

National Center for Emerging and Zoonotic Infectious Diseases
Division of Foodborne, Waterborne, and Environmental Diseases
Questions?More Information: Healthy Water Website
www.cdc.gov/healthywater;[email protected]
"The findings andconclusions in thispresentation havenot been formallydisseminated byCDC and shouldnot be construedto represent anyagencydetermination orpolicy."

Number of Case-reports of Primary AmebicMeningoencephalitis , by Year:
United States, 1962–2015
0
1
2
3
4
5
6
7
8
9
196
3
196
5
196
7
196
9
197
1
197
3
197
5
197
7
197
9
198
1
198
3
198
5
198
7
198
9
199
1
199
3
199
5
199
7
199
9
200
1
200
3
200
5
200
7
200
9
201
1
201
3
201
5
N=138; Year of exposure unknown for one case
No
.of
Ca
se-r
ep
ort
s
Year
0-8 infections/year