Embed Size (px)
Citation preview
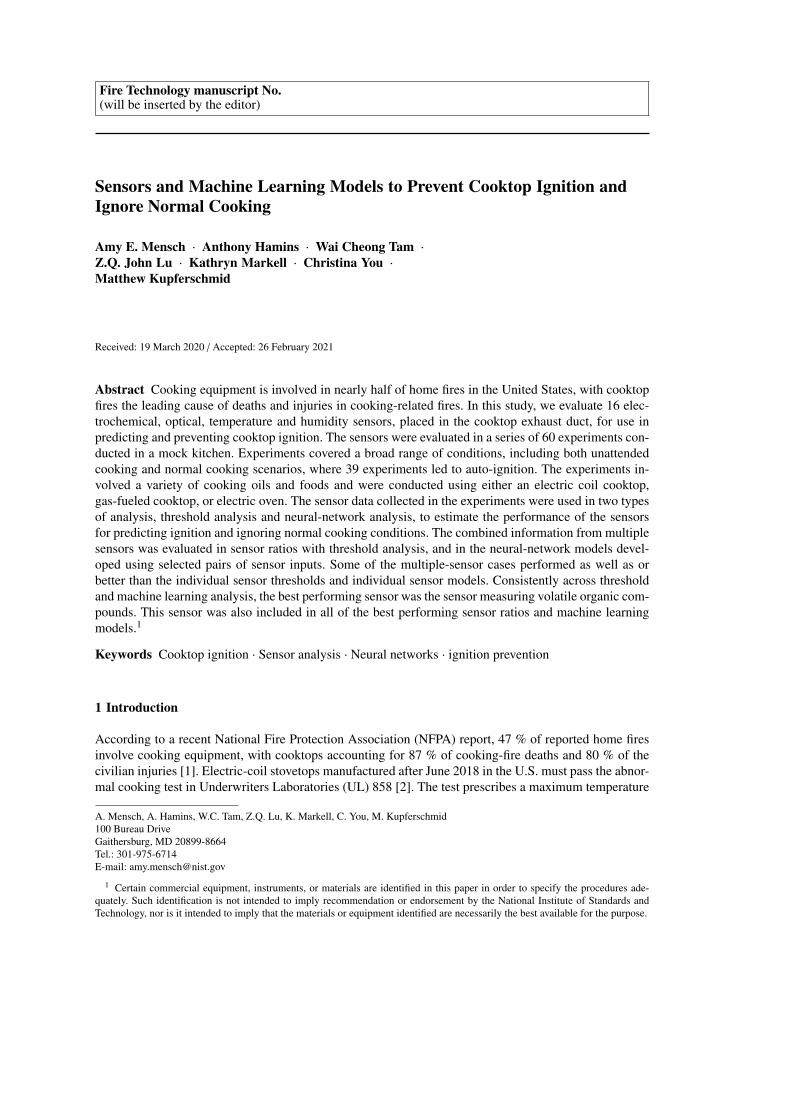
Fire Technology manuscript No.(will be inserted by the editor)
Sensors and Machine Learning Models to Prevent Cooktop Ignition andIgnore Normal Cooking
Amy E. Mensch · Anthony Hamins · Wai Cheong Tam ·
Z.Q. John Lu · Kathryn Markell · Christina You ·Matthew Kupferschmid
Received: 19 March 2020 / Accepted: 26 February 2021
Abstract Cooking equipment is involved in nearly half of home fires in the United States, with cooktopfires the leading cause of deaths and injuries in cooking-related fires. In this study, we evaluate 16 elec-trochemical, optical, temperature and humidity sensors, placed in the cooktop exhaust duct, for use inpredicting and preventing cooktop ignition. The sensors were evaluated in a series of 60 experiments con-ducted in a mock kitchen. Experiments covered a broad range of conditions, including both unattendedcooking and normal cooking scenarios, where 39 experiments led to auto-ignition. The experiments in-volved a variety of cooking oils and foods and were conducted using either an electric coil cooktop,gas-fueled cooktop, or electric oven. The sensor data collected in the experiments were used in two typesof analysis, threshold analysis and neural-network analysis, to estimate the performance of the sensorsfor predicting ignition and ignoring normal cooking conditions. The combined information from multiplesensors was evaluated in sensor ratios with threshold analysis, and in the neural-network models devel-oped using selected pairs of sensor inputs. Some of the multiple-sensor cases performed as well as orbetter than the individual sensor thresholds and individual sensor models. Consistently across thresholdand machine learning analysis, the best performing sensor was the sensor measuring volatile organic com-pounds. This sensor was also included in all of the best performing sensor ratios and machine learningmodels.1
Keywords Cooktop ignition · Sensor analysis · Neural networks · ignition prevention
1 Introduction
According to a recent National Fire Protection Association (NFPA) report, 47 % of reported home firesinvolve cooking equipment, with cooktops accounting for 87 % of cooking-fire deaths and 80 % of thecivilian injuries [1]. Electric-coil stovetops manufactured after June 2018 in the U.S. must pass the abnor-mal cooking test in Underwriters Laboratories (UL) 858 [2]. The test prescribes a maximum temperature
A. Mensch, A. Hamins, W.C. Tam, Z.Q. Lu, K. Markell, C. You, M. Kupferschmid100 Bureau DriveGaithersburg, MD 20899-8664Tel.: 301-975-6714E-mail: [email protected]
1 Certain commercial equipment, instruments, or materials are identified in this paper in order to specify the procedures ade-quately. Such identification is not intended to imply recommendation or endorsement by the National Institute of Standards andTechnology, nor is it intended to imply that the materials or equipment identified are necessarily the best available for the purpose.
2 Amy E. Mensch et al.
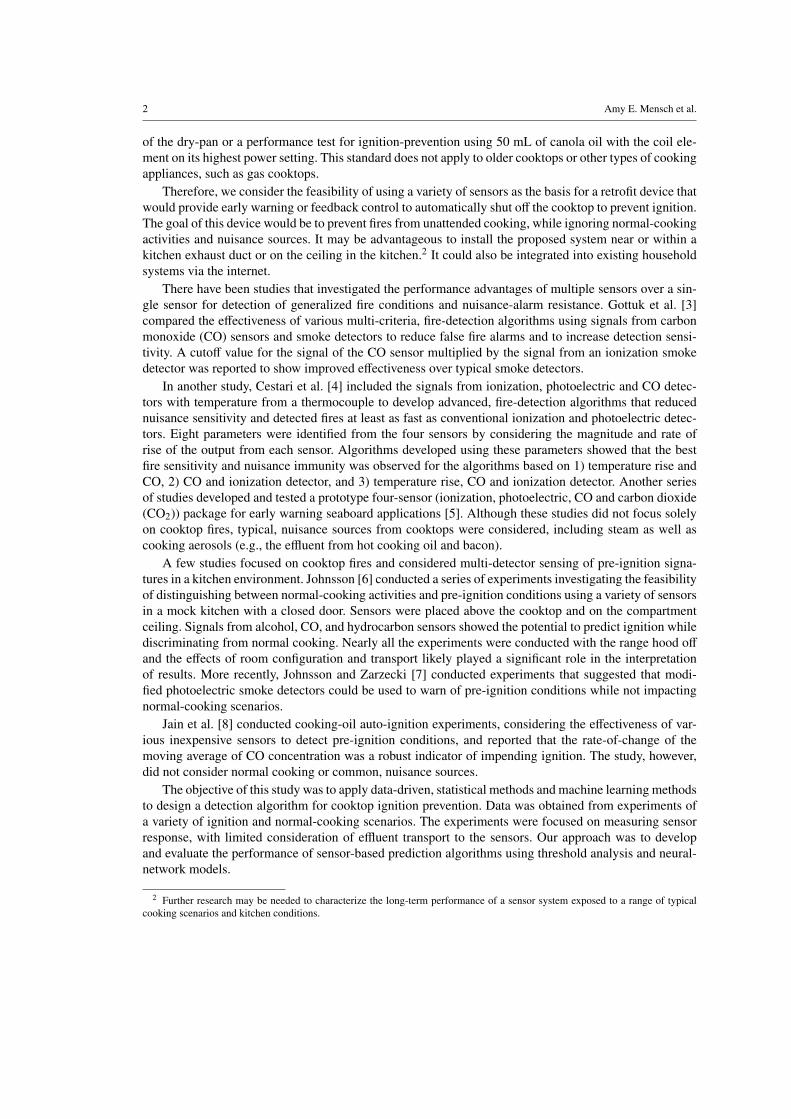
of the dry-pan or a performance test for ignition-prevention using 50 mL of canola oil with the coil ele-ment on its highest power setting. This standard does not apply to older cooktops or other types of cookingappliances, such as gas cooktops.
Therefore, we consider the feasibility of using a variety of sensors as the basis for a retrofit device thatwould provide early warning or feedback control to automatically shut off the cooktop to prevent ignition.The goal of this device would be to prevent fires from unattended cooking, while ignoring normal-cookingactivities and nuisance sources. It may be advantageous to install the proposed system near or within akitchen exhaust duct or on the ceiling in the kitchen.2 It could also be integrated into existing householdsystems via the internet.
There have been studies that investigated the performance advantages of multiple sensors over a sin-gle sensor for detection of generalized fire conditions and nuisance-alarm resistance. Gottuk et al. [3]compared the effectiveness of various multi-criteria, fire-detection algorithms using signals from carbonmonoxide (CO) sensors and smoke detectors to reduce false fire alarms and to increase detection sensi-tivity. A cutoff value for the signal of the CO sensor multiplied by the signal from an ionization smokedetector was reported to show improved effectiveness over typical smoke detectors.
In another study, Cestari et al. [4] included the signals from ionization, photoelectric and CO detec-tors with temperature from a thermocouple to develop advanced, fire-detection algorithms that reducednuisance sensitivity and detected fires at least as fast as conventional ionization and photoelectric detec-tors. Eight parameters were identified from the four sensors by considering the magnitude and rate ofrise of the output from each sensor. Algorithms developed using these parameters showed that the bestfire sensitivity and nuisance immunity was observed for the algorithms based on 1) temperature rise andCO, 2) CO and ionization detector, and 3) temperature rise, CO and ionization detector. Another seriesof studies developed and tested a prototype four-sensor (ionization, photoelectric, CO and carbon dioxide(CO2)) package for early warning seaboard applications [5]. Although these studies did not focus solelyon cooktop fires, typical, nuisance sources from cooktops were considered, including steam as well ascooking aerosols (e.g., the effluent from hot cooking oil and bacon).
A few studies focused on cooktop fires and considered multi-detector sensing of pre-ignition signa-tures in a kitchen environment. Johnsson [6] conducted a series of experiments investigating the feasibilityof distinguishing between normal-cooking activities and pre-ignition conditions using a variety of sensorsin a mock kitchen with a closed door. Sensors were placed above the cooktop and on the compartmentceiling. Signals from alcohol, CO, and hydrocarbon sensors showed the potential to predict ignition whilediscriminating from normal cooking. Nearly all the experiments were conducted with the range hood off
and the effects of room configuration and transport likely played a significant role in the interpretationof results. More recently, Johnsson and Zarzecki [7] conducted experiments that suggested that modi-fied photoelectric smoke detectors could be used to warn of pre-ignition conditions while not impactingnormal-cooking scenarios.
Jain et al. [8] conducted cooking-oil auto-ignition experiments, considering the effectiveness of var-ious inexpensive sensors to detect pre-ignition conditions, and reported that the rate-of-change of themoving average of CO concentration was a robust indicator of impending ignition. The study, however,did not consider normal cooking or common, nuisance sources.
The objective of this study was to apply data-driven, statistical methods and machine learning methodsto design a detection algorithm for cooktop ignition prevention. Data was obtained from experiments ofa variety of ignition and normal-cooking scenarios. The experiments were focused on measuring sensorresponse, with limited consideration of effluent transport to the sensors. Our approach was to developand evaluate the performance of sensor-based prediction algorithms using threshold analysis and neural-network models.
2 Further research may be needed to characterize the long-term performance of a sensor system exposed to a range of typicalcooking scenarios and kitchen conditions.
Sensors and Machine Learning Models to Prevent Cooktop Ignition and Ignore Normal Cooking 3
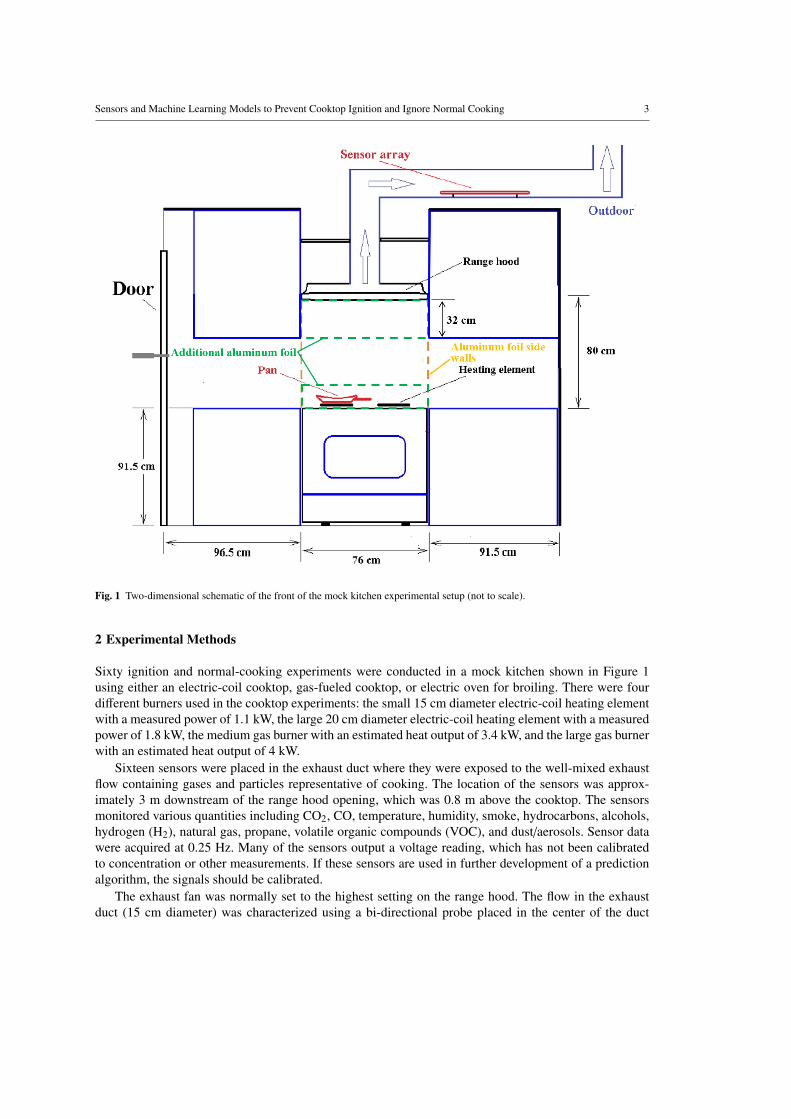
Fig. 1 Two-dimensional schematic of the front of the mock kitchen experimental setup (not to scale).
2 Experimental Methods
Sixty ignition and normal-cooking experiments were conducted in a mock kitchen shown in Figure 1using either an electric-coil cooktop, gas-fueled cooktop, or electric oven for broiling. There were fourdifferent burners used in the cooktop experiments: the small 15 cm diameter electric-coil heating elementwith a measured power of 1.1 kW, the large 20 cm diameter electric-coil heating element with a measuredpower of 1.8 kW, the medium gas burner with an estimated heat output of 3.4 kW, and the large gas burnerwith an estimated heat output of 4 kW.
Sixteen sensors were placed in the exhaust duct where they were exposed to the well-mixed exhaustflow containing gases and particles representative of cooking. The location of the sensors was approx-imately 3 m downstream of the range hood opening, which was 0.8 m above the cooktop. The sensorsmonitored various quantities including CO2, CO, temperature, humidity, smoke, hydrocarbons, alcohols,hydrogen (H2), natural gas, propane, volatile organic compounds (VOC), and dust/aerosols. Sensor datawere acquired at 0.25 Hz. Many of the sensors output a voltage reading, which has not been calibratedto concentration or other measurements. If these sensors are used in further development of a predictionalgorithm, the signals should be calibrated.
The exhaust fan was normally set to the highest setting on the range hood. The flow in the exhaustduct (15 cm diameter) was characterized using a bi-directional probe placed in the center of the duct

4 Amy E. Mensch et al.
about 20 diameters downstream of a bend. The typical, average velocity was 3.4 m/s with a standarduncertainty of ± 0.1 m/s. The average velocity varied between experiments with a standard deviation of0.2 m/s. Using the electric-coil cooktop, the duct temperature increased by an average of 9 ◦C causingan estimated reduction in duct mass flow of 3 %. For the gas cooktop, the duct temperature increased byan average of 23 ◦C, which is estimated to reduce the duct mass flow by 7 %. Aluminum foil was addedon the sides of the cooktop to reduce the impact of room air currents on the plume flow above the heatedpan and reduce transport effects. For Experiments 8 to 15 and 19 to 34, additional aluminum foil, shownin green in Figure 1, was added to the front of the cooktop and exhaust hood to ensure that most of theplume flowed into the hood and past the sensors stationed in the duct.
2.1 Experimental Cooking Scenarios
The cooking scenarios covered a wide range of conditions representative of normal cooking as well asconditions beyond normal cooking, sometimes leading to ignition of the food. The experiments usedround, cast iron, aluminum, multi-layered, and stainless-steel pans with diameters of either 20 cm (8 in)or 25 cm (10 in). Typically, one pan of food was heated per experiment, but multiple pans were simulta-neously heated on separate burners in a few experiments. In most cases, the smaller burner was used forthe 20 cm pan, and the larger burner was used for the 25 cm pan.
The conditions for all 60 experiments are described in Table 1. The foods in the experiments werevegetable oils, butter, water, hamburgers, salmon, bacon, frozen french fries, and chicken. Common veg-etable cooking oils in the U.S [9], soybean, canola, olive, sunflower, and corn oils, were tested. In total,39 of the 60 experiments led to auto-ignition of the food, including cooking oils, salmon, fries, and bacon.Ignition typically occurred 10 min to 15 min after turning on the burner.
Cooking oils and bacon were heated on the highest burner setting until ignition occurred or the sensorsignals began to drop and only char remained. The cooking procedure for the hamburgers (80 % lean)was the same as in Cleary [10]. Two hamburgers were also cooked on a broiler pan placed on the top shelfof the oven on the broil setting, according to the UL 217 Cooking Nuisance Smoke Test procedure [11].
The cooking procedures for salmon, chicken and frozen fries were based on the consensus from avariety of recipes. In the salmon cooking procedure, the butter was heated on high for 3 min, the salmonwas added and heated on high for 4 min, and the salmon was flipped and cooked on high for 4 min.Following that procedure, unattended cooking was simulated by continuing to cook the salmon at thehighest setting. In one case, the salmon eventually ignited. For chicken legs in 200 mL of preheated oil,the burner was set to half of the maximum to maintain a pan temperature of about 200 ◦C for frying. Thechicken legs were flipped four times, every 4 min. For frozen fries, initially 500 mL of canola oil waspreheated to 200 ◦C. After the frozen fries were added, the burner power was adjusted to maintain a pantemperature around 200 ◦C. After 15 min of cooking, the burner was turned to its highest setting, and thefood later ignited.
2.2 Pan Temperature Measurements
In each experiment, pan temperatures were measured at one or more locations using Type-K thermo-couples either spot welded or peened to the food side of the pan. The thermocouples showed significantvariations in temperature across the pan surface. The standard uncertainty of the Type-K thermocoupleswas ± 2.2 ◦C according to the manufacturer. Figure 2 shows calibrated infrared (IR) images of dry, (nooil) cast-iron pans. The images reveal the distribution of temperatures on the small electric coil elementand on the large gas burner, which was influenced by pan orientation and geometry. The maximum tem-perature the camera could monitor was 370 ◦C, so regions above that temperature are shown as white.The simultaneous, thermocouple measurements that were used to calibrate the IR images are labeled in

Sensors and Machine Learning Models to Prevent Cooktop Ignition and Ignore Normal Cooking 5
Table 1 Experimental Conditions
Number Ignition Heating Source Pan Type Pan Diameter Food & Amount(cm)
1 Y 1.1 kW electric coil cast iron 20 50 mL canola oil2 Y 1.1 kW electric coil cast iron 20 50 mL canola oil3 Y 1.1 kW electric coil cast iron 20 50 mL canola oil4 Y 1.1 kW electric coil cast iron 20 50 mL canola oil5 Y 1.1 kW electric coil cast iron 20 50 mL canola oil6 Y 1.1 kW electric coil cast iron 20 50 mL canola oil7 Y 1.1 kW electric coil cast iron 20 50 mL canola oil8 Y 1.1 kW electric coil cast iron 20 50 mL canola oil9 Y 1.1 kW electric coil cast iron 20 100 mL canola oil10 Y 1.1 kW electric coil aluminum 20 50 mL canola oil11 Y 1.1 kW electric coil multi-layered 20 50 mL canola oil12 Y 1.1 kW electric coil stainless steel 20 50 mL canola oil13 Y 1.1 kW electric coil cast iron 20 200 mL canola oil14 Y 1.8 kW electric coil cast iron 20 50 mL canola oil15 Y 1.8 kW electric coil cast iron 25 100 mL canola oil16 N 1.1 kW electric coil aluminum 20 50 mL corn oil17 Y 1.1 kW electric coil aluminum 20 50 mL corn oil18 Y 1.1 kW electric coil cast iron 20 50 mL corn oil19 Y 1.8 kW electric coil cast iron 25 100 mL corn oil20 Y 1.1 kW electric coil cast iron 20 50 mL corn oil21 Y 1.1 kW electric coil cast iron 20 50 mL soybean oil22 Y 1.8 kW electric coil cast iron 25 100 mL soybean oil23 Y 1.1 kW electric coil cast iron 20 50 mL olive oil24 Y 1.8 kW electric coil cast iron 25 100 mL olive oil25 Y 1.8 kW electric coil cast iron 25 100 mL sunflower oil26 Y 1.1 kW electric coil cast iron 20 50 mL sunflower oil27 Y 1.1 kW electric coil cast iron 20 46 g butter28 N electric oven broiler pan N/A 460 g (1 lb) of hamburgers (2)29 N 1.1 kW electric coil cast iron 20 230 g (0.5 lb) hamburger (1)30 N 1.8 kW electric coil cast iron 25 460 g (1 lb) of hamburgers (2)31 Y 1.1 kW electric coil cast iron 20 227 g (8 oz) salmon & 42.5 g butter32 N 1.8 kW electric coil cast iron 25 454 g (16 oz) salmon & 85.1 g butter33 N 1.1 kW electric coil cast iron 20 50 mL water34 N 1.8 kW electric coil none N/A N/A35 Y 1.1 kW electric coil cast iron 20 50 mL canola oil & 2 L water
on separate burners36 Y 1.1 kW electric coil cast iron 20 50 mL canola oil37 N 1.1 kW electric coil cast iron 20 50 mL canola oil38 N 1.1 kW electric coil aluminum 20 50 mL canola oil39 N 1.1 kW & 1.8 kW electric coil cast iron & 20 50 mL canola oil in each pan
aluminum40 N 1.1 kW electric coil cast iron 20 50 mL canola oil41 N electric oven broiler pan N/A 460 g of hamburgers (2)42 N 1.1 kW electric coil cast iron 20 227 g (8 oz) salmon & 45.4 g butter43 N 1.1 kW electric coil cast iron 20 282 g chicken legs (2)
& 200 mL canola oil44 Y 1.8 kW electric coil cast iron 25 223 g frozen french fries
& 500 mL canola oil45 N 1.8 kW electric coil cast iron 25 220 g bacon (8 slices)46 Y 1.1 kW electric coil cast iron 20 110 g bacon (4 slices)47 N 1.8 kW electric coil cast iron 25 460 g (1 lb) of hamburgers (2)48 Y 1.1 kW & 1.8 kW electric coil cast iron 20 & 25 50 mL & 100 mL canola oil
in separate pans49 Y 1.1 kW & 1.8 kW electric coil cast iron 20 & 25 50 mL & 100 mL canola oil
in separate pans50 Y 1.1 kW & 1.8 kW electric coil cast iron 20 & 25 50 mL & 100 mL olive oil
in separate pans51 Y 1.1 kW electric coil cast iron 20 50 mL canola oil52 N 4 kW methane gas none N/A N/A53 N 3.4 kW methane gas cast iron 20 50 mL canola oil54 Y 4 kW methane gas cast iron 25 100 mL canola oil55 N 4 kW methane gas cast iron 25 N/A56 Y 4 kW methane gas cast iron 25 100 mL canola oil57 Y 4 kW methane gas cast iron 20 50 mL canola oil58 Y 4 kW methane gas cast iron 25 100 mL canola oil59 N 4 kW methane gas none N/A N/A60 N 3.4 kW & 4 kW methane gas cast iron 20 & 25 50 mL & 100 mL canola oil
in separate pans
6 Amy E. Mensch et al.
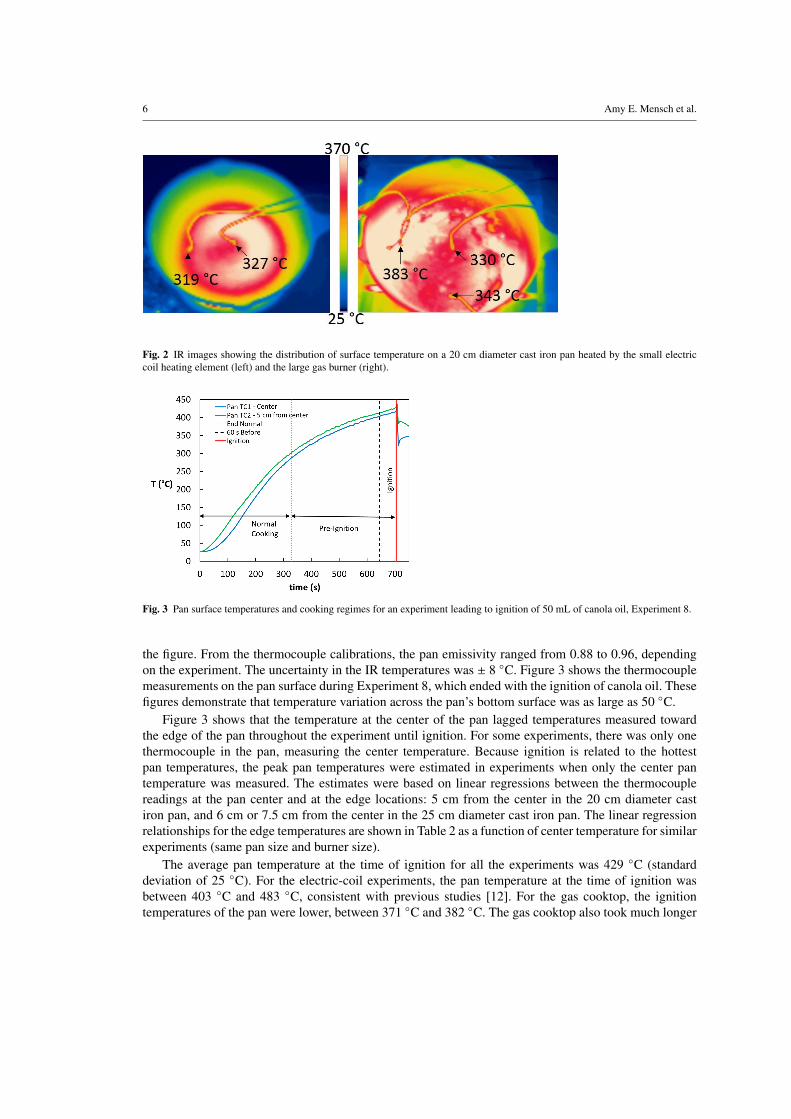
Fig. 2 IR images showing the distribution of surface temperature on a 20 cm diameter cast iron pan heated by the small electriccoil heating element (left) and the large gas burner (right).
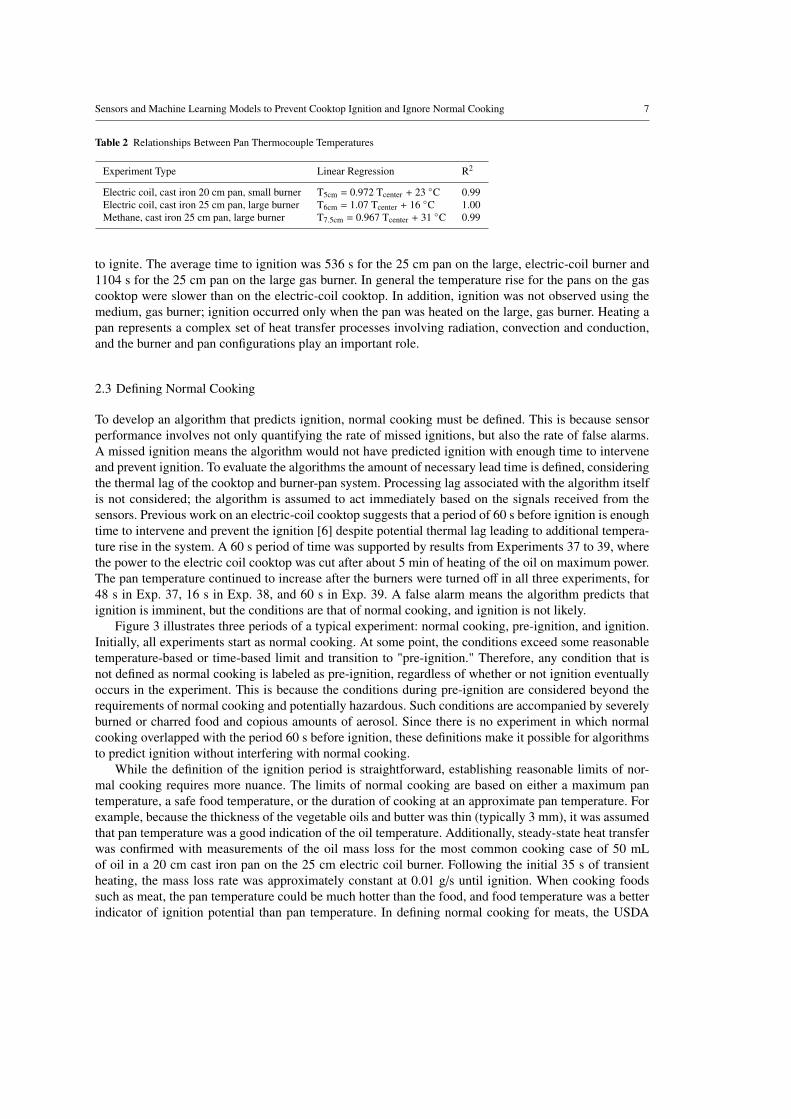
Fig. 3 Pan surface temperatures and cooking regimes for an experiment leading to ignition of 50 mL of canola oil, Experiment 8.
the figure. From the thermocouple calibrations, the pan emissivity ranged from 0.88 to 0.96, dependingon the experiment. The uncertainty in the IR temperatures was ± 8 ◦C. Figure 3 shows the thermocouplemeasurements on the pan surface during Experiment 8, which ended with the ignition of canola oil. Thesefigures demonstrate that temperature variation across the pan’s bottom surface was as large as 50 ◦C.
Figure 3 shows that the temperature at the center of the pan lagged temperatures measured towardthe edge of the pan throughout the experiment until ignition. For some experiments, there was only onethermocouple in the pan, measuring the center temperature. Because ignition is related to the hottestpan temperatures, the peak pan temperatures were estimated in experiments when only the center pantemperature was measured. The estimates were based on linear regressions between the thermocouplereadings at the pan center and at the edge locations: 5 cm from the center in the 20 cm diameter castiron pan, and 6 cm or 7.5 cm from the center in the 25 cm diameter cast iron pan. The linear regressionrelationships for the edge temperatures are shown in Table 2 as a function of center temperature for similarexperiments (same pan size and burner size).
The average pan temperature at the time of ignition for all the experiments was 429 ◦C (standarddeviation of 25 ◦C). For the electric-coil experiments, the pan temperature at the time of ignition wasbetween 403 ◦C and 483 ◦C, consistent with previous studies [12]. For the gas cooktop, the ignitiontemperatures of the pan were lower, between 371 ◦C and 382 ◦C. The gas cooktop also took much longer
Sensors and Machine Learning Models to Prevent Cooktop Ignition and Ignore Normal Cooking 7
Table 2 Relationships Between Pan Thermocouple Temperatures
Experiment Type Linear Regression R2
Electric coil, cast iron 20 cm pan, small burner T5cm = 0.972 Tcenter + 23 ◦C 0.99Electric coil, cast iron 25 cm pan, large burner T6cm = 1.07 Tcenter + 16 ◦C 1.00Methane, cast iron 25 cm pan, large burner T7.5cm = 0.967 Tcenter + 31 ◦C 0.99
to ignite. The average time to ignition was 536 s for the 25 cm pan on the large, electric-coil burner and1104 s for the 25 cm pan on the large gas burner. In general the temperature rise for the pans on the gascooktop were slower than on the electric-coil cooktop. In addition, ignition was not observed using themedium, gas burner; ignition occurred only when the pan was heated on the large, gas burner. Heating apan represents a complex set of heat transfer processes involving radiation, convection and conduction,and the burner and pan configurations play an important role.
2.3 Defining Normal Cooking
To develop an algorithm that predicts ignition, normal cooking must be defined. This is because sensorperformance involves not only quantifying the rate of missed ignitions, but also the rate of false alarms.A missed ignition means the algorithm would not have predicted ignition with enough time to interveneand prevent ignition. To evaluate the algorithms the amount of necessary lead time is defined, consideringthe thermal lag of the cooktop and burner-pan system. Processing lag associated with the algorithm itselfis not considered; the algorithm is assumed to act immediately based on the signals received from thesensors. Previous work on an electric-coil cooktop suggests that a period of 60 s before ignition is enoughtime to intervene and prevent the ignition [6] despite potential thermal lag leading to additional tempera-ture rise in the system. A 60 s period of time was supported by results from Experiments 37 to 39, wherethe power to the electric coil cooktop was cut after about 5 min of heating of the oil on maximum power.The pan temperature continued to increase after the burners were turned off in all three experiments, for48 s in Exp. 37, 16 s in Exp. 38, and 60 s in Exp. 39. A false alarm means the algorithm predicts thatignition is imminent, but the conditions are that of normal cooking, and ignition is not likely.
Figure 3 illustrates three periods of a typical experiment: normal cooking, pre-ignition, and ignition.Initially, all experiments start as normal cooking. At some point, the conditions exceed some reasonabletemperature-based or time-based limit and transition to "pre-ignition." Therefore, any condition that isnot defined as normal cooking is labeled as pre-ignition, regardless of whether or not ignition eventuallyoccurs in the experiment. This is because the conditions during pre-ignition are considered beyond therequirements of normal cooking and potentially hazardous. Such conditions are accompanied by severelyburned or charred food and copious amounts of aerosol. Since there is no experiment in which normalcooking overlapped with the period 60 s before ignition, these definitions make it possible for algorithmsto predict ignition without interfering with normal cooking.
While the definition of the ignition period is straightforward, establishing reasonable limits of nor-mal cooking requires more nuance. The limits of normal cooking are based on either a maximum pantemperature, a safe food temperature, or the duration of cooking at an approximate pan temperature. Forexample, because the thickness of the vegetable oils and butter was thin (typically 3 mm), it was assumedthat pan temperature was a good indication of the oil temperature. Additionally, steady-state heat transferwas confirmed with measurements of the oil mass loss for the most common cooking case of 50 mLof oil in a 20 cm cast iron pan on the 25 cm electric coil burner. Following the initial 35 s of transientheating, the mass loss rate was approximately constant at 0.01 g/s until ignition. When cooking foodssuch as meat, the pan temperature could be much hotter than the food, and food temperature was a betterindicator of ignition potential than pan temperature. In defining normal cooking for meats, the USDA

8 Amy E. Mensch et al.
safe minimum internal temperatures for chicken (74 ◦C), fish (63 ◦C), and ground beef (71 ◦C) [13] wereused.
The end of normal cooking for all types of oils and butter was defined when the pan temperaturereached 300 ◦C. When deep-frying, it is recommended to keep oils below their smoke point, and thehighest oil smoke points are around 230 ◦C [14]. Therefore, a limit of 300 ◦C allowed significantlymore heating than recommended, while being well below oil ignition temperatures. For bacon, a USDAfact sheet states, "It’s very difficult to determine the temperature of a thin piece of meat such as bacon,but if cooked crisp, it should have reached a safe temperature." [15] Instead of relying on a crispnessdetermination, we treated bacon like oils, and the end of normal cooking was when the pan temperaturereached 300 ◦C. This was reasonable since bacon is very high in fat, and liquid fat quickly coats the panlike vegetable oil. Photos taken at a pan temperature of 300 ◦C showed that the bacon had already begunto blacken. Some bacon experiments led to ignition.
For chicken legs in 200 mL of preheated oil, the burner was set to medium power to maintain a pantemperature of about 200 ◦C for frying. The chicken legs were flipped every 4 min for a total cookingtime of 18.5 min, which was 10 % longer than the time it took for the thermocouple inserted in themiddle of the meat to reach 74 ◦C. This time was defined as the end of normal cooking, and the internalchicken temperature was 80 ◦C. For salmon fried in butter on high power for 4 min on each side, thethermocouples inside the meat did not show a steady increase in temperature. In most cases, the meattemperature exceeded 63 ◦C at least momentarily before the end of the 8 min cooking period, which wastaken as the end of normal cooking.
For hamburgers, the end of the frying procedure used by Cleary [10] was about 10 % longer than thetime for the temperatures in the middle of the hamburgers to reach 71 ◦C. At the end of this procedure, themeat temperature was about 77 ◦C, which is an indication of well-done beef [16]. Therefore, the end ofthe frying-hamburger procedure was defined as the end of normal cooking. For broiling hamburgers, theUL 217 Cooking Nuisance Smoke Test [11] specifies 25 min of broiling. However, in our experiments,adding an additional 10 % to the time when the hamburgers reached 71 ◦C, was less than 18 min (1122 s).Therefore, this was defined as the end of normal cooking, and at this time the meat temperature was82 ◦C.
For frozen fries in 500 mL of preheated oil, the burner power was adjusted periodically to maintaina pan temperature around 200 ◦C, like was done for the experiments cooking chicken legs. There is norecommended safe temperature for fries, so the end of normal cooking was defined as 15 min of fryingand when the color of the fries had turned medium brown. After the end of normal cooking, the burnerpower was turned to high and the fries and oil later ignited.
3 Sensor Analysis
Each sensor signal was characterized by its unique profile with its absolute value and slope varying intime. Eleven of the sensor signals tended to increase in time as ignition approached, as shown in Figure4 (Experiment 8) and Figure 5 (Experiment 57). Not plotted are the CO2, humidity, and duct temperaturesensors, which were less responsive before ignition, and typically increased sharply just after ignition.The figure legend indicates the detection target of the sensor. HCs means hydrocarbons such as butane,propane, and methane, and IAQ means indoor air quality. A sensor may respond to quantities other thanthose indicated by its label, such as the dust sensor, which operates using light scattering and respondsto both dust particles and cooking aerosols. The average background signals of the 11 responsive sensorswere subtracted from the raw, signal outputs. The complete set of sensor data for all experiments isreported in [17].
Figures 4 and 5 plot the signals of the 11 responsive sensors for canola-oil experiments on an electric-coil burner and a gas burner, respectively. For clarity, the signals in Figures 4 and 5 are normalized by

Sensors and Machine Learning Models to Prevent Cooktop Ignition and Ignore Normal Cooking 9
Fig. 4 Sensor signals (background subtracted and normalized by sensor peak) and cooking regimes for an experiment leading toignition of canola oil in a cast iron pan on an electric-coil burner, Experiment 8.
Fig. 5 Sensor signals (background subtracted and normalized by sensor peak) and cooking regimes for an experiment leading toignition of canola oil in a cast iron pan on a gas burner, Experiment 57.
the maximum value recorded from that sensor over all experiments. In both figures, ignition occurredat the maximum time shown on the graph, and the ignition period of 60 s before ignition is marked.The regimes of normal cooking and pre-ignition are also shown, with the transition occurring when thepan temperature exceeded 300 ◦C. The most noticeable differences in the sensor responses between theexperiments are the responses of the natural gas sensor and the generally lower signals for the gas burnerexperiment. Reduced sensor signals for the experiments with the gas cooktop compared to electric coilwas a consistent trend across the experiments.
Sensor signals and their ratios were evaluated across all experiments to determine if a threshold valuecould be selected to both prevent ignition and ignore normal-cooking conditions. Machine learning wasalso used to classify sensor data as representing normal cooking or pre-ignition conditions, and a similarperformance metric was used.
3.1 Threshold Analysis
A threshold value of a sensor or sensor ratio could potentially miss ignitions as well as trigger false alarms.We considered the most conservative sensor or ratio threshold, which is the minimum value obtained at

10 Amy E. Mensch et al.
least 60 s before all ignitions. The false alarm rate (FAR) to evaluate the threshold performance, definedin Equation 1, was the ratio of the number of experiments with a false alarm to the total number ofexperiments. The FAR can also be described as the false positive rate.
FAR =false alarms
total # experiments=
# exp. exceeding threshold during normal cooking60
(1)
In addition to investigating the performance of thresholds of individual sensor values as a criteria toprevent cooktop ignition and minimize false alarms, the ratios between sensor values were also consid-ered. Carbon dioxide (mole fraction), duct temperature (K), and humidity (mole fraction of water) signalswere used in the denominator of ratios. These signals did not include background subtraction to avoiddividing by zero because the values during the experiment were similar to the background.
3.2 Neural-Network Analysis
The sensor signals were also used to train a multi-layer perceptron that can differentiate between normalcooking and pre-ignition conditions. A four-layer neural-network architecture was used with one inputlayer, two hidden layers, and one output layer. The two hidden layers, with 64 neurons and 32 neurons,respectively, were activated with a rectified linear unit (ReLU) activation function. The numbers of hiddenlayers and neurons were selected based on initial testing for accuracy and efficiency. The initial testingwas performed for neural networks trained on 28 experiments and tested on five experiments. Beginningwith one hidden layer of eight neurons, neurons were added, and then hidden layers, until there wasno longer a significant improvement in performance. The ReLU activation function was used for itsnumerical performance in engineering applications. For the output, a sigmoid activation function wasused because it gives a probability ranging from 0 to 1. The maximum number of epochs or iterations wasset to 300, and the iterations were stopped if the validation accuracy did not improve for five consecutiveiterations.
Each time point was classified individually with a label assigned as "0" during the normal cookingwindow and "1" during the pre-ignition period. The analysis considered over 12 800 time points in the 60experiments. A cross-validation method, where the neural-network model was trained using the data from59 experiments (training set) and then tested on the last experiment (testing set), was used. This processwas repeated 60 times until each experiment was excluded from the training and used once as the test set.Each iteration of training and testing was done on a newly created neural network. The output for eachtime point in the test experiment, a value between 0 and 1, was the model prediction for the probabilityof pre-ignition for that time. The values were converted to 0 or 1 using thresholds of 0.5, 0.8, 0.9 or 0.98to compare the model predictions to the binary labels from the experiment.
There were 35 total neural-network models developed, including 28 unique cases that used differentsets of training data and seven repeat cases, to characterize repeatability of the model development. Thebaseline case used all 11 sensor data sets as the input training data. Eleven cases were based on only asingle sensor as training input. Finally, 16 unique pairs of sensors were used as input data for additionalcases, which are listed in Table 3. The pairs were selected from the individual sensors with the bestthreshold or machine learning performance and from the sensors included in the ratios with the bestperformance. The repeated cases were the baseline case, three single sensor cases (using the VOC, IAQ,and smoke sensors), and the three best performing cases using sensor pairs, noted in Table 3.
The overall performance was evaluated by quantifying the rate of false alarms and the rate of missedignitions on a per-experiment basis. The rate of false alarms (FAR) was the same as defined in Equation1, with a false alarm defined as an experiment with any wrongly predicted values above the thresholdwithin the normal cooking window. A missed ignition was an experiment where ignition occurred, butthe prediction value did not reach the threshold at any time up to the start of the ignition window (60 s

Sensors and Machine Learning Models to Prevent Cooktop Ignition and Ignore Normal Cooking 11
Table 3 Neural-Network Model Cases Based on Pairs of Sensor Signals
Sensor Input Data
VOC & Duct Temp.VOC & HumidityVOC & IAQVOC & Dust1
VOC & CO expensive1
VOC & CO cheap1
IAQ & Duct Temp.IAQ & HumidityIAQ & DustIAQ & SmokeIAQ & CO expensiveIAQ & CO cheapDust & Duct Temp.Dust & CO expensiveDust & CO cheapSmoke & CO expensive
1 repeated case
before ignition). A practical implication of this definition is that if a sensor caused a false alarm in anexperiment, the same experiment could not be counted as a missed ignition for that sensor. To calculatethe missed ignition rate (MIR), the number of missed ignitions was divided by the number of experimentsin which ignition was observed. The MIR can also be described as the false negative rate.
MIR =missed ignitions
# ignition experiments=
# exp. not reaching threshold before ignition window39
(2)
4 Results and Discussion
4.1 Threshold Results
For individual sensors, the optimal threshold values such that no ignitions are missed are reported in Ta-ble 4 along with the operating principle of each sensor. With the exception of the expensive CO sensorand the IAQ sensor, most of the thresholds are reported as measured voltages because the sensors havenot been calibrated. The output of the IAQ sensor corresponds to the equivalent mole fraction of CO2×10−6 (PPM), according to a calibration from the manufacturer. The threshold’s estimated uncertainty isdetermined from the range in the signal during the background measurement period of one experiment,and reported as a percentage of the optimal threshold. The performance of the threshold with no missedignitions is reported as the FAR. Also shown is the maximum FAR that would have occurred if the thresh-old was decreased by the uncertainty and the maximum missed ignition rate that would have occurred ifthe threshold was increased by the uncertainty.
The best performance is for the VOC sensor with a 0.02 false alarm rate, or one false alarm in 60experiments. The false alarm occurred about two minutes before the end of normal cooking in Experiment47. This was one of the experiments in which frying hamburgers were cooking on a 25 cm cast-iron panon the large, electric-coil burner. At that time, the thermocouples inside the hamburgers were both 68 ◦C,which is just below the safe temperature for ground beef (71 ◦C), but still within our definition of normalcooking. However, when taking into account the threshold uncertainties, the VOC sensor would have anon-zero missed ignition rate (miss one ignition), while the IAQ and dust sensors would not miss anyignitions.

12 Amy E. Mensch et al.
Table 4 Optimal Thresholds of Individual Sensors and Their Performance
Estimated False FAR w/ Missed IgnitionSensor Threshold Units Threshold Alarm Threshold Rate (MIR) Operating Principle
Uncert. Rate Decrease w/ Threshold(FAR) Increase
VOC 0.57 V 3 % 0.02 0.02 0.03 metal oxide semiconductorIAQ 12 300 ×10−6 1 % 0.05 0.07 0 metal oxide semiconductor
(mole fraction)Dust 0.20 V 14 % 0.08 0.12 0 light scatteringAlcohol 0.99 V 1 % 0.10 0.12 0.03 electrochemicalSmoke 0.49 V 11 % 0.22 0.28 0.03 electrochemicalCO expensive 4.7 ×10⁻⁶ 64 % 0.22 0.71 0.03 electrochemical
(mole fraction)CO cheap 0.0088 V 156 % 0.23 1.00 0.21 electrochemicalHCs, low range 0.23 V 14 % 0.23 0.27 0.03 electrochemicalHCs, high range 0.17 V 25 % 0.38 0.48 0.03 electrochemicalH2 0.0083 V 157 % 0.47 1.00 0.21 electrochemicalNatural gas 0.0058 V 130 % 0.92 1.00 0.13 electrochemical
The estimated relative uncertainties of some of the sensor thresholds were substantial. This was thecase for both CO sensors, the H2 sensor, and the natural gas sensor. For these sensors, the threshold fordetection was on the same order or less than the signal variation. The two different CO sensors performsimilarly despite the differences in output format and price. However, the two CO sensors had quitedifferent threshold uncertainties, with the uncertainty for the cheaper CO sensor much higher than theexpensive CO sensor. The CO, H2, and natural gas sensors all perform much worse when consideringtheir threshold uncertainties, with significant missed ignition rates or high false alarm rates. Using thesesensors alone would likely result in poor performance in practice due to the inevitable signal variationsfrom different sensors and different cooking conditions.
Figure 6 shows the performance of the eight individual sensors with the lowest false alarm rates aswell as their ratios with duct temperature, humidity, and CO2. The lowest FAR was with the VOC sensoralone and in a ratio with duct temperature. These performed significantly better than all the other sensorsor ratios of sensors by a factor of 2 to 15. The ratios of sensors with duct temperature have similarperformance to the sensor alone, while the ratios with humidity or with CO2 tend to perform the sameor worse than the sensor alone. One exception is the ratio of the expensive CO sensor to CO2, which isslightly better than the CO sensor alone. The most significant improvement occurs for the ratio of thelow range hydrocarbon sensor to humidity, with the false alarm rate for the ratio falling to 0.15 from thehydrocarbon sensor alone at 0.23. The ratio of the low-range, hydrocarbon sensor to the duct temperatureis also slightly lower than the hydrocarbon sensor alone.
4.2 Neural-Network Results
An example output of the neural-network analysis is given in Figure 7, which shows the specific predic-tions for one experiment from one model case. The labels for pre-ignition and ignition from Experiment24 are shown as well as the prediction of pre-ignition from one of the baseline models (based on 11 sen-sors). In this case, use of any of the four prediction thresholds (0.5, 0.8, 0.9, 0.98) results in detection wellahead of the ignition window, which begins 60 s before ignition (red symbols). However, both the 0.5 and0.8 thresholds are reached before the end of normal cooking, and therefore would be considered a falsealarm. Note that once a threshold is reached, that threshold line continues to be 1 even if the prediction

Sensors and Machine Learning Models to Prevent Cooktop Ignition and Ignore Normal Cooking 13
Fig. 6 Threshold false alarm rates of the eight top performing individual sensors and of their ratios with duct temperature, humidity,and CO2.
Fig. 7 Baseline (11 sensor) neural-network model predictions and results using different thresholds for Experiment 24.
curve later drops below the threshold. This is to reflect the functionality of the system in a real application,where an intervention to the hazardous situation would only need to be triggered once.
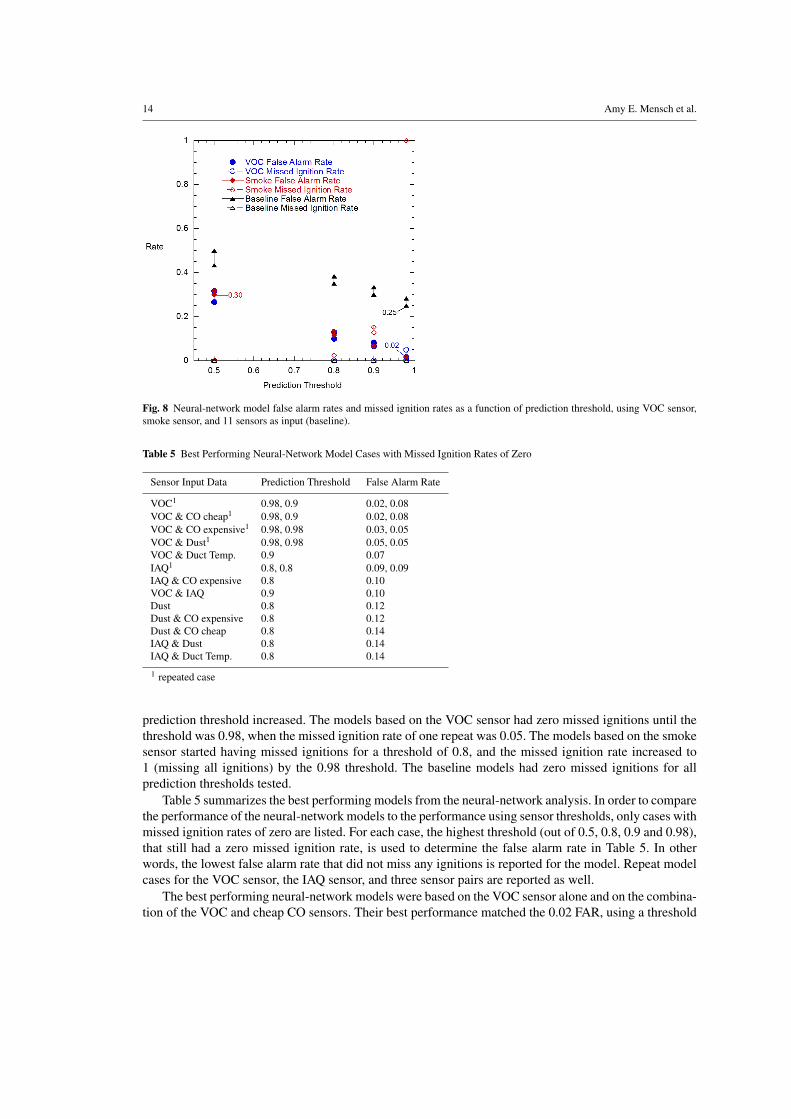
The false alarm rates and missed ignition rates are plotted in Figure 8 as a function of the predictionthreshold for three different neural-network models. False alarm rates are represented by filled symbols,and missed ignition rates are in open symbols. In blue circles, are the rates for the two model cases, bothtrained with only the VOC sensor data. The rates for the models trained with data from the smoke sensorare in red. The baseline models trained with all 11 sensors are in black. The performance of repeat modelcases differed by at most 0.07 (4/60 experiments) for FAR and at most 0.03 (1/39 experiments) for missedignition rate. The lowest false alarm rate with zero missed ignitions is also labeled for the models basedon the VOC sensor, the smoke sensor, and all 11 sensors (baseline).
In all cases, as the prediction threshold increased, the false alarm rate decreased. The missed ignitionrates were typically lower than the false alarm rates because the neural network was trained to predictthe pre-ignition window, which began well before the ignition window. All missed ignition rates usinga prediction threshold of 0.5 were zero. However, the trends of the missed ignition rates differed as the
14 Amy E. Mensch et al.
Fig. 8 Neural-network model false alarm rates and missed ignition rates as a function of prediction threshold, using VOC sensor,smoke sensor, and 11 sensors as input (baseline).
Table 5 Best Performing Neural-Network Model Cases with Missed Ignition Rates of Zero
Sensor Input Data Prediction Threshold False Alarm Rate
VOC1 0.98, 0.9 0.02, 0.08VOC & CO cheap1 0.98, 0.9 0.02, 0.08VOC & CO expensive1 0.98, 0.98 0.03, 0.05VOC & Dust1 0.98, 0.98 0.05, 0.05VOC & Duct Temp. 0.9 0.07IAQ1 0.8, 0.8 0.09, 0.09IAQ & CO expensive 0.8 0.10VOC & IAQ 0.9 0.10Dust 0.8 0.12Dust & CO expensive 0.8 0.12Dust & CO cheap 0.8 0.14IAQ & Dust 0.8 0.14IAQ & Duct Temp. 0.8 0.14
1 repeated case
prediction threshold increased. The models based on the VOC sensor had zero missed ignitions until thethreshold was 0.98, when the missed ignition rate of one repeat was 0.05. The models based on the smokesensor started having missed ignitions for a threshold of 0.8, and the missed ignition rate increased to1 (missing all ignitions) by the 0.98 threshold. The baseline models had zero missed ignitions for allprediction thresholds tested.
Table 5 summarizes the best performing models from the neural-network analysis. In order to comparethe performance of the neural-network models to the performance using sensor thresholds, only cases withmissed ignition rates of zero are listed. For each case, the highest threshold (out of 0.5, 0.8, 0.9 and 0.98),that still had a zero missed ignition rate, is used to determine the false alarm rate in Table 5. In otherwords, the lowest false alarm rate that did not miss any ignitions is reported for the model. Repeat modelcases for the VOC sensor, the IAQ sensor, and three sensor pairs are reported as well.
The best performing neural-network models were based on the VOC sensor alone and on the combina-tion of the VOC and cheap CO sensors. Their best performance matched the 0.02 FAR, using a threshold
Sensors and Machine Learning Models to Prevent Cooktop Ignition and Ignore Normal Cooking 15
of 0.57 V for the VOC sensor signal or a threshold of 0.0019 V/K for the ratio of the VOC sensor to theduct temperature. The one false alarm for the neural-network models would have occurred at the sametime as the VOC sensor exceeded the 0.57 V threshold in Experiment 78. The VOC and expensive COsensor neural-network model also performed well with a 0.03 false alarm rate (2 out of 60 experiments).
The best performing sensors in the neural-network analysis are the VOC, IAQ and dust sensors, one ofwhich is included in each of the top performing model cases in Table 5. These are the same three sensorswith the best signal threshold performance in Table 4. The false alarm rates from the neural-networkmodels based on these individual sensors are within 0.04 of the false alarm rates based on thresholds ofthe individual signals. For the IAQ and dust sensors, the neural-network models have two additional falsealarms compared to the signal threshold, while the VOC neural-network model has the same number.
Some neural-network models trained with multiple sensors had similar or improved performance overthe models trained with only one sensor. The models using the CO sensors individually did not performwell and are not listed in Table 5 because they had missed ignition rates of 0.05 and higher. However,the CO sensors usually complemented other sensors. In the pairing with the VOC sensor and either COsensor, the model had similar or improved performance compared to the single sensors. Pairing the VOCsensor with the dust sensor was also similar or improved performance compared to the individual sensors.The baseline model using all 11 sensors performed worse than many of the models based on pairs orindividual sensors (false alarm rate of 0.25). The baseline model performance was probably negativelyaffected by including input data from the poorest performing sensors, two of which had individual sensormodels with false alarm rates above 0.5 (H2 and natural gas sensors).
5 Conclusions
A set of cooking experiments was designed to investigate the feasibility of creating a robust and reliablemodel to detect pre-ignition conditions for a kitchen cooktop with enough time to prevent food ignition.Sixteen off-the-shelf sensors collected data in the exhaust duct above the cooktop, and the sensor datawere analyzed using thresholds for the signals and signal ratios and using machine learning models. Aprecise and consistent definition of normal cooking versus pre-ignition was required to evaluate modelperformance.
Both signal threshold analysis and machine learning analysis were in complete agreement identifyingthe most effective individual sensors at providing early detection of impending ignition. The three bestperforming sensors were VOC, IAQ, and dust, and both analyses predicted similar rates of false alarmsfor zero missed ignitions. The VOC sensor appeared to be the most effective sensor, but when consideringthe estimated uncertainty in the VOC signal, the VOC threshold could have a missed ignition rate of 0.03.Although the IAQ and dust sensors had slightly greater false alarm rates, they would still have zero missedignitions after applying an estimate for the realistic variation in their thresholds. These three sensors allhad a consistent response to the copious amounts of aerosol released before ignition, which likely includevolatile organic compounds and smoke. Both the VOC and IAQ sensor manufacturer descriptions mentionsensitivity to volatile organic compounds and cooking odors, while the VOC, IAQ and dust sensors allnote sensitivity to smoke. Further investigation into the chemical and physical characteristics of pre-ignition cooking aerosols would be beneficial.
The combined information from multiple sensors was evaluated by both threshold analysis and ma-chine learning analysis. In the threshold analysis, some sensor ratios performed as well as or better thanthe individual sensor values used in the ratios, but none of the ratios performed better than the VOC sen-sor threshold. In the machine learning analysis, multiple sensors were used to train the baseline model(11 sensors) and models based on pairs of sensors. While the baseline model had a 0.25 false alarm rate,it did not miss any ignitions. The model using the VOC sensor paired with both CO sensors performed aswell as the VOC alone, and the model using the VOC and dust sensors performed similarly well. When

16 Amy E. Mensch et al.
two sensors are used to train the neural network, it can learn from the ratio of the signals as well as lessintuitive relationships between the signals that correlate well with the classification label. With additionaltesting scenarios and repeat measurements, models using more than one sensor might be more robust,with less false alarms, because more information is available for the model to make the prediction. Fi-nally, future studies should also investigate the effect of sensor location on the system performance anddurability.
References
1. M. Ahrens, Home Fires Involving Cooking Equipment, National Fire Protection Association, Quincy, MA (2017)2. Underwriter’s Laboratory, Northbrook, IL. UL 858, Standard for Household Electric Ranges (2014). URL https://standardscatalog.ul.com/standards/en/standard_858_16
3. D.T. Gottuk, M.J. Peatross, R.J. Roby, C.L. Beyler, Advanced fire detection using multi-signature alarm algorithms, Fire SafetyJournal 37(4), 381 (2002). DOI 10.1016/S0379-7112(01)00057-1. URL http://linkinghub.elsevier.com/retrieve/pii/S0379711201000571
4. L.A. Cestari, C. Worrell, J.A. Milke, Advanced fire detection algorithms using data from the home smoke detector project, FireSafety Journal 40(1), 1 (2005). DOI 10.1016/j.firesaf.2004.07.004. URL http://linkinghub.elsevier.com/retrieve/pii/S0379711204000682
5. D.T. Gottuk, M.T. Wright, J.T. Wong, H.V. Pham, S.L. Rose-Pehrson, S. Hart, M. Hammond, F.W. Williams, P.A. Tatem, T.T.Street, Prototype Early Warning Fire Detection System: Test Series 4 Results. Interim Report NRL/MR/6180–02-8602, NavalResearch Laboratory (2002)
6. E.L. Johnsson, Study of Technology for Detecting Pre-Ignition Conditions of Cooking-Related Fires Associated with Electricand Gas Ranges and Cooktops, Final Report. NIST Internal Report NISTIR 5950, National Institute of Standards & Technol-ogy, Gaithersburg, MD (1998)
7. E. Johnsson, M. Zarzecki, in 16th International Conference on Automatic Fire Detection (AUBE ’17)& Suppression, Detectionand Signaling Research and Applications Conference (SUPDET 2017) (2017)
8. A. Jain, P. Nyati, N. Nuwal, A. Ansari, C. Ghoroi, P. Ghandi, Pre-Detection of Kitchen Fires due to Auto-Ignition of CookingOil and LPG Leakage in Indian Kitchens, Fire Safety Science 11, 1285 (2014). DOI 10.3801/IAFSS.FSS.11-1285. URLhttp://www.iafss.org/publications/fss/11/1285
9. M. Ash, Edible fats and oils: U.S. Supply and disappearance, 2002/03-2015/16. Tech. Rep. 89002, Economic Re-search Service, United States Department of Agriculture (2016). URL http://usda.mannlib.cornell.edu/MannUsda/viewDocumentInfo.do?documentID=1290
10. T.G. Cleary, A study on the performance of current smoke alarms to the new fire and nuisance tests prescribed in ANSI/UL217-2015. Tech. Rep. NIST TN 1947, National Institute of Standards and Technology, Gaithersburg, MD (2016). DOI10.6028/NIST.TN.1947. URL http://nvlpubs.nist.gov/nistpubs/TechnicalNotes/NIST.TN.1947.pdf
11. Underwriter’s Laboratory, Northbrook, IL. UL/ANSI 217standard for Safety Smoke Alarms (2015). URL https://standardscatalog.ul.com/standards/en/standard_217_8
12. J.B. Dinaburg, D.T. Gottuk, Development of Standardized Cooking Fires for Evaluation of Prevention Technologies: DataAnalysis. Tech. Rep. NIST GCR 15-917-36, National Institute of Standards and Technology (2014). DOI 10.6028/NIST.GCR.15-917-36. URL https://nvlpubs.nist.gov/nistpubs/gcr/2015/NIST.GCR.15-917-36.pdf
13. Safe Minimum Internal Temperature Chart. Tech. rep., United States Department of Agriculture, Food Safety and InspectionService (2019). URL https://www.fsis.usda.gov/safetempchart
14. Deep Fat Frying and Food Safety. Tech. rep., United States Department of Agriculture, Food Safety and Inspection Service(2013). URL https://www.fsis.usda.gov/wps/portal/fsis/topics/food-safety-education/get-answers/food-safety-fact-sheets/safe-food-handling/deep-fat-frying-and-food-safety/ct_index
15. Bacon and Food Safety. Tech. rep., United States Department of Agriculture, Food Safety and Inspection Service(2013). URL https://www.fsis.usda.gov/wps/portal/fsis/topics/food-safety-education/get-answers/food-safety-fact-sheets/meat-preparation/bacon-and-food-safety/ct_index
16. M.H. Group. Meat Temperatures Chart (2019). URL https://www.marthastewart.com/270074/meat-temperatures-chart
17. A.E. Mensch, A. Hamins, K. Markell. Time Series Data from Sensors in the Duct Above a Kitchen Cooktop During NormalCooking and Ignition Conditions (2020). URL https://doi.org/10.18434/M32171