Embed Size (px)
Citation preview

Pa
Ca
b
c
a
ARRAA
KECMGF
1
tta[ogaash
MfoecCr
NT
0d
Sensors and Actuators B 147 (2010) 392–399
Contents lists available at ScienceDirect
Sensors and Actuators B: Chemical
journa l homepage: www.e lsev ier .com/ locate /snb
ortable electronic nose based on carbon nanotube-SnO2 gas sensors and itspplication for detection of methanol contamination in whiskeys
hatchawal Wongchoosuka, Anurat Wisitsoraatb, Adisorn Tuantranontb, Teerakiat Kerdcharoena,c,∗
Department of Physics and Center of Nanoscience and Nanotechnology, Faculty of Science, Mahidol University, Bangkok 10400, ThailandNanoelectronic and MEMS Lab, National Electronic and Computer Technology Center, Pathumthani 12120, ThailandNANOTEC Center of Excellence at Mahidol University, National Nanotechnology Center, Thailand
r t i c l e i n f o
rticle history:eceived 11 March 2009eceived in revised form 16 March 2010ccepted 24 March 2010
a b s t r a c t
In this paper, a portable electronic nose (E-nose) based on hybrid carbon nanotube-SnO2 gas sensors isdescribed. The hybrid gas sensors were fabricated using electron beam (E-beam) evaporation by meansof powder mixing. The instrument employs feature extraction techniques including integral and primaryderivative, which lead to higher classification performance as compared to the classical features (�R and
vailable online 31 March 2010
eywords:-nosearbon nanotubeetal oxide
�R/R0). It was shown that doping of carbon nanotube (CNT) improves the sensitivity of hybrid gas sensors,while quantity of CNT has a direct effect on the selectivity to volatile organic compounds, i.e., methanol(MeOH) and ethanol (EtOH). The real-world applications of this E-nose were also demonstrated. Basedon the proposed methods, this instrument can monitor and classify 1 vol% of MeOH contamination inwhiskeys.
as sensoreature extraction techniques
. Introduction
Nowadays, electronic nose (E-nose) has become a powerfulool to evaluate the aroma compounds during the quality con-rol process of foods and beverages [1–3]. Besides, E-noses havelso been employed for public safety [4], environment protection5,6], disease diagnostics [7], etc. E-nose is composed of an arrayf gas sensors made from various materials that display distinctas-sensing behaviors of which differentiation can be combinednd interpreted via pattern recognition techniques [8]. Among thevailable sensing materials, metal oxide semiconductors (MOS),uch as SnO2 and WO3, have been the most popular due to theirigh sensitivity to a rich set of volatile compounds.
Doping has long been used as a traditional mean to obtain newOS gas sensors that exhibit gas-sensing properties differentiated
rom the original ones. Recently, much interest has been focusedn carbon nanotube (CNT) as potential dopant, due to its special
lectronic properties and high specific surface area that can boostatalytic reactions occurring at the metal oxide surface. The hybridNT–SnO2 gas sensors prepared by different techniques have beeneported to have excellent responses to NO2 [9,10], CO [10], NH3∗ Corresponding author at: Department of Physics and Center of Nanoscience andanotechnology, Faculty of Science, Mahidol University, Bangkok 10400, Thailand.el.: +66 866037395; fax: +66 22015843.
E-mail address: [email protected] (T. Kerdcharoen).
925-4005/$ – see front matter © 2010 Elsevier B.V. All rights reserved.oi:10.1016/j.snb.2010.03.072
© 2010 Elsevier B.V. All rights reserved.
[11], H2 [12], CHOH [13] and indoor air pollutants [14]. Among suchtechniques, co-evaporation of SnO2/CNT is a relatively new conceptto form hybrid CNT–SnO2 gas sensors [15,16]. It offers exten-sive possibilities for controlling the film structure and morphologywith high deposition rates, low contamination, high reliability andhigh productivity. However, there have been very few reports onCNT–SnO2 gas sensors prepared by this technique, and this sensorsystem has not been applied for E-nose applications.
In this work, we report on an E-nose based on hybridizedCNT–SnO2 gas sensors prepared by electron beam (E-beam) evapo-ration, which is inexpensive, fast, portable, reliable and suitable foruse for the detection and classification of both solid and liquid sam-ples. In addition, feature extraction techniques including integraland primary derivative are proposed for improving classificationperformance by principal component analysis (PCA). This E-nosewas tested in a real-world application, i.e., for detecting methanol(MeOH) contaminant in whiskeys. This system will be a useful toolfor quality assurance of whiskey produced by village industries.
2. Experimental
2.1. Fabrication of gas sensors
The gas sensors were fabricated by E-beam evaporation. Top andcross-sectional views of sensor structure are shown in Fig. 1a andb, respectively. First, Cr/Au interdigitated electrodes on aluminasubstrates were prepared. Prior to deposition of the electrodes,

C. Wongchoosuk et al. / Sensors and Actuators B 147 (2010) 392–399 393
Fs
taosecNuwl1
cIutaiaaa
ig. 1. Structure of the gas sensor; (a) top view of interdigitated electrode, (b) cross-ectional view.
he substrates were cleaned by oxygen-ion bombardment undervacuum pressure of ∼10−4 Torr in order to improve the adhesionf the film to the substrates. Cr and Au layers were then succes-ively E-beam evaporated over the alumina substrates throughlectroplated-Ni shadow masks. These shadow masks were fabri-ated by means of standard photolithography and electroplating ofi. The masks were employed by attaching them to the substratessing strong magnets. The resulted thickness of Cr and Au layersere ∼50 nm and ∼200 nm, respectively. The width, spacing, and
ength of the interdigitated electrodes are approximately 100 �m,00 �m, and 1 mm, respectively.
Multi-walled CNT powder was synthesized by thermal chemi-al vapor deposition (CVD) in a lab-made horizontal tube furnace.ron catalyst powder was loaded in the tube furnace and heatedp until the growth temperature of 700 ◦C was reached. The sys-em was then maintained under the hydrogen gas flow of 1.5 l/min
t the atmospheric pressure. Next, acetylene gas was introducednto the system for 2 h for CNT synthesis. The flow ratio betweencetylene and hydrogen was approximately 1:4. The remaining cat-lysts were removed from CNTs by chemical oxidation in 4 M nitriccid at room temperature for 4 h. Then, CNTs were rinsed with DIFig. 2. Typical TEM images of multi-walled CNT (a) before and (b) after purification.
water and dehydrated at 150 ◦C for 2 h [17]. Transmission electronmicroscope (TEM) images of the CNT before and after chemical oxi-dation treatments are shown in Fig. 2a and b, respectively. It isevident that the iron catalysts were effectively removed and thenumber of CNT walls was reduced.CNT–SnO2 mixed powders wereprepared with 0.5 wt% and 1 wt% concentrations by mixing 15 g ofSnO2 powder with 0.075 g and 0.15 g of CNT powders, respectively.The mixed powders were thoroughly mixed by grinding in a mor-tar for 30 min. The pure SnO2 and mixed powders were compressedinto cylindrical pellets in a hard steel mold by a hydraulic compres-sor at a pressure of 15 tons. Next, the compressed SnO2 and mixedCNT–SnO2 materials (0.5 wt% and 1 wt% CNTs) were loaded in E-beam chamber and evaporated over the interdigitated electrodesthrough an electroplated shadow mask with square window pat-tern that aligned to the interdigitated area at an operating vacuumof ∼10−5 Torr. The evaporation condition was based on the previous
studies by Wisitsoraat et al. [15,16]. The film thickness of sensingmaterials is ∼300 nm as measured in situ by quartz crystal monitor.The evaporated film was then annealed at 500 ◦C for 3 h. Finally, aNiCr (Ni 80% and Cr 20%) layer was also E-beam evaporated over thebackside of substrate to perform as a heating unit. The NiCr heater
394 C. Wongchoosuk et al. / Sensors and A
ci
2
(cas
Fig. 3. Photograph of the fabricated sensor.
an perform heating up to 350 ◦C. A photograph of fabricated sensors shown in Fig. 3.
.2. Portable E-nose system
An E-nose has been developed in a briefcase form factor19.5 cm × 29.5 cm × 10 cm). Fig. 4 shows a schematic diagram indi-ating the key components of the portable E-nose system. The cleanir produced from a pump carries aroma molecules of sample into aensor chamber at flow rate 2 l/min. Four electrical solenoid valves
Fig. 4. Schematic diagram of th
ctuators B 147 (2010) 392–399
were used to avoid mixing of gas from the reference and the sample.It is necessary for this type of measurement to switch between areference and a sample glass in order to reduce the humidity effects[18,19].
The sensor array consisting of three gas sensors: SnO2, 0.5 wt%CNT–SnO2 and 1 wt% CNT–SnO2 was symmetrically embedded atthe bottom of a Teflon chamber. A simple linear circuit, called asvoltage divider, was employed for measuring the resistance of eachgas sensor. The load resistance is 20 k� ± 1% while the resistance ofeach gas sensor lies within the range 20–40 k�. The voltage inputis fixed at 5 V. The data were collected every second by a note-book computer using a data acquisition card (NI-DAQ 6008) underLabVIEW software for subsequent analyses.
2.3. PCA and feature extraction techniques
PCA was used for pattern recognition and classification ofsamples measured by the portable E-nose. PCA is a statisticaltechnique that allows an easy visualization of all correlated infor-mation [20]. In principles, PCA process contains five steps asfollows:
i. Get data from matrix, XM×N . The row M represents differentrepetition of the experiment and the column N represents thenumber of independent sensors.
ii. Normalize the data matrix, Norm(XM×N), by the mean subtrac-tion. The mean of each N column is calculated and subtractedfrom the data set. Hence, the new data set produces the meanequal to zero.
iii. Calculate the covariance matrix, Cov(XM×N), and calculate eigen-
vectors and eigenvalues of the covariance matrix. The calculatedeigenvectors must be unit eigenvectors.iv. Rearrange the eigenvectors and eigenvalues. The eigenvec-tors are ordered by eigenvalues from highest to lowest,(−−−−−−−−→Cov(XM×N))max→min.
e portable E-nose system.

C. Wongchoosuk et al. / Sensors and Actuators B 147 (2010) 392–399 395
F lm an( ge of C
sssl
I
P
a
ig. 5. SEM images of sensing films; (a) undoped SnO2 film, (b) 0.5 wt% CNT–SnO2 fid) typical cross-sectional SEM image of CNT–SnO2 film and (e) typical HRTEM ima
v. Obtain the PCA result by matrix multiplication and transpose,((−−−−−−−−→Cov(XM×N))max→min ⊗ Norm(XM×N)
)T. The obtained new data
set with orthogonal linear transformation has been plotted intwo or three dimensions containing the most relevant of thedata set.
However, preprocessing or feature extraction from the acquiredensor signal prior to the use of PCA is very necessary to get bettereparation. Two features: integral and primary derivative, havingpecific physical meanings were proposed as the following formu-ation:
ntegral : It =∫ b
a
Voutdt (1)
dVout
rimary derivative : Dt =dt(2)
where Vout represents a sensor signal.In real calculation, the integral and primary derivative of Vout
re obtained from the elements of yIiand yD
i, respectively, using the
d (c) 1 wt% CNT–SnO2 film. The yellow circles in (b) and (c) indicate CNT fragments,NT–SnO2 film.
following relations:
yIi = 1
6
i∑j=0
(xj−1 + 4xj + xj+1)dt (3)
yDi = 1
2dt(xi+1 − xi−1) (4)
where i = 0, 1, 2, . . ., n − 1 and n is the number of samples.In addition, signal integral refers to the accumulative total of
the reaction degree-changing while primary derivative of signalrepresents the reaction rate [21,22].
3. Results and discussion
3.1. Characterization of gas-sensing films
Fig. 5a–c illustrates morphology of the sensing films by scan-ning electron microscopy (SEM), showing the presence of metaloxide grains. Spherical SnO2 particles are clearly observed in theundoped tin oxide film (see Fig. 5a). In the CNT-doped SnO2 films,such spherical particles are smoothed out and smaller SnO2 grain
3 and A
srIatTv
sscccpcocbeaoidt
d
F1
96 C. Wongchoosuk et al. / Sensors
izes are observed. In addition, the CNTs are well embedded andandomly arranged inside the SnO2 film as circled in Fig. 5b and c.t can be seen that although the distributions of CNTs in the filmsre quite random, the densities of the observed CNTs are propor-ional to the concentration of CNTs in the initial mixed powders.herefore, the amount of CNTs in the film can be well controlled byarying the percentage of CNTs in the initial mixed powder.
Typical cross-sectional SEM image of CNT-doped SnO2 film ishown in Fig. 5d. It indicates that the film thickness is about 270 nm,lightly lower than the expected value of 300 nm. The small dis-repancy should be due to some calibration inaccuracies of quartzrystal monitor. The detailed structure of CNT–SnO2 composite washaracterized by high-resolution TEM (HRTEM). The samples wererepared by E-beam evaporation of SnO2/CNT onto carbon coatedopper TEM grid, which was done at the same time as coatingn interdigitated electrodes. A typical HRTEM image of CNT–SnO2omposite is shown in Fig. 5e. From the HRTEM image, it cane identified that a single multi-walled CNT fragment is indeedmbedded in the nanocrystalline SnO2 layer. The diameter of CNTsnd the crystal size of SnO2 were estimated to be in the rangef ∼20–40 nm and 3–10 nm, respectively. Comparing to the TEMmage of pure CNT (Fig. 2b), the nanotube walls cannot be resolved
ue to the presence of SnO2 nanocrystalline thin film surroundinghe surface of CNT.A plausible mechanism for CNT–SnO2 co-evaporation can berawn as follows. When SnO2 was evaporated at temperature of
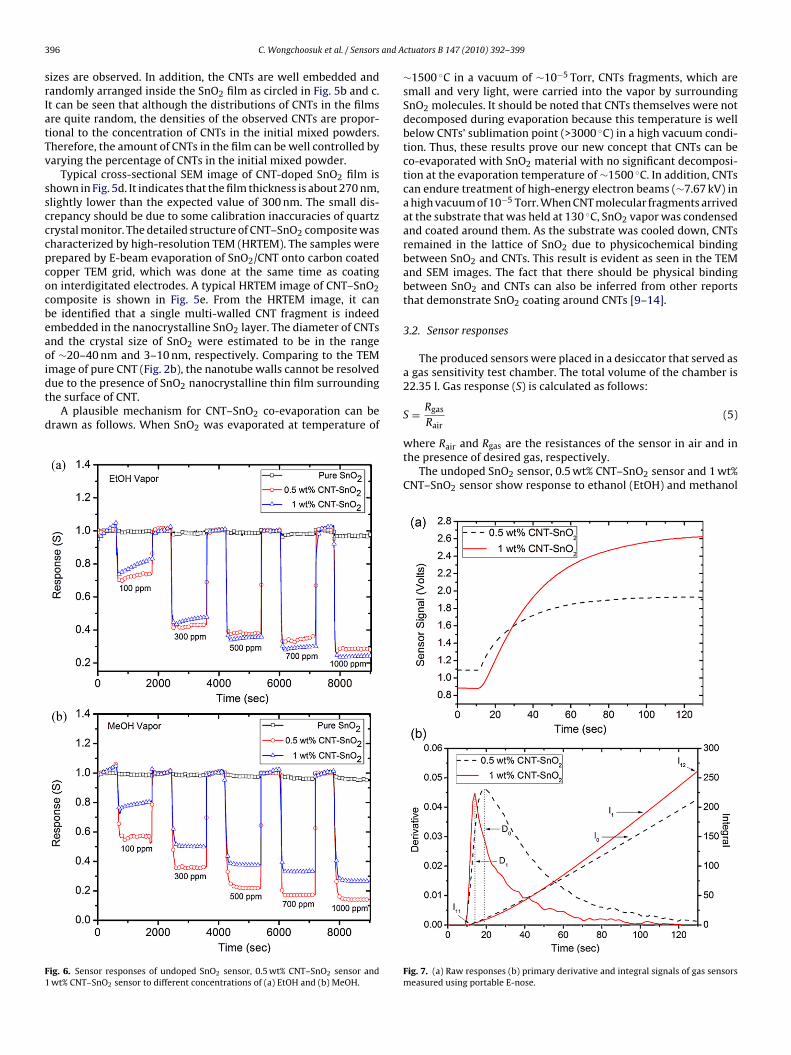
ig. 6. Sensor responses of undoped SnO2 sensor, 0.5 wt% CNT–SnO2 sensor andwt% CNT–SnO2 sensor to different concentrations of (a) EtOH and (b) MeOH.
ctuators B 147 (2010) 392–399
∼1500 ◦C in a vacuum of ∼10−5 Torr, CNTs fragments, which aresmall and very light, were carried into the vapor by surroundingSnO2 molecules. It should be noted that CNTs themselves were notdecomposed during evaporation because this temperature is wellbelow CNTs’ sublimation point (>3000 ◦C) in a high vacuum condi-tion. Thus, these results prove our new concept that CNTs can beco-evaporated with SnO2 material with no significant decomposi-tion at the evaporation temperature of ∼1500 ◦C. In addition, CNTscan endure treatment of high-energy electron beams (∼7.67 kV) ina high vacuum of 10−5 Torr. When CNT molecular fragments arrivedat the substrate that was held at 130 ◦C, SnO2 vapor was condensedand coated around them. As the substrate was cooled down, CNTsremained in the lattice of SnO2 due to physicochemical bindingbetween SnO2 and CNTs. This result is evident as seen in the TEMand SEM images. The fact that there should be physical bindingbetween SnO2 and CNTs can also be inferred from other reportsthat demonstrate SnO2 coating around CNTs [9–14].
3.2. Sensor responses
The produced sensors were placed in a desiccator that served asa gas sensitivity test chamber. The total volume of the chamber is22.35 l. Gas response (S) is calculated as follows:
S = Rgas
Rair(5)
where Rair and Rgas are the resistances of the sensor in air and inthe presence of desired gas, respectively.
The undoped SnO2 sensor, 0.5 wt% CNT–SnO2 sensor and 1 wt%CNT–SnO2 sensor show response to ethanol (EtOH) and methanol
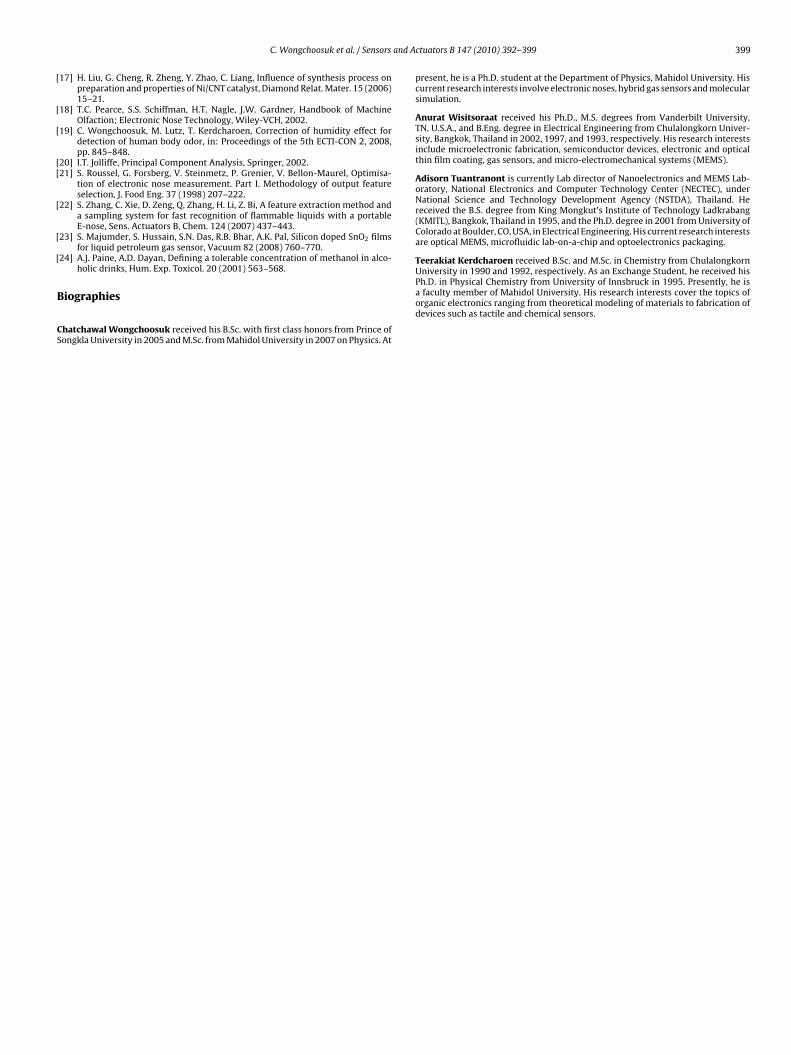
Fig. 7. (a) Raw responses (b) primary derivative and integral signals of gas sensorsmeasured using portable E-nose.

and A
(tfstiabfnfdc
sactiwlhtrCT
C. Wongchoosuk et al. / Sensors
MeOH) as shown in Fig. 6a and b, respectively. It should be notedhat the selected film thickness of 300 nm is an optimized valueor electrical conductivity and sensitivity. It was found from ourtudy that sensors with thickness of less than 200 nm and morehan 400 nm will have too low and too high electrical conductiv-ty, respectively. In addition, the gas-sensing response is increaseds thickness increases from 50 nm to 200 nm and the responseecomes quite independent of thickness as the thickness increasesrom 200 nm to 400 nm and begins to slowly decrease as the thick-ess increases further. In addition, a variation of less than 30% was
ound among ten tested sensors and the sensors have a long termrift of less than 20% over 6 months of operation. Thus, the fabri-ated sensors have reasonably good reproducibility and stability.
From Fig. 6, it can be seen that these materials behave as n-typeemiconductors since their resistance decreases in the presence ofdeoxidizing gas, whereas MWCNT–SnO2 film prepared by spin-
oating technique behave as p-type semiconductors [11]. Underhe operating temperature range ∼250–300 ◦C, CNT doping canmprove the response of gas sensor on EtOH and MeOH compared
ith the pure SnO2 sensor. The response of native SnO2 sensor isower than 2% while CNT-doped SnO2 sensors give the response
igher than 65% at concentration 1000 ppm under such tempera-ure range. The amount of CNT doping exhibits different change inesponse to EtOH and MeOH vapors. Hence, the 0.5 wt% and 1 wt% ofNTs show highest response toward MeOH and EtOH, respectively.hese results confirm that varying of CNT concentration can be usedFig. 8. PCA results using feature extraction from (a) �R, (b
ctuators B 147 (2010) 392–399 397
to tune sensitivity and selectivity of SnO2 sensor to a desired gas. Inthis case, the modified gas sensors can be employed to target MeOHvapor in the MeOH/EtOH mixture. Nevertheless, if CNT amountexceed, the gas sensitivity will be reduced because the CNTs beginto connect together and result in shorter resistance path [15].
3.3. Sensing mechanism of CNT–SnO2 gas sensors
From the gas-sensing data, small percentage of CNT doping sig-nificantly enhances the sensing of MeOH and EtOH. The resultsare consistent with other reports based on CNT–SnO2 compos-ites [9–15]. In these reports, various explanations for gas-sensingenhancement by CNTs have been proposed, for examples, ampli-fication effect of the PN junction structure between n-SnO2 andp-SWCNT [9], the oriented growth of SnO2 along the CNTs duringheat treatment and its consequent enhancement of the local elec-tric field favorable for the gas-sensing reaction [14] and increasedsurface area due to the formation of CNT protrusions [15]. The PNjunction structure between SnO2 and SWCNT is not applied in thepresent case because MWCNTs are used.
In this work, we propose that the observed enhancement effect
is attributed to the nanochannels formed by MWCNTs embeddedin SnO2. The formation of the nanochannels in SnO2 surface canincrease the diffusion of the gas molecules into the metal oxidesurface as well as enhance local electric field at CNT–SnO2 interface.This can considerably enhance dehydrogenation reactions of MeOH) �R/R0 and (c) integral and (d) primary derivative.

3 and A
a
2
2
ftaCicca
3
amtdss
edetdgTDfP�r
cdtsiwtciiaMt2ttotP
nsbscgqf
[
[
[
[
[
98 C. Wongchoosuk et al. / Sensors
nd EtOH as described by [23]:
CH3OH + O2 → 2CH3O + H2O + e− (6)
CH3CH2OH + O2 → 2CH3CHO + H2O + e− (7)
Since the effect of CNTs on gas sensing is primarily on the sur-ace, the gas-sensing response is not significantly dependent onhe thickness when the thickness is sufficiently large. This is inccordance with our observations. Increasing surface area due toNTs intrusion and observed smaller grain size due to CNTs dop-
ng can partly contribute to enhancing gas reaction. However, theontribution from these effects is relatively small because CNT con-entration is so low that the specific surface area is only slightlyffected by CNTs inclusion.
.4. Electronic nose with PCA analysis
Since the fabricated sensors show different response to EtOHnd MeOH, the E-nose based on such sensors can be applied toonitor MeOH contaminant in whiskey. Typical E-nose response
o a whiskey is displayed in Fig. 7a while the integral and primaryerivative of the response are shown in Fig. 7b. Because pure SnO2ensor gives a tiny response, the signal obtained from the pure SnO2ensor was neglected in further analysis.
From each sensor response curve, four different features werextracted for each sample. The first feature extraction is the con-uctance change, defined as �R = Rgas − R0. The second featurextraction is the relative response (�R/R0). The third feature extrac-ion is the integral. This feature was extracted by calculation ofifference accumulative total reaction in the presence of sampleas, i.e., I12 − I11 (see Fig. 7b). The last one is the primary derivative.he maximum amplitude in the same interval was employed, i.e.,0 and D1 (see Fig. 7b). Each data set extracted from each proposed
eature in the form of X56×2 is introduced into the PCA process.CA results of the data sets extracted by the proposed methods;R, �R/R0, integral and primary derivative are shown in Fig. 8a–d,
espectively.The PCA results show that the feature extraction based on �R
annot classify the contamination of MeOH in whiskey due to therift effect of sensor signal depending on temperature variation inhe long time measurement. The classical relative response (�R/R0)eems to give a better result than �R but many samples dispersen the same region and pure whiskey results locate rather close to
hiskey having 1 vol% of MeOH contamination while MeOH con-ent exceeding 2% (v/v) would harm the consumer [24]. In suchase, the resolution power is not enough to guarantee the contam-nation of MeOH in whiskey. For feature extraction using both thentegral and primary derivative data treatments, PCA results showperfect classification between pure whiskey and whiskey havingeOH contamination. Moreover, the primary derivative can clus-
er all level of MeOH contaminations (1 vol%, 5 vol%, 10 vol% and0 vol%) in the whiskey as shown in Fig. 8d. These results indicatehat the proposed feature extractions, integral and primary deriva-ive, provide good capabilities in the recognition and discriminationf MeOH contamination. These may be alternative ways to replacehe common methods (�R and �R/R0) which are widely used inCA analysis.
From our PCA results together with feature extraction tech-ique, it can be seen that although the sensors are structurallyimilar, they can have sufficiently distinct response such that it cane used to discriminate different kind of similar odors. However, it
hould be noted that features extracted from response behaviorsan be dependent on some measuring details such as chamber size,as flow rate, and sensor position in the sensor chamber. Conse-uently, the feature extraction result can be considerably differentor different E-nose systems. Nevertheless, it should not be a prob-[
[
ctuators B 147 (2010) 392–399
lem for E-nose applications because this can be well controlled foreach E-nose system and any E-nose system must always be trainedunder a fixed condition.
4. Conclusions
We have reported the design, implementation and an exam-ple application of portable E-nose based on CNT–SnO2 gas sensorsincluding new feature extraction methods for improvement of dataclassification. The doping of CNTs could enhance the sensitivity ofSnO2 sensor while their concentration plays an important role inselectivity to volatile organic compounds such as EtOH and MeOH.The PCA results indicate that the newly proposed feature extractionincluding integral and primary derivative leads to higher classi-fication performance as compared to the standard features (�Rand �R/R0). The portable E-nose based on only two nanostruc-ture sensors combined with proposed feature extraction methodsshows clearly the classification of MeOH contamination mixed inthe whiskey at higher concentrations than 1% by volume. It is hopedthat such E-nose will be a useful tool for the whiskey industry andfor quick screening of village-made whiskeys that are usually foundof the MeOH contaminant.
Acknowledgements
C.W. acknowledges the Commission on Higher Education for aPh.D. scholarship under the program “Strategic Scholarships forFrontier Research Network”. T.K. expresses his great gratitude tothe Thailand Research Fund (BRG5180023) for a research careerdevelopment grant. Mahidol University and the National Scienceand Technology Agency are gratefully acknowledged for supports.
References
[1] M.P. Marti, R. Boque, O. Busto, J. Guasch, Electronic noses in the quality controlof alcoholic beverages, Trends Anal. Chem. 24 (2005) 57–66.
[2] H. Yu, J. Wang, Discrimination of Long Jing green-tea grade by electronic nose,Sens. Actuators B, Chem. 122 (2007) 134–140.
[3] J.S. Vestergaard, M. Martens, P. Turkki, Application of an electronic nose systemfor prediction of sensory quality changes of a meat product (pizza topping)during storage, LWT 40 (2007) 1095–1101.
[4] E. Scorsone, A.M. Pisanelli, K.C. Persaud, Development of an electronic nose forfire detection, Sens. Actuators B, Chem. 116 (2006) 55–61.
[5] R.M. Negri, S. Reich, Identification of pollutant gases and its concentrations witha multisensor array, Sens. Actuators B, Chem. 75 (2001) 172–178.
[6] A.C. Bastos, N. Magan, Soil volatile fingerprints: use for discrimination betweensoil types under different environmental conditions, Sens. Actuators B, Chem.125 (2007) 556–562.
[7] A.P.F. Turner, N. Magan, Electronic noses and disease diagnostics, Nat. Rev.Microbiol. 2 (2004) 161–166.
[8] M. Pardo, G. Sberveglieri, Comparing the performance of different features insensor arrays, Sens. Actuators B, Chem. 123 (2007) 437–443.
[9] B.Y. Wei, M.C. Hsu, P.G. Su, H.M. Lin, R.J. Wu, H.J. Lai, A novel SnO2 gas sensordoped with carbon nanotubes operating at room temperature, Sens. ActuatorsB, Chem. 101 (2004) 81–89.
10] E.H. Espinosa, R. Ionescu, B. Chambon, G. Bedis, E. Sotter, C. Bittencourt, A. Fel-ten, J.J. Pireaux, X. Correig, E. Llobet, Hybrid metal oxide and multiwall carbonnanotube films for low temperature gas sensing, Sens. Actuators B, Chem. 127(2007) 137–142.
11] N.V. Hieu, L.T.B. Thuya, N.D. Chien, Highly sensitive thin film NH3 gas sen-sor operating at room temperature based on SnO2/MWCNTs composite, Sens.Actuators B, Chem. 129 (2008) 888–895.
12] J. Gong, J. Sun, Q. Chen, Micromachined sol–gel carbon nanotube/SnO2
nanocomposite hydrogen sensor, Sens. Actuators B, Chem. 130 (2008) 829–835.13] J. Wang, L. Liu, S.Y. Cong, J.Q. Qi, B.K. Xu, An enrichment method to detect low
concentration formaldehyde, Sens. Actuators B, Chem. 134 (2008) 1010–1015.14] J. Liu, Z. Guo, F. Meng, Y. Jia, J. Liu, A novel antimony-carbon nanotube-tin oxide
thin film: carbon nanotubes as growth guider and energy buffer. Applicationfor indoor air pollutants gas sensor, J. Phys. Chem. C 112 (2008) 6119–6125.
15] A. Wisitsoraat, A. Tuantranont, C. Thanachayanont, V. Patthanasettakul, P. Sing-jai, Electron beam evaporated carbon nanotube dispersed SnO2 thin film gassensor, J. Electroceram. 17 (2006) 45–49.
16] A. Wisitsoraat, A. Tuantranont, V. Patthanasettakul, T. Lomas, P. Chindaudom,Ion-assisted e-beam evaporated gas sensor for environmental monitoring, Sci.Technol. Adv. Mater. 6 (2005) 261–265.
and A
[
[
[
[[
[
[
[
B
CS
Teerakiat Kerdcharoen received B.Sc. and M.Sc. in Chemistry from ChulalongkornUniversity in 1990 and 1992, respectively. As an Exchange Student, he received his
C. Wongchoosuk et al. / Sensors
17] H. Liu, G. Cheng, R. Zheng, Y. Zhao, C. Liang, Influence of synthesis process onpreparation and properties of Ni/CNT catalyst, Diamond Relat. Mater. 15 (2006)15–21.
18] T.C. Pearce, S.S. Schiffman, H.T. Nagle, J.W. Gardner, Handbook of MachineOlfaction; Electronic Nose Technology, Wiley-VCH, 2002.
19] C. Wongchoosuk, M. Lutz, T. Kerdcharoen, Correction of humidity effect fordetection of human body odor, in: Proceedings of the 5th ECTI-CON 2, 2008,pp. 845–848.
20] I.T. Jolliffe, Principal Component Analysis, Springer, 2002.21] S. Roussel, G. Forsberg, V. Steinmetz, P. Grenier, V. Bellon-Maurel, Optimisa-
tion of electronic nose measurement. Part I. Methodology of output featureselection, J. Food Eng. 37 (1998) 207–222.
22] S. Zhang, C. Xie, D. Zeng, Q. Zhang, H. Li, Z. Bi, A feature extraction method anda sampling system for fast recognition of flammable liquids with a portableE-nose, Sens. Actuators B, Chem. 124 (2007) 437–443.
23] S. Majumder, S. Hussain, S.N. Das, R.B. Bhar, A.K. Pal, Silicon doped SnO2 filmsfor liquid petroleum gas sensor, Vacuum 82 (2008) 760–770.
24] A.J. Paine, A.D. Dayan, Defining a tolerable concentration of methanol in alco-holic drinks, Hum. Exp. Toxicol. 20 (2001) 563–568.
iographies
hatchawal Wongchoosuk received his B.Sc. with first class honors from Prince ofongkla University in 2005 and M.Sc. from Mahidol University in 2007 on Physics. At
ctuators B 147 (2010) 392–399 399
present, he is a Ph.D. student at the Department of Physics, Mahidol University. Hiscurrent research interests involve electronic noses, hybrid gas sensors and molecularsimulation.
Anurat Wisitsoraat received his Ph.D., M.S. degrees from Vanderbilt University,TN, U.S.A., and B.Eng. degree in Electrical Engineering from Chulalongkorn Univer-sity, Bangkok, Thailand in 2002, 1997, and 1993, respectively. His research interestsinclude microelectronic fabrication, semiconductor devices, electronic and opticalthin film coating, gas sensors, and micro-electromechanical systems (MEMS).
Adisorn Tuantranont is currently Lab director of Nanoelectronics and MEMS Lab-oratory, National Electronics and Computer Technology Center (NECTEC), underNational Science and Technology Development Agency (NSTDA), Thailand. Hereceived the B.S. degree from King Mongkut’s Institute of Technology Ladkrabang(KMITL), Bangkok, Thailand in 1995, and the Ph.D. degree in 2001 from University ofColorado at Boulder, CO, USA, in Electrical Engineering. His current research interestsare optical MEMS, microfluidic lab-on-a-chip and optoelectronics packaging.
Ph.D. in Physical Chemistry from University of Innsbruck in 1995. Presently, he isa faculty member of Mahidol University. His research interests cover the topics oforganic electronics ranging from theoretical modeling of materials to fabrication ofdevices such as tactile and chemical sensors.