Embed Size (px)
Citation preview

Sensors 2015, 15, 14946-14959; doi:10.3390/s150714946
sensors ISSN 1424-8220
www.mdpi.com/journal/sensors
Article
Eco Assist Techniques through Real-time Monitoring of BEV Energy Usage Efficiency
Younsun Kim, Ingeol Lee and Sungho Kang *
Department of Electrical and Electronic Engineering, Yonsei University, Seoul 120-749, Korea;
E-Mails: [email protected] (Y.K.); [email protected] (I.L.)
* Author to whom correspondence should be addressed; E-Mail: [email protected];
Tel.: +82-2-2123-2775; Fax: +82-2-2123-7726.
Academic Editor: Vittorio M.N. Passaro
Received: 3 April 2015 / Accepted: 23 June 2015 / Published: 25 June 2015
Abstract: Energy efficiency enhancement has become an increasingly important issue for
battery electric vehicles. Even if it can be improved in many ways, the driver’s driving
pattern strongly influences the battery energy consumption of a vehicle. In this paper, eco
assist techniques to simply implement an energy-efficient driving assistant system are
introduced, including eco guide, eco control and eco monitoring methods. The eco guide is
provided to control the vehicle speed and accelerator pedal stroke, and eco control is
suggested to limit the output power of the battery. For eco monitoring, the eco indicator
and eco report are suggested to teach eco-friendly driving habits. The vehicle test, which is
done in four ways, consists of federal test procedure (FTP)-75, new european driving cycle
(NEDC), city and highway cycles, and visual feedback with audible warnings is provided
to attract the driver’s voluntary participation. The vehicle test result shows that the energy
usage efficiency can be increased up to 19.41%.
Keywords: fuel economy; eco driving; eco guide; energy usage efficiency
1. Introduction
As global emission levels and populations continue to rise, the demand for fuel-efficient vehicles
has increased greatly. Eco driving can be a good solution to enable energy conservation, reduce carbon
dioxide emissions, and contribute to the effort to reduce global warming. Because of the ever-increasing
OPEN ACCESS

Sensors 2015, 15 14947
awareness, eco driving techniques have slowly been making their way into the automotive industry for
many years and have recently picked up significant momentum as globalization has expanded industry
and public horizons [1–5]. Eco driving techniques help a driver or vehicle to operate in a more
efficient manner and to reduce fuel consumption; however, they ultimately rely on the driver to take
action to improve the energy efficiency [6–8].
Eco driving techniques designed to improve fuel economy vary from on-board trip computers to
powertrain control solutions, and utilize the sensory information from sensors embedded within
vehicle systems to monitor the in-vehicle or out-of-vehicle status [9,10]. These can be segmented into
active or passive methods according to the level of vehicle controllability. Active methods enable
autonomous control over vehicle systems, while passive methods provide information and guidance
based-on the analysis of sensory information obtained from the vehicle. Passive solutions interpret the
gathered data and provide some indication for the driver’s action based on their interpretation of
sensory data, and active solutions can quickly and efficiently optimize the vehicle system by limiting
or eliminating human input [11–13].
Eco driving techniques can be categorized into three groups: Eco monitoring, eco guide and eco
control. Eco monitoring is used to reflect the instant, historical, and time-elapsed fuel economy, and is
used in the auto industry through on-board trip computers [12,13]. The eco guide gives eco assist
information using the eco indicator or to provide the eco routing guide using navigation maps to
minimize traffic signals, hills and stops [7–9]. Eco control minimizes the human influence over the
power train while driving. One popular application today is the automatic start-stop system. It
deactivates the engine when the vehicle is stopped at a traffic signal and automatically restarts without
any driver input when the driver begins to accelerate [5,6].
Recently, the increasing emphasis on fuel economy and emissions has accelerated the need for more
sophisticated applications, increased the functionality of on-board trip computers, and required deeper
analysis [14,15]. Since fuel economy is maximized when acceleration and braking are minimized,
energy usage efficiency can be increased by simply applying eco driving techniques to anticipate what
is happening ahead, to drive in such a way so as to minimize acceleration and braking, to ensure
cruising at the optimal speed, and to maximize the coasting time at stops [5,6]. In fact, fuel economy
not only depends on various physical factors such as road-traffic vehicle conditions and, driving styles,
but also influences the vehicle emissions and energy consumption [7,8]. According to previous
research, the potential for improving the energy usage efficiency by monitoring the driver’s driving
style and analyzing the driver’s behavior and preferences is estimated to be in the range of 20% to
40% [16]. Moreover, fuel economy can be improved relatively easily and inexpensively by changing
the driving style [17–20].
This paper proposes a novel approach to analyze the in-vehicle sensory information from the battery
electric vehicle and explores eco assist techniques to enhance energy usage efficiency and to enlarge
the driving range. We have analyzed the correlation between the vehicle speed and battery power
consumption, investigated the fuel saving behavioral aspects of the accelerator pedal stroke (APS),
vehicle speed and battery power consumption, and proposed eco assist techniques to simply implement
an energy-efficient driving assistant system. Vehicle control conditions required for economic energy
consumption are analyzed, and an eco guide to attract the driver’s voluntary participation is provided
using visual feedback with audible warnings.

Sensors 2015, 15 14948
2. Eco Assist Techniques
2.1. Analysis of BEV’s Energy Usage Efficiency
For a gasoline vehicle, the fuel consumption is the amount of fuel used per unit distance, such as
liters per kilometer (L/km). The fuel economy or efficiency is the distance travelled per unit volume of
fuel used, and is measured in kilometers per liter (km/L) or miles per gallon (MPG). For an electric
vehicle, the energy consumption is the amount of battery energy used per unit distance (Wh/km), and
the energy efficiency is the distance travelled per unit volume of battery energy used (km/Wh).
Generally, energy efficiency is one of the vehicle’s unique characteristics, and it depends heavily on
the characteristic engine map [21]. In real-world driving situations, the energy consumption and
efficiency depend on various physical factors related to the road-traffic-vehicle conditions. In addition,
driving styles strongly influence energy consumption for the same physical driving conditions. In this
paper, energy efficiency is improved by changing the driver behavior, so in order to reflect the energy
efficiency enhancement according to driving pattern, the energy usage efficiency considers both
road-traffic-vehicle conditions and driving styles.
The energy efficiency of a battery electric vehicle (BEV) can be defined by analyzing the
correlation for some energy saving behavioral aspects: The acceleration, vehicle speed and battery
power consumption. For combustion engines, comparatively high acceleration even saves fuel, since
the engine operations are generally more efficient for higher power demands. Regarding electric
engines, the energy efficiency, which is the conversion factor from the chemical energy to the
delivered mechanical energy, depends on the engine speed and power demand, so pure physics rules:
Given a fixed maximum speed, the required mechanical energy to attain a certain speed is essentially
independent of the acceleration. The efficiency characteristic map of electrical motors is of the order of
90% in most operating conditions, and is essentially flat as shown in Figure 1 [22]. A small differential
due to wind drag can be neglected in city traffic.
Figure 1. An example of electric engine characteristic map.
For an eco assist technique to be of use on the road, real-time monitoring considering various
physical factors is very important, so the sensory information of an electric vehicle is collected and the
energy efficiency is investigated by profiling an electric motor’s characteristics in real-time. According
to our research, the vehicle speed has a large impact on the energy usage efficiency and the

Sensors 2015, 15 14949
acceleration acts as a relevant exogeneous variable as shown in Figure 2. There exists a specific period
of vehicle speed, that has high-energy usage efficiency and shows different characteristics under
battery energy usage conditions. We conclude that 20 km/h–60 km/h is the most economic speed range
when the air-conditioner is off and the heater is on, as shown in Figure 3. On the other hand, the energy
usage efficiency tends to increase with the amount of brake pedal strokes, since the state of charge
(SOC) of the battery increases because of regenerative braking properties. Therefore, there is no
benefit to providing eco guide information for the braking behavior of a battery electric vehicle,
whereas there is a benefit for a gasoline-powered vehicle.
Figure 2. Energy efficiency according to vehicle speed and acceleration.
Figure 3. Energy consumption according to vehicle speed.
2.2. Eco Guide
In this paper, the eco guide, including the eco start, eco acceleration and eco speed, is proposed as an
eco assist technique for the driver to be able to control the vehicle speed and accelerator pedal stroke. To

Sensors 2015, 15 14950
provide an efficient eco driving guide to the driver, it is necessary to establish distinct criteria based on
vehicle-specific and situation-specific data obtained from a large number of sensors, such as the
accelerator pedal sensor, vehicle speed sensor and throttle sensor. This sensory information should be
monitored and analyzed in real-time, and advice should be generated through the decision making, to let
the driver know if the current driving pattern is suitable for energy efficient driving. All eco guides are
given when a driver breaks an eco guide rule for more than 3 s, and are monitored to make sure the
driver keeps the eco guide rule for over 5 s. Most of all, all eco guides should be provided using visual
feedback with audible warnings, and should be personalized to attract the driver’s voluntary participation.
Moreover, the visual interface should be intuitive so that all of the eco guides are easily understood, and
eco feedback should be instantly given to the driver through a real-time embedded system.
According to our research, the energy efficiency according to the accelerator pedal stroke and
vehicle speed period, as shown in Table 1, is valuable information for defining the criteria for the eco
start and eco acceleration guide. We have classified the energy efficiency into six levels, and have
created eco guides to get a higher energy efficiency level for each speed period. In the case of an eco start
guide, it is crucial for the level of the accelerator pedal stroke to stay under 30% when the vehicle
speed reaches up to 10 km/h. For an eco acceleration guide, it is recommended that the vehicle
acceleration rate should be maintained below 5 m/s2 as shown in Table 2. On a road with up-down
slopes, it is necessary to anticipate the future states of the vehicle and the information regarding the
road gradient in advance, and a study to determine the optimal energy efficiency is under investigation.
For the eco speed guide, the energy consumption according to the vehicle speed, as shown in Figure 3,
helps to establish the criteria. It is essential to specify the maximum and minimum speed limits
according to each driving mode (city or highway) for an eco speed guide. We have defined the most
economic speed range for each battery energy condition, and have made eco guides for the driver to
follow given the energy saving rules.
Table 1. Energy efficiency according to vehicle speed and accelerator pedal stroke (APS).
Energy Efficiency (km/kWh)
Speed (km/h) APS 10% APS 15% APS 20% APS 25% APS 30% APS 35% APS 40% APS 45%
0~10 15.91696 6.557377 1.804124 1.804124 1.511335 0.819672 0.570342 0.46225
10~20 13.69863 4.847397 1.621622 1.621622 1.079137 0.846561 0.614125 0.55814
20~30 6.021898 3.474903 1.486014 1.486014 1.152263 0.91135 0.784314 0.613497
30~40 5.480924 3.150599 1.474359 1.474359 1.173564 0.889152 0.776119 0.651466
40~50 5.158307 3.230148 1.589528 1.587302 1.19225 0.949668 0.777832 0.675676
50~60 4.871673 3.031324 1.553398 1.539085 1.20075 0.988924 0.838095 0.680787
60~70 4.891942 3.081828 1.530612 1.542734 1.212938 0.967742 0.818063 0.721311
70~80 4.850118 3.144394 1.605442 1.605442 1.294149 1.019541 0.844457 0.712401
80~90 5.283276 3.514281 1.845419 1.854749 1.387256 1.158491 0.987269 0.782677
90~100 - 4.344299 2.257298 2.234637 1.679861 1.306512 1.217565 0.949768
100~110 - - 2.938327 2.936795 2.186712 1.669097 1.621356 1.196215
110~120 - - - - 2.929261 2.241953 2.069199 1.623244
120~130 - - - - - 2.904916 2.668639 2.028933
130~140 - - - - - - - 2.489998

Sensors 2015, 15 14951
Table 2. Acceleration according to vehicle speed and APS.
Acceleration (m/s2)
Speed(km/h) APS 10% APS 15% APS 20% APS 25% APS 30% APS 35% APS 40% APS 45%
0~10 0.375115 0.926312 1.304114 1.833473 2.149234 2.791978 3.555366 3.362509
10~20 0.652061 1.439458 2.275701 3.232971 4.077705 4.97008 6.128653 6.749961
20~30 1.042836 1.974302 3.02712 4.179851 5.257845 6.403935 7.510778 8.612078
30~40 0.955976 1.902826 2.946984 4.077489 5.230235 6.362902 7.511737 8.6123
40~50 0.861198 1.790279 2.814111 3.917636 5.020055 6.243756 7.345757 8.394896
50~60 0.747745 1.676193 2.707254 3.812676 4.897136 6.054442 7.239085 8.325008
60~70 0.622423 1.541573 2.554983 3.646215 4.757102 5.911388 6.985972 8.185651
70~80 0.480282 1.383696 2.389777 3.480537 4.624256 5.774506 6.91343 8.124335
80~90 0.236782 1.013174 1.89213 2.887203 3.980511 5.201993 5.893655 7.291819
90~100 - 0.451013 1.165681 1.982255 2.964412 4.09487 4.440004 5.946576
100~110 - - 0.399277 1.075342 1.863763 2.838071 2.973226 4.306076
110~120 - - - - 0.85751 1.603415 1.734356 2.759626
120~130 - - - - - 0.636716 0.773218 1.539295
130~140 - - - - - - - 0.714077
2.3. Eco Control
In this paper, eco control is used to limit the output power of the battery as an eco assist technique.
The output power of the battery is limited to 12 kW in hard mode and 18 kW in soft mode. In soft
mode, the power limitation is dynamically allocated according to the vehicle speed. It is permitted up
to 12 kW at low speed and 18 kW at high speed. This is provided by modifying the electronic control
unit (ECU) of the vehicle control module (VCM). A study of enriched map data, such as the
manipulation of the throttle when traveling up or downhill, or facilitating or preventing a gear change
when entering a particularly curvy area of the road, is under investigation.
2.4. Eco Monitoring
As eco monitoring methods, the eco indicator and eco report are proposed as eco assist techniques.
A short-term indicator is created to change the color (red, yellow and green) according to the level of
energy usage efficiency. It gives the driver the current status information when excessive acceleration
is detected or the vehicle speed exceeds the limit of a specific speed range in terms of the electric
motor’s energy efficiency. A long-term indicator is provided by displaying a tree’s growth process to
help drivers acquire intuitive eco-friendly driving habits. An energy usage efficiency indicator is used
to provide the history of the driver’s energy usage patterns with the driver’s speed or acceleration
pattern indicator as shown in Figure 4.
In this paper, the eco guide is suggested when the driver’s acceleration pattern or speed pattern is
critical for energy usage efficiency. The frequency of the eco guide is controlled according to the
driver’s preferences. In the case of the eco guide, it is significant to understand the driver’s tendencies,
and therefore the number of eco guides is increased or decreased according to the propensity for eco
driving. An eco mission report, which shows how much the driver follows the provided eco guides
while driving, is provided in order for the driver to be able to do self-checking while driving or

Sensors 2015, 15 14952
after driving. The energy usage report is offered at the end of driving with the eco mission report.
It allows the driver to learn self-driving habits and to improve the energy usage efficiency through
personalized advice.
(a)
(b)
Figure 4. (a) Eco indicator; (b) Eco report.
3. Experimental Results
3.1. Real-Time Embedded System
A real-time embedded system is developed using the Freescale i.MX6 ARD reference board as
shown in Figure 5a. Ubuntu-based Linux is used as the operating system, and the GUI implementation
is done with the Qt programming tool. All of the algorithms, which are comprised of driving pattern
analysis, energy efficiency analysis and eco coaching, are implemented using the C and C++
programming languages. Since this sensory information is limitedly obtained from an on-board
diagnostics port such as OBDII, almost all sensory information is acquired from the VCM. The CAN
Bus channel is used to get information for the vehicle dynamics state, and it is not only capable of
reading the various vehicular parameters, but also of detecting variables from the vehicle environment
by using several vehicle sensors in real-time. The monitored features cover the battery current, battery

Sensors 2015, 15 14953
voltage, vehicle speed, accelerator pedal stroke, brake pedal stroke and other vehicle dynamics
information as shown in Figure 5b.
(a)
(b)
Figure 5. (a) Real-time embedded system; (b) Block diagram for algorithms.
3.2. Test Method
The energy usage efficiency enhancement according to the proposed eco assist techniques is
evaluated through real vehicle testing using the Vista 1.0 electric vehicle model as shown in Figure 6.
The vehicle test is done in four different ways: Using the FTP-75 and NEDC driving cycles at the
Dynamo Lab, and during a city driving cycle and a highway driving cycle on real roads. We have
made our own profiles for the city driving cycle on a virtually real road, and for the highway driving
cycle on a real road, but they were not sufficient. In a real-world experiment, there is always the
danger of an accident during the test, and therefore it is impossible to control these factors for our
convenience while driving. The driving time is too short in the city driving cycle, and it is not easy to
emulate speed, acceleration, and deceleration patterns under the same driving conditions in the
highway driving cycle. To establish our own driving cycles, we used the NEDC and FTP-75 driving
cycles, which are officially used for emission certification and fuel economy testing of light-duty
vehicles in the USA and Europe. These regulatory driving cycle tests are conducted using a
dynamometer, which simulates “typical” trips in the city or on the highway.
Sensors 2015, 15 14954
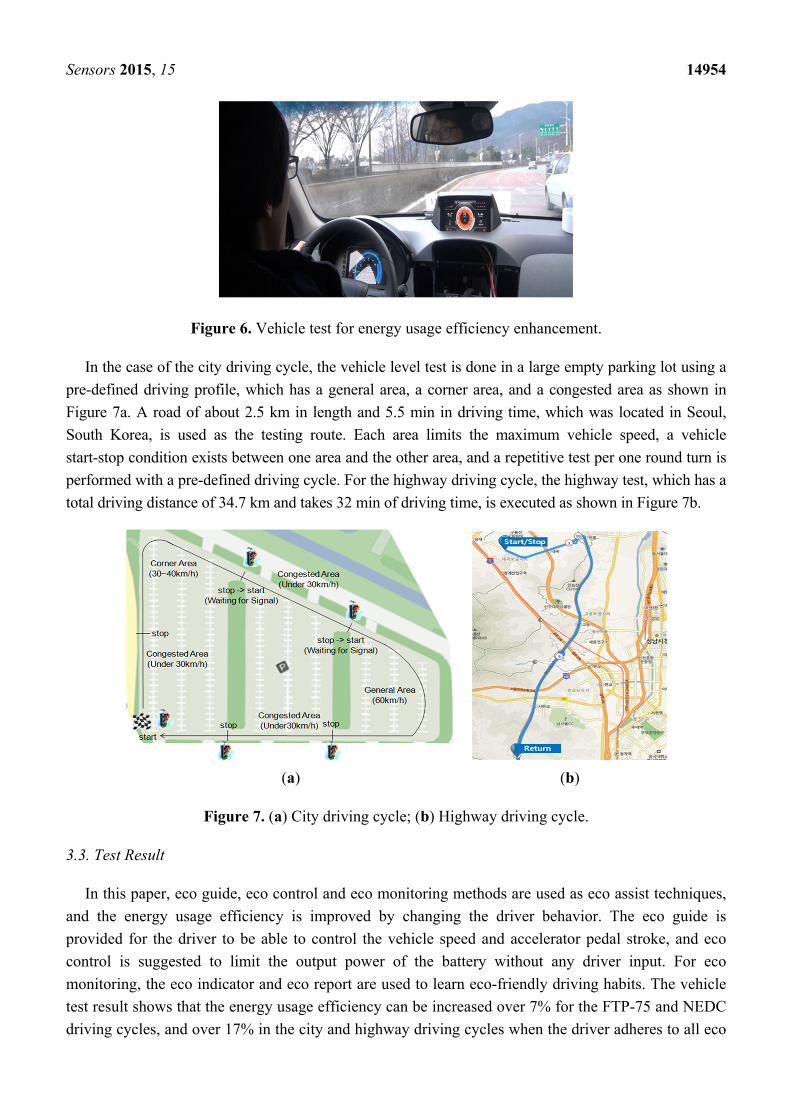
Figure 6. Vehicle test for energy usage efficiency enhancement.
In the case of the city driving cycle, the vehicle level test is done in a large empty parking lot using a
pre-defined driving profile, which has a general area, a corner area, and a congested area as shown in
Figure 7a. A road of about 2.5 km in length and 5.5 min in driving time, which was located in Seoul,
South Korea, is used as the testing route. Each area limits the maximum vehicle speed, a vehicle
start-stop condition exists between one area and the other area, and a repetitive test per one round turn is
performed with a pre-defined driving cycle. For the highway driving cycle, the highway test, which has a
total driving distance of 34.7 km and takes 32 min of driving time, is executed as shown in Figure 7b.
(a) (b)
Figure 7. (a) City driving cycle; (b) Highway driving cycle.
3.3. Test Result
In this paper, eco guide, eco control and eco monitoring methods are used as eco assist techniques,
and the energy usage efficiency is improved by changing the driver behavior. The eco guide is
provided for the driver to be able to control the vehicle speed and accelerator pedal stroke, and eco
control is suggested to limit the output power of the battery without any driver input. For eco
monitoring, the eco indicator and eco report are used to learn eco-friendly driving habits. The vehicle
test result shows that the energy usage efficiency can be increased over 7% for the FTP-75 and NEDC
driving cycles, and over 17% in the city and highway driving cycles when the driver adheres to all eco

Sensors 2015, 15 14955
guides as shown in Figure 8 and Table 3. With respect to the regulatory driving cycles, they are
standardized and prescribe certain speed and acceleration profiles, so we could not fulfill the
specifications regarding maximum speed, average speed and trip distance.
(a)
(b)
(c)
Figure 8. Cont.

Sensors 2015, 15 14956
(d)
Figure 8. Test result (a) FTP-75 mode; (b) NEDC mode; (c) City mode; (d) Highway mode.
Table 3. Test result of energy usage efficiency enhancement.
Eco Assist Techniques
Trip
Distance
(m)
Average
Speed
(km/h)
Used
Energy
(W)
Regen.
Energy
(W)
Average Energy
Efficiency
(km/kWh)
Energy Usage
Efficiency
Increase (%)
FTP-75
FTP-75 Normal 18347 35.24 11782 1612 5.61 100.00
Eco Control Hard Mode(12 kW) 18100 34.77 9817 1198 6.63 118.41
Soft Mode(18 kW) 19023 36.54 10576 1361 6.37 113.67
Eco Guide All Guide 17259 33.15 10336 1552 6.00 107.14
NEDC
NEDC Normal 11309 44.93 7153 598 5.69 100.00
Eco Control Hard Mode(12 kW) 10689 42.15 5839 579 6.53 114.85
Soft Mode(18 kW) 10985 43.33 6396 611 6.18 108.61
Eco Guide All Guide 10936 42.16 6303 531 6.24 109.74
City
City Normal 2432 29.75 2377 257 3.68 100.00
Eco Control Hard Mode(12 kW) 2441 27.79 2081 176 4.22 114.67
Soft Mode(18 kW) 2440 28.92 2202 222 3.98 108.15
Eco Guide All Guide 2419 26.01 2020 206 4.31 117.12
Highway Highway Normal 34737 83.79 30223 1600 4.13 100.00
Eco Guide All Guide 34718 71.21 25296 1422 4.94 119.41
It is found that when the test is done in highway mode, for a trip distance of about 34.73 km, 30.22 kW
of battery energy is consumed, which yields an average energy usage efficiency of 4.13 km/kWh.
When all eco guides are applied, only 25.29 kW of battery energy is consumed for a trip distance of
34.71 km, which yields an average energy usage efficiency of 4.94 km/kWh. A 19.41% improvement
in the average energy usage efficiency is achieved. In this case, even if the comparison test is done
with the same trip distance, there are differences in the maximum speeds (119 km/h for normal,
98 km/h for eco driving) and the total trip times (25.7 min for normal, 30.4 min for eco driving). In the
case of an all-electric vehicle, energy recuperation occurs during deceleration, and the kinetic energy
of the vehicle will continue to turn the electric engine, so what matters is the maximum speed, which is

Sensors 2015, 15 14957
probably also responsible for the observed increase in the energy usage efficiency. This is mainly due
to round-turn losses during the recuperation phase. When it comes to applying eco control, the energy
usage efficiency improvement depends on the output power limitation, and therefore the hard mode
shows better enhancement than the soft mode by an average of 5.83%. The output power of the battery
is restricted by force, so the eco control test cannot be performed for the highway driving cycle.
4. Conclusions
In this paper, eco assist techniques for an energy-efficient driving assistant system are provided by
looking into the fuel saving behavioral aspects of the acceleration, vehicle speed and battery power
consumption. A real-time embedded system is developed to obtain information regarding the vehicle
dynamics state, to analyze the energy usage efficiency enhancement, and to provide eco assist
techniques. The understanding of the eco guide based on the driver’s characteristics is considered to
create positive user experiences, and an eco mission with visual feedback and audible warnings is
designed to adapt to the driver’s eco driving styles. An energy usage efficiency enhancement test is
done using a Vista 1.0 electric vehicle model in four different ways: An FTP-75 cycle, NEDC cycle,
city cycle, and highway cycle. The test results show that the energy usage efficiency can be increased
up to 19.41% by using the proposed eco assist techniques. Specifically, the energy usage efficiency
can be increased over 7% in the FTP75 and NEDC driving cycles, and over 17% in city and highway
driving cycles when the driver adheres to all eco guides.
Acknowledgments
This work was supported through the use of a Vista 1.0 electric vehicle and VCM to limit the output
of the battery power, which was developed by the VC Company of LG Electronics.
Author Contributions
Younsun Kim has implemented the system and authored of the article. Ingeol Lee has undertaken
the laboratory tests. Sungho Kang has supervised this research. All authors read and approved the
final manuscript.
Conflicts of Interest
The authors declare no conflict of interest.
References
1. Calderaro, V.; Galdi, V.; Graber, G.; Piccolo, A.; Cogliano, D. An algorithm to optimize speed
profiles of the metro vehicles for minimizing energy consumption. In Proceedings of the 2014
International Symposium on Power Electronics, Electrical Drives, Automation and Motion
(SPEEDAM), Ischia, Italy, 18–20 June 2014; Volume 6, pp. 813–819.

Sensors 2015, 15 14958
2. Grabocka, J.; Dalkalitsis, A.; Lois, A.; Katsaros, E.; Schmidt-Thieme, L. Realistic optimal
policies for energy-efficient train driving. In Proceedings of the 2014 IEEE 17th International
Conference on Intelligent Transportation Systems (ITSC), Qingdao, China, 8–11 October 2014;
Volume 10, pp. 8–11.
3. Larue, G.S.; Malik, H.; Rakotonirainy, A.; Demmel, S. Fuel consumption and gas emissions of an
automatic transmission vehicle following simple eco-driving instructions on urban roads.
IET Intell. Transp. Syst. 2014, 8, 590–597.
4. Kato, H.; Ando, R.; Kondo, Y.; Suzuki, T.; Matsuhashi, K.; Kobayashi, S. Comparative
measurements of the eco-driving effect between electric and internal combustion engine vehicles.
In Proceedings of the 2013 World Electric Vehicle Symposium and Exhibition (EVS27),
17–20 November 2013; Volume 11, pp. 1–5.
5. Pennycott, A.; de Novellis, L.; Gruber, P.; Sorniotti, A.; Goggia, T. Enhancing the Energy
Efficiency of Fully Electric Vehicles via the Minimization of Motor Power Losses. In Proceedings
of the 2013 IEEE International Conference on Systems, Man, and Cybernetics (SMC),
Manchester, UK, 13–16 October 2013; Volume 10, pp. 4167–4172.
6. Mahler, G.; Vahidi, A. An Optimal Velocity-Planning Scheme for Vehicle Energy Efficiency
through Probabilistic Prediction of Traffic-Signal Timing. IEEE Trans. Intell. Transp. Syst. 2014,
15, 2516–2523.
7. Kundu, S.; Wagh, A.; Qiao, C.; Li, X.; Kundu, S.; Sadek, A.; Hulme, K.; Wu, C. Vehicle speed
control algorithms for eco-driving. In Proceedings of the 2013 International Conference on
Connected Vehicles and Expo (ICCVE), Las Vegas, NV, USA, 2–6 December 2013; Volume 12,
pp. 931–932.
8. Wijayasekara, D.; Manic, M.; Gertman, D. Driving behavior prompting framework for improving
fuel efficiency. In Proceedings of the 2014 7th International Conference on Human System
Interactions (HSI), Costa da Caparica, Portugal, 16–18 June 2014; Volume 6, pp. 55–60.
9. Schiessl, C.; Fricke, N.; Staubach, M. Identification and analysis of motives for eco-friendly
driving within the eco-move project. IET Intell. Transp. Syst. 2013, 7, 46–54.
10. Tulusan, J.; Staake, T.; Fleisch, E. Direct or indirect sensor enabled eco-driving feedback: Which
preference do corporate car drivers have? In Proceedings of the 2012 3rd International Conference
on the Internet of Things (IOT), Wuxi, China, 24–26 October 2012; Volume 10, pp. 39–46.
11. Daun, T.J.; Braun, D.G.; Frank, C.; Haug, S.; Lienkamp, M. Evaluation of driving behavior and
the efficacy of a predictive eco-driving assistance system for heavy commercial vehicles in a
driving simulator experiment. In Proceedings of the 2013 16th International IEEE Conference on
Intelligent Transportation Systems (ITSC), The Hague, The Netherlands, 6–9 October 2013;
Volume 10, pp. 2379–2386.
12. Cheng, Q.; Nouveliere, L.; Orfila, O. A new eco-driving assistance system for a light vehicle:
Energy management and speed optimization. In Proceedings of the 2013 IEEE Intelligent Vehicles
Symposium (IV), Gold Coast, QLD, Australia, 23–26 June 2013; Volume 6, pp. 1434–1439.
13. Matsumoto, S.; Kawashima, H. Fundamental study on effect of preceding vehicle information on
fuel consumption reduction of a vehicle group. J. Commun. Netw. 2013, 15, 173–178.
14. Masikos, M.; Demestichas, K.; Adamopoulou, E.; Theologou, M. Machine-learning methodology
for energy efficient routing. IET Intell. Transp. Syst. 2014, 8, 255–265.

Sensors 2015, 15 14959
15. Frank, R.; Castignani, G.; Schmitz, R.; Engel, T. A novel eco-driving application to reduce energy
consumption of electric vehicles. In Proceedings of the 2013 International Conference on
Connected Vehicles and Expo (ICCVE), Las Vegas, NV, USA, 2–6 December 2013; Volume 12,
pp. 283–288.
16. Howlader, A.H.; Chowdhury, N.A.; Faiter, M.M.K.; Touati, F.; Benammar, M.A. Development of
energy efficient battery electric car for Shell Eco-Marathon competition—Qatar University
experience. In Proceedings of the 2014 Ninth International Conference on Ecological Vehicles
and Renewable Energies (EVER), Monte-Carlo, Monaco, 25–27 March 2014; Volume 3,
pp. 25–27.
17. De Nunzio, G.; de Wit, C.C.; Moulin, P. Urban traffic Eco-Driving: A macroscopic steady-state
analysis. In Proceedings of the 2014 European Control Conference (ECC), Strasbourg, France,
24–27 June 2014; Volume 6, pp. 2581–2587.
18. Vagg, C.; Brace, C.J.; Hari, D.; Akehurst, S.; Poxon, J.; Ash, L. Development and Field Trial of a
Driver Assistance System to Encourage Eco-Driving in Light Commercial Vehicle Fleets.
IEEE Trans. Intell. Transp. Syst. 2013, 14, 796–805.
19. Guan, T.; Frey, C.W. Fuel efficiency driver assistance system for manufacturer independent
solutions. In Proceedings of the 2012 15th International IEEE Conference on Intelligent
Transportation Systems (ITSC), Anchorage, AK, USA, 16–19 September 2012; Volume 9,
pp. 212–217.
20. Vreeswijk, J.D.; Mahmod, M.K.M.; van Arem, B. Energy efficient traffic management and
control—The eCoMove approach and expected benefits. In Proceedings of the 2010 13th
International IEEE Conference on Intelligent Transportation Systems (ITSC), Funchal, Portugal,
19–22 September 2010; Volume 9, pp. 955–961.
21. Treiber, M.; Kesting, A. Fuel Consumption and Emissions. In Traffic Flow Dynamics, 2nd ed.;
Springer: Heidelberg, Germany, 2013; pp. 379–401.
22. Emad, D. ANSYS Advanced Design of Electric Motors. Available online: http://www.ansys-
blog.com/advanced-design-electric-motors (accessed on 14 June 2015).
© 2015 by the authors; licensee MDPI, Basel, Switzerland. This article is an open access article
distributed under the terms and conditions of the Creative Commons Attribution license
(http://creativecommons.org/licenses/by/4.0/).


![Sensors OPEN ACCESS sensors - unipi.it...Sensors 2013 ,13 12220 idealized description that is dependent on the cognitive requirements of the designer [16]. Typically, this approach](https://img.dokumen.tips/doc/110x75/60841fef82af7a7ca84bc126/sensors-open-access-sensors-unipiit-sensors-2013-13-12220-idealized-description.jpg)