Embed Size (px)
Citation preview

Sensors 2015, 15, 23402-23417; doi:10.3390/s150923402
sensors ISSN 1424-8220
www.mdpi.com/journal/sensors
Article
Wearable Sensing of In-Ear Pressure for Heart Rate Monitoring
with a Piezoelectric Sensor
Jang-Ho Park 1, Dae-Geun Jang 2,*, Jung Wook Park 3 and Se-Kyoung Youm 4
1 Medical IT Convergence Research Center, Korea Electronics Technology Institute, Seongnam 463-816,
Korea; E-Mail: [email protected] 2 Samsung Advanced Institute of Technology, Samsung Electronics Co. Ltd., Suwon 443-803, Korea 3 Creative Innovation Center, LG Electronics Co. Ltd., Seoul 137-893, Korea;
E-Mail: [email protected] 4 Industry-Academic Cooperation Foundation, Dongguk University, Seoul 100-715, Korea;
E-Mail: [email protected]
* Author to whom correspondence should be addressed; E-Mail: [email protected];
Tel.: +82-31-8061-4217; Fax: +82-31-8061-4664.
Academic Editor: Steffen Leonhardt
Received: 3 August 2015 / Accepted: 10 September 2015 / Published: 16 September 2015
Abstract: In this study, we developed a novel heart rate (HR) monitoring approach in which
we measure the pressure variance of the surface of the ear canal. A scissor-shaped apparatus
equipped with a piezoelectric film sensor and a hardware circuit module was designed for
high wearability and to obtain stable measurement. In the proposed device, the film sensor
converts in-ear pulse waves (EPW) into electrical current, and the circuit module enhances
the EPW and suppresses noise. A real-time algorithm embedded in the circuit module
performs morphological conversions to make the EPW more distinct and knowledge-based
rules are used to detect EPW peaks. In a clinical experiment conducted using a reference
electrocardiogram (ECG) device, EPW and ECG were concurrently recorded from
58 healthy subjects. The EPW intervals between successive peaks and their corresponding
ECG intervals were then compared to each other. Promising results were obtained from the
samples, specifically, a sensitivity of 97.25%, positive predictive value of 97.17%, and mean
absolute difference of 0.62. Thus, highly accurate HR was obtained from in-ear pressure
variance. Consequently, we believe that our proposed approach could be used to monitor
vital signs and also utilized in diverse applications in the near future.
OPEN ACCESS

Sensors 2015, 15 23403
Keywords: wearable heart rate monitoring; in-ear pressure variance; piezoelectric sensor
1. Introduction
Cardiovascular disease (CVD), which includes hypertension, myocardial infarction, coronary artery
diseases, and stroke, has become a serious problem and is currently one of the major causes of disability
and death globally. In fact, more than 17 million people worldwide die each year because of CVD, and
it accounts for about 30% of all deaths per year [1]. While many of the risk factors for CVD are known,
such as tobacco use, physical inactivity, obesity, and diabetes, resting heart rate (HR) is one of the
simplest cardiovascular parameters and an independent risk factor [2]. Resting HR has prognostic
importance in that an elevated resting HR is strongly related with mortality in the general population,
the elderly, and patients with myocardial infarction, congestive heart failure, diabetes, or hypertension [2].
Thus, frequent HR monitoring in everyday life is necessary to assess and prevent cardiovascular
problems in advance.
Vital signs such as HR, respiration, and blood pressure were in the past possible to measure by
medical systems in hospitals. However, recent technological advances in physiological sensors,
processing capabilities, and wireless communications have enabled individuals to monitor their health
status outside of hospitals via wearable biosensor systems [3]. Compared with previous medical devices,
wearable sensor systems provide nonintrusive solutions for long-term monitoring without constraints on
time and place. A further advantage is that such systems can offer real-time feedback about their health
status to the patients themselves or even a professional physician at a hospital [4]. Therefore, wearable HR
monitoring systems play an important role in the monitoring of cardiovascular exacerbations in the early
stage, during catastrophes that may occur with high risk individuals, or during emergency situations [5].
Many technologies and methodologies have been introduced for wearable HR monitoring. Among
these technologies, those that monitor photoplethysmogram (PPG), which is obtained by optical
detection of blood volume changes in the microvascular bed of the tissue using light-emitting diodes and
photodetectors, are the most widely utilized. PPG sensors have mainly been applied to fingers, earlobes,
or wrists in the form of tweezers- or watch-shaped apparatuses [6]. Also, a customized ear mold equipped
with a reflective PPG sensor has been applied to the ear channel [7]. Conventional measurement of
electrocardiogram (ECG), which is the gold-standard method for HR monitoring, is not appropriate for
wearable sensing because of the adhesive electrodes and wires utilized. However, recent studies have
proposed and investigated T-shirts and band type wearable ECG systems that use conductive fabric,
flexible printed circuit boards, or textile circuits [8]. In addition, stethoscopes that use a microphone to
measure phonocardiography have also been proposed as wearable and portable devices [9].
However, despite significant progress in wearable systems, various issues that impede extensive
application have been reported. These issues include bulky sensors, connections to additional hardware
modules, skin irritation, and laundry [9]. In order to solve these problems, Teichmann et al. recently
presented a bendable and flexible device that can be placed in a shirt pocket using noncontact sensor
principles [10]. However, very few studies have presented a high acceptance rate by users, and there are
still many challenges that have to be resolved in order for wearable systems to become accepted by

Sensors 2015, 15 23404
normal people and patients [3,8]. For examples, existing methods have limitations to utilization in
particular situations when the user is running or swimming in which hands and feet are excessively
moving. The human head is rather the least moving and least affected part by strenuous exercise or
movement according to circumstances. Thus, new methods or alternatives are required for vigorous
follow-up studies and applications.
In this paper, we present our proposed wearable HR monitoring sensor device developed based on
pressure variance in the ear canal surface. The ear is an excellent site for users to accept a wearable
device. In addition, the ear canal is partially composed of cartilage and bone and located in the temporal
bone, thus providing the proper conditions for anchoring the sensor apparatus [11]. The ensuing sections
present the physiological principle that enables HR monitoring from the ear canal surface, the material
comprising the sensor, design and implementation of the wearable sensor device, the verification process
and the results obtained, and our conclusions.
2. Physiological Background and Piezoelectric Sensor
When the left ventricle of the heart rhythmically contracts, blood is ejected into the arterial system,
and the elasticity of the arteries enable a pulse wave to be generated and propagated. The pulse wave
observed in the arterial system is the summation of a forward (incident) wave and a backward wave [12].
The forward wave travels from the heart toward the periphery, whereas the backward wave is caused by
the forward wave’s reflection within the peripheral arterial system [12]. The characteristics of the arterial
pulse wave differ slightly according to the sites at which the measurements are taken because of the
complicated topology of the arteries. However, in general, all arterial pulse waves present the general
function of the cardiovascular system: the systolic function of the left ventricle [13].
The carotid artery, which has diameter in the range 6.1 to 6.5 mm, originates along the aortic arch
and travels upward to supply oxygenated blood to the brain. The carotid arterial pressure and diameter
change linearly as blood flows, and the hemodynamic change generates the ascending aortic pressure
waveform around the artery [14,15]. Ultrasound with the Doppler technique is the gold-standard method
for observing volume changes in the carotid artery, whereas a tonometry attached to the subject’s neck
is also typically utilized to measure the pressure wave propagated to the skin surface [16].
As illustrated in the anatomical view depicted in Figure 1, the internal carotid artery, which arises
from the carotid artery, is located near the ear. The internal carotid artery also has a similar characteristic;
that is, it expands and propagates a pressure wave to the ear canal surface during the inrush of blood.
Consequently, it has been hypothesized that pressure variance measured from the ear canal surface has
a consistent pulse waveform, and the in-ear pulse wave (EPW) presents sharp upstrokes reflective
of heartbeats.
The ear canal is approximately 2.5 cm long and has a diameter of about 0.7 cm. The surface of the
skin in the ear canal is one of the most sensitive parts of the human body. Any sensor material that is
intended to be utilized there therefore has to be small and soft, which are properties possessed by the
piezoelectric sensor used in this application. The sensor used is flexible, lightweight, and is composed
of mechanically durable plastic film with the unique ability of being configurable into various shapes and
sizes. Piezoelectric materials convert strain or stress into electrical energy when they are mechanically
deformed [17]. They operate over a wide temperature range and have a high frequency response.

Sensors 2015, 15 23405
Figure 1. Anatomical view of the vessels around the ear.
Piezoelectric sensors are widely used in medical applications such as patient monitoring and human
motion analysis. In particular, a piezoelectric sensor can be ideally utilized in harsh environments and is
suitable for measuring tiny pressure variances under high static pressure [18]. This property raises the
possibility of successful monitoring in our application, because the pressure for anchoring the film sensor
to the ear canal surface is high and static, and the pressure variance from a heartbeat is relatively low. In
this study, we utilized a customizable piezoelectric film sensor sheet manufactured by Measurement
Specialties [19]. The film sensor sheet is metallized with silver ink which enables optimized applications
where mechanical stress is being applied.
3. In-Ear Pressure Sensing Device
3.1. Apparatus Design Concepts
A specialized design is required for any apparatus specified to measure pressure variance from the
ear canal surface accurately. High wearability should also be guaranteed to facilitate long-term use in
everyday life. Further, to enable accurate measurement, the piezoelectric film sensor needs to be
sufficiently adhered to the skin surface of the external ear canal. When these conditions are satisfied
EPW can be consistently converted to electrical current and various noises, caused by the user’s
movements and activities, can be minimized. For a comfortable fit, the apparatus should also not cause
the user any pain, and should be lightweight in order for the user to wear it for hours. Furthermore, it
should not interfere with the user’s hearing as an insert-type device in the ear. To meet these requirements
and considerations, we designed a scissor-shaped apparatus with the structure illustrated in Figure 2.
We cut the piezoelectric film sheet into a 3.5 mm × 3.5 mm sized piece that can covers the head part
of a longer stick. The outside surface (signal) and the inside surface (ground) of a piezoelectric sensor
were wired with shielded cable respectively to protect EPW signal and minimize the noise. When the
user wears the apparatus, the two sticks are inserted into the ear canal, and a spring enables proper
extension between the sticks. Thus, the head parts of both sticks are able to remain adhered to opposite
sides of the ear canal surface. The head positions that make contact with the ear canal surface can be
changed by pushing and rotating buttons. Because the optimal point on the ear canal surface for EPW
sensing varies slightly from individual to individual, the best point for a particular individual can be

Sensors 2015, 15 23406
found by varying the stick positions. The hardware circuit module and coin-cell battery are located in
the body of the apparatus. Figure 3 shows the appearance of a prototype manufactured according to the
proposed design along with examples of it being worn.
Figure 2. Structure of the in-ear pressure sensing device: (a) stick covered with piezoelectric
film sensor; (b) spring to push both sticks in different directions; (c) button to control the
position of both sticks; (d) hardware circuit module; (e) coin-cell battery.
Figure 3. (a) In-ear pressure sensing device prototype; (b) wearing example (lateral view);
(c) wearing example (frontal view).
3.2. Hardware Circuit Module
Electrical current, generated from the piezoelectric sensor, is converted to voltage. Then, it is 3 dB
pre-amplified and passed to a buffer to prevent loading effect. A second-order low-pass filter (LPF) with
a cut-off frequency (fc) of 12 Hz is used to remove the high frequency noises [20]. The smoothed signal
is then amplified to a maximum of 24 dB, and an offset control circuit adds DC voltage to the amplified
signal. Consequently, the final output signal of the analog part has a voltage range of 0 to +3.3 V, which
can be appropriately processed in the digital part (Figure 4).

Sensors 2015, 15 23407
Figure 4. Circuit module and signal processing flow.
The digital circuit comprises a micro-controller unit (MCU) and a wireless communication module
with an antenna. Analog EPW is converted to a 12-bit digital signal at a sampling frequency (fs) of 100 Hz
by an analog-to-digital converter (ADC) module in the MCU. A software program embedded in the
MCU detects pulse peaks in real time, and then the HR value is periodically transmitted to the host via
a wireless communication module. The module utilizes radio frequency (RF) on the 2.4 GHz band, and
the RF and antenna power output specifications are 0 dB and 0.5 dB, respectively (Figure 4). The
complete circuit module is depicted in Figure 5. It is designed and implemented in the shape of a cross
to utilize space efficiently and to have a minimal size to facilitate insertion into the proposed apparatus.
Figure 5. Circuit board (15 × 17 mm): (a) top and bottom views of circuit board, (1) analog
part, (2) MCU and digital part, (3) power regulator; (b) circuit board size compared to
25 cent coin.
3.3. Pulse-Peak Detection
The pulse peak detection algorithm comprises two stages. The first stage is morphological conversion,
in which the raw EPW is converted to a more robust signal that is impulsive and distinct [21]. The second
stage is application of knowledge-based rules to detect pulse peaks. The algorithm is implemented in the
C language in an embedded software environment, and runs in real time.

Sensors 2015, 15 23408
The morphological conversion stage comprises three phases: (1) finite impulse response (FIR) LPF;
(2) differentiation; and (3) slope sum function (SSF). An FIR filter is employed to suppress high
frequency factors by muscle influence and 50/60 Hz noise interference. A constrained equiripple FIR
filter (window size: 500 ms, fc: 8 Hz) was designed and applied. This filter guarantees that the stop-band
of the filter begins at a specific frequency and provides the desired minimum stop-band attenuation [22].
Then, differentiation with half-rectification is applied to enhance the ascending part and suppress the
descending part of the EPW. The SSF, a signal transformation scheme, is applied, for the same purpose
as the differentiation process (Figure 6). Window size of the SSF is set as 128 ms because the ascending
portion of a typical pulse wave is 128 ms [23].
Figure 6. In-ear pulse wave recorded for 6.5 s: (a) raw EPW; (b) smoothed EPW;
(c) converted (SSF) EPW.
The offset point of the EPW that passes the SSF (SsfPw) corresponds with the peak of the raw EPW.
The decision rules therefore aim to detect the peak and offset point of SsfPw. Figure 7 and Table 1
describe the knowledge-based decision process used to detect EPW peak. An example of the peak
detection result is shown in Figure 8.
Figure 7. Decision flow of EPW peak detection.

Sensors 2015, 15 23409
Table 1. Decision rules for SsfPw-offset detection.
Decision Rule Description
# 1 Are both the previous and next points lower than the current point?
# 2 Is it continuously descending until 50% of the “Initial Peak” value?
# 3 Is the distance between any continuous “Real Peaks” further than 250 ms?
# 4 Is it in “update mode”?
# 5 Is “Valid Peak” higher than the adaptive threshold?
# 6 Find the minimum point from “Valid Peak” within 150 ms in the forward direction.
Figure 8. SsfPw peak and raw EPW peak detected via decision rules: (a) SsfPw with its
peaks and offsets; (b) raw EPW with its peaks.
4. Validity Study
4.1. Study Design
To evaluate the validity of our developed monitoring device, a comparative analysis was performed
based on clinical data with reference equipment. A total of 58 healthy volunteers aged 26–44 years
participated in our clinical experiment (Table 2). Each subject was informed of the procedure and the
purpose of clinical data acquisition prior to the experiment, and subsequently signed a participation
agreement form. None of the participants had any self-reported cardiovascular disease such as
hypertension, cardiac infarction, or arrhythmia.
Table 2. Participants’ personal information.
N Age Height (cm) Weight (kg)
Male 43 36.3 ± 5.6 172.9 ± 4.9 72.5 ± 11.6
Female 15 31.7 ± 5.3 163.2 ± 3.7 53.5 ± 7.1
Total 58 35.3 ± 5.8 170.6 ± 6.3 67.8 ± 13.4
A commercial device (ECG-KIT V3.0, PhysioLab Co., Ltd, Busan, Korea) for the ECG measurement
was utilized as reference equipment [24]. The device measures ECG using three wired leads in contact
Sensors 2015, 15 23410
with the user’s right arm, left arm, and right leg, respectively. ECG-KIT includes instrumentation
amplifier and filters (LPF, HPF, and notch), and provides an analog waveform as a final output. We
connected its analog output to the ADC input port of the MCU in our developed in-ear device for the
experimental setting. Thus, both analog signals, EPW and ECG, were simultaneously converted to
digital signals with the same fs (100 Hz) and ADC resolution (12 bit). This setting was intended to secure
time-synchronized measurement between our targeted and reference signals.
Each subject wore the in-ear device and ECG electrodes while sitting in a relaxed position, and EPW
and ECG were simultaneously measured. A rest time of 5 min was given before the measurement in
order to induce a stable state in each subject. Data were recorded for 30 s from each subject.
4.2. Comparative Parameter
Each dataset obtained comprised EPW and ECG data simultaneously recorded for 30 s. Thus, a total
of 58 datasets were obtained through the clinical experiment with the 58 subjects. Physiologically, an
EPW peak and an ECG R-peak cannot occur at the same time owing to the pulse transit time [25].
Therefore, peak-to-peak interval was chosen as the parameter to use for comparison of the EPW and
ECG signals. Each interval was calculated as
𝐼𝑛𝑡𝑒𝑟𝑣𝑎𝑙(𝑛) = 𝑁𝑜. 𝑜𝑓 𝑑𝑎𝑡𝑎 𝑠𝑎𝑚𝑝𝑙𝑒𝑠 𝑏𝑒𝑡𝑤𝑒𝑒𝑛 𝑠𝑢𝑐𝑐𝑒𝑠𝑠𝑖𝑣𝑒 𝑝𝑒𝑎𝑘𝑠 (1)
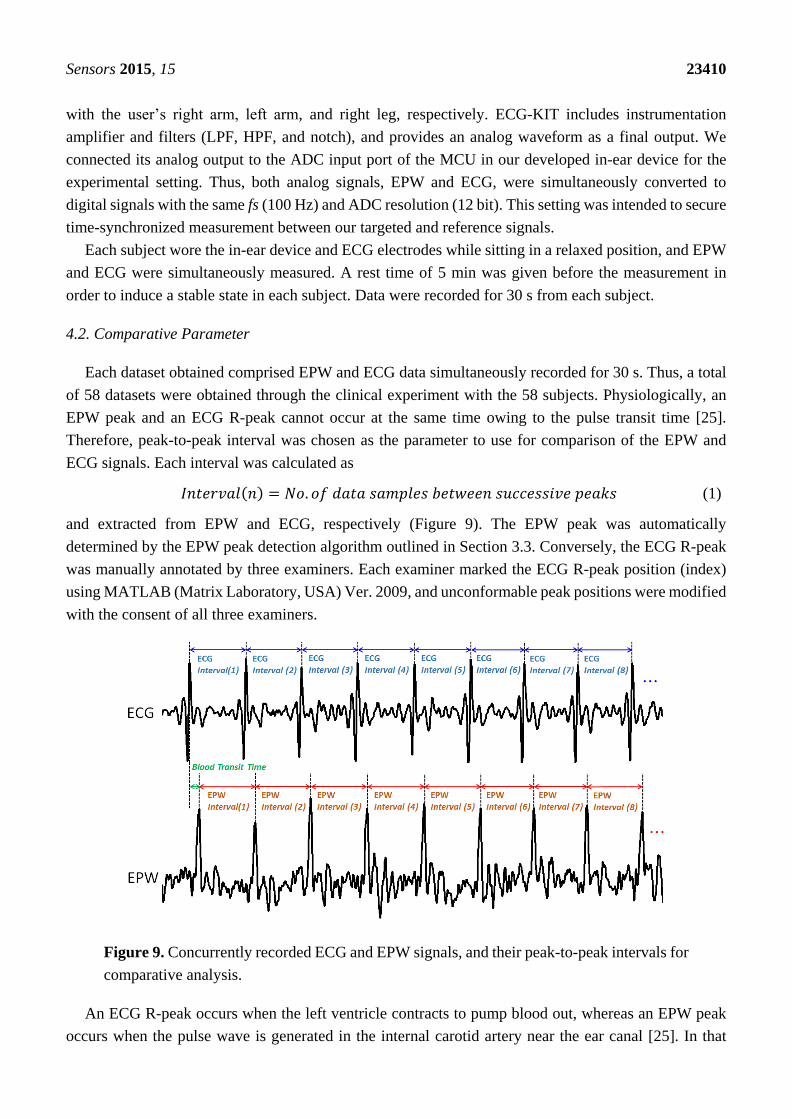
and extracted from EPW and ECG, respectively (Figure 9). The EPW peak was automatically
determined by the EPW peak detection algorithm outlined in Section 3.3. Conversely, the ECG R-peak
was manually annotated by three examiners. Each examiner marked the ECG R-peak position (index)
using MATLAB (Matrix Laboratory, USA) Ver. 2009, and unconformable peak positions were modified
with the consent of all three examiners.
Figure 9. Concurrently recorded ECG and EPW signals, and their peak-to-peak intervals for
comparative analysis.
An ECG R-peak occurs when the left ventricle contracts to pump blood out, whereas an EPW peak
occurs when the pulse wave is generated in the internal carotid artery near the ear canal [25]. In that

Sensors 2015, 15 23411
typical pulse transit time from heart to arteries near the ear, ranging from 10 to 20 ms [26], an EPW peak
corresponding to an ECG R-peak occurs right after the ECG R-peak occurs in the concurrently recorded
plot. In this way, intervals 20–23 numbers of ECGInterval (n) and their corresponding EPWInterval (n) were
extracted from each dataset.
4.3. Evaluation
Interval differences between ECG and EPW were investigated to determine the validity of our
proposed sensor device. To this end, four quantitative measures were utilized: sensitivity, positive
predictive value (PPV), mean absolute difference (MAD), and normalized error rate (ERNorm). These
measures are defined in Equations (2) to (5), respectively.
𝑆𝑒𝑛𝑠𝑖𝑡𝑖𝑣𝑖𝑡𝑦 (%) =𝑇𝑃
𝑇𝑃 + 𝐹𝑁 × 100 (%) (2)
𝑃𝑃𝑉 (%) =𝑇𝑃
𝑇𝑃 + 𝐹𝑃 × 100 (%) (3)
𝑀𝐴𝐷 (𝑠𝑎𝑚𝑝𝑙𝑒𝑠) =1
𝑁 ∑|𝐸𝐶𝐺𝐼𝑛𝑡𝑒𝑟𝑣𝑎𝑙(𝑛) − 𝐸𝑃𝑊𝐼𝑛𝑡𝑒𝑟𝑣𝑎𝑙(𝑛)|
𝑁
𝑛=1
(4)
𝐸𝑅𝑁𝑜𝑟𝑚 (%) =∑ |𝐸𝐶𝐺𝐼𝑛𝑡𝑒𝑟𝑣𝑎𝑙(𝑛) − 𝐸𝑃𝑊𝐼𝑛𝑡𝑒𝑟𝑣𝑎𝑙(𝑛)|𝑁
𝑛=1
∑ 𝐸𝐶𝐺𝐼𝑛𝑡𝑒𝑟𝑣𝑎𝑙(𝑛)𝑁𝑛=1
× 100 (%) (5)
Peak-to-peak interval of ECG or PPG is used to HR monitoring or HRV (heart rate variability)
analysis. In HR monitoring, 20 ms interval error possibly cause maximum error ranges of 0.85–3.23 bpm.
However, HR is an integer value and calculated from the averaged interval. HR error is therefore much
less than the maximum error range. In HRV analysis, an indicator that utilizes time delay is the pNNx;
the percentage of NN intervals in a 24-h time series differing by more than x ms [27]. The pNN50 or
pNN20 is typically utilized [27]. Thus, maximum interval error of 20 ms is allowed to HRV analysis in
time domain. For these reasons, we defined true detection as the difference between ECGInterval (n) and
its corresponding EPWInterval (n) being less than or equal to two samples (20 ms). Thereby, true positive
(TP), false positive (FP), and false negative (FN) are defined as follows:
TP—the number of EPWInterval (n) that satisfy the true detection condition,
FP—the number of EPWInterval (n) that do not satisfy the true detection condition,
FN—the number of ECGInterval (n) that do not satisfy the true detection condition.
Accordingly, sensitivity represents the proportion of “the number of truly detected intervals” out of
the “total number of ECGInterval (n),” whereas PPV signifies the proportion of “the number of truly
detected intervals” out of the “total number of EPWInterval (n).” [28] MAD and ERNorm represent the
interval difference per unit interval and unit sample, respectively. In addition, we adopted the Bland-Altman
analysis to assess the agreement of EPWInterval with ECGInterval [29]. We utilized SPSS (Statistical
Package for the Social Science, Armonk, NY, USA) Ver. 22 for statistical data processing.

Sensors 2015, 15 23412
5. Results and Discussion
Table 3 presents a summary of the acquired EPW data. Totals of 1297 of peaks, 1239 intervals, and
111,401 samples of interval length were detected from the 58 datasets, and their HR was 66.74 bpm on
average. Average 22.36 ± 0.67 of peaks, 21.36 ± 0.67 of intervals, and 1920.71 ± 34.48 samples of
interval length existed in each dataset, and its HR was 66.74 ± 1.82 on average. In general, the normal
HR of an adult ranges from 60 to 100 bpm [30]. Thus, the HR of the subjects in this study was considered
as relatively low, and presented in a narrow range: standard deviation (SD) of EPW-HR is 1.82. We
surmise that this result was obtained because the subjects measured ECG and EPW in a very stable state,
and belong to a similar age group.
Table 3. Summary of acquired EPW data.
No. of Peaks No. of Intervals Interval Length (samples) Heart Rate (bpm)
Dataset 22.36 ± 0.67 21.36 ± 0.67 1920.71 ± 34.48 66.74 ± 1.82
Total 1297 1239 111,401 66.74
Table 4 shows the performance evaluation results for the EPW device. TP, FP, and FN were 1204,
35, and 34, respectively. Sensitivity was 97.25%, and PPV was 97.18%. Even in the case where PPG
and ECG were concurrently measured with standard devices and methods, the peak-to-peak interval of
PPG was not perfectly in agreement with the corresponding peak-to-peak interval of ECG [31], because
the physiological system of the human body has various, tiny and nonlinear effects on the blood flow [32].
We therefore regard our obtained sensitivity and the PPV as outstanding achievements, although two
samples (20 ms) were set as allowable error.
Table 4. Performance evaluation results.
TP (No. of Intervals) FP (No. of Intervals) FN (No. of Intervals)
1204 35 34
Sensitivity (%) PPV (%) MAD (samples) ERNorm (%)
97.25 97.18 0.62 0.68
MAD was 0.62 samples, and ERNorm was 0.68%. This means that EPW had on average 0.62 samples
(6.2 ms) of error per unit interval, and on average 0.68% (68 µs) of error per unit sample, compared with
ECG. These numerical values also support the accuracy and validity of our proposed device for
HR monitoring.
As the allowable error (flaw size) increased, the sensitivity and the PPV naturally increased.
Increasing curves are depicted in Figure 10 with increasing flaw size from two to nine. When the flaw
size is greater than three, the sensitivity and the PPV are above 98%. When the flaw size is greater than
eight, the sensitivity and the PPV are above 99%. In the case where the HR varies from 50 bpm to 100 bpm,
flaw sizes two, three, and eight possibly cause maximum error ranges of 0.85–3.23 bpm, 1.28–4.76 bpm,
and 3.83–11.76 bpm, respectively (fs: 100 Hz).
We examined two different plots: plot of identity and the Bland-Altman plot (Figure 11). In the plot
of identity, the ECGIntervals is plotted along the Y axis, and the EPWIntervals is plotted along the X axis.
The identity line is presented as a reference to compare two different intervals, which are desired to be

Sensors 2015, 15 23413
identical under ideal conditions [29]. In the Bland-Altman plot, we created two variables: the average
between ECGIntervals and EPWIntervals, and the difference between two intervals. The difference is plotted
along the Y axis, and the average is plotted along the X axis. Then, we drew 95% limits of agreement
(average ± 1.96 SD of the difference) for comparison [29,33].
Figure 10. Sensitivity and PPV curves of the in-ear device.
Figure 11. Agreement analysis results: (a) plot of identity; (b) Bland-Altman plot.
The identity line in Figure 11a is y = x; it represents a high level of agreement between EPWIntervals
and ECGIntervals. In the Bland-Altman plot (Figure 11b), the mean difference is 0.0065, the SD of the
differences is 1.1011, and the 95% limits of agreement are −2.15 and 2.16. This figure shows that the
difference does not have an increasing or decreasing trend, as the average increases. The estimated bias
(mean difference) is very close to zero, and the random fluctuations (SD) around the bias are also narrow;
thus, EPWIntervals can be considered as being in high agreement with ECGIntervals.

Sensors 2015, 15 23414
6. Limitations
Despite the fact that our approach exhibits a competent performance, it has a drawback—this method
is quite sensitive to the user’s motion. Because the piezoelectric sensor measures the pressure variance
of the ear canal surface, if the user’s motions or activities become substantial, the pressure variance is
affected and EPW peaks then become less distinct. Accordingly, our proposed method is limited to
monitoring HR temporarily in the user’s stable status.
However, as can be seen in Figure 12, which depicts examples of EPW waveforms that occur when
the user is walking, running, and chewing gum, rough EPW peak signals for heartbeats are still
recognizable. Thus, we believe that a more sophisticated and improved algorithm to detect EPW peaks
will be required for continuous monitoring in normal daily life. Additional circuits or sensor devices will
also be necessary to compensate for the user’s motion artifacts for more simple processing and
extensive operation.
Figure 12. Examples of EPW waveform when the user is (a) walking, (b) running,
(c) chewing gum.
7. Conclusions
In this study, a novel approach was proposed for monitoring HR: the development of a wearable
sensing device that is both highly accurate and comfortable to measure EPW. The scissor-shaped
apparatus developed facilitates utilization of a small piezoelectric sensor and measurement of in-ear
pressure variance with high wearability. The piezoelectric sensor was sufficiently sensitive to detect
pressure waveforms from the ear canal surface. The hardware circuit module efficiently amplified EPW
and filtered various noises, and the embedded algorithm properly detected EPW peaks via
knowledge-based rules.
Among the new findings obtained in this study are the following: (1) HR can be accurately detected
from the pressure variance of the ear canal surface; and (2) a piezoelectric sensor enables measurement
as a part of a wearable sensor device. In addition, the validity study presented very promising results that
prove that our approach is accurate and performs well.

Sensors 2015, 15 23415
We believe that this method could be used to monitor HR, and may also be utilized in diverse
applications in the near future. One such instance could be to combine this method with a hearing aid.
Hearing aids are already one of the most popular in-ear devices. The hearing impaired population,
including the elderly, would be able to receive transparent and seamless vital sign monitoring benefits.
There has been no known previous effort to produce this product, but reduction in the size and shape of
the apparatus, and the circuit board could provide the key for the success of such a product as this.
Author Contributions
Jang-Ho Park performed overall work (design, implementation, and verification of sensor device) and
wrote the paper. Dae-Geun Jang developed the signal detection algorithm, performed statistical analysis
for the validity study, and revised the manuscript. Jung-Wook Park designed the sensor apparatus,
developed hardware circuit modules, and carried out clinical data acquisition. Se-Kyoung Youm
participated in apparatus design, clinical data processing, and manuscript revision. All authors read and
approved the final manuscript.
Conflicts of Interest
The authors declare no conflict of interest.
References
1. Mendis, S.; Puska, P.; Norrving, B. Global Atlas on Cardiovascular Disease Prevention and
Control; World Health Organization: Geneva, Switzerland, 2011.
2. Cook, S.; Togni, M.; Schaub, M.C.; Wenaweser, P.; Hess, O.M. High heart rate: A cardiovascular
risk factor? Eur. Heart J. 2006, 27, 2387–2393.
3. Pantelopoulos, A.; Bourbakis, N.G. A survey on wearable sensor-based systems for health
monitoring and prognosis. IEEE Trans. Syst. Man Cybern. Part C Appl. Rev. 2010, 40, 1–12.
4. Pantelopoulos, A.; Bourbakis, N. A Survey on Wearable Biosensor Systems for Health Monitoring.
In Proceedings of the 30th Annual International Conference of the IEEE EMBS, Vancouver,
Canada, 21–24 August 2008; pp. 4887–4890.
5. Asada, H.H.; Shaltis, P.; Reisner, A.; Rhee, S.; Hutchinson, R.C. Mobile monitoring with wearable
photoplethysmographic biosensors. IEEE Eng. Med. Biol. Mag. 2003, 22, 28–40.
6. Tamura, T.; Maeda, Y.; Sekine, M.; Yoshida, M. Wearable photoplethysmographic sensors—Past
and present. Electronics 2014, 3, 282–302.
7. Venema, B.; Schiefer, J.; Blazek, V.; Blanik, N.; Leonhardt, S. Evaluating innovative in-ear pulse
oximetry for unobtrusive cardiovascular and pulmonary monitoring during sleep. IEEE J. Trans.
Eng. Health Med. 2013, 1, doi:10.1109/JTEHM.2013.2277870.
8. Baig, M.M.; Gholamhosseini, H.; Connolly, M.J. A comprehensive survey of wearable and wireless
ecg monitoring systems for older adults. Med. Biol. Eng. Comp. 2013, 51, 485–495.
9. Chan, M.; Estève, D.; Fourniols, J.-Y.; Escriba, C.; Campo, E. Smart wearable systems: Current
status and future challenges. Artif. Intell. Med. 2012, 56, 137–156.

Sensors 2015, 15 23416
10. Teichmann, D.; Matteis, D.D.; Bartelt, T.; Walter, M.; Leonhardt, S. A bendable and wearable
cardiorespiratory monitoring device fusing two noncontact sensor principles. IEEE J. Biomed.
Health Inf. 2015, 19, 784–793.
11. West, C. The temporal bone and the ear. J. Anat. 1950, 84, 57–58.
12. Westerhof, N.; Sipkema, P.; Van Den Bos, G.; Elzinga, G. Forward and backward waves in the
arterial system. Cardiovasc. Res. 1972, 6, 648–656.
13. Denardo, S.J.; Nandyala, R.; Freeman, G.L.; Pierce, G.L.; Nichols, W.W. Pulse wave analysis of
the aortic pressure waveform in severe left ventricular systolic dysfunction. Circ. Heart Fail. 2010,
3, 149–156.
14. Niki, K.; Sugawara, M.; Chang, D.; Harada, A.; Okada, T.; Sakai, R.; Uchida, K.; Tanaka, R.;
Mumford, C.E. A new noninvasive measurement system for wave intensity: Evaluation of carotid
arterial wave intensity and reproducibility. Heart Vessels 2002, 17, 12–21.
15. Reesink, K.D.; Hermeling, E.; Hoeberigs, M.C.; Reneman, R.S.; Hoeks, A.P. Carotid artery pulse
wave time characteristics to quantify ventriculoarterial responses to orthostatic challenge. J. Appl.
Phys. 2007, 102, 2128–2134.
16. O’Rourke, M.F.; Pauca, A.; Jiang, X.J. Pulse wave analysis. Br. J. Clin. Pharmacol. 2001, 51, 507–522.
17. Sirohi, J.; Chopra, I. Fundamental understanding of piezoelectric strain sensors. J. Intell. Mater.
Syst. Struct. 2000, 11, 246–257.
18. Lally, J.; Cummiskey, D. Dynamic pressure calibration. Sens. Peterb. 2003, 20, 15–21.
19. Measurement Specialities—Metallized Piezo Film Sheets. Available online: http://www.meas-
spec.com/piezo-film-sensors.aspx (accessed on 31 August 2015).
20. Phoenix Ambulatory Blood Pressure Monitor Project—Sub Project: Piezo Film Pulse Sensor.
Available online: http://www.phoenix.tc-ieee.org/004_Piezo_Film_Blood_Flow_Sensor/Phoenix_
PiezoPulse.htm (accessed on 5 June 2014).
21. Jang, D.G.; Park, S.; Hahn, M.; Park, S.H. A real-time pulse peak detection algorithm for the
photoplethysmogram. Int. J. Electron. Electr. Engin. 2014, 2, 45–49.
22. Losada, R.A. Digital Filters with Matlab®; MathWorks: Natick, MA, USA, 2008.
23. Zong, W.; Heldt, T.; Moody, G.; Mark, R. An open-source algorithm to detect onset of arterial blood
pressure pulses. In Proceedings of the Computers in Cardiology Conference 2003, Thessaloniki
Chalkidiki, Greece, 21–24 September 2003; pp. 259–262.
24. Physiolab: Ecg Kit. Available online: http://www.physiolab.co.kr/Eng_New/Product_education_
assembly.aspx (accessed on 15 May 2015).
25. Smith, R.P.; Argod, J.; Pépin, J.-L.; Lévy, P.A. Pulse transit time: An appraisal of potential clinical
applications. Thorax 1999, 54, 452–457.
26. Allen, J.; Murray, A. Age-related changes in peripheral pulse timing characteristics at the ears,
fingers and toes. J. Hum. Hypertens. 2002, 16, 711–717.
27. Clifford, G.D. Ecg statistics, noise, artifacts, and missing data. In Advanced Methods and Tools for
ECG Data Analysis; Artech House: London, UK, 2006; pp. 55–99.
28. Jang, D.G.; Park, S.H.; Hahn, M. Framework for automatic delineation of second derivative of
photoplethysmogram: A knowledge-based approach. J. Med. Biol. Eng. 2014, 34, 547–553.
29. Bland, J.M.; Altman, D. Statistical methods for assessing agreement between two methods of
clinical measurement. Lancet 1986, 327, 307–310.

Sensors 2015, 15 23417
30. Wikipedia: Heart Rate. Available online: https://en.wikipedia.org/wiki/Heart_rate (accessed on
19 June 2015).
31. Arberet, S.; Lemay, M.; Renevey, P.; Sola, J.; Grossenbacher, O.; Andries, D.; Sartori, C.; Bertschi, M.
Photoplethysmography-Based Ambulatory Heartbeat Monitoring Embedded into a Dedicated
Bracelet. In Proceedings of Computing in Cardiology Conference (CinC) 2013, Zaragoza, Spain,
22–25 September 2013; pp. 935–938.
32. O’Rourke, M.F. Time domain analysis of the arterial pulse in clinical medicine. Med. Boil.
Eng. Comp. 2009, 47, 119–129.
33. Bland, J.M.; Altman, D.G. Applying the right statistics: Analyses of measurement studies.
Ultrasound Obstet. Gyn. 2003, 22, 85–93.
© 2015 by the authors; licensee MDPI, Basel, Switzerland. This article is an open access article
distributed under the terms and conditions of the Creative Commons Attribution license
(http://creativecommons.org/licenses/by/4.0/).


![Sensors sensors - Semantic Scholar€¦ · Sensors 2008, 8 3904 1. Introduction Traditional sensing modalities such as X-ray projection imaging [1], nuclear magnetic resonance (NMR)](https://img.dokumen.tips/doc/110x75/5f6c934e07eec62ee84bad51/sensors-sensors-semantic-scholar-sensors-2008-8-3904-1-introduction-traditional.jpg)