Embed Size (px)
Citation preview

Sensitive Screening of Pharmaceuticals and Personal Care Products (PPCPs) in Water Using an Agilent 6545 Q-TOF LC/MS System
Application Note
AuthorsDan-Hui Dorothy Yang1, Mark A. Murphy2, Yue Song3, Jimmy Chan3
1Agilent Technologies Inc., 5301 Stevens Creek Blvd, Santa Clara, CA 95051, USA
2EPA Region 8 Lab, 16194 West 45th Drive, Golden, CO 80403, USA
3Agilent Technologies Co., Ltd., Shanghai, PR China
AbstractAs a follow up to the Application Note on detection of pharmaceuticals and personal care products (PPCPs) in water using the Agilent 6495 Triple Quadrupole Mass Spectrometer8, this Application Note describes two methods to screen and quantitate PPCPs in water at part per trillion (ppt) levels using the Agilent 6545 Q-TOF LC/MS System. Similarly, the methods were divided into positive ion mode and negative ion mode due to the unique mobile phases used for the two methods. The precise and accurate screening and quantitation of 118 compounds in positive ion mode and 22 compounds in negative mode was accomplished on the 6545 Q-TOF LC/MS using the Swarm tune parameters optimized for small fragile organic molecules. The high sensitivity slicer mode was selected to maximize instrument sensitivity. Most of the PPCPs could be detected without tedious analyte enrichment such as solid phase extraction (SPE). The extent of sample preparation included filtering approximately 3 mL of sample, adding internal standards to a 1.0 mL aliquot of the filtered sample, and injecting 40 μL of sample for analysis by Q-TOF LC/MS with reporting limits for the majority of analytes at 10 ppt. The limit of detection (LOD) and lower limit of quantitation (LLOQ) for most of the analytes are much lower than 10 ppt.

2
mass spectrometers (called Swarm autotune). Swarm autotune provides many choices to maximize sensitivity or mass resolution. First, it can optimize ion transmission at particular mass ranges (for example, 50–250 m/z, 50–750 m/z, or 50–1,700 m/z) based on application needs. Secondly, the improvements in ion transmission for small molecules has also resulted in enhanced mass accuracy below 100 m/z. Lastly, instrument parameters can be tuned according to the fragility of analytes, which requires milder ion transmission parameters to preserve their molecular masses. In combination with the modifications, and the ability to select the high sensitivity slicer mode, a substantial increase in signal response compared with the previous generation of the instrument has been achieved6.
Experimental and InstrumentationReagents and chemicalsAll reagents and solvents were HPLC-MS grade. Acetonitrile was purchased from Honeywell (015-4). Ultrapure water was obtained from a Milli-Q Integral system equipped with a LC-Pak Polisher and a 0.22-μm membrane point-of-use cartridge (Millipak). Ammonium acetate, 5 M solution, was purchased from Fluka (09691-250ML). Acetic acid was purchased from Aldrich (338828-25ML). The PPCP standards and some of the internal standards were acquired from an outside collaborator. The list of analytes and their internal standards are listed in Table 1 for the positive ion mode method and Table 2 for the negative ion mode method. Personal Compound Database Libraries (PCDLs) for analytes were created using the Agilent PCDL Manager (B.07.00) with retention time acquired with standards.
consumption of solvents, and laborious procedures. PPCPs analysis also has the complexity of significant contamination, such as urban surface water sources, where some of the PPCPs can be found above part per billion (ppb) levels. In addition to higher analyte concentrations, total organic carbon levels in these samples also increase. This can add substantial interferences to the analytes. The instrumentation required for PPCPs analysis must have, not only a broad dynamic range, but also provide precise and accurate screening and quantitation through excellent mass accuracy and resolution.
The Agilent 6545 Q-TOF LC/MS, in combination with the Agilent Jet Stream Ionization source, meets the dynamic analytical demands for the occurrence and fate of PPCPs in water along with the convenience of direct sample injection. Several modifications associated with the 6545 Q-TOF LC/MS have resulted in higher analytical performance compared to previous model. Some of these improvements include:
• A new slicer design with the option to operate in high sensitivity or high resolution mode
• A new high performance high voltage power supply, along with a new pulser to improve mass accuracy and resolution
• A new enhanced gain-shifted detector that provides much better instrument robustness
• A new front end ion optics for increased precursor ion transmission
The most noteworthy change is the new Particle Swarm Optimization technology. For the first time, the Particle Swarm Optimization technology is used to optimize the 6545 Q-TOF LC/MS
IntroductionPharmaceuticals and Personal Care Products (PPCPs) are comprised of thousands of chemical substances, including prescription and over-the-counter therapeutic drugs, veterinary drugs, fragrances, and cosmetics. Several studies have shown that pharmaceuticals and their metabolites are present in our waterbodies1,2. PPCPs in surface waters can eventually enter drinking water systems when treatments are insufficient. Governmental agencies, such as the EPA and the European Water Framework, have proposed regulations to monitor water supply systems3,4. High performance liquid chromatography (HPLC) in combination with high resolution Q-TOF mass spectrometry is gaining traction to investigate the occurrence and fate of PPCPs in water systems. There are several advantages associated with the analysis of PPCPs by Q-TOF LC/MS:
• Screening of a large number of analytes within one run
• Retrospective data mining for new analytes
• No need for individual standards for fragmentation information
• Structure confirmation by MS/MS fragments
Compared with targeted analysis (for example, triple quadrupole), Q-TOF LC/MS has the added benefit of nontargeted or semitargeted screening for unknowns.
The detection limits for PPCPs in drinking water are typically in the low part per trillion (ppt) levels. This poses significant challenges in analytical methodology and instrumentation. Sample enrichment by solid phase extraction (SPE) is often performed to reach these levels in drinking water samples5. SPE requires large sample quantities, high
3
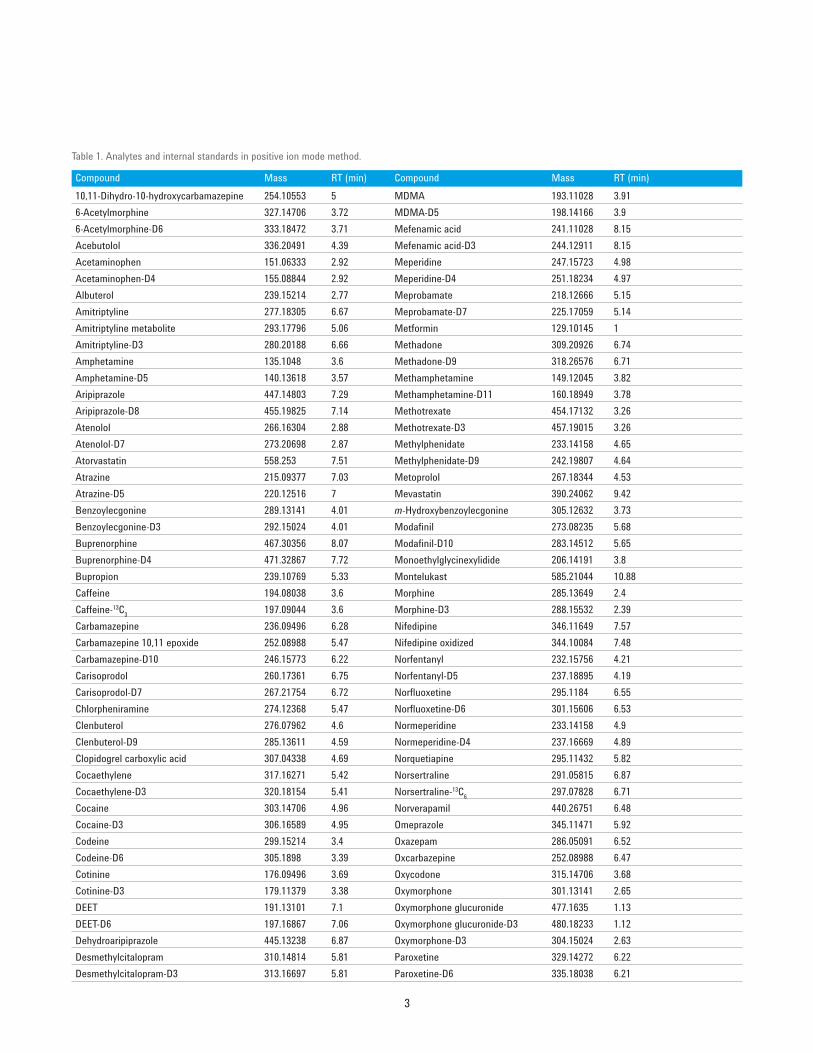
Table 1. Analytes and internal standards in positive ion mode method.
Compound Mass RT (min) Compound Mass RT (min)10,11-Dihydro-10-hydroxycarbamazepine 254.10553 5 MDMA 193.11028 3.916-Acetylmorphine 327.14706 3.72 MDMA-D5 198.14166 3.96-Acetylmorphine-D6 333.18472 3.71 Mefenamic acid 241.11028 8.15Acebutolol 336.20491 4.39 Mefenamic acid-D3 244.12911 8.15Acetaminophen 151.06333 2.92 Meperidine 247.15723 4.98Acetaminophen-D4 155.08844 2.92 Meperidine-D4 251.18234 4.97Albuterol 239.15214 2.77 Meprobamate 218.12666 5.15Amitriptyline 277.18305 6.67 Meprobamate-D7 225.17059 5.14Amitriptyline metabolite 293.17796 5.06 Metformin 129.10145 1Amitriptyline-D3 280.20188 6.66 Methadone 309.20926 6.74Amphetamine 135.1048 3.6 Methadone-D9 318.26576 6.71Amphetamine-D5 140.13618 3.57 Methamphetamine 149.12045 3.82Aripiprazole 447.14803 7.29 Methamphetamine-D11 160.18949 3.78Aripiprazole-D8 455.19825 7.14 Methotrexate 454.17132 3.26Atenolol 266.16304 2.88 Methotrexate-D3 457.19015 3.26Atenolol-D7 273.20698 2.87 Methylphenidate 233.14158 4.65Atorvastatin 558.253 7.51 Methylphenidate-D9 242.19807 4.64Atrazine 215.09377 7.03 Metoprolol 267.18344 4.53Atrazine-D5 220.12516 7 Mevastatin 390.24062 9.42Benzoylecgonine 289.13141 4.01 m-Hydroxybenzoylecgonine 305.12632 3.73Benzoylecgonine-D3 292.15024 4.01 Modafinil 273.08235 5.68Buprenorphine 467.30356 8.07 Modafinil-D10 283.14512 5.65Buprenorphine-D4 471.32867 7.72 Monoethylglycinexylidide 206.14191 3.8Bupropion 239.10769 5.33 Montelukast 585.21044 10.88Caffeine 194.08038 3.6 Morphine 285.13649 2.4Caffeine-13C3 197.09044 3.6 Morphine-D3 288.15532 2.39Carbamazepine 236.09496 6.28 Nifedipine 346.11649 7.57Carbamazepine 10,11 epoxide 252.08988 5.47 Nifedipine oxidized 344.10084 7.48Carbamazepine-D10 246.15773 6.22 Norfentanyl 232.15756 4.21Carisoprodol 260.17361 6.75 Norfentanyl-D5 237.18895 4.19Carisoprodol-D7 267.21754 6.72 Norfluoxetine 295.1184 6.55Chlorpheniramine 274.12368 5.47 Norfluoxetine-D6 301.15606 6.53Clenbuterol 276.07962 4.6 Normeperidine 233.14158 4.9Clenbuterol-D9 285.13611 4.59 Normeperidine-D4 237.16669 4.89Clopidogrel carboxylic acid 307.04338 4.69 Norquetiapine 295.11432 5.82Cocaethylene 317.16271 5.42 Norsertraline 291.05815 6.87Cocaethylene-D3 320.18154 5.41 Norsertraline-13C6 297.07828 6.71Cocaine 303.14706 4.96 Norverapamil 440.26751 6.48Cocaine-D3 306.16589 4.95 Omeprazole 345.11471 5.92Codeine 299.15214 3.4 Oxazepam 286.05091 6.52Codeine-D6 305.1898 3.39 Oxcarbazepine 252.08988 6.47Cotinine 176.09496 3.69 Oxycodone 315.14706 3.68Cotinine-D3 179.11379 3.38 Oxymorphone 301.13141 2.65DEET 191.13101 7.1 Oxymorphone glucuronide 477.1635 1.13DEET-D6 197.16867 7.06 Oxymorphone glucuronide-D3 480.18233 1.12Dehydroaripiprazole 445.13238 6.87 Oxymorphone-D3 304.15024 2.63Desmethylcitalopram 310.14814 5.81 Paroxetine 329.14272 6.22Desmethylcitalopram-D3 313.16697 5.81 Paroxetine-D6 335.18038 6.21

4
Compound Mass RT (min) Compound Mass RT (min)Desmethylvenlafaxine 263.18853 4.6 Phenmetrazine 177.11536 3.74Desmethylvenlafaxine-D6 269.22619 4.23 Phentermine 149.12045 3.97Dextromethorphan 271.19361 5.69 Phentermine-D5 154.15183 3.94Dextromethorphan-D3 274.21244 5.68 Phenylpropanolamine 151.09971 2.93Diltiazem 414.16133 6.14 Phenylpropanolamine-D3 154.11854 2.93Diphenhydramine 255.16231 5.88 Pioglitazone 356.11946 7.72Diphenhydramine-D3 258.18114 5.88 Pregabalin 159.12593 2.73Disopyramide 339.23106 4.87 Pregabalin-D6 165.16359 2.76Donepezil 379.21474 5.65 Primidone 218.10553 4.43Duloxetine 297.11873 6.47 Propranolol 259.15723 5.52Duloxetine-D3 300.13757 6.47 Propranolol-D7 266.20117 5.5Ecgonine methyl ester 199.12084 1.15 Pseudoephedrine 165.11536 3.3Ecgonine methyl ester-D3 202.13967 1.15 Pseudoephedrine-D3 168.13419 3.29EDDP 277.18305 6.31 Quetiapine 383.16675 6.27EDDP-D3 280.20188 6.31 Quetiapine-D8 391.21696 6.17Erythromycin 733.46124 5.78 Ritalinic acid 219.12593 3.78Erythromycin-13C2 735.46795 5.78 Ritalinic acid-D10 229.1887 3.75Erythromycin-anhydro 715.45068 6.3 Sertraline 305.0738 6.88Escitalopram 324.16379 5.92 Sertraline-D3 308.09264 6.87Famotidine 337.04493 2.89 Sildenafil 474.20492 6.65Fentanyl 336.22016 5.9 Simvastatin 418.27192 10.4Fentanyl-D5 341.25155 5.88 Sotalol 272.11946 2.93Fluoxetine 309.13405 6.7 Sulfamethazine 278.08375 4.45Fluoxetine-D6 315.17171 6.69 Sulfamethazine-13C6 284.10388 4.45Fluticasone propionate 500.18443 9.05 Sumatriptan 295.13545 3.5Gabapentin 171.12593 2.75 Tadalafil 389.13756 6.86Gabapentin-D10 181.1887 2.72 Temazepam 300.06656 7.2Glyburide 493.14382 8.27 Temazepam-D5 305.09794 7.16Hydrocodone 299.15214 3.84 Thiabendazole 201.03607 5.18Hydrocodone-D6 305.1898 3.84 Thiabendazole-13C6 207.0562 5.19Hydromorphone 285.13649 2.9 Tramadol 263.18853 4.6Hydromorphone-D3 288.15532 2.89 Tramadol-13C-D3 267.21071 4.58Hydroxybupropion 255.10261 4.62 Trazadone 371.15129 5.9Hydroxybupropion-D6 261.14027 4.61 Trazadone-D6 377.18895 5.81Ketoprofen 254.09429 6.42 Triamterene 253.10759 4.12Lamotrigine 255.00785 4.73 Trimethoprim 290.13789 3.95Lamotrigine-13C15N4 259.99935 4.74 Trimethoprim-13C3 293.14795 3.94Lamotrigine-13C3 258.01792 4.73 Tylosin 915.51915 6.12Levorphanol 257.17796 4.43 Valsartan 435.22704 5.97Lidocaine 234.17321 4.51 Venlafaxine 277.20418 5.19Loratadine 382.14481 9.38 Venlafaxine-D6 283.24184 5.19Lorazepam 320.01193 6.67 Verapamil 454.28316 6.63Lorazepam-D4 324.03704 6.67 Zolpidem 307.16846 6.02MDA 179.09463 3.73 Zolpidem phenyl-4-carboxylic acid 337.14264 3.93MDEA 207.12593 4.18 Zolpidem-D7 314.2124 5.98
5
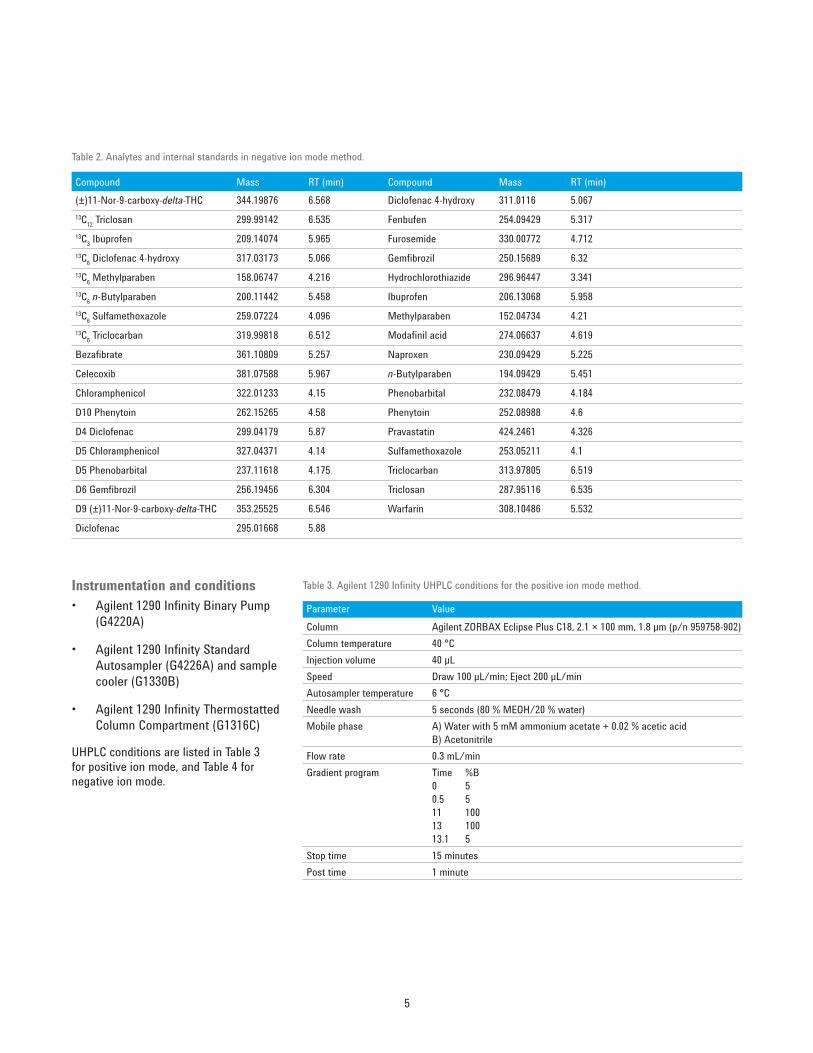
Instrumentation and conditions • Agilent 1290 Infinity Binary Pump
(G4220A)
• Agilent 1290 Infinity Standard Autosampler (G4226A) and sample cooler (G1330B)
• Agilent 1290 Infinity Thermostatted Column Compartment (G1316C)
UHPLC conditions are listed in Table 3 for positive ion mode, and Table 4 for negative ion mode.
Table 2. Analytes and internal standards in negative ion mode method.
Compound Mass RT (min) Compound Mass RT (min)(±)11-Nor-9-carboxy-delta-THC 344.19876 6.568 Diclofenac 4-hydroxy 311.0116 5.06713C12 Triclosan 299.99142 6.535 Fenbufen 254.09429 5.31713C3 Ibuprofen 209.14074 5.965 Furosemide 330.00772 4.71213C6 Diclofenac 4-hydroxy 317.03173 5.066 Gemfibrozil 250.15689 6.3213C6 Methylparaben 158.06747 4.216 Hydrochlorothiazide 296.96447 3.34113C6 n-Butylparaben 200.11442 5.458 Ibuprofen 206.13068 5.95813C6 Sulfamethoxazole 259.07224 4.096 Methylparaben 152.04734 4.2113C6 Triclocarban 319.99818 6.512 Modafinil acid 274.06637 4.619
Bezafibrate 361.10809 5.257 Naproxen 230.09429 5.225
Celecoxib 381.07588 5.967 n-Butylparaben 194.09429 5.451
Chloramphenicol 322.01233 4.15 Phenobarbital 232.08479 4.184
D10 Phenytoin 262.15265 4.58 Phenytoin 252.08988 4.6
D4 Diclofenac 299.04179 5.87 Pravastatin 424.2461 4.326
D5 Chloramphenicol 327.04371 4.14 Sulfamethoxazole 253.05211 4.1
D5 Phenobarbital 237.11618 4.175 Triclocarban 313.97805 6.519
D6 Gemfibrozil 256.19456 6.304 Triclosan 287.95116 6.535
D9 (±)11-Nor-9-carboxy-delta-THC 353.25525 6.546 Warfarin 308.10486 5.532
Diclofenac 295.01668 5.88
Table 3. Agilent 1290 Infinity UHPLC conditions for the positive ion mode method.
Parameter ValueColumn Agilent ZORBAX Eclipse Plus C18, 2.1 × 100 mm, 1.8 µm (p/n 959758-902)Column temperature 40 °CInjection volume 40 µLSpeed Draw 100 µL/min; Eject 200 µL/minAutosampler temperature 6 °CNeedle wash 5 seconds (80 % MEOH/20 % water)Mobile phase A) Water with 5 mM ammonium acetate + 0.02 % acetic acid
B) Acetonitrile Flow rate 0.3 mL/minGradient program Time %B
0 5 0.5 5 11 100 13 100 13.1 5
Stop time 15 minutesPost time 1 minute

6
MS detectionAn Agilent 6545 Q-TOF LC/MS with an Agilent Jet Stream electrospray ionization source was used.
Jet Stream ionization source parameters are critical for the sensitive detection of analytes7. For multiple analyte applications, parameters are typically weighted towards hard-to-detect analytes. In this case, source parameters were accessed based on the triple quadrupole data and other studies on the particular compounds8. Mass spectrometer source conditions are listed in Table 5 for the positive ion mode method, and Table 6 for the negative ion mode method.
Software• Agilent MassHunter data
acquisition for Q-TOF mass spectrometer, Version B.06.01
• Agilent MassHunter Qualitative Software, Version B.07.00 Build 7.0.7024.0
• Agilent MassHunter Quantitative Software, Version B.07.00 Build 7.0.457.0
Table 5. Agilent 6545 Q-TOF LC/MS source parameters for positive ion mode method.
Parameter ValueMode 2 GHz Extended dynamic range; high sensitivity slicer modeTune 50–250 m/z; Fragile ionsDrying gas temperature 150 °CDrying gas flow 10 L/minSheath gas temperature 375 °CSheath gas flow 11 L/minNebulizer pressure 35 psiCapillary voltage 3,500 VNozzle voltage 200 VFragmentor 125 VSkimmer 45 VOct1 RF Vpp 750 VAcq mass range 100–1,000 m/z (MS only)Acq rate 3 spectra/sRef mass ions 121.050873, 922.009798
Table 4. Agilent Infinity 1290 UHPLC conditions for the negative ion mode method.
Parameter ValueColumn Agilent ZORBAX Eclipse Plus C18, 2.1 × 100 mm, 1.8 µm (p/n 959758-902)Column temperature 40 °CInjection volume 40 µLSpeed Draw 100 µL/min; Eject 200 µL/minAutosampler temperature 6 °CNeedle wash 5 seconds (80 % MEOH/20 % water)Mobile phase A) Water with 0.005 % acetic acid
B) AcetonitrileFlow rate 0.3 mL/minGradient program Time %B
0 5 0.5 5 6 100 8 100 8.1 5
Stop time 10 minutesPost time 1 minute

7
Dilutions Stock solutions for analyte standards and internal standards were prepared at 25 ppb in acetonitrile for each compound. All samples were fortified with internal standards at a constant concentration of 100 ppt, while calibration standards were spiked at 10 ppt, 25 ppt, 50 ppt, 100 ppt, 250 ppt, 500 ppt, and 1,000 ppt (seven levels) in Milli-Q water.
Two of the three unknown samples were from an outside collaborator. One was from a remote site removed from significant anthropogenic sources, and one was from an urban surface water source. Another sample was freshly collected local tap water (Santa Clara, USA). All samples were fortified with internal standards at 100 ppt after filtration.
Results and DiscussionSystem stabilitySystem stability was evaluated using 300 continuous injections of reserpine samples at 100 ppb in 70 % acetonitrile with a gradient of 1.5 minutes. The acquisition was set to 2 spectra per second in the presence of internal reference masses (m/z 121.0509 and 922.0098). The mass accuracy was obtained by Agilent MassHunter Qualitative Analysis. For all 300 injections, mass accuracy remained very stable, within 0.25 ppm, as illustrated by Figure 1. The area %RSD for 300 injections was 2.56 % with three separate sample preparations.
Table 6. Agilent 6545 Q-TOF LC/MS source parameters for negative ion mode method
Parameter ValueMode 2 GHz Extended dynamic range; high sensitivity slicer modeTune 50–250 m/z; Fragile ionsDrying gas temperature 200 °CDrying gas flow 12 L/minSheath gas temperature 375 °CSheath gas flow 12 L/minNebulizer pressure 35 psiCapillary voltage 4,000 VNozzle voltage 2,000 VFragmentor 110 VSkimmer 40 VOct1 RF Vpp 750 VAcq mass range 100–1,000 m/z (MS only)Acq rate 2 spectra/sRef mass ions 119.03632, 966.000725
Figure 1. Excellent system stability. Mass accuracy was maintained within 0.25 ppm for 300 continuous injections of reserpine samples with area %RSD of 2.56 % .
-1.0
-0.8
-0.6
-0.4
-0.2
0
0.2
0.4
0.6
0.8
1.0
0 50 100 150 200 250 300Injections
Mas
s erro
r (pp
m)
8
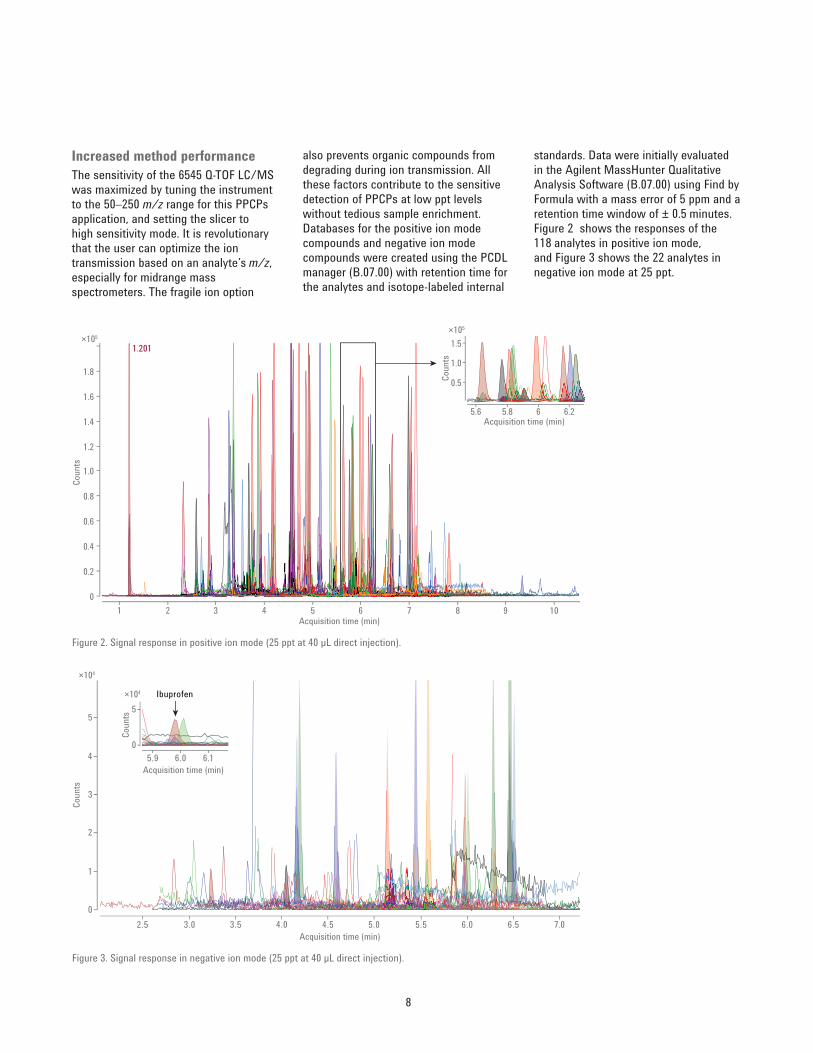
standards. Data were initially evaluated in the Agilent MassHunter Qualitative Analysis Software (B.07.00) using Find by Formula with a mass error of 5 ppm and a retention time window of ± 0.5 minutes. Figure 2 shows the responses of the 118 analytes in positive ion mode, and Figure 3 shows the 22 analytes in negative ion mode at 25 ppt.
also prevents organic compounds from degrading during ion transmission. All these factors contribute to the sensitive detection of PPCPs at low ppt levels without tedious sample enrichment. Databases for the positive ion mode compounds and negative ion mode compounds were created using the PCDL manager (B.07.00) with retention time for the analytes and isotope-labeled internal
Increased method performanceThe sensitivity of the 6545 Q-TOF LC/MS was maximized by tuning the instrument to the 50–250 m/z range for this PPCPs application, and setting the slicer to high sensitivity mode. It is revolutionary that the user can optimize the ion transmission based on an analyte’s m/z, especially for midrange mass spectrometers. The fragile ion option
×105×105
0
0.2
0.4
0.6
0.8
1.0
1.2
1.4
1.6
1.8
1.201
1 2 3 4 5 6 7 8 9 10
0.5
1.0
1.5
Acquisition time (min)
Acquisition time (min)
Coun
ts
Coun
ts
5.6 5.8 6 6.2
Figure 2. Signal response in positive ion mode (25 ppt at 40 µL direct injection).
0
1
2
3
4
5
2.5 3.0 3.5 4.0 4.5 5.0 5.5 6.0 6.5 7.0
0
5
5.9 6.0 6.1
Ibuprofen
×104
×104
Acquisition time (min)
Acquisition time (min)
Coun
ts
Coun
ts
Figure 3. Signal response in negative ion mode (25 ppt at 40 µL direct injection).

9
Most of the compounds can be detected at a concentration much lower than 10 ppt without sample enrichment. Figure 4 shows the number of compounds that could be quantified, lower limit of quantitation (LLOQ), at each concentration level with accuracy between 80–120 % for at least three out of five replicates. There were 140 compounds, 118 in positive ion mode and 22 in negative ion mode. Norsertraline was not detected in all spiked concentrations, probably due to degradation since the stock standard was over three months old. Of the 44 compounds that failed to be quantified at 10 ppt, approximately 43 % failed due to quantitation accuracy beyond 80–120 %.
Due to the improvement in mass accuracy and the increased sensitivity as well as innate quantitation accuracy of the 6545 Q-TOF LC/MS, high confidence compound identification was achieved based not only on mass accuracy but also on isotopic abundance and spacing. An example is presented in Figure 5. 6-Acetylmorphine was identified with an overall target score of 93.43 out of 100 at 25 ppt in the presence of ~1,000x coeluting ions.
Calibration curvesCalibration curves were assessed with PPCPs spiked in Milli-Q water covering a concentration range from 10 ppt to 1,000 ppt. Some of the analytes had corresponding isotope-labeled internal standards. All samples were fortified with internal standards at a constant concentration of 100 ppt. Calibration curves were generated using a quadratic fit with a weighting factor of 1/x, including the origin. The correlation coefficients (R2) for most of the target analytes in both polarities were equal to or greater than 0.99; most were greater than 0.995, except for methotrexate (R2 = 0.978) and thiabendazole (R2 = 0.984). The calibration curves for cotinine in positive ion mode and ibuprofen in negative ion mode are shown as examples in Figure 6.
Figure 4. Number of compounds that could be quantified at each concentration level with 40 µL direct injection of water samples.
95
126
136138 139
80
90
100
110
120
130
140
150
10 ppt 25 ppt 50 ppt 100 ppt 250 ppt
No. o
f ana
lyte
s det
ecte
d
Figure 5. Identify with confidence. 6-acetylmorphine at 25 ppt can be detected with high confidence (target score 93.43 out of 100) in the presence of ~1,000x coeluting ions.
×104
0
0.5
1.0
1.5
2.0
2.5 3.6943.793
Acquisition time (min)
Coun
ts
3.6 3.7 3.8
A×104
0
0.25
0.50
0.75
1.00
1.25
328.1543([C19H21NO4]+H)+
329.1564([C19H21NO4]+H)+
330.1592([C19H21NO4]+H)+
Mass-to-charge (m/z)Co
unts
328.0 328.5 329.0 329.5 330.0
B
A
BIbuprofen
Relative concentration0 1 2 3 4 5 6 7 8 9 10
0
20
40
60
80y = –0.004667*x2 + 1.069724*x + 0.015310R2 = 0.9989
Cotinine
Relative concentration0 1 2 3 4 5 6 7 8 9 10
Rela
tive
resp
onse
sRe
lativ
e re
spon
ses
0
20
40
60
80
100 y = 0.004176*x2 + 1.106211*x – 0.041591R2 = 0.9983
Figure 6. Calibration curves of cotinine (positive) and ibuprofen (negative) in Milli-Q water.
10
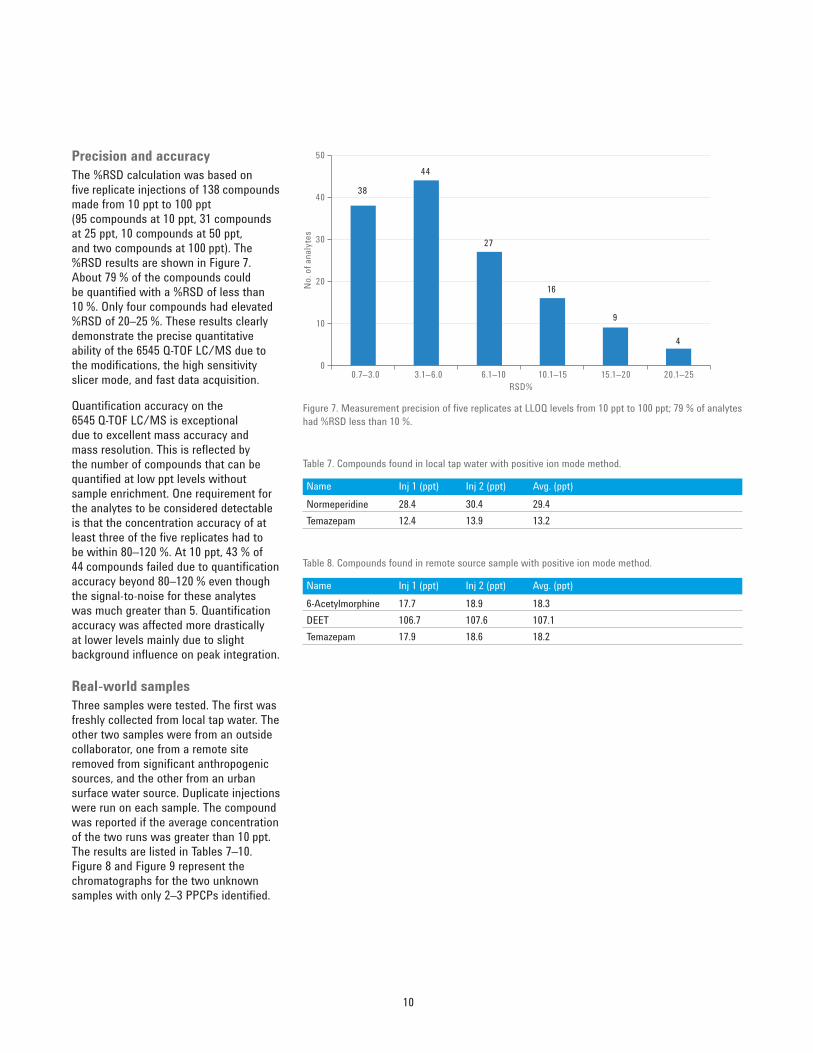
Precision and accuracyThe %RSD calculation was based on five replicate injections of 138 compounds made from 10 ppt to 100 ppt (95 compounds at 10 ppt, 31 compounds at 25 ppt, 10 compounds at 50 ppt, and two compounds at 100 ppt). The %RSD results are shown in Figure 7. About 79 % of the compounds could be quantified with a %RSD of less than 10 %. Only four compounds had elevated %RSD of 20–25 %. These results clearly demonstrate the precise quantitative ability of the 6545 Q-TOF LC/MS due to the modifications, the high sensitivity slicer mode, and fast data acquisition.
Quantification accuracy on the 6545 Q-TOF LC/MS is exceptional due to excellent mass accuracy and mass resolution. This is reflected by the number of compounds that can be quantified at low ppt levels without sample enrichment. One requirement for the analytes to be considered detectable is that the concentration accuracy of at least three of the five replicates had to be within 80–120 %. At 10 ppt, 43 % of 44 compounds failed due to quantification accuracy beyond 80–120 % even though the signal-to-noise for these analytes was much greater than 5. Quantification accuracy was affected more drastically at lower levels mainly due to slight background influence on peak integration.
Real-world samplesThree samples were tested. The first was freshly collected from local tap water. The other two samples were from an outside collaborator, one from a remote site removed from significant anthropogenic sources, and the other from an urban surface water source. Duplicate injections were run on each sample. The compound was reported if the average concentration of the two runs was greater than 10 ppt. The results are listed in Tables 7–10. Figure 8 and Figure 9 represent the chromatographs for the two unknown samples with only 2–3 PPCPs identified.
38
44
27
16
9
4
0
10
20
30
40
50
0.7–3.0 3.1–6.0 6.1–10 10.1–15 15.1–20 20.1–25RSD%
No. o
f ana
lyte
s
Figure 7. Measurement precision of five replicates at LLOQ levels from 10 ppt to 100 ppt; 79 % of analytes had %RSD less than 10 %.
Table 7. Compounds found in local tap water with positive ion mode method.
Name Inj 1 (ppt) Inj 2 (ppt) Avg. (ppt)Normeperidine 28.4 30.4 29.4Temazepam 12.4 13.9 13.2
Table 8. Compounds found in remote source sample with positive ion mode method.
Name Inj 1 (ppt) Inj 2 (ppt) Avg. (ppt)6-Acetylmorphine 17.7 18.9 18.3DEET 106.7 107.6 107.1Temazepam 17.9 18.6 18.2
11
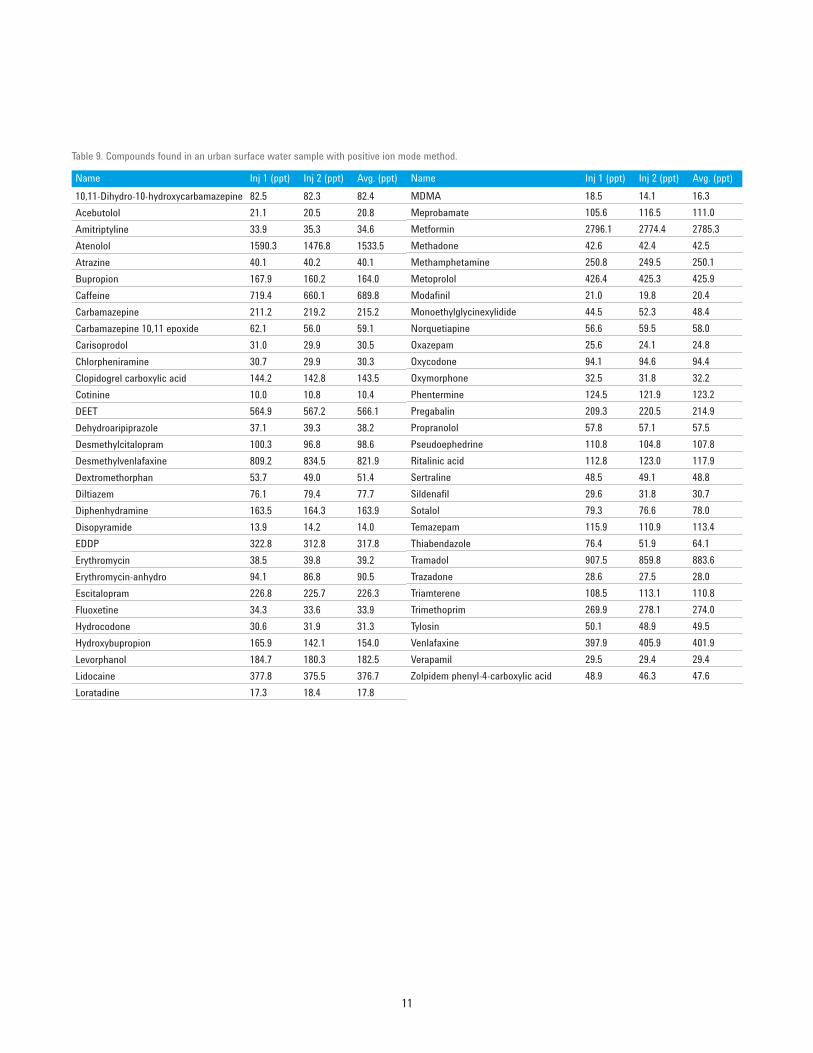
Table 9. Compounds found in an urban surface water sample with positive ion mode method.
Name Inj 1 (ppt) Inj 2 (ppt) Avg. (ppt)10,11-Dihydro-10-hydroxycarbamazepine 82.5 82.3 82.4Acebutolol 21.1 20.5 20.8Amitriptyline 33.9 35.3 34.6Atenolol 1590.3 1476.8 1533.5Atrazine 40.1 40.2 40.1Bupropion 167.9 160.2 164.0Caffeine 719.4 660.1 689.8Carbamazepine 211.2 219.2 215.2Carbamazepine 10,11 epoxide 62.1 56.0 59.1Carisoprodol 31.0 29.9 30.5Chlorpheniramine 30.7 29.9 30.3Clopidogrel carboxylic acid 144.2 142.8 143.5Cotinine 10.0 10.8 10.4DEET 564.9 567.2 566.1Dehydroaripiprazole 37.1 39.3 38.2Desmethylcitalopram 100.3 96.8 98.6Desmethylvenlafaxine 809.2 834.5 821.9Dextromethorphan 53.7 49.0 51.4Diltiazem 76.1 79.4 77.7Diphenhydramine 163.5 164.3 163.9Disopyramide 13.9 14.2 14.0EDDP 322.8 312.8 317.8Erythromycin 38.5 39.8 39.2Erythromycin-anhydro 94.1 86.8 90.5Escitalopram 226.8 225.7 226.3Fluoxetine 34.3 33.6 33.9Hydrocodone 30.6 31.9 31.3Hydroxybupropion 165.9 142.1 154.0Levorphanol 184.7 180.3 182.5Lidocaine 377.8 375.5 376.7Loratadine 17.3 18.4 17.8
Name Inj 1 (ppt) Inj 2 (ppt) Avg. (ppt)MDMA 18.5 14.1 16.3Meprobamate 105.6 116.5 111.0Metformin 2796.1 2774.4 2785.3Methadone 42.6 42.4 42.5Methamphetamine 250.8 249.5 250.1Metoprolol 426.4 425.3 425.9Modafinil 21.0 19.8 20.4Monoethylglycinexylidide 44.5 52.3 48.4Norquetiapine 56.6 59.5 58.0Oxazepam 25.6 24.1 24.8Oxycodone 94.1 94.6 94.4Oxymorphone 32.5 31.8 32.2Phentermine 124.5 121.9 123.2Pregabalin 209.3 220.5 214.9Propranolol 57.8 57.1 57.5Pseudoephedrine 110.8 104.8 107.8Ritalinic acid 112.8 123.0 117.9Sertraline 48.5 49.1 48.8Sildenafil 29.6 31.8 30.7Sotalol 79.3 76.6 78.0Temazepam 115.9 110.9 113.4Thiabendazole 76.4 51.9 64.1Tramadol 907.5 859.8 883.6Trazadone 28.6 27.5 28.0Triamterene 108.5 113.1 110.8Trimethoprim 269.9 278.1 274.0Tylosin 50.1 48.9 49.5Venlafaxine 397.9 405.9 401.9Verapamil 29.5 29.4 29.4Zolpidem phenyl-4-carboxylic acid 48.9 46.3 47.6

12
No compounds were found in the local tap water or the remote source water samples with the negative ion mode method, however, warfarin was detected at borderline in the remote source water sample. The compounds found in the urban surface water sample in negative ion mode are listed in Table 10.
The two surface water samples were also tested on the Agilent 6495 Triple Quadrupole LC/MS8, however, the two studies were separated by several months during which the sample might have degraded. Even so, most compounds detected in both the targeted UHPLC-Triple Quadrupole method and the untargeted UHPLC-Q-TOF method overlapped well in terms of identified compounds and corresponding concentrations. This Application Note clearly demonstrates that the Agilent mass spectrometer portfolio can be used as a complete solution in environmental testing.
ConclusionFast and simple Q-TOF LC/MS methods for the screening of PPCPs in water have been developed. The methods leverage the full advantage of the sensitivity improvement provided by the hardware change of the Agilent 6545 Q-TOF LC/MS System and Swarm autotune on small fragile molecule ion transmission. The sensitivity can be further improved by the selection of the high sensitivity slicer mode. It has been demonstrated that low ppt level LLOQs can be achieved for the quantitation of trace contaminants in water through direct injection. With these design enhancements, tedious sample enrichment and cleanup processes can be avoided. This will increase sample throughput significantly.
Figure 8. Chromatographs of PPCPs found in local tap water with positive ion method.
Normeperidine
4.7 4.8 4.9 5.0 5.1
×104
00.20.40.60.81.01.21.4
*234.1489 Area = 29,012×104
Temazepam
7.0 7.1 7.2 7.3 7.40
0.5
1.0
1.5
2.0
2.5
3.0*301.0738 Area = 64,366
Figure 9. Chromatographs of PPCPs found in remote source sample with positive ion mode method.
6-Acetylmorphine
3.6 3.7 3.8 3.9 4.00
0.250.5
0.751
1.251.5
1.75
328.1543 Area = 36,096×104Temazepam
7.0 7.1 7.2 7.3 7.40
0.5
1
1.5
2
2.5
301.0738 Area = 68,448×104DEET
6.9 7.0 7.1 7.2 7.3
0.250.5
0.751
1.251.5
1.752
192.1390 Area = 495,701×105
Table 10. Compounds found in an urban surface water sample with negative ion mode method.
Name Inj 1 (ppt) Inj 2 (ppt) Avg. (ppt)Celecoxib 40.2 36.6 38.4Chloramphenicol 8.9 11.9 10.4Diclofenac 277.2 235.2 256.2Diclofenac 4-hydroxy 10.0 10.0 10.0Furosemide 309.3 307.9 308.6Gemfibrozil 223.7 225.6 224.7Hydrochlorothiazide 532.7 539.8 536.3Ibuprofen 47.5 46.8 47.2Methylparaben 78.6 83.4 81.0Naproxen 175.4 177.0 176.2n-Butylparaben 10.2 12.5 11.3Phenobarbital 43.3 26.2 34.7Phenytoin 666.4 956.1 811.3Sulfamethoxazole 649.8 599.2 624.5Triclocarban 28.2 25.9 27.0Triclosan 36.4 37.6 37.0

13
6. Yang, D. D.; et al.; Screening and Quantitation of 240 Pesticides in Difficult Food Matrices Using the Agilent 6545 QTOF Mass Spectrometer, Agilent Technologies Application Note, publication number 5991-5485EN.
7. Cullum, N.; Optimizing Detection of Steroids in Wastewater Using the Agilent 6490 Triple Quadrupole LC/MS System with iFunnel Technology, Agilent Technologies Application Note, publication number 5990-9978EN.
8. Yang, D. D.; Murphy, M. A.; Zhang, S.; Highly Sensitive Detection of Pharmaceuticals and Personal Care Products (PPCPs) in Water Using Agilent 6495 Triple Quadrupole Mass Spectrometer, Agilent Technologies Application Note, publication number 5991-5425EN.
AcknowledgementsThe authors would like to thank Craig Marvin for initiating the project and coordinating the efforts.
References1. Boyd, G. R.; et al. Pharmaceuticals
and Personal Care Products (PPCPs) in Surface and Treated Waters of Louisiana, USA and Ontario, Canada, Science of The Total Environment 311(1–3), pp 135-149.
2. Snyder, S.; et al. Pharmaceuticals, Personal Care Products, and Endocrine Disruptors in Water: Implications for the Water Industry, Environmental Engineering Science 2003, 20(5), pp 449-469.
3. EPA Method 1694, Pharmaceuticals and Personal Care Products in Water, Soil, Sediment, and Biosolids by HPLC/MS/MS, 2007, EPA-821-R-08-002.
4. European Water Framework Directive 2000/60/EC; European Groundwater Directive 2006/118/EC.
5. Ferra, I.; Thurman, E. M.; Zweigenbaum, J.; Ultrasensitive EPA Method 1694 with Agilent 6460 LC/MS/MS with Jet Stream Technology for Pharmaceutical and Personal Care Products in Water, Agilent Technologies Application Note, publication number 5990-4605EN.

www.agilent.com/chem
This information is subject to change without notice.
© Agilent Technologies, Inc., 2015 Published in the USA, June 29, 2015 5991-5954EN