Embed Size (px)
Citation preview

MCGILL UNIVERISTY – DEPARTMENT OF BIORESOURCE ENGINEERING
SENIOR DESIGN BREE 495 – FINAL REPORT
NATURAL VENTILATED AUGMENT COOLING GREENHOUSE
POLINA FATEEVA (260352364) LUCAS MCCARTNEY (260376494)
PRESENTED TO PROFESSOR GRANT CLARK
APRIL 19 2013

2012
2
Table of Contents
1. List of figures ............................................................................................................................. 3
2. List of tables ............................................................................................................................... 3
3. Acknowledgments ..................................................................................................................... 3
4. Executive summary ................................................................................................................... 4
5. Introduction .............................................................................................................................. 4
6. Evaluation and comparison of possible solutions ...................................................................... 7
6.1 Natural ventilation ................................................................................................................................................................... 7
6.2 Evaporative cooling .................................................................................................................................................... 7
6.2.1 Fan/Pad System ...................................................................................................................................................... 7
6.2.2 Fog/Mist System ..................................................................................................................................................... 7
6.2.3 Roof evaporative cooling ..................................................................................................................................... 7
7. Experimental Section ................................................................................................................ 8
7.1 AutoCAD Design ............................................................................................................................................................................ 8
7.2 Prototype I ....................................................................................................................................................................................... 8
7.3 Re-‐designing prototype II ....................................................................................................................................................... 10
8. Data Collection and testing ...................................................................................................... 12
9. Results and Discussion ............................................................................................................ 12
9.1 Results from Prototype 1 .......................................................................................................................................................... 12
9.2 Approach for Prototype 2 ......................................................................................................................................................... 15
10. Efficiency and economics ........................................................................................................ 16
10.1 Efficiency ...................................................................................................................................................................................... 16
10.2 Economics and Cost Analysis .............................................................................................................................................. 18
11. Conclusion .............................................................................................................................. 18
12. References .............................................................................................................................. 20
13. Appendices ............................................................................................................................. 21

2012
3 1. LIST OF FIGURES
Figure 1 Condensation in the greenhouse side space and misting system location (red indicator)
Figure 2 Side view of roof arrangement
Figure 3 General design for prototype 1
Figure 4 NVAC Greenhouse Prototype 1, summer 2012
Figure 5 General design for prototype 2
Figure 6 Side View of Prototype 2
Figure 7 Possible convective movement of air in 1,2 and 3 and humidity transfer between air masses
in the side space in 4.
2. LIST OF TABLES
Table 1 Greenhouse temperature differences, relative humidity and solar radiation on days without
misting system running
Table 2 Greenhouse temperature differences, relative humidity and solar radiation on days with the
misting system running
Table 3 Lengths of Various Materials Table 4 Cost Breakdown 3. ACKNOWLEDGEMENTS
Dr Mark Lefsrud for initiating and supervising the project. Dr Grant Clark for guiding us through the design cycle of the project Mr Sadman Islam for helping with construction and data collection Mr Arkadz Fatseyeu for help with construction Mr Mike Bleho, manager of the horticultural center, for a summer of honest help whenever we needed it and great moral support

2012
4 The International Development Research Center of Canada (IDRC) for funding The University of West Indies (UWI) at St. Augustine The essence of this greenhouse design project is to contribute and respond to an agricultural and environment program initiated by the IDRC at UWI. 4. EXECUTIVE SUMMARY
Greenhouses create optimal climate conditions for crop growth, and protect crops from outside
pests. To achieve good indoor crop production climate, traditional tropical greenhouse designs
utilize a standard fan ventilation system to decrease temperature. The issue remains that such fans
are energy intensive and are prone to failure when faced with tropical storms. The proposed
solution is a natural ventilation augmented cooling greenhouse, or NVAC greenhouse. A NVAC
greenhouse comprises arched, open-‐roof airflow improved by coupling natural ventilation with
controlled aeration using a water misting system. The misting system running along the ridge,
where the uprising warm air meets the incoming fresh air, floods the air mass with a fine mist
causing the cooled air mass to flow down the side and collapse into the lower space of the
greenhouse. No other mechanisms are involved. Temperature, relative humidity and solar radiation
sensors, placed in key areas throughout a NVAC greenhouse prototype, provided data to detect air
movement and cooling. Overall, from 2.3°C to 7.0°C of cooling was observed at the time of highest
solar radiation (11:00am-‐3:00pm) on the warmest (>30°C) and most humid days of 2012 at the
Macdonald Campus of McGill University in Montreal. Such results were obtained by comparing
outside temperatures to inside temperatures with the misting system functional. Two design
configurations of the same greenhouse were considered: open roof and open roof with misting
system running. Maximum cooling was observed on the warmest days with the misting system
operational. This design is economically and environmentally viable as it reduces energy costs,
general pesticide use, and provides optimal growing conditions.
5. INTRODUCTION
Crop production in greenhouses is a growing industry, especially in mild climates, and is very
important for local populations as a source of income and fresh food [1]. Moreover, greenhouses
provide the possibility of integrated production and protection (IPP) [1], which focuses on the
importance of finding alternative solutions to improve yield and quality in crop production. Von

2012
5 Elsner has proposed that optimization of a greenhouse design with respect to local climatic and
economic conditions still remains a challenge [2]. Challenges with growing crops in tropical regions
such as Trinidad include dramatic heat, high humidity, and high precipitation. Due to sensitivity of
germination and sprout growth, these undesirable environmental characteristics make agricultural
production difficult, expensive, and energy consuming. Thus utilization of greenhouses is beneficial
in specific control of microclimates, to provide optimal growing conditions and increase crop yield.
Controlling ventilation allows for temperature control, prevention of plant pathogens, and fresh air
for photosynthesis and respiration. Having control of the growing environment in an enclosed
structure reduces need for chemicals and pesticides used in pest control. Yield potential reduces at
temperatures above 26.0°C, with fruit set being one of the first processes that is negatively
influenced by supra-‐optimal temperatures (32.0°C/26.0°C day/night) [3] [11]. A detailed review
presented by Kumar et al. indicates that existing cooling technologies are not enough and widely
accepted to cater the needs of greenhouse grower and that there seems to be a necessity to develop
cheap and effective technology suitable to local climatic conditions to boost up the greenhouse
industry [5]. Traditional cooling alternatives for greenhouses depend upon exhaust fans to remove
excess energy to decrease inside temperature [9]. Shen and Yu reported that the best cooling
method for greenhouses in tropical region is ventilation with fans and using roof covering materials
having near infrared reflection [7]. Detrimental effects from intense, tropical storms are reduced by
implementing greenhouses and providing safer growing conditions for seedlings. Greenhouses in
the Caribbean focus on temperature reduction rather than Canadian greenhouses which must
consider cooling effects in the summer and heating systems in the winter. Many existing designs include an opening in the roof for further air circulation, facilitated by
convection. When convection alone is not sufficient, mechanical fans are utilized to force the air
circulation and provide climate control within the greenhouse. However, these designs face many
impairing issues. First off, using fans for ventilation is very energy intensive. Secondly, fans are
placed on the sides of the structure, and occasionally along the opening of the roof, causing them to
be subjected to damaging tropical storms.
Natural ventilation is the direct result of pressure differences created and maintained by wind or
temperature gradients. It requires less energy and equipment and is the cheapest method of cooling
a greenhouse. The present paper brings forth a natural ventilation process enhanced with an
alternate version of a fog or mist cooling system. In previous studies, Montero et al. used an air

2012
6 water fogging system to cool a greenhouse with shade screen of 45% perforations. It was reported
that maximum temperature reduction during sunny days was 5.0°C. Arbel et al. tested the efficiency
of the fog system with a droplet size of 2–60 micrometers in a 16 m by 24 m greenhouse under
rather hot but dry climatic conditions. The results were compared with fan and evaporative pad
system. They concluded that performance of fog system was better than fan-‐pad system as
temperature and relative humidity variations were <5°C and 20%, respectively [8]. A study by Rault
considers the most commonly used cooling technologies as unsatisfactory for application in the
humid tropics [6].
With this in mind, considering the very high relative humidity in tropical climates, a standard fog or
mist system would simply drench the air mass and plants with water. As seen in figure 1, the side
space suggested is designed to channel the humidified air, drive it down to collapse into the lower
area and collect any condensation. This prevents any extra, unneeded humidity from reaching the
crop area and allows for the possibility of harvesting and reuse of the condensed water. The misting
system location is indicated with a red dot.
Figure 1 – Condensation in the greenhouse side space and misting system location (red indicator)
2012
7 6. EVALUATION AND COMPARISON OF POSSIBLE SOLUTIONS
6.1 Natural Ventilation
Natural ventilation arises from pressure difference created by temperature and wind changes
within the greenhouse structure. The necessity for wind gradients implies that all greenhouse
designs utilize insect screening to allow airflow. Natural ventilation is the most cost effective
method of cooling, and is profoundly reliant on evapotranspiration from the crop. A study by Tietel
et al. found that the ventilation rate increased linearly with wind speed [10]. However, The direction
of wind entering the structure, strongly affected the rate of ventilation, airflow, and crop
temperature circulation. This causes inconsistent airflow, and thus is not an ideal solution on its
own.
6.2 Evaporative Cooling
Evaporative cooling is the most proficient method of cooling while also maintaining control of the
humidity within a greenhouse. However, this process is unsuitable for our design due to the high
humidity levels within the Caribbean.
6.2.1 Fan-pad system
This technique utilizes a negative pressure fan and pad system to prompt airflow. This idea is also
disregarded due to high-‐energy consumption, and damage caused to such machines in detrimental
tropical storms as the Caribbean region often encounters.
6.2.2 Fog/mist system
This process entails spraying water droplets using high pressure nozzles. As the droplets evaporate,
air temperature is reduced. However, this method alone, without consideration to structural design
often prompts water collection in stagnant air, especially for tropical regions with high humidity.
6.2.3 Roof Evaporative cooling
Roof evaporative cooling is the method of placing a thin layer of water atop the surface of the
structure to create evaporation. However, due to the high humidity of our chosen environment,

2012
8 evaporation rate for this mode of cooling will not be fast enough to suffice significant temperature
decrease within the greenhouse.
7. EXPERIMENTAL SECTON 7.1 AutoCAD design
A three dimensional AutoCAD model was prepared to provide computer generated images and
dimensions of the three-‐roofed design, in preparation for prototype construction. The radii of
curvature of the roofs were chosen as such to facilitate convective air movement as seen in Figures
2 and 3.
Special attention to roof structural
support was needed to account for the
alternate roof design. Main vertical
columns are used, as they are used in
standard greenhouses, except they branch
off to suitably support the three unusually
angled roofs, as seen in figure 4.
7.2 Prototype I
Prototype construction began in spring
2012. A10 feet by 20 feet downsized
version prototype greenhouse
was built to attempt to
investigate the air movement
and cooling effect first hand. ¾
inch (19 mm) white PVC piping
was used as structural
components. High load bearing
PVC segments were reinforced
with rod-‐iron segments inserted
into the hollow pipes. Additional
support within the arched roofs
Figure 3 General design for prototype 1
Roof 3
Roof 2
Roof 1
Figure 2 Side view of roof arrangement

2012
9 was provided by inserting flexible bamboo sticks within the PVC piping. Intersecting PVC pipes
were joined using standard corner, t-‐sections and 4-‐way sections. Solvent PVC cement was used for
fastening. 4 vertical supports were used for roof support. 4” by 4” ground-‐anchored wood posts
were used for the structure’s front and back walls and 2 ¾ inch (70 mm) steel pipes were used in
between for inside roof support and to prevent sagging. Steel square-‐angled flanges branched off
from the wood posts to provide support to the roofs and hose-‐clamps were used to attach the roofs
to the steel pipes within. Proper roof curvature was attained by tightening rope from roof edge to
roof base. This allowed the PVC pipes to be bent to the required radii and the rope ensured the
pipes held their shape. This however produced immense stress in the joining components and
caused occasional cracking and failure of the joints when subjected to windy conditions. Regular
maintenance involved repairing or replacing the joining components. The open sidewalls of the
greenhouse were covered in a mesh to keep rodents and insects out. The rest of the area was
covered with a standard polyethylene, clamped to the PVC tubing with plastic snap-‐clamps.
Obviously, wind was a significant issue when ensuring structural stability. Hence, the base PVC
segments running along the ground were anchored down using bent rod-‐iron sections pushed into
the ground and each wooden post remained secured with post anchors. Figure 4 shows an image of
the actual first prototype.
Figure 4 NVAC Greenhouse Prototype 1 Summer 2012

2012
10 The opening of the third roof was designed to be adjustable in the case of changing airflow and to
close during unfavorable weather conditions. Therefore it was built in a flexible fashion by attaching
its upper edges to the wood posts using cable which was fed through a round hook screw located at
the top of each wooden post. This cable could be pulled or loosened as one would a flagpole to alter
the angle of the roof. The inside structural steel pipes could be extended accordingly. Throughout
the greenhouse, cord lengths were used to fasten the roofs to the rod-‐iron anchors to stabilize and
solidify in the event of strong winds. The side cables could also be fastened to prevent the roof from
opening.
The misting system was a professional outdoor cooling 3/8 inch (9.5 mm) pipe misting system from
Orbit® Irrigation Products Inc. The piping was installed along the edge of the second roof using
hose clamps. Brass Slip Lok Tees were the nozzle type used. The nozzles were positioned uniformly
to spray water down the side space. 8 nozzles were installed at a 2-‐½ feet (0.762 m) interval. Each
nozzle is designed to use 1.89 liters per hour. Standard line pressure was utilized.
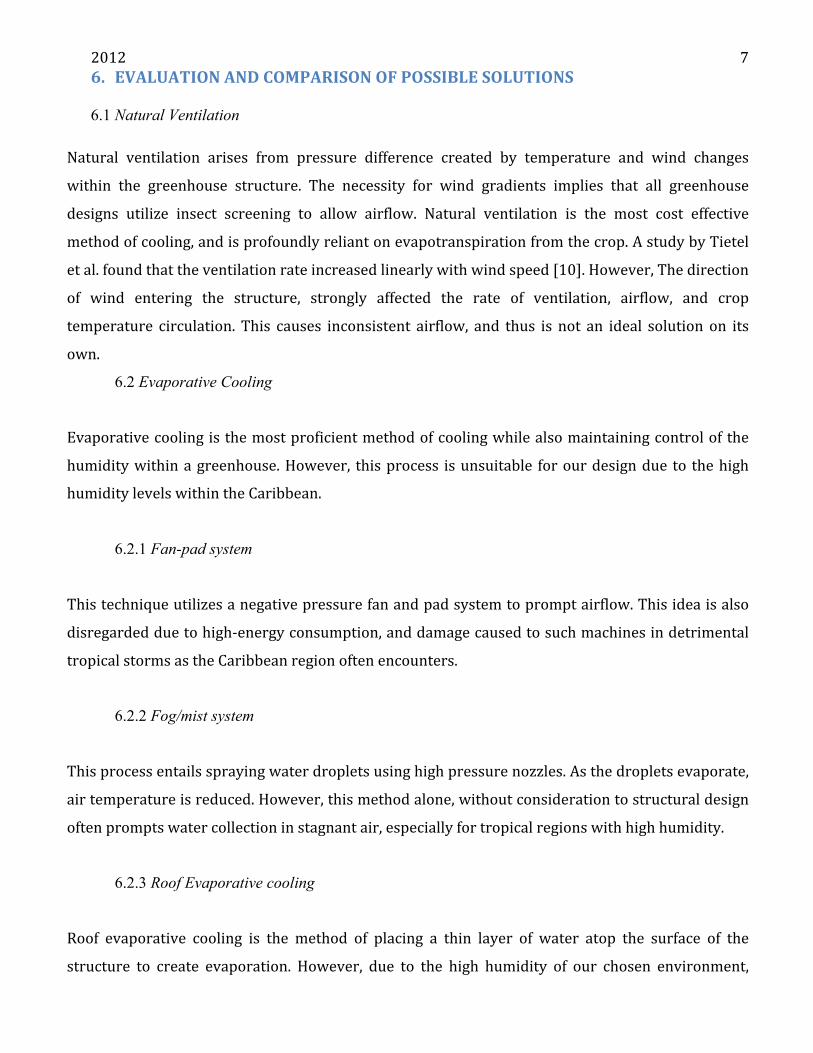
7.3 Re-‐designing prototype II
The same misting system and overall design in maintained in the redesigning for the second
prototype. The key difference is the enlargement of the left hand side space. See Figure 5 and 6 for
illustrations and dimensioning of this. This space is what can be called the active portion of the
greenhouse, where the driving force of the ventilation happens and has been increased to be two-‐
thirds the length of the side of the greenhouse, while the right hand side is minimized to one-‐third of
the side length. This expansion of the side space is to avoid stagnant air on the right hand side of the
greenhouse, as seen in the first prototype. Moreover, the second prototype is designed to be half
scale; twice the size of the first prototype. The second prototype is meant to be pseudo-‐permanent,
and will be comprised of hardier materials such as EMT conduit piping. We will lay a concrete
foundation with Sonotubes two feet beneath the ground for structural stability. The top and middle
roof will be primarily conduit piping, bent using a wooden jig, with some PVC sections to fill gaps
between EMT conduit segments. The lowest roof will be made completely of PVC piping because it is
not exposed to harsh environmental conditions, and this material is cost-‐effective.
2012
11
Figure 5 General design for prototype 2
Figure 6 Side View of Prototype 2
2012
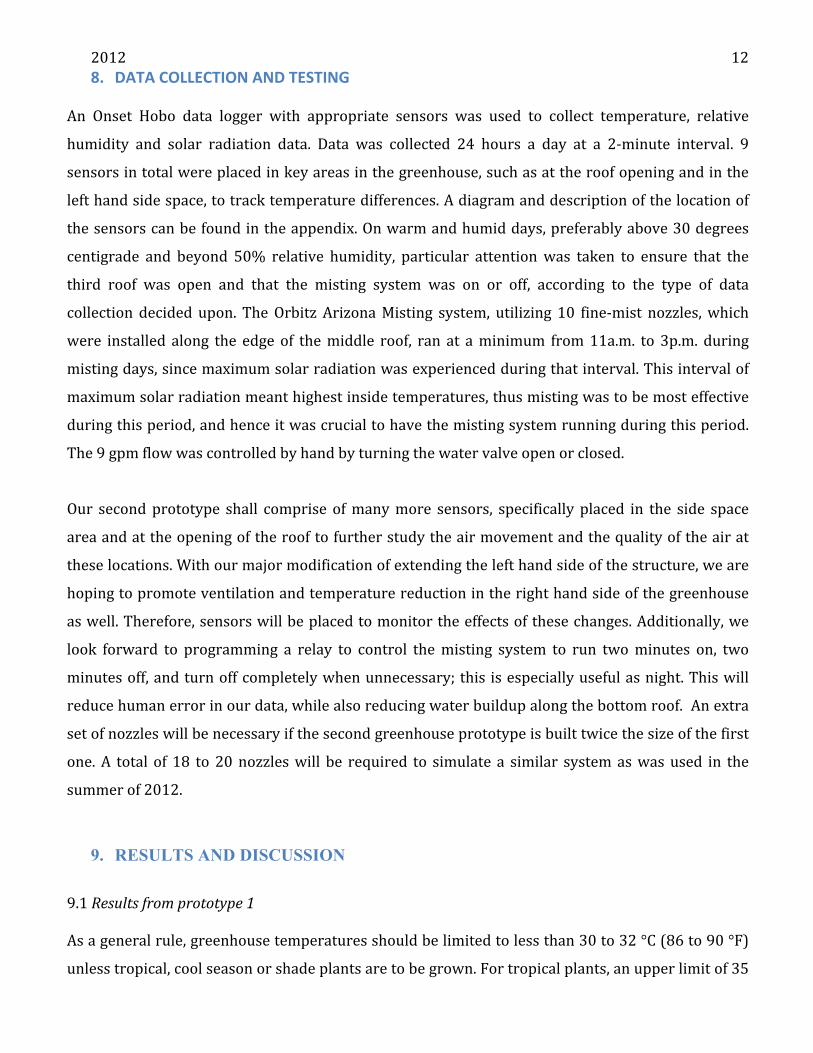
12 8. DATA COLLECTION AND TESTING
An Onset Hobo data logger with appropriate sensors was used to collect temperature, relative
humidity and solar radiation data. Data was collected 24 hours a day at a 2-‐minute interval. 9
sensors in total were placed in key areas in the greenhouse, such as at the roof opening and in the
left hand side space, to track temperature differences. A diagram and description of the location of
the sensors can be found in the appendix. On warm and humid days, preferably above 30 degrees
centigrade and beyond 50% relative humidity, particular attention was taken to ensure that the
third roof was open and that the misting system was on or off, according to the type of data
collection decided upon. The Orbitz Arizona Misting system, utilizing 10 fine-‐mist nozzles, which
were installed along the edge of the middle roof, ran at a minimum from 11a.m. to 3p.m. during
misting days, since maximum solar radiation was experienced during that interval. This interval of
maximum solar radiation meant highest inside temperatures, thus misting was to be most effective
during this period, and hence it was crucial to have the misting system running during this period.
The 9 gpm flow was controlled by hand by turning the water valve open or closed.
Our second prototype shall comprise of many more sensors, specifically placed in the side space
area and at the opening of the roof to further study the air movement and the quality of the air at
these locations. With our major modification of extending the left hand side of the structure, we are
hoping to promote ventilation and temperature reduction in the right hand side of the greenhouse
as well. Therefore, sensors will be placed to monitor the effects of these changes. Additionally, we
look forward to programming a relay to control the misting system to run two minutes on, two
minutes off, and turn off completely when unnecessary; this is especially useful as night. This will
reduce human error in our data, while also reducing water buildup along the bottom roof. An extra
set of nozzles will be necessary if the second greenhouse prototype is built twice the size of the first
one. A total of 18 to 20 nozzles will be required to simulate a similar system as was used in the
summer of 2012.
9. RESULTS AND DISCUSSION
9.1 Results from prototype 1 As a general rule, greenhouse temperatures should be limited to less than 30 to 32 °C (86 to 90 °F)
unless tropical, cool season or shade plants are to be grown. For tropical plants, an upper limit of 35

2012
13 °C (95 °F) should be considered from the standpoint of worker comfort and safety [9]. All inside
temperature sensors in the study of the first prototype were compared to the outside temperature
sensor (control) to show temperature differentials.
Table 1 Greenhouse temperature differences, relative humidity and solar radiation on days without misting
system running
Trial Days No Misting Summer 2012 Data taken 11:00am-3:00pm
1 (Aug 8) 2 (Aug 9) 3 (Sept 13)
Sensor ID
Average ΔT S.D. Average ΔT S.D. Average ΔT S.D.
(2-1) 5.37 0.67 5.71 2.45 2.36 0.63 (3-1) -1.26 0.61 -1.25 1.20 1.02 0.48 (4-1) 1.39 1.26 2.34 2.02 0.91 0.51 (5-1) 0.98 0.92 1.18 1.06 0.82 0.99 (6-1) 3.15 0.54 5.32 2.44 1.09 0.84 (7-1) 2.34 0.58 2.82 1.48 1.75 1.03 (8-1) 5.75 0.89 5.80 2.85 3.17 0.81 (9-1) 0.37 0.90 2.59 1.53 1.37 0.79
Relative
Humidity
Avg% S.D. Avg% S.D. Avg% S.D.
RH 1 out 44.20 6.78 42.04 5.33 37.38 3.62 RH 2 inside 40.38 6.16 36.07 6.21 43.89 3.06 RH 3 up 46.93 7.43 46.03 7.03 41.81 3.11 Solar Radiation1
Avg PAR uE S.D. Avg PAR uE S.D. Avg PAR uE S.D.
S1 1442.05 193.10 1258.89 397.36 1032.58 196.24 S2 1441.51 168.35 1242.58 391.03 1151.59 99.43 1 Measured in PAR uE. PAR: Photosythetically Active Radiation
Table 2 Greenhouse temperature differences, relative humidity and solar radiation on days with the misting
system running
Trial Days With Misting Summer 2012

2012
14 Data taken 11:00am-3:00pm
1 (Aug 24) 2 (Aug 28) 3 (Sept 6)
Sensor ID
Average ΔT S.D. Average ΔT
S.D. Average ΔT S.D.
(2-1) 3.46 0.75 1.15 0.59 1.73 0.74 (3-1) -2.32 1.10 -7.00 2.03 -0.43 0.84 (4-1) -3.27 1.43 1.21 1.03 0.57 1.59 (5-1) -2.98 1.17 -0.95 0.48 0.33 1.11 (6-1) 0.57 0.68 -0.44 0.54 1.50 1.25 (7-1) 1.48 0.64 -0.16 0.43 0.81 0.69 (8-1) 2.01 0.87 0.62 0.76 1.44 0.99 (9-1) -2.86 1.04 0.54 0.97 0.09 0.87
Relative
Humidity
Avg% S.D. Avg% S.D. Avg% S.D.
RH 1 out 53.70 4.11 43.70 7.49 58.99 4.55 RH 2 inside 40.16 2.18 44.04 4.64 55.06 3.41 RH 3 top 47.90 3.45 82.23 6.88 62.78 6.24
Solar
Radiation1
Avg PAR uE
S.D. Avg PAR
uE S.D.
Avg PAR uE
S.D.
S1 1198.00 98.76 1250.93 389.41 1102.36 293.53 S2 1220.31 112.97 1244.80 394.31 1092.63 301.42 1 Measured in PAR uE. PAR: Photosythetically Active Radiation
With the third roof open, but no misting system running, little temperature decrease is noticed
within the structure, as seen in table 1. The average temperatures between 11a.m. and 3p.m. on the
studied days of August 8, 9 and September 13 were 31.7°C, 30.1°C and 30.4°C respectively. As
expected, the temperature within the greenhouse was greater than outside temperature. An average
temperature difference did show a decrease as much as 1.2 °C at the opening of the top roof. This
implies that there was light air movement, possibly being fresh air entering the structure at this
point by means of wind. Below this opening (at sensors 5 and 9), although the temperature is higher
than the control, the average difference is less than 1.2°C. This prompts an assumption that once the
air enters the greenhouse, it falls along the left hand side. All other sensors read a noticeable
increase of temperature within the structure, especially sensor 8 on the right hand side, where there
may be stagnant air. Over 5.0°C increase of temperature was recorded on two of the test days. Such

2012
15 sensor data supports the fact that the natural ventilation augment cooling greenhouse does not
function appropriately nor to its full potential without the misting system in operation, however the
arched roof design does provide a little air movement.
As seen in table 2, once the misting system is operational, a more significant temperature decrease
is noticed between sensors. The average temperatures between 11a.m. and 3p.m. on the studied
days of August 24, 28 and September 6 were 30.8°C, 28.5°C and 30.8°C, respectively. The average
temperature decrease at the opening of the third roof was between 2.3°C and 7.0°C, showing a
heavy air pull at the said opening. The temperature differences at the base of the airflow space
(sensor 5 and sensor 9) was on average between -‐3.0 and 0.3 °C, and -‐2.9°C and 0.7°C, respectively.
The greater temperature differentials being noticed on the warmer day, implying that the warmer
the conditions, the more effective the system is at cooling. The temperature readings at sensors 6
and 7, just below the middle roof and at the base of of the bottom roof, were very similar to the
outside. Both show an average range in temperature differences of -‐0.4 to 1.5°C and -‐0.2 to 1.5°C;
exposing a less significant, but noticeable cooling effect. This shows air movement in the structure
along the right hand side of the structure, in addition to the left hand side. Just above the base of
roof 1, sensor 9 also shows minor air movement. The temperature decreased by as much as 2.9°C,
when compared to the control. The average temperature difference at sensor 8 is not significant and
could once again further imply stagnant air at the lower right hand side of the greenhouse.
9.2 Approach for Prototype 2
Upon analysis of the relative humidity data taken both on misting and non-‐misting days, some data
suggests that this NVAC method reduces the relative humidity of the cool falling air in the side-‐
space, therefore counterintuitively reducing the overall relative humidity in the greenhouse. For
instance, 50.70% RH was measured outside, compared to 40.16% RH inside and 47.90% RH at the
top roof opening on August 24. This demonstrates how there may be a humidity exchange occurring
between 2 masses of air in the side space; this phenomenon is explained in section 9.2 Approach for
Prototype II.. The misting of the warm air causes some of the newly humid air to actually further
rise in the side space, as opposed to immediately falling. This forces humid air to mix with the warm
rising air from the greenhouse room, and allows it to escape from the top roof opening, as can be
suggested in the data with the 47.90% RH measured. On the other hand, some dense cool air
resulting from the misting will fall down the curvature of the first roof and collapse in the

2012
16 greenhouse main area, while dumping humidity along the way into the mass of warmer air rising
above it. Figure 7 shows a schematic of this proposed process. This method of misting becomes a
mild conditioning system of some sort, given that it reduces air temperature and keeps the relative
humidity of the greenhouse air at par with the outside RH, or in some cases even lowers the RH.
Although still an observation, further testing with sensors on the second prototype shall be done
and more data will be taken in order to further understand the process and pinpoint the quality of
the air in the side space and in the greenhouse main area.
Figure 7 Possible convective movement of air in 1,2 and 3 and humidity transfer between air masses in the side space in 4.
1
2
3
4

2012
17 10. EFFICIENCY AND ECONOMICS
10.1 Efficiency
The second NVAC greenhouse prototype to be built is to have the dimensions of 9.0m wide, 12.1m
long and a maximum of 5.5m in height, considering the top roof. According to standard greenhouse
design with fans, an air exchange of 20 000 cubic feet per minute is necessary to ensure optimal
plant growth (see calculations below). With this air exchange in mind, a certain set of fans is
required. 4 variable speed louvered exhaust 24in diameter fans with a capacity of 6487-‐2400 (at
maximum and minimum capacity respectively) cubic feet per minute each are required to guarantee
an air exchange of 20 000 cubic feet per minute (AFC Greenhouses).
• Each fan of this size costs roughly $299.00
• Aluminum frame
• 0.5HP each, 110V and 4.8 amps
• Conversion of 1 horsepower = 745.699872 watts
• Consumption per fan per year:
𝐵𝑜𝑡𝑡𝑜𝑚 𝑣𝑜𝑙𝑢𝑚𝑒: 8𝑚 × 12.1𝑚 × 4.3𝑚 = 416.24 𝑚!
𝑇𝑜𝑝 𝑣𝑜𝑙𝑢𝑚𝑒: 𝜋 2.6 !
2 × 12.1 = 128.48 𝑚!
𝑇𝑜𝑡𝑎𝑙 𝑣𝑜𝑙𝑢𝑚𝑒: 416.24𝑚! + 128.48𝑚! = 544.72 𝑚!
For the purpose of this calculation, this value of 544.72m3 per second will be converted and
rounded to 20 000 cubic feet per minute.
𝑬𝒒.𝟏
𝑘𝑊 𝑐𝑜𝑛𝑠𝑢𝑚𝑒𝑑 =0.746 × 𝑟𝑎𝑡𝑒𝑑 𝐻𝑃
𝑒𝑓𝑓 (%)
𝑘𝑊 𝑐𝑜𝑛𝑠𝑢𝑚𝑒𝑑 =0.746 × 𝑟𝑎𝑡𝑒𝑑 𝐻𝑃
𝑒𝑓𝑓 (%) = 0.746 × 0.5
0.96 = 0.3885
𝑬𝒒.𝟐
𝑘𝑊ℎ = 𝑘𝑊 × ℎ𝑜𝑢𝑟𝑠/𝑑𝑎𝑦 𝑢𝑠𝑒𝑑 × 𝑑𝑎𝑦𝑠/𝑦𝑒𝑎𝑟 𝑢𝑠𝑒𝑑

2012
18
𝑘𝑊ℎ = 0.3885 × 6 ℎ𝑜𝑢𝑟𝑠𝑑𝑎𝑦 × 365
𝑑𝑎𝑦𝑠𝑦𝑒𝑎𝑟 = 850.8 𝑘𝑊ℎ 𝑝𝑒𝑟 𝑦𝑒𝑎𝑟
850.8 𝑘𝑊ℎ =3600𝐽𝑊ℎ × 1000 × 850.8 𝑘𝑊ℎ = 3𝑀𝐽 𝑝𝑒𝑟 𝑦𝑒𝑎𝑟
3𝑀𝐽 𝑝𝑒𝑟 𝑦𝑒𝑎𝑟 × 4 𝑓𝑎𝑛𝑠 = 12𝑀𝐽 𝑒𝑛𝑒𝑟𝑔𝑦 𝑝𝑒𝑟 𝑦𝑒𝑎𝑟 𝑡𝑜 𝑟𝑢𝑛 4 𝑓𝑎𝑛𝑠
The misting system pump uses a small electrical motor, rated at 87.6 kWh per year, comparable to a
40Watt light bulb.
87.6 𝑘𝑊ℎ =3600𝐽𝑊ℎ × 1000 × 87.6 𝑘𝑊ℎ = 315.4𝑘𝐽 𝑝𝑒𝑟 𝑦𝑒𝑎𝑟
3𝑀𝐽 𝑝𝑒𝑟 𝑦𝑒𝑎𝑟
315.4𝑘𝐽 𝑝𝑒𝑟 𝑦𝑒𝑎𝑟 × 100 = 951% 𝑑𝑖𝑓𝑓𝑒𝑟𝑒𝑛𝑐𝑒 𝑖𝑛 𝑒𝑛𝑒𝑟𝑔𝑦 𝑐𝑜𝑛𝑠𝑢𝑚𝑝𝑡𝑖𝑜𝑛 𝑜𝑣𝑒𝑟 𝑎 𝑝𝑒𝑟𝑖𝑜𝑑 𝑜𝑓 1 𝑦𝑒𝑎𝑟
As mentioned, our second prototype will include a relay system that will be able to control the rate
of the misting system. The second prototype with a relay system will allow us to test the
effectiveness of the system with intermittent misting. Moreover, if the relay system is connected to a
HOBO weather station, if the weather conditions are cooler or simply unsuitable for the misting
system, the system can be autonomously shut off.
10.2 Economics and Cost Analysis
A total of $8500.00 CAN is a cost estimate for materials to build this second prototype. Because this
second prototype is to be built in Trinidad, at he UWI Campus, a cost estimate was done for the
entire project, assuming Polina Fateeva and Lucas McCartney, with the help of Dr. Mark Lefsrud, will
be constructing. The total cost, including materials, transport, stay and labor is shy of $30 000.00
CAN. Refer to appendix 4 for total and detailed cost breakdown. A Gantt chart for the schedule of
construction is provided in appendix 3. Construction is to start in May 2013.
11. CONCLUSION An alternate arched roof design promoting natural ventilation coupled with misting augment
cooling system provides a cooling effect. The average temperature decrease at the opening of the

2012
19 third roof at sensor 3 was between 2.3°C and 7.0°C on trial days with the misting system running.
Cooling was barely noticeable or non-‐existent on days with the misting system not functional. More
data must be collected to study the air movement and cooling effect of the NVAC greenhouse. The
prototype will be built again for the 2013 summer months. Following this current study,
improvements in design and testing are to be considered. A more solid structure needs to be built to
ensure the prototype survives strong winds and more sensors need to be placed in the side space
area to further explain the air movement and humidity effects in the structure. If optimized, this
design will be vastly beneficial for agricultural production in tropical regions.
We were very blessed and lucky to be able to successfully present our design at the 2013 Quebec
Engineering Competition on Chicoutimi and at the 2013 Canadian Engineering Competition in
Ottawa. The project earned 2nd place in Innovative Design at the QEC and earned a special mention
award for Environmental Awareness. The project has been accepted by the Forces Avenir Award
and will be presented at the McGill internal Forces Avenir competition on the 24th of April 2013.
Lastly, we will be presenting the project at the 2013 ASABE International Meeting, in Kansas City
Missouri, on July 24th, 2013.

2012
20
12. REFERENCES
1. Zabeltitz, C. Von. (2011). Integrated Greenhouse Systems for Mild Climates. Integrated
Greenhouse Systems for Mild Climates Climate Conditions, Design, Construction, Maintenance, Climate Control. Wedemark, Germany : Springer-‐Verlag.
2. B. von Elsner, D. B.-‐C. (2000). Review of structural and functional characteristics of
greenhouses in European union countries, part II: typical designs. Journal of Agricultural Engineering Research , 75 (2), 111–126.
3. Heuvelink, E. B. (2008). Climate and yield in a closed greenhouse. Acta Horticulturae , 801,
1083–1092. 4. J.I. Montero, A. A. (1994). Cooling of greenhouse with compressed air fogging nozzles. Acta
Horticulturae (281), 199–209. 5. K.S. Kumar, K. T. (2009). Design and technology for greenhouse cooling in tropical and
subtropical regions: A review. Energy and Buildings (41), 1269–1275. 6. Rault, P. (1990). A Tunnel Greenhouse Adapted to the Tropical Low Land Climate. Institut de
Recherche Agronomiques tropicales IRAT/CIRAD . 7. Y. Shen, S. Y. (2002). Cooling methods for greenhouse in tropical region. Acta Horticulturae
(578), 242–245. 8. A. Arbel, O. Y. (1999). Performance of a fog system for cooling greenhouses. Journal of
Agricultural Engineering Research , 2 (72), 129–136. 9. ASABE. (2003). Heating, Ventilating and Cooling Greenhouses. 10. M. Teitel, O. Liran, J. Tanny, M. Barak (2008). Wind driven ventilation of a mono-‐span
greenhouse with a rose crop and continuous screened side vents and its effect on flow patterns and microclimate. Biosystems Engineering. 101 (1), 111-‐122.
11. Sato, S., Kamiyama, M., Iwata, T., Makita, N., Furukawa, H., & Ikeda, H. (2006). Moderate
Increase of Mean Daily Temperature Adversely Affects Fruit Set of Lycopersicon esculentum by Disrupting Specific Physiological Processes in Male Reproductive Development. Annals of Botany , 97:, 731–738.

2012
21
13. APPENDICES
APPENDIX 1. DESCRIPTION OF SENSOR PLACEMENT
1. Outside temperature sensor (serial 9701946). 1m off the ground. 5m away from corner of greenhouse.
2. Main room temperature sensor 1, (serial 9952171). 1.6m off the ground. Left-‐hand side with respect to the center point of greenhouse.
3. Top roof air inflow area temperature sensor. Highest placed sensor (serial 9701949). Placed at the edge entrance of the inflow of air.
4. Upper air-‐flow space temperature sensor (serial 9952175). Top part of the area between roof 1 and roof 3.
5. Lower air-‐flow space temperature sensor 1, (serial 9952170). Lower part of the area between roof 1 and 3.
6. Mid-‐roof temperature sensor (serial 9952176). Placed on the ridge of the second roof. 7. Main room temperature sensor 2, (serial 9952174). 1.6m off the ground. Left-‐hand side offset
from the center of greenhouse. 8. Main room temperature sensor 3, (serial 9952168). 1.6m off the ground. Right-‐hand side with
respect to the center point of greenhouse. 9. Lower air-‐flow space temperature sensor 2, (serial 9956048). Lower part of the area between
roof 1 and 3. There were 3 RH% sensors. One placed outside with the temperature sensor (#1), one placed at the top roof inflow (#3) and one placed at the lower air-‐flow space (#5). N.B. All sensors were fitted with an aluminum foil sun radiation protector to help reduce heating of sensors due to sunrays.

2012
22 APPENDIX 2. SENSOR PLACEMENT
Figure 4 Side view of roof arrangement with sensor placement
Figure 5 Angled view with sensor placement
Blue: temp. sensors Green: temp and %RH sensors
Blue: temp. sensors Green: temp and %RH sensors
Blue: temp. sensors Green: temp and %RH sensors

2012
23
Figure 6 Alternate structure with sensor placement

2012
24 APPENDIX 3. TIME FRAME FOR CONSTRUCTION SUMMER 2013

2012
25 APPENDIX 4 MATERIALS AND COST SPECIFICS
Table 3 Lengths of Various Materials
1" EMT Conduit 1" PVC length in m length in ft length in m length in ft Base 27.5 90.2 0 0 Middle support 52.5 172.2 0 0 Arcs 1 11.4 37.392 7.6 24.928 Arcs 2 13 42.64 12.26 40.2128 Acrs 3 13.2 43.296 8.8 28.864 Front/Back 14.5 47.56 0 0 Side 53.5 175.48 10.7 35.096 Totals 185.6 608.768 39.36 129.1008 In 10 ft seg 60.8768 12.91008
Table 4 Cost Breakdowns
Building Materials Amount Cost per Unit
Cost per unit TRINIDAD
Total CAD
Gravel bags of 30 kg 6 bags (3 cubic feet)
$400 a yard
concrete/foundation of 30 kg bags
60 baggs (30 cubic ft)
10 600
jig: Adjustable C-clamp 5 20 100 Wood: 2x12 16' 5 14.79 375 73.95 Gorilla glue 18 oz for wood
1 26 $50/quart 26
Hammers 4 10 35 40 Nails (2000) 1 10 15/ BOX 10 Screws 1 10 20cents/screw 10 U-bolt 30 5 150 Drill (Dewalt, cordless, set)
1 149 995 149
Sonatube (concrete) (10" by 12' long (48 Ft total)
4 21.84 87.36
EMT conduit pipe 1" 10 ft long
60.8768 11.28 $12/10ft 686.690304
PVC 1" (10 ft long) 12.91008 1.73 $65 (high perssure) or $40 (regular)
22.3344384
Polyethylene tape 2 15 30

2012
26 polyethylene sheeting (20x25) semi clear white mcmaster
$56 & $78 one 20 by 50 & one 20 by 100
$350 a roll - 100 ft by 10ft wide
134
Wiggle wire (8 foot piece Puckett Greenhouses)
52 8.16 424.32
Insect screening (138") per foot
22 2.5 55
PVC cutter 2 15.99 95 31.98 Jig saw 1 120 795 120 Hack saw 1 30 75 30 Misting system (can bring from mac)
bolts 2" (pkg of 25) (mcmcaster)
7 11.42 79.94
nuts (pkg of 28) 1/4" wide
7 7.11 49.77
PVC cross joint 1" 20 2.35 47 washers (pkg 100) 2 5.21 10.42 Water filter Hose pipes Research Materials HOBO (U12 Temp/RH/Light/External Data Logger)
2 125 250
Sensors temperature/RH (8m) 16 193 3088 Solar Radiation (3m) 3 220 660 HOBO weather station starter kit
1 1399 1399
pump from mac campus
air speed kit: Airspeed Kit with MPXV7002DP (3D robotics)
2 24.95 49.9
Smoke candles (3 minutes, pkg of 12; mcmaster)
2 9.26 18.52
relay- program Total: 2967.764742 Absolute Total: 27123.18474 8433.184742

2012
27
Labour Amount Cost
Lucas 1900 Polina 1900 Living L&P ($/day)
25 2250
540 Travel details Lucas round trip 650 Polina Mtl- Port of Spain 650 Lefsrud 1300 Car 1500 stay details Polina Holiday Inn:
151.52/Night for 2 queen beds
4000
Lucas residence for 1 semester ~4000
4000
Total: 18690