Embed Size (px)
Citation preview

SENG 521SENG 521Software Reliability & Software Reliability & Software Reliability & Software Reliability & QualityQualityyy
Software Reliability ToolsSoftware Reliability Tools((Chapter Chapter 12)12)
D t t f El t i l & C t E i i U i it f C lDepartment of Electrical & Computer Engineering, University of Calgary
B.H. Far ([email protected])http://www.enel.ucalgary.ca/People/far/Lectures/SENG521

SRE: Process (Review)SRE: Process (Review)5 i SRE 5 steps in SRE process:
Define NecessaryReliability
Define necessary Define necessary reliabilityreliabilityD l
Develop Operational Profile
P f T t Develop
operational profilesP f t t
Prepare for Test
Execute Test Prepare for test Execute test
A l f il d t
Apply Failure Data to Guide Decisions
Apply failure data to guide decisions

Section 1Section 1
Software Reliability Software Reliability Engineering ToolsEngineering Tools
SRE Tools: Reliability GrowthSRE Tools: Reliability GrowthF il O t t
SRE
Failure data
Output data
ToolTime(s) Cumulative
FailuresFailures in interval
30 2 230 2 2
60 5 3
90 7 2
120 8 1
Failure Intensity
150 10 2
180 11 1
210 12 1
240 13 1 Failure Intensity240 13 1
270 14 1

Tasks Handled by SRE ToolsTasks Handled by SRE Tools
ll i f il d i i f i Collecting failure and test time information Calculating estimates of model parameters using g p g
this information Testing to fit a model against the collected Testing to fit a model against the collected
information Selecting a model to make predictions of
remaining faults, time to test, etc. Applying the model

Available Options /1Available Options /1S l i f l i f h i d i i i Selection of a tool is one of the important decisions in performing the SRE study. An inappropriate choice may not handle the type of data An inappropriate choice may not handle the type of data collected for the project, or does not have a robust set of models that may fit to the project to make accuratemodels that may fit to the project to make accurate predictions of important information.
Engineers may choose between: g y Using a general-purpose application program such as a spreadsheet
or a statistical package such as SAS and developing their own models using a general purpose programming language such asmodels using a general-purpose programming language such as JAVA or C.
Using a shareware, freeware or commercially available SRE tool.
Available Options /2Available Options /2Ad f d di d ( i l f ) SRE lAdvantages of dedicated (commercial or freeware) SRE tools: Provide a general framework for reliability estimation and prediction.
P id t f th f t d d i ti ft li bilit Provide most of the features needed in executing a software reliability analysis, resulting in a decrease of programming time.
Comparing multiple models on the same failure data and changing the Comparing multiple models on the same failure data and changing the analysis to use a different model is easier to accomplish.
Provide better error detection because many potential types of errors have been identified and are checked for automatically. The chance of a bug in the tool itself is very small. The basic structure of the models is from the theories developed by The basic structure of the models is from the theories developed by academic researchers and uses the terminology of those models.

Selecting SRE Tool /1Selecting SRE Tool /1C i i f l i S l Criteria for selecting SRE tools: Availability of the tool, either in-house or on a network,
f i h ’ ( )for running on the company’s computer system(s) Cost of installing and maintaining the tool Number of studies likely to be done Types of systems to be studied Quality of the tool documentation and support

Selecting SRE Tool /2Selecting SRE Tool /2C i i f l i S l ( d ) Criteria for selecting a SRE tool: (contd.) Ease of learning the tool Flexibility and power of the tool Goals and questions to be answered by the study Models and statistical techniques understood by the
analyst Schedule for the project and type of data collected Tool’s ability to communicate the nature of the model
d h l h h h l ( hand the results to a person other than the analyst (e.g., the end user or a manager).
Input Data Specification /1Input Data Specification /1
All of the SRE tools use one of two basic types of input data: yp p time-domain data
(i e time between failures data)(i.e., time-between-failures data)
interval-domain data (i.e., failure-count data)

Input Data Specification /2Input Data Specification /21) Ti f f il Time based failure specification1) Time of failure2) Time interval
Failure no.
Failure times (hours)
Failure interval (hours)
Time based failure specification
)between failures
3) Cumulative failure
1 10 10
2 19 9
3 32 13
4 43 113) Cumulative failure up to a given time
4) Failures
4 43 11
5 58 15
6 70 12
7 88 184) Failures experienced in a time interval
8 103 15
9 125 22
10 150 25
11 169 19time interval 11 169 19
12 199 30
13 231 32
14 256 25
15 296 40

Input Data Specification /3Input Data Specification /31) Ti f f il Failure based failure specification1) Time of failure2) Time interval
Time(s) Cumulative Failures
Failures in interval
30 2 2
Failure based failure specification
)between failures
3) Cumulative failure
60 5 3
90 7 2
120 8 1
150 10 23) Cumulative failure up to a given time
4) Failures
150 10 2
180 11 1
210 12 1
240 13 14) Failures experienced in a time interval
270 14 1
time interval

SRE Tools SRE Tools CASRE CASRE
SoftRel SMERFS
SRE tool repository: SMERFS SoRel
SRMP
1. Open channel software:http://www.openchannelsoftware.org/discipline/Reliability Analysis/ SRMP
ProConf Relex
ility_Analysis/
2. Univ of Marylandhttp://www.enre.umd.edu/tool.htm
Relex MEADEP
(MEAsure and(MEAsure and DEPendability)
etc.

SRE Tools (cont’d)SRE Tools (cont’d) ACARA II: Availability Cost And Resource Allocation ACARA II: Availability, Cost, And Resource Allocation,
Version 2 (no charge per license) ARAM: Automated Reliability/Availability/Maintainability,
i ($ d l )Version 2.0 ($400 source code license) ETARA: Event Time Availability, Reliability Analysis
($200 source code license)($200 source code license) GO: Graphics Oriented Program ($150 source code license) HARP: Hybrid Automated Reliability Predictor, Version 7.0
($500 d li f U i PC)($500 source code license, for Unix or PC) HARPO: Hybrid Automated Reliability Predictor Output
Graphics Display ($150 source code license)p p y ( ) SPRPM: Software Problem Report Metrics Program (no
charge per license, requires EXCEL)

SRE Tools: SMERFS /1SRE Tools: SMERFS /1St ti ti l M d li d E ti ti f R li bilit Statistical Modeling and Estimation of Reliability Functions for SoftwareSMERFS i bli d i ft k SMERFS is a public-domain software package designed and implemented at the Naval Surface Warfare CenterWarfare Center.
SMERFS is a program for estimating and predicting the reliability of software during the testing phasethe reliability of software during the testing phase.
The body of code is in Fortran.

SRE Tools: SMERFS /2 SRE Tools: SMERFS /2 ff fl ibili i d ll i d id It offers flexibility in data collection and provides
multiple time domain and interval domains. Th f f l f l i d l d b iTherefore useful for multi-model debugging.
SMERFS prompts the user for the name of the History file Plot file Input data file Output data filep

SRE Tools: SMERFS /3SRE Tools: SMERFS /3
History fileHistory file is an output file created by SMERFS. It is a trace file that contains all of the user input and SMERFS outputs for a particular run so that the user can go backparticular run so that the user can go back and look at the run at a later time. Pl t filPl t fil i h d i Plot filePlot file contains the raw output data in plotting results.

SRE Tools: SMERFS /4SRE Tools: SMERFS /4I t d t filI t d t fil t i th f il hi t d t Input data fileInput data file contains the failure history data on which SMERFS will actually operate to produce the reliability estimates and predictionsreliability estimates and predictions.
The user must also specify the type of data contained in the input datacontained in the input data.
If the selected data type does not correspond to the type of data actually in the input file the estimatestype of data actually in the input file, the estimates and predictions made by SMERFS will not be valid.

SRE Tools: SMERFS /5SRE Tools: SMERFS /5O t t d t filO t t d t fil i fil th t th if t Output data fileOutput data file is a file that the user can specify to which SMERFS will write failure history data created or edited by the user during the currentcreated or edited by the user during the current SMERFS session.
This is different from the history file since the This is different from the history file, since the history file is a trace file which records all user input and SMERFS responses.input and SMERFS responses.
The output data file can be used in subsequent sessions as an input data file.sessions as an input data file.
The output file is in SMERFS format, not ASCII format.
format.

SRE Tools: SRMP /1SRE Tools: SRMP /1S i i l d li d li biliStatistical Modeling and Reliability Program The SRMP was developed by the Reliability and Statistical
C l Li i d f UK i 1988Consultants, Limited of UK in 1988. SRMP is a command-line-oriented tool developed for an
IBM PC/AT d l UNIX b d k t tiIBM PC/AT and also UNIX based workstations. SRMP contains nine models.
SRMP th i lik lih d ti ti t h i t SRMP uses the maximum likelihood estimation technique to compute the model parameters, and provides the following reliability indicators:reliability indicators:
reliability function, failure rate, mean time to failure, median time to failure, and the model parameters for each model.

SRE Tools: SRMP /2SRE Tools: SRMP /2SRMP i ASCII d t fil i t SRMP requires an ASCII data file as input.
The file contains the name (or other identification) of the project, the number of failures involved in the reliability analysis, and the inter-y yfailure times of all the failures.
The input file also specifies the initial sample size used by SRMP for the initial fitting of each reliability model to the datainitial fitting of each reliability model to the data.
The remaining failures are used by SRMP for assessing a reliability model's prediction accuracy.
The input file contains certain mathematical parameters, chosen by the analyst, which are needed to initiate and control the SRMP algorithm’s search for a convergent solution.search for a convergent solution.
Analysts must be knowledgeable in setting up the data file, as many parameters are at their discretion.
SRE Tools: SoftRel /1SRE Tools: SoftRel /1
Characteristics of SoftRel Console-based application written in C (about pp (
1300 lines of code) Source code is available Source code is available One input project file (formatted text)
G t t t fil (CSV) Generates one output file (CSV)

SRE Tools: SoftRel /2SRE Tools: SoftRel /2The fundamental difference is that SoftRel is a The fundamental difference is that SoftRel is a simulation tool, rather than a reliability growthmodeling tool, i.e., one can simulate the g , ,interdependencies between components.
Example:Example: what will be the effect of producing more d i di ? ( idocumentation vs. more coding? (assuming requirement-design-coding-test lifecycle)SoftRel uses Piecewise Poisson Markov Process to SoftRel uses Piecewise-Poisson Markov Process to simulate project occurrences
Limitations:Limitations: SoftRel is limited to studying a project Limitations:Limitations: SoftRel is limited to studying a project that has the standard waterfall lifecycle.

SRE Tools: SoRel /1SRE Tools: SoRel /1Software Reliability Program Software Reliability Program
SoRel is a Macintosh-based reliability measurement tool that was developed by LAAS a lab of thetool that was developed by LAAS, a lab of the National Center for Scientific Research in France, in 1991.
SoRel is composed of two parts: The first part allows several reliability trend tests. These
tests allow us to identify whether the reliability functiontests allow us to identify whether the reliability function is increasing or decreasing so that an appropriate model can be applied.
The second part allows reliability growth model application and contains 4 models.

SRE Tools: SoRel /2SRE Tools: SoRel /2S R l th i lik lih d t SoRel uses the maximum likelihood parameter estimation technique and provides the following reliability indicators:reliability indicators:
mean time to failure, cumulative number of failures, failure intensity, model parameters to evaluate other y, preliability functions.
Only one model is executed at a time. Execution results are automatically saved to ASCII files which can be imported into spreadsheets or other
li i f d l iapplications for model comparisons.

SRE Tools: SoRel /3SRE Tools: SoRel /3S l ASC SoRel uses ASCII input files that are
d icreated using a spreadsheet.
Numerical results are displayed on the screen during execution; the user can also request plots of the data.
Figure from SRE Handbook

SRE Tools: CASRE /1SRE Tools: CASRE /1Computer Aided Software Reliability Estimation ToolComputer-Aided Software Reliability Estimation Tool CASRE is copyrighted by NASA. CASRE is a PC-based tool that was developed in 1993 by CASRE is a PC based tool that was developed in 1993 by
the Jet Propulsion Laboratories to address the ease-of-use issues of other tools. CASRE requires the Windows operating environment CASRE requires the Windows operating environment.
It has a pull-down, menu-driven user interface and uses the same model library as the SMERFS tool with the additional feature of allowing linear combinations of models to create new ones at the user’s discretion.
Four combined models are permanently available in CASRE. Four combined models are permanently available in CASRE. CASRE ver. 3.0 is available
(http://www.openchannelsoftware.org/discipline/Reliability_Analysis)

SRE Tools: CASRE /2SRE Tools: CASRE /2CASRE ll l t t i k t t dit th li ti CASRE allows an analyst to invoke a text editor or other application from within CASRE to create the ASCII input data set. The input data set contains fields for the test interval number, number of failures observed in the interval, length of the test interval, fraction of the program tested, and severity of the failure.
Once the data is entered, CASRE automatically provides the analyst withOnce the data is entered, CASRE automatically provides the analyst with a raw data plot.
CASRE provides the analyst with the ability to convert from time-d i d t t i t l d i d t d idomain data to interval-domain data and vice versa.
Model parameters can be estimated using either maximum likelihood or least squares decided by the analyst. After the application of several models to a data set, multiple model results can be displayed in the graphical display window for analysis.

SRE Tools: CASRE /3SRE Tools: CASRE /3CASRE id CASRE provides operations to transform or smooth the failure data; the user can select and/or define multipledefine multiple models for application to the data and make reliability predictions based on the best modelthe best model.
Figure from SRE Handbook

More InfoMore InfoD l d t l Download tools: IEEE Software Reliability Engineering Working Group
(SREWG)(SREWG) http://www.srewg.org/Tools/
SRE tools repository: SRE tools repository: Center for Reliability Engineering at the University of
Marylandyhttp://www.enre.umd.edu/tool.htm
Open Channel Foundation http://www.openchannelsoftware.org/discipline/Reliability_Analysis

CASRE: IntroductionCASRE: Introduction
Software Reliability Estimation tool running on Windows
CASRE extends the SMERFS package by adding a menu based GUIadding a menu based GUI
Uses ASCII text input data files Displays results in tabular and/or graphical
formform Can use many different models

CASRE Program StructureCASRE Program Structure Main Window Main Window
The window where the input data file is loaded and displayed.d sp ayed.
Menu options allow the user to apply models and filters to the input data.
Graphical Display Window Displays a plot of the input data, as well as the results of
any models applied to the data. Model Results Table
Displays the tabulated results from the models that were used in the calculation.

Main WindowMain Window The main window is the starting point for CASRE The main window is the starting point for CASRE
sessions.This is the place where the user selects themodels and filters to apply to the input data.models and filters to apply to the input data.
Menu Options File (Open, Save, Print, Exit)e (Ope , Save, t, t) Edit (Change Data Type, External Application, Escape to DOS) Filters (Shaping and Scaling, Change time unit, etc.
M d l (S l t d R D fi C bi ti Edit/R M d l Model (Select and Run, Define Combination, Edit/Remove Models, Parameter Estimation, Select Data Range, Predictions)
Setup, Plot, Help

Graphical DisplayGraphical Display Provides the plots of the input and calculated data Provides the plots of the input and calculated data. Each individual data set on a plot has its own unique symbol and colour. Menu Options
Pl t (S D f Fil S t Plot (Save as, Draw from File, Setup Printer, Print Plot)
Results (Select Model Results, Model Results Table)Results Table)
Display Graphs - Time between failures,
Failure counts, Failure intensity, TestFailure counts, Failure intensity, Test interval lengths, Cumulative failures, Reliability
Model Evaluation - Goodness-of-fit, Prequential likelihood RelativePrequential likelihood, Relative accuracy, Bias, Bias trend, Bias scatter plot, Model noise, Model ranking
Settings, Copy, Help

Model Results WindowModel Results Window Displays the detailed calculated results in a tabular format Displays the detailed calculated results in a tabular format. Reliability estimates, parameter estimates, and convergence
information are all displayed in this table for a selectedinformation are all displayed in this table for a selected model.
Menu OptionsMenu Options File Results – Select Results, Previous Model, Next Model Help

CASRE Data InputCASRE Data Input ASCII based text file with a dat extension ASCII based text file with a .dat extension Two file formats
Ti B t F il ( # ti i l t f il Time Between Failures (error #, time since last failure, failure severity class)
Failure Counts (interval #, # errors in interval, interval Failure Counts (interval #, # errors in interval, interval length, failure severity class)
The format of the file must be strictly adhered toy No direct manipulation of the data file is allowed
but CASRE has menu links to common text editors

Using CASRE /1Using CASRE /11 P i t d t1. Prepare input data
Input data can be either failure count or failure i l dper interval data
<failure number> <number of natural or time units since previous failure> <severity class>Sample failure units since previous failure> <severity class>
1 30 12 55 13 70 1
pcount data
4 60 15 90 16 110 17 100 18 150 18 150 19 120 110 215 1
Example from Musa’s Book

Using CASRE /2Using CASRE /21 P i t d t1. Prepare input data
Input data can be either failure count or failure i l dper interval data
<interval number> <failure in interval><duration of interval> 0 0 0 <severity class>Sample failure <duration of interval> 0 0 0 <severity class>
1 5 2.5 0 0 0 12 1 1 0 0 0 13 4 3 0 0 0 1
pper interval data
4 1 2 0 0 0 15 0 1.5 0 0 0 16 1 3 0 0 0 17 2 4 0 0 0 18 1 2 5 0 0 0 18 1 2.5 0 0 0 19 2 3 0 0 0 110 2 5 0 0 0 1
Example from Musa’s Book

Using CASRE /3Using CASRE /32 Ch k if d t h li bilit th (t d t t)2. Check if data shows reliability growth (trend test)3. Read input file4. Select data range5. Filter or smooth input data if required6. Select parameter estimation method7. Select and run model(s)( )8. View and interpret model results
Goodness of fit testGood ess o es Model ranking Prediction based on plots
p

CASRE Reliability Models /1CASRE Reliability Models /1
Time between failure models Geometric Jelinski-Moranda Littlewood Verrall Littlewood-Verrall Musa-Basic Musa-Okumoto NHPP

CASRE Reliability Models /2CASRE Reliability Models /2
Failure Count models Generalized Poisson NHPP Schneidewind Schneidewind Shick-Wolverton Yamada S-shaped

CASRE Reliability Models /3CASRE Reliability Models /3
Combination models: Four predefined modelsp
Dynamically weighted Equally weightedq y g Median Weighted Unequally weightedUnequally weighted
Other combination models can be defined

Trend CheckTrend Check CASRE models should only be used on data where CASRE models should only be used on data where
the overall reliability is increasing as testing continues.
Reliability is increasing if the mean time between failures increases as the total number of failures increases during testingincreases during testing.
CASRE version 2 does not have the automatic trend test option so a visual inspection of the cumulativetest option, so a visual inspection of the cumulative failure plot is necessary.
CASRE version 3 has an automatic trend test option, p ,that will inform the user if the data is applicable to the reliability models.

Trend Related Questions …Trend Related Questions …
Is the system reliability increasing, decreasing or stable?g
Which reliability growth model fits best the gathered data?gathered data?
Can the same model be used in all cases of reliability growth, decrease and stable?

And Trend Related Answers …And Trend Related Answers …
Reliability trends can be analyzed by “trend tests”.
Trend tests can be used to help determine whether the system undergoes reliabilitywhether the system undergoes reliability growth, decrease or stable reliability.
Trend analysis also helps select appropriate reliability model for each phase. y p

Failure Data for Trend TestsFailure Data for Trend Tests
The trend tests work with the failure data. The trend can be analyzed usingThe trend can be analyzed using
Inter-failure times data (i.e. time of failure known) orknown) or
Failure count data (i.e. failure per interval k )known)

InterInter--failure Times Data /1failure Times Data /1
Two trend tests are commonly carried: Arithmetical mean test Arithmetical mean test Laplace tests

InterInter--failure Times Data /2failure Times Data /2Th ith ti l f th i t f il The arithmetical mean of the inter-failure times consists of calculating arithmetical
( ) f h b d i f il imean (i) of the observed inter-failure times j.
1 i
1
1 i
jj
ii
An increasing series of (i) indicates
reliability growth and a decreasing seriesreliability growth and a decreasing series suggests reliability decrease.

InterInter--failure Times Data /3failure Times Data /3F N(T) th l ti b f f il For N(T) as the cumulative number of failures over the time period [0, T], the Laplace factor
(T) i d i du(T) is derived:11
i
ji n
1
1 1
11 2
1
jj
n j
i
iu i
1
112 1j
j i
For the case that T is equal to the time of occurrence of failure i.

InterInter--failure Times Data /4failure Times Data /4
Negative values of the Laplace factor u(i)indicate a decreasing failure intensity, i.e., g yreliability growth.
Positive values of the Laplace factor u(i) Positive values of the Laplace factor u(i)indicate an increasing failure intensity, i.e.,
li bili dreliability decrease. Values between –2 and +2 indicate stable
reliability.

InterInter--failure Times Data /5failure Times Data /5Mid i t f th b ti i t l T/2 Midpoint of the observation interval: T/2
Statistical center of data:( )1
N T
( )
1 1
N T n
jn j
N T
For the failure intensity decrease, the interfailure times j tend to occur before the midpoint; hence j p ;the statistical center tend to be smaller than the mid-interval.
For the failure intensity increase, the statistical center tend to be larger than the mid-interval.
g

Failure Failure Count Data Count Data /1/1h i i d [0 ] di id d i k i f For the time period [0, T], divided into k units of
equal length and for n(i) be the number of failures b d d i h i i l h L lobserved during the time interval i, the Laplace
factor u(k) is derived by:
1 1
112
k k
i i
ki n i n ik
1 12
1
112
i i
k
i
u kk n i
112 i
Failure Failure Count Data Count Data /2/2
Negative values of the Laplace factor u(k)indicate a decreasing failure intensity, i.e., g yreliability growth.
Positive values of the Laplace factor u(k) Positive values of the Laplace factor u(k)indicate an increasing failure intensity, i.e.,
li bili dreliability decrease.

Typical Plots /1Typical Plots /1
Typical graphs for failure intensity yn(k) and cumulative failurecumulative failure intensity N(k)
(k is number of (intervals)

Typical Plots /2Typical Plots /2
Typical plot for the Laplace factor pu(k)
(k is number of intervals)

Typical Plots /3Typical Plots /3
Typical plot for Laplace factor during various project phases p j p
Decrease of reliability
Reliability growth

Selecting ModelsSelecting Models
Typical plot for Laplace factor during various project phases p j p
Reliability growth (any reliability growth model can be applied)Decrease of reliability g pp )
Only models allowing Increasing failure intensity can be applied
Reliability growth

CASRE: Case Study CASRE: Case Study Project X is a eb based application for accessing a Project X is a web based application for accessing a database using a browser.
hi i f h f i i l i h This version of the software is a minor release with changes to the GUI display and data access engine.
Two programmers were assigned to the project. One programmer worked on the GUI, and the other on the data access engine.
The project took approximately 4 weeks to complete.p j pp y p

Case Study (contd.) Case Study (contd.) A single tester was assigned to the project A single tester was assigned to the project. The test phase was completed in approximately 25
hours (3 working days or 90 000 seconds)hours (3 working days or 90,000 seconds). 136 failures were discovered during the testing.
U i th d t d ti d d f th f il Using the dates and times recorded for the failures discovered during testing, a “time between failures” input file was generated for CASREinput file was generated for CASRE.
The severity of all the failures was set to 1 Low Severity 1 - Low Severity

Trend AnalysisTrend Analysisl h li bili h Laplace test shows reliability growth.

Project ResultsProject Results
In order to determine which models would provide the best fit for the project data, the p p jfollowing models were run Geometric Geometric Jelinski - Moranda
i l d ll Littlewood - Verrall Musa Basic Musa - Okumoto

Goodness of Fit TestGoodness of Fit TestOn Graphic display window select:
Display Goodness of fit
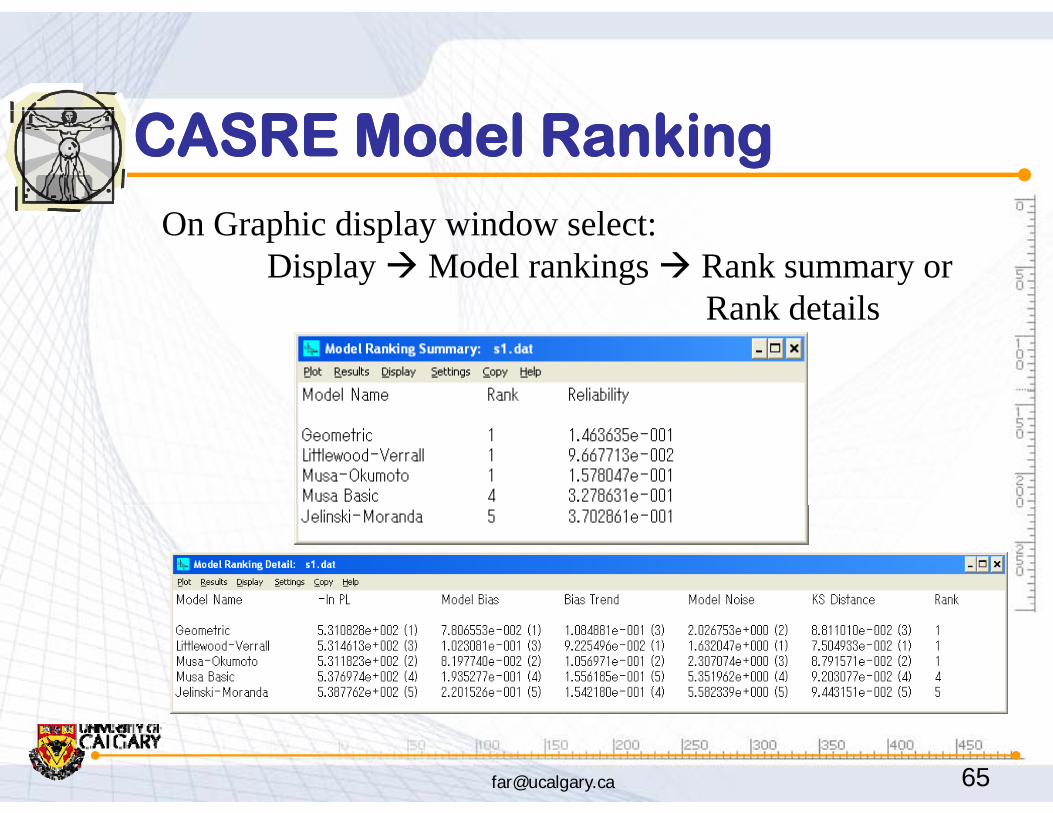
CASRE Model RankingCASRE Model RankingOn Graphic display window select:
Display Model rankings Rank summary orRank detailsRank details

Display ResulsDisplay ResulsOn Graphic display window select:
Results Select model results
Only 3 graphs can be displayed at a time
Interpreting Results /1Interpreting Results /1A f ti ti f th f il Accuracy of estimation of the failure intensity depends on the number of failures
i d (i h l i )experienced (i.e., the sample size). Good results in estimating failure intensity g y
are generally experienced for programs with 5,000 or more developed source lines. , p
Satisfactory results are obtained for programs with 1 000 or more developed source lineswith 1,000 or more developed source lines.

How to Handle Defects?How to Handle Defects?T bl b l i th ti b t f il Table below gives the time between failures for a software system:
Error no. 1 2 3 4 5 6 7 8 9 10Time since last failure (hours) 6 4 8 5 6 9 11 14 16 19
What can we learn from this data?t li bilit ? system reliability?
total number of errors in the system? time to (approximately) remove all errors?

What to Learn from Data?What to Learn from Data?Th i f th i t ti th The inverses of the inter-error times are the failure intensity data points (or error rate if
l d i i )plotted against time)Error no. 1 2 3 4 5 6 7 8 9 10
Time since last failure (hours) 6 4 8 5 6 9 11 14 16 19
Failure intensity 0.166 0.25 0.125 0.20 0.166 0.111 0.09 0.071 0.062 0.053
Release time
F

Interpreting Results /2Interpreting Results /2h h f il i i i l d h When the failure intensity is very large and the
trend indicates little chance of achieving the F by the scheduled release date, what can be done? Adding additional test and debugging resourcesg gg g Adjusting the balance among the objectives for failure
intensity development time and development costintensity, development time, and development cost Deferring features

ConclusionsConclusionsCASRE i l bl t l f ft CASRE is a valuable tool for software reliability estimation.
CASRE is easy to learn and use. It is possible to become proficient at the softwarepossible to become proficient at the software in a few hours.
i h l l d l For accuracy in the calculated results, CASRE should be applied to projects where the expected number of failures is greater than 40 to 50 failures.
than 40 to 50 failures.