Embed Size (px)
Citation preview
SEMINARIOLas relaciones económicas
de China con América Latinay el Caribe:
Una visión prospectiva
j
11 de noviembre de 2015
The Post Boom:
Slower Growth, More Diversified Scenario
1
GUO Jie
School of International Studies, Peking University
Email: [email protected]
INTAL Seminar, Buenos Aires, Argentina. November 11, 2015

12.596
102.65
241.408
263.60
0
50
100
150
200
250
300
2000 2001 2002 2003 2004 2005 2006 2007 2008 2009 2010 2011 2012 2013 2014
Figure 1: Trade between China and LAC, from 2000 to 2014 (Billions $)
Source: Zhongguo Duiwai Jingji Maoyi Nianjian & Zhongguo Haiguan Tongji Nianjian (relative years)
From 2000 to
2014, two-way
trade has been
growing at an
average annual
rate of above
30%, reaching
$263.6bn in
2014.

4619
0
20000
40000
60000
80000
100000
120000
2003 2004 2005 2006 2007 2008 2009 2010 2011 2012 2013 2014
OFDI stocks OFDI flows
Figure 2: Chinese non-financial OFDI into the LAC, 2003-2014 (Millions $)
According to the data
from MOFCOM, as of
the end of 2014,
China’s non-financial
OFDI stock volume
had amounted to
$646.3bn, among
which over $98.9bn
were towards LAC.
Source: Statistical Bulletin of China’s Outward Foreign Direct Investment (relative years)

14.2
10.63
7.757.69 7.4
6.9
0
10000
20000
30000
40000
50000
60000
70000
5
6
7
8
9
10
11
12
13
14
15
(Bill
ions
of
RM
B)
(per
cen
tages
)
GDP GDP growth (annual %)
Figure 3: China’s GDP & GDP Growth Rate, from 1995 to the first three quarters of 2015
Source: http://data.stats.gov.cn/ks.htm?cn=C01
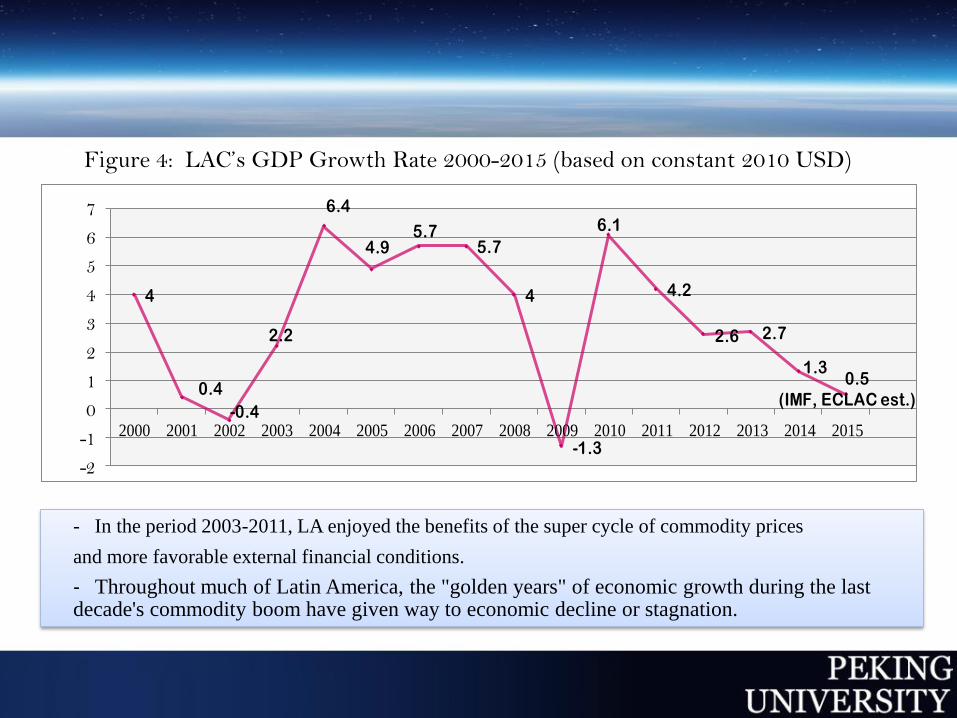
- In the period 2003-2011, LA enjoyed the benefits of the super cycle of commodity prices
and more favorable external financial conditions.
- Throughout much of Latin America, the "golden years" of economic growth during the last decade's commodity boom have given way to economic decline or stagnation.
4
0.4
-0.4
2.2
6.4
4.95.7
5.7
4
-1.3
6.1
4.2
2.6 2.7
1.30.5
(IMF, ECLAC est.)
-2
-1
0
1
2
3
4
5
6
7
2000 2001 2002 2003 2004 2005 2006 2007 2008 2009 2010 2011 2012 2013 2014 2015
Figure 4: LAC’s GDP Growth Rate 2000-2015 (based on constant 2010 USD)

261.2 261.6 263.6
0
50
100
150
200
250
300
2008 2009 2010 2011 2012 2013 2014
Figure 5: Trade between China and LAC, 2008-2014 (Billions $)
Source: Zhongguo Duiwai Jingji Maoyi Nianjian & Zhongguo Haiguan Tongji Nianjian (relative years)

79.278
0
20
40
60
80
100
120
140
Source: MOFCOM Database
Figure 6: China’s Imports from LAC, from 2003 to the first three
quarters of 2015(Billions $)


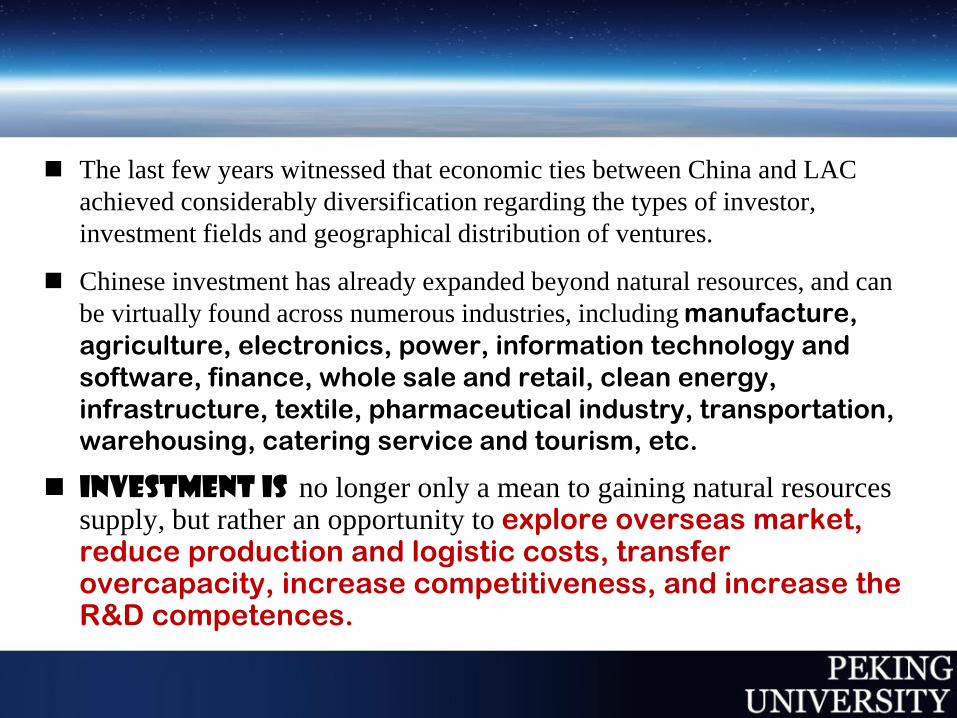
The last few years witnessed that economic ties between China and LAC
achieved considerably diversification regarding the types of investor,
investment fields and geographical distribution of ventures.
Chinese investment has already expanded beyond natural resources, and can
be virtually found across numerous industries, including manufacture,
agriculture, electronics, power, information technology and
software, finance, whole sale and retail, clean energy,
infrastructure, textile, pharmaceutical industry, transportation,
warehousing, catering service and tourism, etc.
Investment is no longer only a mean to gaining natural resources supply, but rather an opportunity to explore overseas market, reduce production and logistic costs, transfer overcapacity, increase competitiveness, and increase the R&D competences.


Jacareí

Since 2007, Chinese agricultural corporations, both SOEs
and private entities, have started investing in the LAC.
Some of them have gained a foothold in the region by
direct or indirect investment .
Two acquisitions by COFCO in 2014: Nidera in Feburary
and Noble’s agribusiness arm in April.

1920s Dutch immigrants establish Nidera S.A. in Buenos Aires, Argentina
1940s Nidera establishes a subsidiary in Uruguay
1950s Nidera starts trading with Brazil as the country enters international trade of cotton and castorseeds oils.
1960s Nidera establishes a fully owned subsidiary in Brazil.
1970s Nidera’s first country elevator in Argentina’s Buenos Aires province
Construction of port terminal and crushing plant for grains and oils in Puerto San Martin, Santa Fe province in Argentina
1980s Acquisition of Asgrow Seed Argentina, leader in R&D 2000’s for soybean seed
Acquisition of castor seed crushing plant in Bahia, Brazil
Acquisition of and construction of three classification plants for agronomic seeds in Argentina.
1990s Acquisition and enlargement of vegetable oils refinery and bottling plant in Buenos Aires, Argentina
Construction of new oilseeds crushing plant in Saforcada, Argentina
Construction of fertilizer port terminal in Quequen, Argentina
2000s Nidera establishes own subsidiaries in Ukraine, Russia, Kazakhstan, Romania, Australia and Brazil.
2010s Copatia seeds is established in Paraguay.
Expansion in crushing capacity and construction of unloading facility in Puerto San Martin, Argentina.
Acquisition of Corn and Soybean Seeds operations in Brazil, investments in R&D.
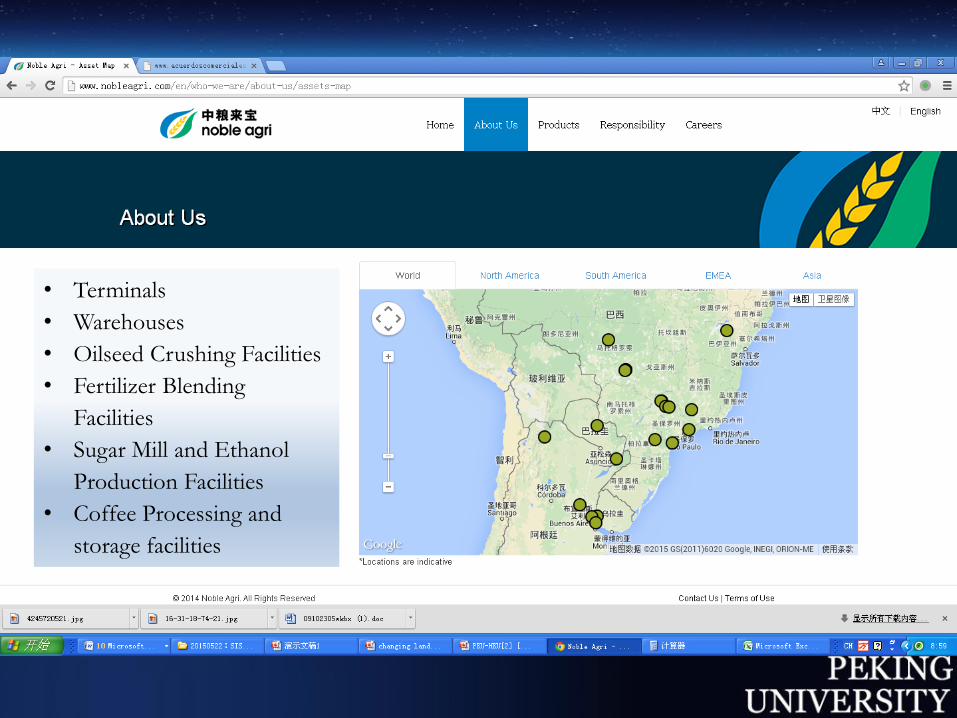
• Terminals
• Warehouses
• Oilseed Crushing Facilities
• Fertilizer Blending
Facilities
• Sugar Mill and Ethanol
Production Facilities
• Coffee Processing and
storage facilities

Timbúes River Port Grain Terminal Dry Bulk Export Terminal (T12)

referring to the establishment of the China-Latin American Countries and
Caribbean States Cooperation Plan (2015-2019).
referring to promoting the comprehensive development of China-Latin
America practical cooperation with as the
impetus, striving to promote China-Latin America trade to scale up to 500 billion USD and
the investment stock to Latin America up to 250 billion USD within ten years and promote
the expansion of local currency settlement and currency swap in bilateral trade.
referring to boosting China-Latin America industry connection with
as cooperation priorities.
See Xi Jinping’s Keynote Speech at the China-LAC Summit in Brazil, July 18, 2014
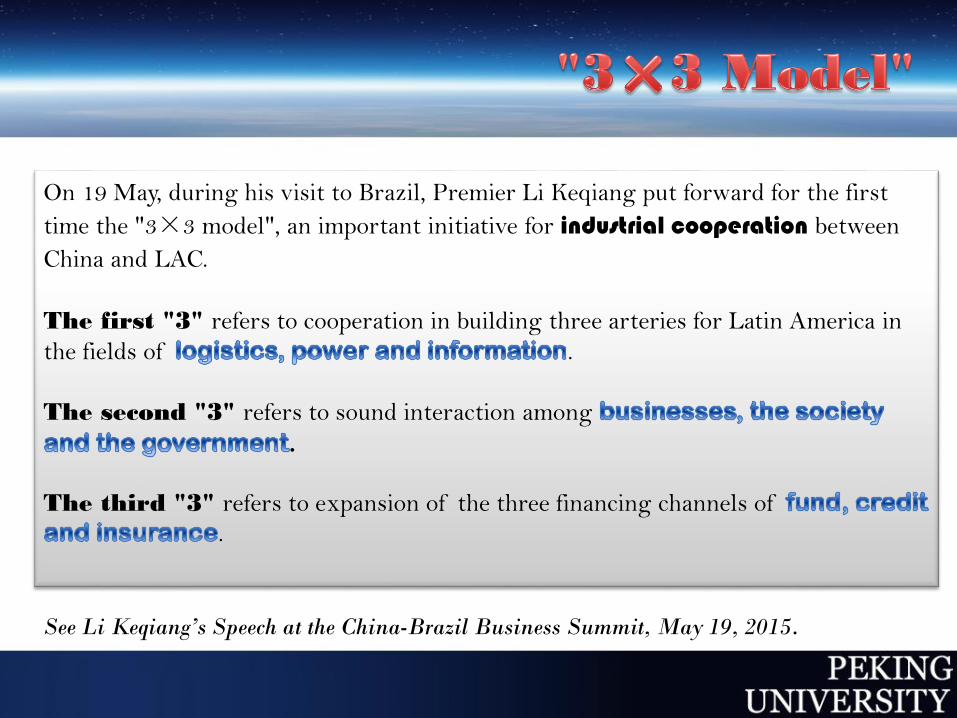
On 19 May, during his visit to Brazil, Premier Li Keqiang put forward for the first
time the "3×3 model", an important initiative for industrial cooperation between
China and LAC.
The first "3" refers to cooperation in building three arteries for Latin America in
the fields of .
The second "3" refers to sound interaction among
.
The third "3" refers to expansion of the three financing channels of
.
See Li Keqiang’s Speech at the China-Brazil Business Summit, May 19, 2015.
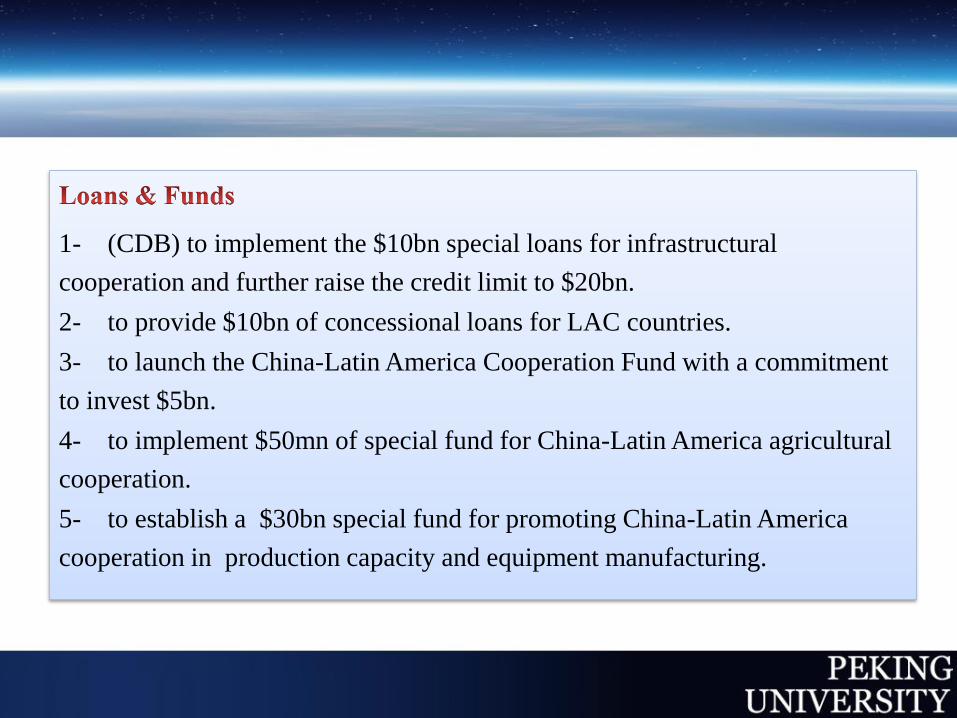
1- (CDB) to implement the $10bn special loans for infrastructural
cooperation and further raise the credit limit to $20bn.
2- to provide $10bn of concessional loans for LAC countries.
3- to launch the China-Latin America Cooperation Fund with a commitment
to invest $5bn.
4- to implement $50mn of special fund for China-Latin America agricultural
cooperation.
5- to establish a $30bn special fund for promoting China-Latin America
cooperation in production capacity and equipment manufacturing.

Countries Quality of
overall
infrastructure
Quality of
roads
Quality of
railroad
infrastructure
Quality of
port
infrastructure
Quality of air
transport
infrastructure
Quality of
electricity
supply
value rank/144 value rank value rank value rank value rank value rank
Venezuela 2.6 135 2.6 127 1.6 99 2.6 130 2.7 133 1.7 137
Paraguay 2.7 132 2.5 133 n/a n/a 3.2 108 2.6 136 3.2 107
Argentina 3.0 123 3.0 110 1.7 96 3.7 91 3.6 107 2.6 123
Brazil 3.1 120 2.8 122 1.7 95 2.7 122 3.4 113 4.1 89
Colombia 3.4 108 2.7 126 1.5 102 3.7 90 4.1 78 5.1 60
Peru 3.5 105 3.2 102 1.9 90 3.7 87 4.0 89 4.9 71
Costa Rica 3.6 103 2.8 119 1.9 91 3.0 115 4.6 61 5.6 42
Bolivia 3.6 99 3.3 95 2.5 70 2.0 141 3.2 120 3.9 94
Uruguay 4.0 80 3.5 90 1.3 103 4.7 48 4.0 90 5.7 38
Mexico 4.2 69 4.4 52 2.8 64 4.3 62 4.6 63 4.6 80
Chile 4.7 50 5.1 31 2.5 73 5.0 25 5.0 45 5.4 54
Panama 5.0 39 4.7 44 3.9 35 6.3 7 6.1 7 4.9 68
SOURCE:World Economic Forum, The Global Competitiveness Report 2014–2015, pp.103-391.
Table 2:Quality of Infrastructure (some countries in the region)
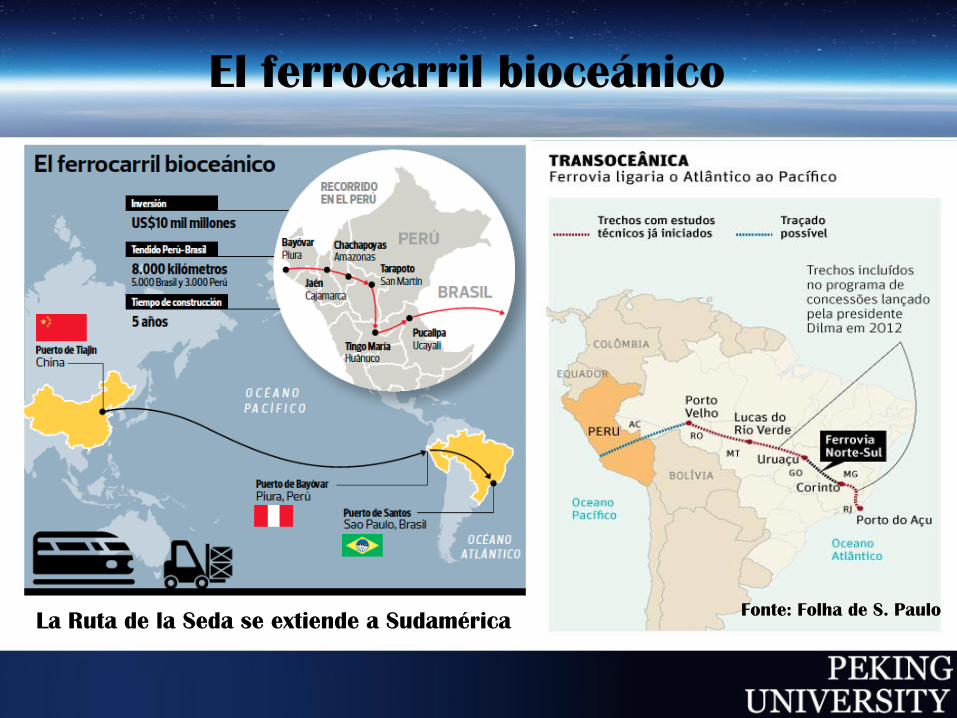
El ferrocarril bioceá nico
La Ruta de la Seda se extiende a Sudamé ricaFonte: Folha de S. Paulo


Muita Obrigada!
¡Muchas Gracias!
Thank You!
谢谢!