Embed Size (px)
Citation preview
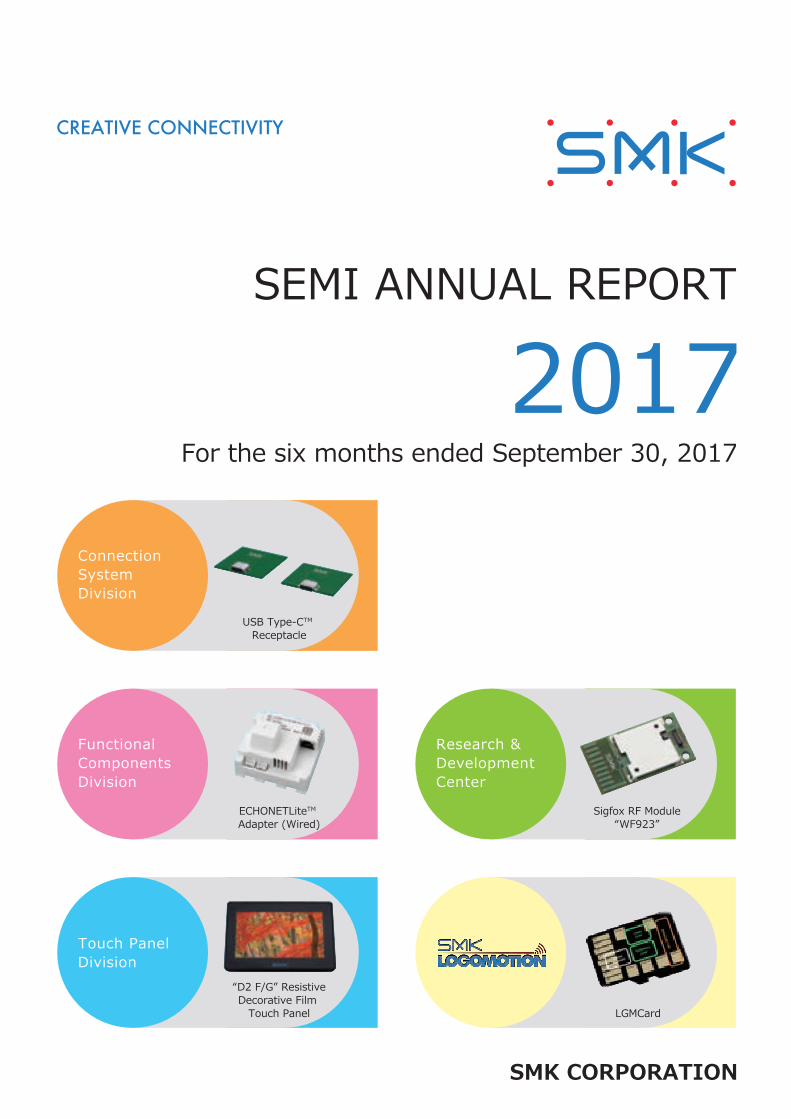
Research & Development Center
Touch Panel Division
Functional Components Division
Connection System Division
USB Type-CTM Receptacle
ECHONETLiteTM Adapter (Wired)
“D2 F/G” ResistiveDecorative Film
Touch Panel
Sigfox RF Module“WF923”
LGMCard
SMK CORPORATION
SEMI ANNUAL REPORT
2017For the six months ended September 30, 2017
010_0284001642912.indd 2 2017/12/04 17:45:50

1 SEMI ANNUAL REPORT 2017
Millions of yenThousands ofU.S. dollars
Six months ended September 302016
Six months ended September 302017
Six months ended September 302017
Operating ResultsNet sales ¥ 31,708 ¥ 29,393 $ 260,738Operating income 747 598 5,305 Profit (loss) attributable to owners of parent (1,079) 900 7,984
As of March 312017
As of September 302017
As of September 302017
Financial PositionTotal assets ¥ 62,318 ¥ 65,058 $ 577,113Total net assets 31,318 32,228 285,887
Yen U.S. dollars
Six months ended September 302016
Six months ended September 302017
Six months ended September 302017
Per Share DataProfit (loss) attributable to owners of parent Basic ¥ (15.87) ¥ 13.62 $ 0.12Note: The U.S. dollar amounts represent translations of Japanese yen, for convenience only, at the rate of ¥112.73 = U.S. $1.00.
Net sales
Basic profit attributable to owners of parent per share
Operating income
Total assets
Profit (loss) attributable to owners of parent
Total net assets
Financial HighlightsSMK Corporation and Consolidated Subsidiaries
■ Full year ■ ■ First half
2014 2015 2016 2017Mar.
2017Sep.
34,88132,171
66,23065,796
39,31531,708 29,393
62,971
77,206
Millions of yen
0
30,000
60,000
90,000
15.17 13.62
35.58
■ Full year ■ First half yen
37.94
27.61
2014 2015 2016 2017Mar.
2017Sep.
0
15
30
45
■ Full year ■ ■ First half Millions of yen
2014 2015 2016 2017Mar.
2017Sep.
0
1,000
2,000
3,000
4,000
5,000
1,9882,330
1,125
2,1132,572
747 598630
4,171
65,02967,606
56,235
■ Full year ■ First half Millions of yen
0
20,000
40,000
60,000
80,000
62,31865,058
2014 2015 2016 2017Mar.
2017Sep.
■ Full year ■ ■ First half Millions of yen
2014 2015 2016 2017Mar.
2017Sep.
(1,500)
0
1,500
3,000 2,541
1,893
(1,079)
900
1,6781,982 2,077
1,017
2,678
31,47634,187
0
10,000
20,000
30,000
40,00033,287
■ Full year ■ First half Millions of yen
31,318 32,228
2014 2015 2016 2017Mar.
2017Sep.
010_0284001642912.indd 1 2017/12/04 17:45:50
2SEMI ANNUAL REPORT 2017
Yasumitsu IkedaPresident, CEO and COO
We are obliged to you for your continued support and good patronage.
We would like to report on the outline and results of the SMK Group’s businesses for the first half of the 96th fiscal year (from April 1, 2017 to September 30, 2017).
We look forward to your continuing support and encouragement.
November 2017
During the first half of the 96th fiscal year ended September 30, 2017, the global economy remained solid despite heightened geopolitical risk. The Japanese economy maintained moderate growth against the backdrop of recovering corporate earnings and the government’s fiscal spending, remaining in an economic expansion phase.
Under these circumstances, the SMK Group enjoyed steady growth in sales of connectors for the healthcare market, and sales of connectors for rearview cameras in the car electronics market were also solid. However, sales of products such as connectors for smartphones for the Chinese region, remote control units for set-top boxes for the U.S. market and touch panels for car electronics were sluggish partly due to intensified competition with other manufacturers.
Net sales for the first half decreased year on year despite efforts to launch new products proactively. Although initiatives were taken to reduce cost of sales and cut expenses, the sales drop led to a decline in operating profit.
Going forward, the SMK Group will strive to further improve its profitability by increasing productivity and cutting expenses, secure sales in its mainstay markets and increase revenue through new businesses. The SMK Group will not only respond to changes in the existing businesses but also proceed proactively with efforts to expand operations in new markets which are expected to grow in the medium to long term, such as the environment and energy, healthcare, wearable devices and IoT (Internet of Things), and to create new businesses by cooperating with partner companies and promoting Open Innovation.
Although the uncertainty in the business environment is expected to continue going forward, all employees are committed to working together to build a corporate structure that realizes sustainable growth through swift responses to changes in the business environment.
Performance Overview
To Our Shareholders and Investors
010_0284001642912.indd 2 2017/12/04 17:45:51

3 SEMI ANNUAL REPORT 2017
Net sales¥ 29,393
Million
Others¥162 Million
0.6%
Functional ComponentsDivision¥9,939 Million
33.8%
Touch Panel Division¥4,857 Million
16.5%
Connection SystemDivision
¥14,435 Million
49.1%
Sales of connectors in the information and communication markets increased year on year, as sales grew for connectors for tablets of customers in North America although connectors for smartphones struggled due to intensified competition with other connector manufacturers for supply to customers in the Chinese region. Sales of connectors in the car electronics market, which continues to show stable growth, rose steadily mainly for products for rearview cameras, with the accelerating development of car electronics serving as a tailwind. Sales of connectors for the industrial machinery market increased sharply year on year due to continued strong growth in connectors for the healthcare market.
Connection System Division
● Coaxial Connectors● Board to Board Connectors● FPC Connectors● Jacks
Major Products
FPC to Board Connectors “FB-9 Series”Applications:
Smartphones, Tablet PC, other mobile devices
*Others: businesses of other electronic parts, lease, real-estate rental, and worker dispatching undertakings.
Overview of Consolidated Results by Division(April 1, 2017 to September 30, 2017)
010_0284001642912.indd 3 2017/12/04 17:45:51

4SEMI ANNUAL REPORT 2017
Sales of remote control units, our mainstay products, remained solid for sanitary goods in Japan. However, sales of the products for set-top boxes dropped sharply year on year, affected by a decrease in sales volume to U.S. customers due to increased competition with other manufacturers of remote control units. As for units, sales increased year on year, as sales of automotive camera modules expanded steadily although products for U.S.-bound home equipment fell due to production adjustments by customers. Sales of switches slightly decreased year on year, as sales of switches for smartphones dropped due to order adjustments associated with changeovers to new smartphone models.
Functional Components Division
● Remote Control Units● Wireless Units● Switches● Camera Modules
Major Products
Bluetooth® Smart-supported Standard Voice Remote Control
Applications: Set-Top Box,
Home Network Devices
In the market for touch panels for car navigation systems and automotive center consoles, our mainstay products, the market environment continues to change significantly due to a shift in demand to capacitive models from resistive models. Despite new orders won for capacitive models and orders continuously received for touch panels for the industrial machinery market, such as for machine tools other than those for car electronics and for office equipment, sales of overall touch panels fell year on year because a decline in sales of resistive models was not fully offset.
Touch Panel Division
● Resistive Touch Panels● Capacitive Touch Panels● Optical Touch Panels
Major Products
Capacitive Touch Panel “CapDuo Touch”
Applications: Automotive Center Console,
Factory Automated (FA) Equipment, etc.
010_0284001642912.indd 4 2017/12/04 17:45:51

5 SEMI ANNUAL REPORT 2017
Saving labor, improving efficiency
Managing crop yieldsManaging quality
Agriculture and FisheriesMonitoring water supply and
sewerage systemsDetecting gas leaks
Managing parking lots
Infrastructure
Ensuring securityManaging disaster
preparedness
Offices and Buildings
Ensuring securityManaging home appliances
Monitoring people
Houses and Home Appliances
Home medical equipmentManaging personnel allocation
Increasing work efficiency
Medical Treatment and Nursing Care
Monitoring the indoor environment
Monitoring equipment failures
Factories
SMK’s Activity for IoT MarketSMK Corporation is focusing on developing products and proposing solutions for the Internet of Things (IoT) business, for which demand is expected to expand rapidly going forward.
SMK’s key strengths in the IoT business are hardware and software technologies for network connection, Human Machine Interface (HMI) technology for the realization of Home Automation, and miniature mounting, waterproof and precision molding technologies for device development. SMK is stepping up efforts to meet new communication standards, especially for wireless communication modules.
For differentiation from competitors, SMK promotes Open Innovation and strengthen collaborations beyond the electronic parts industry, with a view to expanding the IoT business.
SMK SolutionsCreating New Values
IP500™ Modules
Sigfox Modules
Topics
010_0284001642912.indd 5 2017/12/04 17:45:52

6SEMI ANNUAL REPORT 2017
Saving labor, improving efficiency
Managing crop yieldsManaging quality
Agriculture and Fisheries
Realizing traceabilityMonitoring drivers
Increasing work efficiency
Logistics/Distribution
Ensuring securityManaging home appliances
Monitoring people
Houses and Home Appliances
SMK joined the CEATEC JAPAN 2017 Cyber-Physical System (CPS) / Internet of Things (IoT) exhibition held at the Makuhari Messe convention center in Chiba for a four-day run from October 3 to 6.
Centering on the potentially expanding market such as Low Power Wide Area (LPWA)communication for the Internet of Things, SMK showcased Open Innovation activities and Home Automation among others, giving special consideration to allowing visitors to experience them through demonstrations.
SMK demonstrated a wide product lineup of LPWA communication modules and had many visitors recognize SMK’s competitive advantage in and the features of module for IP500TM, a LPWA network standard originated in Germany, which was displayed only by SMK. As a result, SMK’s booth drew far more visitors than the initial target.
SMK Exhibits at CEATEC JAPAN 2017
SMK SolutionsCreating New Values
Bluetooth® low energy Modules
Bluetooth® Smart Modules
010_0284001642912.indd 6 2017/12/04 17:45:54
7 SEMI ANNUAL REPORT 2017
Millions of yenThousands ofU.S. dollars
Assets As of March 312017
As of September 302017
As of September 302017
Current assets
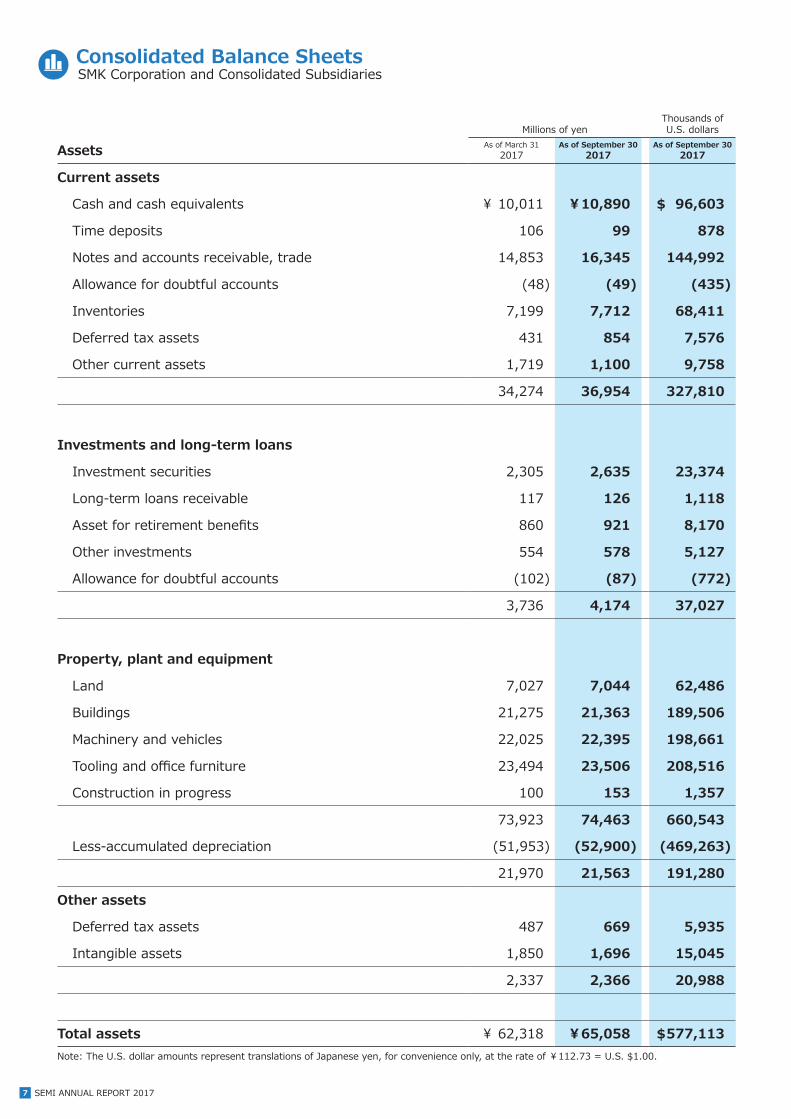
Cash and cash equivalents ¥ 10,011 ¥ 10,890 $ 96,603
Time deposits 106 99 878
Notes and accounts receivable, trade 14,853 16,345 144,992
Allowance for doubtful accounts (48) (49) (435)
Inventories 7,199 7,712 68,411
Deferred tax assets 431 854 7,576
Other current assets 1,719 1,100 9,758
34,274 36,954 327,810
Investments and long-term loans
Investment securities 2,305 2,635 23,374
Long-term loans receivable 117 126 1,118
Asset for retirement benefits 860 921 8,170
Other investments 554 578 5,127
Allowance for doubtful accounts (102) (87) (772)
3,736 4,174 37,027
Property, plant and equipment
Land 7,027 7,044 62,486
Buildings 21,275 21,363 189,506
Machinery and vehicles 22,025 22,395 198,661
Tooling and office furniture 23,494 23,506 208,516
Construction in progress 100 153 1,357
73,923 74,463 660,543
Less-accumulated depreciation (51,953) (52,900) (469,263)
21,970 21,563 191,280
Other assets
Deferred tax assets 487 669 5,935
Intangible assets 1,850 1,696 15,045
2,337 2,366 20,988
Total assets ¥ 62,318 ¥ 65,058 $ 577,113 Note: The U.S. dollar amounts represent translations of Japanese yen, for convenience only, at the rate of ¥112.73 = U.S. $1.00.
Consolidated Balance SheetsSMK Corporation and Consolidated Subsidiaries
010_0284001642912.indd 7 2017/12/04 17:45:54
8SEMI ANNUAL REPORT 2017
Millions of yenThousands ofU.S. dollars
Liabilities and net assets As of March 312017
As of September 302017
As of September 302017
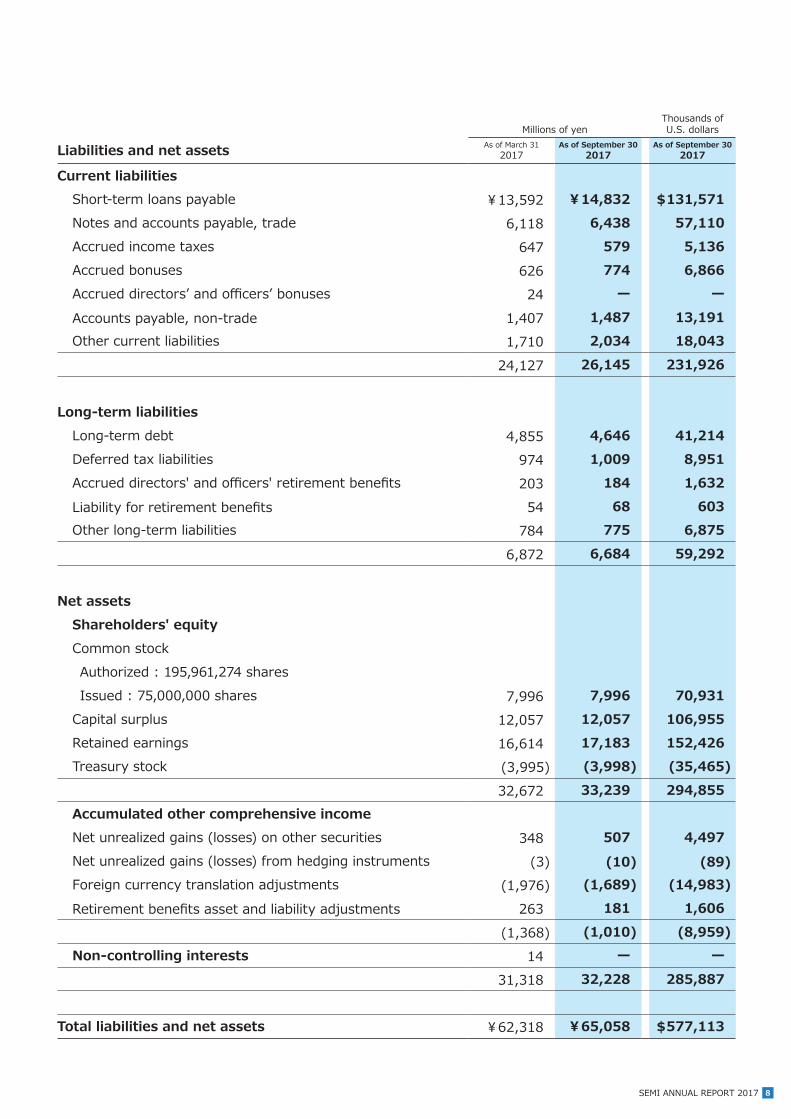
Current liabilitiesShort-term loans payable ¥ 13,592 ¥ 14,832 $ 131,571 Notes and accounts payable, trade 6,118 6,438 57,110 Accrued income taxes 647 579 5,136 Accrued bonuses 626 774 6,866 Accrued directors’ and officers’ bonuses 24 ー ー
Accounts payable, non-trade 1,407 1,487 13,191 Other current liabilities 1,710 2,034 18,043
24,127 26,145 231,926
Long-term liabilitiesLong-term debt 4,855 4,646 41,214 Deferred tax liabilities 974 1,009 8,951 Accrued directors' and officers' retirement benefits 203 184 1,632
Liability for retirement benefits 54 68 603 Other long-term liabilities 784 775 6,875
6,872 6,684 59,292
Net assetsShareholders' equityCommon stockAuthorized : 195,961,274 sharesIssued : 75,000,000 shares 7,996 7,996 70,931
Capital surplus 12,057 12,057 106,955 Retained earnings 16,614 17,183 152,426 Treasury stock (3,995) (3,998) (35,465)
32,672 33,239 294,855 Accumulated other comprehensive incomeNet unrealized gains (losses) on other securities 348 507 4,497 Net unrealized gains (losses) from hedging instruments (3) (10) (89) Foreign currency translation adjustments (1,976) (1,689) (14,983)
Retirement benefits asset and liability adjustments 263 181 1,606
(1,368) (1,010) (8,959) Non-controlling interests 14 ー ー
31,318 32,228 285,887
Total liabilities and net assets ¥ 62,318 ¥ 65,058 $ 577,113
010_0284001642912.indd 8 2017/12/04 17:45:54

9 SEMI ANNUAL REPORT 2017
Millions of yenThousands ofU.S. dollars
Six months ended September 30
2016
Six months ended September 30
2017
Six months ended September 30
2017
Profit (loss) ¥ (1,102) ¥ 885 $ 7,851 Other comprehensive income
Net unrealized gains (losses) on other securities (53) 158 1,402 Net unrealized gains (losses) from hedging instruments ー (6) (53) Foreign currency translation adjustments (1,263) 286 2,537 Retirement benefits asset and liability adjustments (54) (81) (719) Total other comprehensive income (1,371) 357 3,167
Comprehensive income ¥ (2,473) ¥ 1,243 $ 11,026 Total comprehensive income attributable to:
Owners of parent ¥ (2,451) ¥ 1,257 $ 11,151 Non-controlling interests (22) (14) (124)
Millions of yenThousands ofU.S. dollars
Six months ended September 30
2016
Six months ended September 30
2017
Six months ended September 30
2017
Net sales ¥ 31,708 ¥ 29,393 $ 260,738 Cost of sales 26,036 23,839 211,470 Selling, general and administrative expenses 4,924 4,954 43,946 Operating income 747 598 5,305
Other incomeInterest and dividend income 45 48 426 Rent income 624 614 5,447 Foreign exchange gain, net ー 72 639 Gain on sales of fixed assets 40 41 364 Gain on sales of investment securities 31 ー ーGain on redemption of investment securities ー 46 408 Gain on reversal of share subscription rights 20 ー ーOther 198 151 1,339
Total other income 961 974 8,640
Other expensesInterest expense 67 55 488 Rent expense 297 280 2,484 Foreign exchange loss, net 2,021 ー ー Loss on disposal of fixed assets 136 58 515 Loss on valuation of investment securities ー 178 1,579 Loss on impairment of fixed assets ー 271 2,404 Other 80 54 479
Total other expenses 2,603 899 7,975
Profit (loss) before income taxes (895) 674 5,979 Income taxes
Current 274 380 3,371 Deferred (67) (591) (5,243)
Profit (loss) (1,102) 885 7,851 Loss attributable to non-controlling interests (22) (14) (124) Profit (loss) attributable to owners of parent ¥ (1,079) ¥ 900 $ 7,984
Yen U.S. dollars
Per share dataProfit (loss) attributable to owners of parent Basic ¥ (15.87) ¥ 13.62 $ 0.12
Note: The U.S. dollar amounts represent translations of Japanese yen, for convenience only, at the rate of ¥112.73 = U.S. $1.00.
Consolidated Statements of IncomeSMK Corporation and Consolidated Subsidiaries
Consolidated Statements of Comprehensive IncomeSMK Corporation and Consolidated Subsidiaries
010_0284001642912.indd 9 2017/12/04 17:45:54

10SEMI ANNUAL REPORT 2017
Millions of yenThousands ofU.S. dollars
Six months ended September 30
2016
Six months ended September 30
2017
Six months ended September 30
2017
Cash flows from operating activitiesProfit (loss) before income taxes ¥ (895) ¥ 674 $ 5,979 Depreciation and amortization 2,136 2,085 18,496 Loss on impairment of fixed assets ー 271 2,404 Amortization of goodwill 52 ー ーIncrease (decrease) in accrued bonuses (246) 144 1,277 Increase (decrease) in accrued directors' and officers' retirement benefits 11 (19) (169) Increase (decrease) in asset and liability for retirement benefits (69) (166) (1,473) Interest and dividend income (45) (48) (426) Interest expense 67 55 488 (Gain) loss on sales of investment securities (31) (0) (3) (Gain) loss on redemption of investment securities ー (46) (408) (Gain) loss on sales of fixed assets (40) (40) (355) (Gain) loss on revaluation of investment securities ー 178 1,579 Loss on disposal of fixed assets 136 58 515 (Increase) decrease in notes and accounts receivable, trade (2,106) (1,183) (10,494) (Increase) decrease in inventories (314) (416) (3,690) Increase (decrease) in notes and accounts payable, trade 3,321 (105) (931) Increase (decrease) in accounts receivable, non-trade 880 250 2,218 Increase (decrease) in accounts payable, non-trade (2,399) 248 2,200 Other 131 462 4,098
Subtotal 588 2,402 21,308 Interest and dividends received 46 48 426 Interest paid (62) (54) (479) Income taxes paid (328) (436) (3,868)
Net cash provided by (used in) operating activities 243 1,959 17,378 Cash flows from investing activities
Payments into time deposits (44) (39) (346) Proceeds from time deposits 40 49 435 Purchases of fixed assets (2,480) (1,821) (16,154) Proceeds from sales of fixed assets 159 62 550 Payments for disposal of fixed assets ー (29) (257) Purchases of intangible fixed assets (134) (13) (115) Purchases of investment securities (25) (218) (1,934) Proceeds from sales of investment securities 50 0 0Proceeds from redemption of investment securities ー 68 603 Payments for execution of loans (25) (20) (177) Collection of loans receivable 24 47 417
Net cash provided by (used in) investing activities (2,434) (1,914) (16,979) Cash flows from financing activities
Increase (decrease) in short-term loans payable 5,395 487 4,320 Proceeds from long-term debt 800 1,950 17,298 Payments of long-term debt (1,394) (1,408) (12,490) Purchases of treasury stock (1,575) (1) (9) Proceeds from sales of treasury stock 24 ー ーDividends paid (559) (329) (2,918)
Net cash provided by (used in) financing activities 2,690 697 6,183 Effect of exchange rate changes on cash and cash equivalents (164) 136 1,206 Increase (decrease) in cash and cash equivalents 335 878 7,789 Cash and cash equivalents at beginning of the year 10,668 10,011 88,805 Cash and cash equivalents at end of six months and the year ¥ 11,003 ¥ 10,890 $ 96,603 Note: The U.S. dollar amounts represent translations of Japanese yen, for convenience only, at the rate of ¥112.73 = U.S. $1.00.
Consolidated Statements of Cash FlowsSMK Corporation and Consolidated Subsidiaries
010_0284001642912.indd 10 2017/12/04 17:45:54

5-5, Togoshi 6-chome, Shinagawa-ku, Tokyo 142-8511, JAPANTelephone: 81-3-3785-1111 Fax: 81-3-3785-1878
https://www.smk.co.jp/
Shares and Shareholders
Officer Introduction
Corporate DataName SMK Corporation
Established April 3, 1925
Registered January 15, 1929
Primary business Manufacture and sale ofvarious parts forelectro-communication deviceand electronic equipment
Capital ¥7,996,828,021
Stock exchange listing Tokyo Stock Exchange
Administrator ofshareholders register
Mitsubishi UFJ Trust and Banking Corporation
Independent auditors Ernst & Young ShinNihon LLCTokyo, Japan
Employees (SMK-Group) 5,968
Head office 5-5, Togoshi 6-chome, Shinagawa-ku,Tokyo 142-8511, JapanTel : +81-3-3785-1111Fax : +81-3-3785-1878
Authorized shares 195,961,274Issued shares 75,000,000Number of shareholders 6,974
Major shareholders (top ten) Shares owned(1,000 shares)
Percentageof shares (%)
SMK Cooperating Company Share Holding Association 3,376 5.10
Mizuho Bank, Ltd. 3,287 4.96
Nippon Life Insurance Company 3,241 4.89
Dai Nippon Printing Co., Ltd. 3,200 4.83
The Bank of Tokyo-Mitsubishi UFJ, Ltd. 2,508 3.79
SMK Employees Share Holding Association 1,922 2.90
Mitsubishi UFJ Trust and Banking Corporation 1,800 2.72
The Showa Ikeda Memorial Foundation 1,500 2.26
Japan Trustee Services Bank, Ltd.(Trust Account) 1,441 2.18
Terutaka Ikeda 1,420 2.14
DirectorsPresident,Chief Executive Officer andChief Operating Officer Yasumitsu IkedaDirector and Executive Deputy President,Chief Technology Officer Yoshiyuki Kaku
Director and Executive Vice President Mikio Wakabayashi
Director and Executive Vice President Paul Evans
Director Toshio Nakamura
Director Kaoru Ishikawa
Auditors
Auditor and Chairman of Auditors’ Meeting Tetsuya Nakamura
Auditor Naru Nakashima
Auditor Ichiro Shimizu
Auditor Morikazu Fukui
Corporate Executive Officers
Executive Vice President, Chief Financial Officer Kohei Ohgaki
Executive Vice President Shigechika Yanagi
Vice President Hideo Matsumoto
Vice President Hiroshi Miyakawa
Vice President Takemi Ishibashi
Vice President Masanobu Ikeo
Vice President Mitsuhiko Goto
Vice President Tetsuo Hara
Vice President Mitsuyuki Masubuchi
Vice President, Chief Information Officer Hiroshi Usami
Vice President Atsushi Obinata
Vice President Fumikazu Hata
Note: SMK holds 8,749 thousand shares of treasury stock, but these are excluded from the above list. Figures for percentage of shares are calculated excluding the treasury stock.
*The Bluetooth® word mark and logos are registered trademarks owned by Bluetooth SIG, Inc. and any use of such marks by SMK Corporation is under license.*ECHONETLite is a trademark of the ECHONET CONSORTIUM.*USB Type-CTM is a trademark of USB Implementers Forum.*Other products and company names listed in this report are the registered trademarks or trademarks of their respective holders.
Corporate Information(As of September 30, 2017)
010_0284001642912.indd 1 2017/12/04 17:45:50