Embed Size (px)
Citation preview

Semantic Search Interface for an IntelligentNetwork Management System–A CaseStudy
Kasper Apajalahti
School of Electrical Engineering
Thesis submitted for examination for the degree of Master ofScience in Technology.
Espoo 30.9.2015
Thesis supervisor:
Prof. Eero Hyvönen
Thesis advisor:
D.Sc. (Tech.) Vilho Räisänen
aalto universityschool of electrical engineering
abstract of themaster’s thesis
Author: Kasper Apajalahti
Title: Semantic Search Interface for an Intelligent Network ManagementSystem–A Case Study
Date: 30.9.2015 Language: English Number of pages: 12+89
Department of Computer Science
Professorship: Media Technology
Supervisor: Prof. Eero Hyvönen
Advisor: D.Sc. (Tech.) Vilho Räisänen
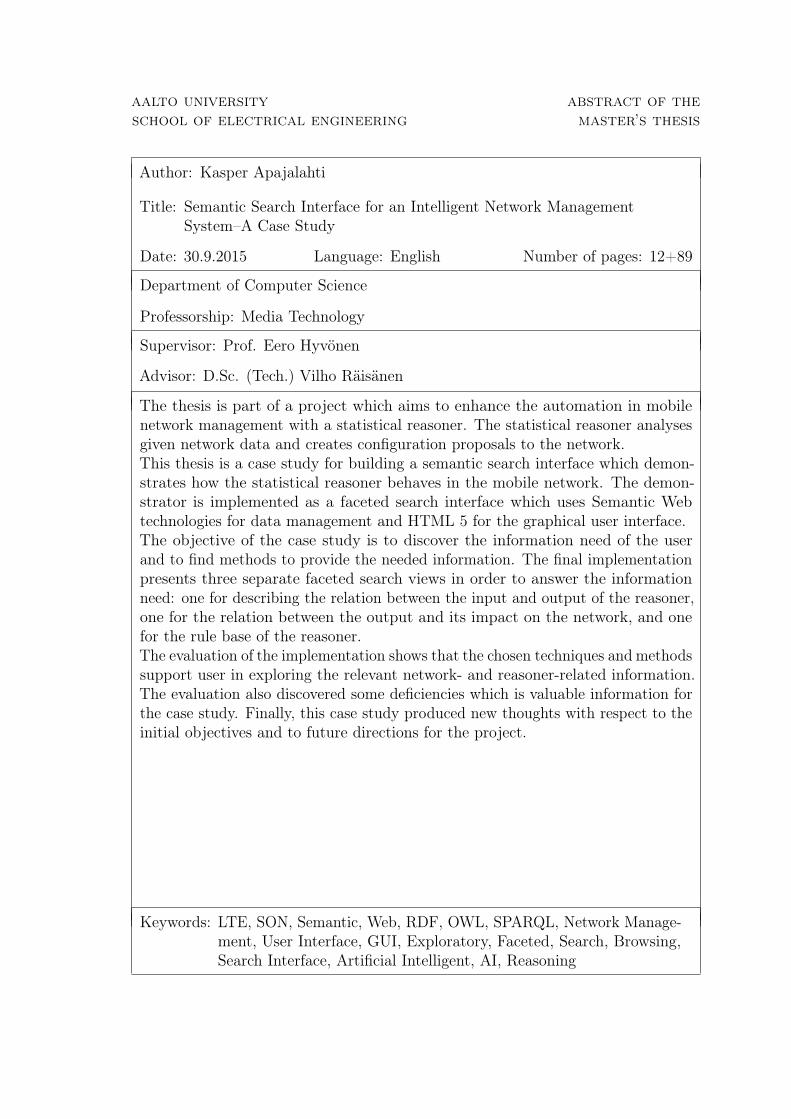
The thesis is part of a project which aims to enhance the automation in mobilenetwork management with a statistical reasoner. The statistical reasoner analysesgiven network data and creates configuration proposals to the network.This thesis is a case study for building a semantic search interface which demon-strates how the statistical reasoner behaves in the mobile network. The demon-strator is implemented as a faceted search interface which uses Semantic Webtechnologies for data management and HTML 5 for the graphical user interface.The objective of the case study is to discover the information need of the userand to find methods to provide the needed information. The final implementationpresents three separate faceted search views in order to answer the informationneed: one for describing the relation between the input and output of the reasoner,one for the relation between the output and its impact on the network, and onefor the rule base of the reasoner.The evaluation of the implementation shows that the chosen techniques and methodssupport user in exploring the relevant network- and reasoner-related information.The evaluation also discovered some deficiencies which is valuable information forthe case study. Finally, this case study produced new thoughts with respect to theinitial objectives and to future directions for the project.
Keywords: LTE, SON, Semantic, Web, RDF, OWL, SPARQL, Network Manage-ment, User Interface, GUI, Exploratory, Faceted, Search, Browsing,Search Interface, Artificial Intelligent, AI, Reasoning

aalto-yliopistosähkötekniikan korkeakoulu
diplomityöntiivistelmä
Tekijä: Kasper Apajalahti
Työn nimi: Tapaustutkimus: Semanttinen hakukäyttöliittymä älykkääseenverkonhallintajärjestelmään
Päivämäärä: 30.9.2015 Kieli: Englanti Sivumäärä: 12+89
Tietotekniikan laitos
Professuuri: Mediatekniikka
Työn valvoja: Prof. Eero Hyvönen
Työn ohjaaja: TkT Vilho Räisänen
Tämä diplomityö on osa projektia, jossa tutkitaan, miten tilastollisella päättelijällävoidaan parantaa mobiiliverkon automaattista hallintaa. Tilastollinen päättelijäanalysoi mobiiliverkosta saatavaa dataa ja tuottaa muutosehdotuksia mobiiliverkonparametreihin.Diplomityö toteutaan tapaustutkimuksena, jossa suunnitellaan ja toteutaan semant-tinen hakukäyttöliittymä havainnollistamaan tilastollisen päättelijän toimintaa.Käyttöliittymä toteutetaan moninäkymähaulla, joka hyödyntää Semanttisen Webintekniikoita tiedonhallinnassa ja HTML 5 -tekniikoita graafisessa käyttöliittymässä.Tapaustutkimuksen tavoitteena on löytää käyttäjän tiedontarve sekä menetelmätolennaisen tiedon tarjoamiselle. Toteutettu hakukäyttöliittymä esittelee kolmeerillistä moninäkymähakua, joilla vastataan käyttäjän tiedontarpeeseen: ensimmäi-nen näkymä kuvaa päättelijän syötteen ja vasteen välistä suhdetta, toinen kuvaavasteen ja sen vaikutusten suhdetta ja kolmas kuvaa päättelijän sääntökantaa.Sovelluksen arviointi osoittaa, että valitut tekniikat ja menetelmät tukevat hyvinkäyttäjän tiedontarvetta ja tiedonhakuprosessia. Arvionnissa käytiin läpi myösjoitakin toteutuksen puutteita, jotka antoivat uutta arvokasta tietoa tapaustutki-mukselle. Lopussa esitellään uusia ajatuksia liittyen tutkimuksen tavoitteisiin sekämahdollisiin jatkotutkimusaiheisiin.
Avainsanat: Semanttinen, Web, LTE, SON, mobiiliverkko, tekoäly, käyttöliit-tymä, tiedonhaku, tapaustutkimus, RDF, OWL, SPARQL, tutkivahaku, moninäkymähaku, fasettihaku, fasettiselaus, fasetti

iv
Preface
It has been a pleasure for me to do the thesis from such an interesting research topic.This project has been a great opportunity for me to learn technical aspects of mobilenetwork management, knowledge engineering, and search interfaces.
I want to thank my employer Nokia Networks for giving me this opportunity. Also, Ithank my instructor Vilho Räisänen for his feedback and guidance throughout theproject. My thanks go also to my supervisor Eero Hyvönen for his guidance andsupport during the thesis work and throughout my studies.
I would also like to thank my family for all the valuable help and support during mystudies. Finally, special thanks go to Mirva for all the love and support during theseyears.
Espoo, September 2015
Kasper Apajalahti

v
Contents
Abstract ii
Abstract (in Finnish) iii
Preface iv
Contents v
I Background 1
1 Introduction 2
1.1 Overview . . . . . . . . . . . . . . . . . . . . . . . . . . . . . . . . . . 2
1.2 Motivation . . . . . . . . . . . . . . . . . . . . . . . . . . . . . . . . . 2
1.3 Outline . . . . . . . . . . . . . . . . . . . . . . . . . . . . . . . . . . . 3
2 Telecommunication Network Technologies 5
2.1 Overview . . . . . . . . . . . . . . . . . . . . . . . . . . . . . . . . . . 5
2.1.1 Mobile Network . . . . . . . . . . . . . . . . . . . . . . . . . . 5
2.1.2 Long Term Evolution (LTE) . . . . . . . . . . . . . . . . . . . 6
2.1.3 Network Management . . . . . . . . . . . . . . . . . . . . . . 6
2.2 Self-Organizing Network (SON) . . . . . . . . . . . . . . . . . . . . . 8
2.2.1 SON Overview . . . . . . . . . . . . . . . . . . . . . . . . . . 8
2.2.2 Self-configuration . . . . . . . . . . . . . . . . . . . . . . . . . 8
2.2.3 Self-optimization . . . . . . . . . . . . . . . . . . . . . . . . . 9

vi
2.2.4 Self-healing . . . . . . . . . . . . . . . . . . . . . . . . . . . . 9
2.2.5 Coordination and Co-design of SON Functions . . . . . . . . . 10
2.3 SON Evolution . . . . . . . . . . . . . . . . . . . . . . . . . . . . . . 11
2.3.1 Challenges in SON . . . . . . . . . . . . . . . . . . . . . . . . 11
2.3.2 SON Future . . . . . . . . . . . . . . . . . . . . . . . . . . . . 12
2.3.3 Vision of Cognitive Network . . . . . . . . . . . . . . . . . . . 12
3 Knowledge Engineering 13
3.1 Methodology . . . . . . . . . . . . . . . . . . . . . . . . . . . . . . . 13
3.1.1 Knowledge Representation . . . . . . . . . . . . . . . . . . . . 13
3.1.2 Ontology . . . . . . . . . . . . . . . . . . . . . . . . . . . . . . 14
3.2 Semantic Web . . . . . . . . . . . . . . . . . . . . . . . . . . . . . . . 14
3.2.1 Semantic Web Overview . . . . . . . . . . . . . . . . . . . . . 14
3.2.2 RDF and RDFS . . . . . . . . . . . . . . . . . . . . . . . . . . 15
3.2.3 OWL . . . . . . . . . . . . . . . . . . . . . . . . . . . . . . . . 15
3.2.4 SKOS . . . . . . . . . . . . . . . . . . . . . . . . . . . . . . . 16
3.2.5 SPARQL . . . . . . . . . . . . . . . . . . . . . . . . . . . . . . 17
3.3 Markov Logic Network . . . . . . . . . . . . . . . . . . . . . . . . . . 17
3.4 Knowledge Systems in Telecommunication Field . . . . . . . . . . . . 18
3.4.1 RDF Dataset for Mobile Network . . . . . . . . . . . . . . . . 18
3.4.2 OWL Reasoner for SON Conflict Analysis . . . . . . . . . . . 19
3.4.3 MLN Reasoner in SON Verification . . . . . . . . . . . . . . . 19
4 Visualization and Interaction Methods 20
vii
4.1 Visualization Techniques . . . . . . . . . . . . . . . . . . . . . . . . . 20
4.2 Exploratory Search . . . . . . . . . . . . . . . . . . . . . . . . . . . . 20
4.2.1 Overview . . . . . . . . . . . . . . . . . . . . . . . . . . . . . 20
4.2.2 Search Activities . . . . . . . . . . . . . . . . . . . . . . . . . 21
4.3 Faceted Search . . . . . . . . . . . . . . . . . . . . . . . . . . . . . . 22
4.3.1 Overview . . . . . . . . . . . . . . . . . . . . . . . . . . . . . 22
4.3.2 Determination of Facets . . . . . . . . . . . . . . . . . . . . . 23
4.3.3 Semantic Faceted Search . . . . . . . . . . . . . . . . . . . . . 24
4.3.4 Fuzzy Faceted Search . . . . . . . . . . . . . . . . . . . . . . . 24
II Design and Preliminaries 27
5 System Design 28
5.1 System Description . . . . . . . . . . . . . . . . . . . . . . . . . . . . 28
5.2 MLN Reasoner . . . . . . . . . . . . . . . . . . . . . . . . . . . . . . 28
5.3 Use Case Analysis . . . . . . . . . . . . . . . . . . . . . . . . . . . . . 30
5.4 Demonstrator Architecture . . . . . . . . . . . . . . . . . . . . . . . . 31
5.4.1 Overview . . . . . . . . . . . . . . . . . . . . . . . . . . . . . 31
5.4.2 Architecture . . . . . . . . . . . . . . . . . . . . . . . . . . . . 31
5.5 Demonstrator Views . . . . . . . . . . . . . . . . . . . . . . . . . . . 32
5.5.1 Cell Status View . . . . . . . . . . . . . . . . . . . . . . . . . 32
5.5.2 Cell Event View . . . . . . . . . . . . . . . . . . . . . . . . . . 34
5.5.3 Rule View . . . . . . . . . . . . . . . . . . . . . . . . . . . . . 35

viii
5.5.4 MLN Rule Updates . . . . . . . . . . . . . . . . . . . . . . . . 36
5.6 Demonstrator Ontology . . . . . . . . . . . . . . . . . . . . . . . . . . 36
5.6.1 Network Ontology . . . . . . . . . . . . . . . . . . . . . . . . 36
5.6.2 MLN Ontology . . . . . . . . . . . . . . . . . . . . . . . . . . 37
5.6.3 Facet Ontologies . . . . . . . . . . . . . . . . . . . . . . . . . 40
6 Tools and Libraries for the Demonstrator 42
6.1 Ontology Management . . . . . . . . . . . . . . . . . . . . . . . . . . 42
6.1.1 SPARQL Engine . . . . . . . . . . . . . . . . . . . . . . . . . 42
6.1.2 DL Reasoners for OWL 2 Ontology . . . . . . . . . . . . . . . 42
6.2 Graphical User Interface . . . . . . . . . . . . . . . . . . . . . . . . . 43
6.2.1 Sortable Table . . . . . . . . . . . . . . . . . . . . . . . . . . . 43
6.2.2 Network Graph . . . . . . . . . . . . . . . . . . . . . . . . . . 43
6.2.3 Timeline . . . . . . . . . . . . . . . . . . . . . . . . . . . . . . 44
6.2.4 Faceted Browsing . . . . . . . . . . . . . . . . . . . . . . . . . 45
III Implementation 47
7 Graphical User Interface 48
7.1 GUI Overview . . . . . . . . . . . . . . . . . . . . . . . . . . . . . . . 48
7.2 Cell States . . . . . . . . . . . . . . . . . . . . . . . . . . . . . . . . . 49
7.2.1 Description . . . . . . . . . . . . . . . . . . . . . . . . . . . . 49
7.2.2 Use Case: Selecting Facets . . . . . . . . . . . . . . . . . . . . 50
7.3 Cell Events . . . . . . . . . . . . . . . . . . . . . . . . . . . . . . . . 53

ix
7.3.1 Description . . . . . . . . . . . . . . . . . . . . . . . . . . . . 53
7.3.2 Use Case: Selecting Facets . . . . . . . . . . . . . . . . . . . . 54
7.4 Rules . . . . . . . . . . . . . . . . . . . . . . . . . . . . . . . . . . . . 56
7.4.1 Description . . . . . . . . . . . . . . . . . . . . . . . . . . . . 56
7.4.2 Use Case: Selecting Facets . . . . . . . . . . . . . . . . . . . . 56
7.4.3 Use Case: Creating a Rule . . . . . . . . . . . . . . . . . . . . 57
7.4.4 Use Case: Updating Weights . . . . . . . . . . . . . . . . . . . 58
7.4.5 Use Case: Removing Individual Rules . . . . . . . . . . . . . . 59
7.4.6 Use Case: Removing a Set of Rules . . . . . . . . . . . . . . . 60
7.5 Plugins for the GUI . . . . . . . . . . . . . . . . . . . . . . . . . . . . 61
8 Data Management 63
8.1 Data Sequence Diagram . . . . . . . . . . . . . . . . . . . . . . . . . 63
8.2 Input Data to RDF . . . . . . . . . . . . . . . . . . . . . . . . . . . . 63
8.3 Consistency Checking of the Ontology . . . . . . . . . . . . . . . . . 67
8.4 SPARQL Server . . . . . . . . . . . . . . . . . . . . . . . . . . . . . . 67
8.5 Creating Facets . . . . . . . . . . . . . . . . . . . . . . . . . . . . . . 67
8.6 SPARQL Patterns for the GUI . . . . . . . . . . . . . . . . . . . . . . 68
8.6.1 Result Set . . . . . . . . . . . . . . . . . . . . . . . . . . . . . 68
8.6.2 Facets . . . . . . . . . . . . . . . . . . . . . . . . . . . . . . . 69
8.6.3 Rule Updates . . . . . . . . . . . . . . . . . . . . . . . . . . . 69
IV Discussion 71

x
9 Evaluation 72
9.1 Information Quality . . . . . . . . . . . . . . . . . . . . . . . . . . . . 72
9.1.1 Implementation . . . . . . . . . . . . . . . . . . . . . . . . . . 72
9.1.2 Deficiencies . . . . . . . . . . . . . . . . . . . . . . . . . . . . 73
9.2 Facets . . . . . . . . . . . . . . . . . . . . . . . . . . . . . . . . . . . 73
9.2.1 Implementation . . . . . . . . . . . . . . . . . . . . . . . . . . 73
9.2.2 Deficiencies . . . . . . . . . . . . . . . . . . . . . . . . . . . . 74
9.3 Visualization Methods . . . . . . . . . . . . . . . . . . . . . . . . . . 75
9.3.1 Implementation . . . . . . . . . . . . . . . . . . . . . . . . . . 75
9.3.2 Deficiencies . . . . . . . . . . . . . . . . . . . . . . . . . . . . 75
9.4 Other Functionality . . . . . . . . . . . . . . . . . . . . . . . . . . . . 75
9.4.1 Implementation . . . . . . . . . . . . . . . . . . . . . . . . . . 75
9.4.2 Deficiencies . . . . . . . . . . . . . . . . . . . . . . . . . . . . 76
9.5 Scalability . . . . . . . . . . . . . . . . . . . . . . . . . . . . . . . . . 76
9.5.1 Implementation . . . . . . . . . . . . . . . . . . . . . . . . . . 76
9.5.2 Deficiencies . . . . . . . . . . . . . . . . . . . . . . . . . . . . 77
10 Conclusion 78
10.1 Future Work . . . . . . . . . . . . . . . . . . . . . . . . . . . . . . . . 78
10.1.1 System Management with High-level Goals . . . . . . . . . . . 78
10.1.2 Utilizing Linked Data in Reasoning . . . . . . . . . . . . . . . 78
10.2 Summary . . . . . . . . . . . . . . . . . . . . . . . . . . . . . . . . . 79
A Appendix SPARQL Update Generating Indicator Facets 85

xi
B Appendix SPARQL Update Generating Relations Between FacetValues and Instances 86
C Appendix SPARQL Update for Creating a New Rule 86
D Appendix SPARQL Updates for Modifying and Removing Rules 87
xii
Abbreviations
3GPP 3rd Generation Partnership ProjectANR Automatic Neighbor RelationBTS Base Transceiver StationCM Configuration ManagementCQI Channel Quality IndicatorDL Description LogicDMS Domain Management SystemeNB E-UTRAN Node BEPC Evolved Packet CoreE-UTRAN Evolved Universal Terrestrial Radio Access NetworkFM Fault ManagementFOL First-order LogicKPI Key Performance IndicatorKR Knowledge RepresentationLTE Long Term EvolutionMLB Mobile Load BalancingMLN Markov Logic NetworkMRO Mobility Robustness OptimizationNMS Network Management SystemOAM Operation, Administration and MaintenanceOPEX Operating ExpenseOWL Web Ontology LanguagePM Performance ManagementRDF Resource Description FrameworkRET Remote Electrical TiltRLF Radio Link FailureSKOS Simple Knowledge Organization SystemSNR Signal to Noise RatioSON Self-Organizing NetworkSPARQL The SPARQL Protocol and RDF Query LanguageTxp Transmit PowerUE User EquipmentUMTS Universal Mobile Telecommunications System

Part I
Background

2
1 Introduction
1.1 Overview
Mobile networks have rapidly become a crucial part of our everyday life and yet theirsignificance to us will increase in the future. Already seven billion mobile phones havebeen subscribed globally while the majority (65 %) of new mobile phones sold aresmart phones [1]. The growth is expected to be even larger in the future. Especiallymobile data traffic (downlink) is expected to explode compared with the currentsituation. [1][2][3]
Growing complexity of telecommunication networks requires more automation fromthe network management layer. Currently researched and gradually standardizedtechnology in telecommunication field is Self-Organizing Networks (SON) whichalready solves automatically some management tasks in a limited context. In additionto the SON technology, there is also effort to create fully automated managementsystems (autonomic computing systems) where human intervention is minimized[3][4][5].
As the complexity and level of automation rises in network management systems, theywill also become less understandable to human. However, it is crucial that humanoperator monitors and controls the system behaviour even though the autonomicsystem could solve the majority of management tasks. The human operator is neededfor example to verify the functionality and handle fault situations of the system.Thus, an autonomic computing system needs special attention on a user interfaceconstruction because the complex functionality of the system needs to be transparentto the user. [6]
1.2 Motivation
This thesis will be part of a project which aims to improve automation in a mobilenetwork management system by using statistical relational learning [7]. Implementa-tion is done with Markov Logic Network (MLN) [8] which has a weighted rule basefor modelling the uncertainty and logical relations of a mobile (cellular) network.With respect to network performance measurements, an MLN reasoner is used toinfer optimal configurations to cells and to learn better weights in the rule base.
Besides the MLN reasoning system, an important aspect in this project is to demon-strate the behaviour of the reasoner to a human user. First, it is important thatanother researcher or developer learns and understands how the reasoner works inorder to enhance the functionality of the reasoner. Second, the automated manage-

3
ment system should be under human control and thus the human operator shouldalso understand how the reasoner behaves.
The thesis focuses on creating a case study about the demonstrator. More precisely,the case study is about building a semantic search interface which provides interactiveinformation exploration for the user. The search interface is built with facetedbrowsing activities and with visualization methods which support user’s informationexploration. Data management in this case study is handled with Semantic Webtechnologies to provide flexible facet creation and representation of relational data(network- and MLN-related data).
Case study is based on five research questions which relate to the functionality ofthe semantic search interface:
1. What information is needed?
2. Which visualization methods support the information need?
3. Which facets support the information need?
4. What other functionality supports the information need?
5. How to provide scalability for the search interface?
The first research question, the information need, is analysed before the following threequestions (visualization methods, facets, and other functionality) can be examined.The final research question, scalability, relates to data model design which enablesthe extension and modification of the demonstrator.
1.3 Outline
This thesis is divided into following parts: background, design and preliminaries,implementation, and discussion. Background part (I) introduces relevant backgroundinformation for the case study, such as telecommunication network technologies(including automated management systems), knowledge engineering, and user-centricinformation exploration.
Design and preliminaries part (II) describes the system design including the underlyingMLN reasoning system and the design of the demonstrator. Moreover, this partanalyses some tools and libraries that can be used in the data management and inthe GUI.

4
Implementation part (III) presents the application by first presenting data processingmethods in the demonstrator and then describing the graphical user interface withpractical examples.
Finally, discussion part (IV) evaluates the implementation with respect to researchquestions and then summarises the case study.

5
2 Telecommunication Network Technologies
This section gives an overview to mobile network technologies. First, the notion ofthe mobile network is presented by describing its basic components, introducing theLong Term Evolution (LTE) standard and explaining the process in mobile networkmanagement. Second, an automation technology for mobile network management,Self-Organizing Network (SON), is introduced. Finally, there is a discussion aboutfuture trends in SON and generally in automatic mobile network management.
2.1 Overview
2.1.1 Mobile Network
A mobile network is run by a network operator and it is used for a wireless com-munication between user equipments (UE) such as mobile phones and tablets. Aconnection from a UE to a mobile network is enabled with Base Transceiver Stations(BTS) which operator has located densely in order to provide better coverage areas forcustomers. The coverage areas that a BTS creates are called cells. Basically, cells aregenerated with BTS antennas and thus the shape and size of cell areas are dependenton (directional) antenna parameters such as tilt (antenna angle), transmission power,and beam width. [9]
A UE is typically connected to one cell at a time. By default, it is connected toa cell with the highest signal to noise ratio (SNR). Whenever SNR is decreasingunder some threshold value, for example when a user is moving to the edge of a cellarea, the connection is transferred to a neighbouring cell with higher SNR. [9] Thisaction is called handover and it is provided by allowing neighbouring cells to haveoverlapping areas. Figure 1 illustrates a simple case in which a UE is moving awayfrom the cell it is connected to (Cell1) and finally does a handover (to Cell2) at theoverlapping area of the two cells.
Figure 1: UE handover when moving from one cell area to another

6
2.1.2 Long Term Evolution (LTE)
LTE is a 4G communication standard and the latest standard for a radio accessnetwork. It is evolved from the 3G technology, Universal Mobile TelecommunicationsSystem (UMTS). Compared with UMTS, LTE offers features such as a higher datarate, lower transmission latency, lower cost per bit, simplified network architecture,and packet optimized radio access networks [3][10]. Unlike UMTS, LTE does notsupport a circuit-switched domain but instead uses a packet-switched domain alsofor voice calls (voice over IP). [9][10]
In figure 2 can be seen a simplified LTE network architecture. As discussed in theprevious section, UEs are interacting with base stations which are called eNodeBs oreNBs in LTE network. eNBs are communicating with X2 interface with each otherand together they are forming a network called Evolved Universal Terrestrial RadioAccess Network (E-UTRAN). An S1 interface connects eNBs to an IP-based corenetwork, Evolved Packet Core (EPC). An EPC contains components for UE-relateddata handling such as authentication and IP address allocation. [10] [11]
Figure 2: LTE network architecture [11]
2.1.3 Network Management
Management in a mobile network is handled with an architecture called operation,administration and maintenance architecture (OAM) which is used to control networkbehaviour. OAM can be divided into two levels: a domain management system

7
(DMS) and network management system (NMS). A DMS monitors the states of thevendor-specific network elements (eNBs and EPC components) and controls theirconfigurations, such as tilt angles, transmission powers, and beam widths. AlthougheNBs can communicate with each other directly via X2 interface, DMS can controlonly network elements under its own domain. [3]
An NMS is an integration of various vendor-specific DMSs and with the NMS it ispossible to control network elements in multiple domains. In figure 3 is shown theOAM architecture with interfaces between DMS and NMS (ltf-N) and between DMSand network elements (ltf-S). [3]
Figure 3: OAM architecture [3]
Data produced by network elements can be divided into performance- , fault- andconfiguration management data (PM, FM, and CM). PM is used in monitoringand analysing the performance of network elements such as signal quality, energyconsumption, and handover performance. FM is operating with network problemsincluding alarms and faults. CM provides data about configurations and it enablesremote configuration to network element parameters. [3]
Measuring and analysing the network performance is a complex task as there ishuge amount of data and correlations with other data elements. Therefore, PMdata is usually processed with algorithms to more informative measurements. Thesemeasurements are called key performance indicators (KPIs) which give an overviewof cell states. For example, one KPI describes number of radio link failures (RLF)per interval and another KPI describes channel quality (CQI) for a cell. [3] Both
8
CQI and RLF are used in this project for network performance analysis.
2.2 Self-Organizing Network (SON)
Along with LTE, Self-Organizing Network (SON) is a new standard which definesautomation for network management. SON aims to reduce operating expenses byautomating management tasks. [12] Also, the benefits of SON is improvement innetwork performance by having proactive actions and faster reactions to incidents.[13]
This section introduces the SON concepts by first giving an overview of the technologyand then more detailed description of three different categories of SON functions.Finally, there is a description of SON coordination which is a technology and researchtopic examining the coordination of SON functions.
2.2.1 SON Overview
SON is designed as a set of functions which solve some tasks in the network.The functions are related to configurations (self-configuration), optimizations (self-optimization), and failure recoveries (self-healing). [3] Self-configuration functionsare used when new network elements (eNBs) are deployed to the network. Self-optimization functions are used in monitoring the network and improving networkperformance with respect to some criteria, for example energy saving or cell loadbalancing. Self-healing functions aims to detect, diagnose, and recover from failuresituations.
SON functions are located in several places in the network, for example in NMSs,DMSs, and eNBs. SON architecture is called centralized if SON functions are locatedin management layers (DMS and NMS) and distributed if they are in eNBs andEPC components. However, a practical solution is a hybrid architecture in whichcentralized and distributed SON functions run simultaneously. [12][3]
2.2.2 Self-configuration
Self-configuration contains automatic processes for network element deploymentwith a plug-and-play behaviour. When an eNB is powered up, auto-connectivityand auto-commissioning functions will provide an automatic IP address allocation,authentication, and configuration with the OAM system. Moreover, the functionsprovide a connection establishment with the EPC layer and with other eNBs. [3]
9
After eNB is successfully installed, new cells need to be linked to adjacent cellswith neighbor relations. Automated Neighbor Relation (ANR) function is used todetect and update neighbour cells with respect to UE measurements. The innerlogic of ANR function depends on vendor, as every vendor has their own local ANRimplementation inside their domain network. [14]
2.2.3 Self-optimization
The mobile network requires continuous monitoring and parameter reconfiguration asthe environment is constantly changing. Self-optimization functions solve proactivelypotential incidents and other cases in the network. For example, rapidly changingtraffic load might require reconfiguration in cell parameters in order to have bettercoverage areas, handover success ratios and channel qualities. [3] ANR is also used inself-optimization because coverage areas and handover behaviour may change duringrun time and therefore relevant neighbour relations need to be maintained. [15]
One important SON function in optimization is Coverage and Capacity Optimization(CCO) which optimizes cell coverage areas. Basically, it adjusts the antenna tilts andtransmission powers so that gaps in coverage areas are avoided. [15] However, toomuch overlap between cells leads to interference and thus CCO has to find optimalsolution between ideal coverage area and minimal interference. [3]
Mobility Robustness Optimization (MRO) and Mobility Load Balancing (MLB) func-tions optimize handover functionality between cells. The MRO optimizes handoverparameters by minimizing call drops and radio link failures but avoiding unnecessaryhandovers such as the ping-pong effect (where a UE is frequently having handoversbetween a cell pair). The MLB function balances cell loads by enabling handovers incell boarders from an overloaded cell to a cell with free space. As well as the MRO,also the MLB configures handover parameters to provide its functionality. [3]
Yet another important optimization function is energy saving function which is usedto save overall energy consumption and operating expenses in the mobile networkby switching some cells on and others off. However, while minimizing the energyconsumption, the energy saving function has to avoid holes in coverage areas andconsider quality of service (user satisfaction). [3] Energy saving function is suitablein time periods when overall traffic is known to be slight for example at night time.
2.2.4 Self-healing
Failures in network elements are found with an alarm system where KPIs aremonitored and alarms are raised if KPIs have abnormal values. Self-healing functionscan resolve incidents related to network failures. When a self-healing function is
10
implemented for a specific alarm, it is possible to recover from that without manualwork. [16]
One use case for self-healing is cell outage management, which includes functionalityfor detecting, recovering and compensating cell outage. After an outage is detectedwith alarms or KPI measurements, the first action is to try recovery actions such assoftware restart or re-configuration. If cell outage persists even after recovery actions,compensation is needed. The objective of compensation is to minimize degradationin network performance by adapting the parameters of neighbour cells so that theyfill the hole in coverage area caused by the defective cell. [17]
Another use case for self-healing is the self-recovery of a network element software.In this use case, a software failure is detected in a cell and it can be healed by loadingeither the latest backup or initial status of the software. Action results are verifiedand if the problem still occurs, incident is further escalated to the operator. [16]
2.2.5 Coordination and Co-design of SON Functions
Using SON functions in the network system helps in automating some tasks. However,there can be situations where several SON functions act concurrently, which mightlead to unwanted results. For example, some anomaly can be caused by several reasonsand thus it might also trigger several SON functions as a solution [3]. Althoughindividual SON functions improve the network performance, the impact might beopposite when they are running concurrently.
One aspect in conflict prevention is to have co-design between SON functions. Co-design aims at disjoint SON functions by minimizing the number of shared parametersand having policies of how to co-operate with other SON functions. For example,SON functions could be designed so that only one SON function can be triggeredwith respect to a specific network state. However, as the number of SON functionsincreases, it becomes difficult to avoid all possible conflicts with a proactive design.[3]
In practice, conflicts can not be fully avoided with co-design and therefore automaticconflict detection and resolution is needed in the run-time environment. [3] SONcoordinator is a technology which tries to solve these issues. The coordinator detectsconflicts by monitoring network parameters and configuring and controlling SONfunction activities. SON function monitoring may include KPI measurements of cellsthat are influenced in a given impact time and impact area. The coordinator canalso give priority values for SON functions to solve which function is executed in aconflict. [3][18]
In addition to the network configuration, the SON coordinator has an interface to

11
a network operator to enable a human user to define high-level objectives for thecoordinator. A policy function is used to convert high-level objectives to specificparameters which the SON coordinator is in turn using to define SON functionactivities. Figure 4 shows an overview of the SON coordinator and its interfaces tothe network configuration and operator. [18]
Figure 4: SON coordinator architecture [18]
2.3 SON Evolution
2.3.1 Challenges in SON
Currently, SON functions and the SON coordinator are forming a system whichhas capabilities to automatically maintain the mobile network in limited situations.However, the human operator still has a significant amount of domain knowledgewhich neither SON functions nor the SON coordinator can access. Thus, a crucialpart in SON evolution would be knowledge acquisition from the operator to thesystem. [3]
In addition to knowledge acquisition, the current system has limitations in theexpressiveness of knowledge representation. To provide more complex concepts,knowledge should be represented with a formal knowledge model such as an ontology.[3]
12
A practical challenge in SON is also the current multi-vendor system which operatorhandles with the NMS. Although SON functions have been standardized, everyvendor has its own implementations of SON functions which adds complexity tonetwork operations.
2.3.2 SON Future
The effort in network operation has been in the development of an autonomousclosed-loop SON system in which human is not involved in the network configuration.Closed-loop system requires some high-level goals of the operator which can betranslated into SON parameters and further to network actions. [17][19][20]
Besides high-level goals, a decision support system (DSS) has been envisioned whichwould assist the operator in making decisions related to network planning. Withrespect to the network status, the system could recommend new locations for basestations and calculate resource costs for quality of service. [19]
Adaption of machine learning techniques and knowledge engineering to SON functionshave also been studied in research literature. For example, a future self-configurationfunction could deploy a cell to the network with parameter values that have beenlearned from a similar context. [3]
In addition to machine learning, a semantic knowledge model would provide abetter understanding for the system about the context. If the network (elements,objectives and actions) were semantically defined, it would enable the system to inferrelationships and to make decisions with respect to the semantic relations. [3]
2.3.3 Vision of Cognitive Network
The basic idea of cognitive network management architecture is related to IBM’sgeneral vision of autonomic computing [4]. The idea is the same with mobile networkmanagement: user-defined high-level goals are input to a closed-loop managementsystem. [3] This vision without SON functions is also researched in telecommuni-cation projects [21][22] and books [3]. These projects suggest that instead of SONfunctions, the management system will make dynamic configurations directly tonetwork elements. Generally, these architectural visions include components fornetwork data processing, data analysis, high-level goals, a knowledge base, andreasoning tasks. [3][21][22]
13
3 Knowledge Engineering
As this thesis aims to build a semantic search interface which demonstrates behaviourof a statistical reasoner, some background about knowledge engineering is presented.This section introduces some concepts related to knowledge representation, SemanticWeb technologies, and statistical reasoning. After that, there is discussion about LTE-and SON-related research projects which use some knowledge engineering techniquesin their systems.
3.1 Methodology
3.1.1 Knowledge Representation
Knowledge representation (KR) is a subfield of artificial intelligence (AI) and it is aparadigm for making a formal and structured representation for collected information.With a formal representation of knowledge it is possible to express deeper meanings ofconcepts, for example by adding logical relationships between concepts with semantics.[23]
KR can also be described with five distinct roles which characterize KR from differentviews [24]:
• Surrogate, meaning that KR is a substitute of a real world object. However,it is always an incomplete description of the real object. [24]
• Set of ontological commitments, meaning that the description of a conceptshould be focused on relevant aspects with respect to the domain. [24]
• Fragmentary theory of intelligent reasoning, which is defined with threeparts: 1) how reasoning is defined in its context 2) what can be reasoned and3) what reasoning tasks are recommended. [24]
• Medium for efficient computation, meaning that knowledge should be orga-nized in a way that relevant (recommended) reasoning will be efficient. [24]
• Medium for human expression, meaning that KR acts as a communicationtool which human uses to express knowledge to computer. [24]
As reasoning is an important part of knowledge representation, it has a relation toformal logic systems, for example to first-order logic (FOL) which is a formal andcompact way to describe logical relations. [23] Another family of logic systems isdescription logics (DL) which are fragments of FOL. [25]

14
3.1.2 Ontology
Ontology in computer science means a formal description of domain knowledge.In ontology, concepts are organized into a structure with relationships such ashierarchies of classes, value restrictions, disjointness statements, and specification oflogical relationships. [26]
An ontology described in DL can be divided into two parts: terminological (TBox)part and assertion (ABox) part. TBox defines concepts and relationships (axioms andproperties) between concepts. Thus, TBox contains the structural design and rulesof concepts. For example, TBox in a mobile network ontology could have a conceptCell which has subclasses Macrocell, Microcell, and Picocell with respect tothe cell type. Moreover, some properties can be defined to concepts, for exampleCell can be defined to belong to only one base station.
ABox completes the ontology by defining instances of the TBox concepts. Exampleabove could have instances Microcell1234 which belongs to a base station eNB5678.
3.2 Semantic Web
The Semantic Web uses knowledge representation in order to describe resourcesand their relationships on the web. This subsection gives first an overview of theSemantic Web and after that the most significant parts are presented.
3.2.1 Semantic Web Overview
The Semantic Web is a vision of a more intelligent Internet where machines can havemore detailed understanding about contents on the web. Technologies and standardsrelated to the Semantic Web are developed by A World Wide Web Consortium(W3C). [26]
W3C defines Semantic Web technologies which enable knowledge representationand reasoning for web resources. Resources are defined using Uniform ResourceIdentifiers (URIs) which define resources globally. Resource Description Framework(RDF), RDF Schema (RDFS), and Web Ontology Language (OWL) are the coreof knowledge representation on the Semantic Web and they are discussed in moredetail in following sections. [26]

15
3.2.2 RDF and RDFS
RDF is a data model for defining relations between data resources in the web. AnRDF statement includes three components: subject, predicate, and object. Subjectis the resource to be defined, predicate is its property, and object is a value of aproperty. A simple example of an RDF statement is described below. The statementdescribes two cell instances and a neighbor relation between them.
PREFIX: c: <http://.../cell-ontology#> .PREFIX: rdf: <http://www.w3.org/1999/02/22-rdf-syntax-ns#> .c:C1 rdf:type c:Cell .c:C2 rdf:type c:Cell .c:hasNeighbor rdf:type rdf:Property .c:C1 c:hasNeighbor c:C2 .
From the example can be seen that all triple components are globally unique asthey are defined with namespaces: cell-related components belong to a namespacehttp://.../cell-ontology# and RDF-related components tohttp://www.w3.org/1999/02/22-rdf-syntax-ns#.
RDF has semantic limitations because it provides semantics only for simple triplestatements. However, with RDFS it is possible to increase its expressive power withconstructs such as classes, hierarchical properties and value restrictions. The examplebelow shows how cells and neighbor relations between cells can be defined togetherwith RDF and RDFS. As an addition to the statement above, hasNeighbor propertyhas domain and range types specified.
c:Cell rdf:type rdfs:Class .c:hasNeighbor rdf:type rdf:Property .c:hasNeighbor rdfs:domain c:Cell .c:hasNeighbor rdfs:range c:Cell .c:C1 hasNeighbor c:C2 .
The example above misses statements of what type of classes c1 and c2 are. However,because of RDFS definitions about hasNeighbor property (domain and range),instances c:C1 and c:C2 can be reasoned to be cells (c:Cell).
3.2.3 OWL
OWL provides more expressive formal definitions for classes and relations, for exampleequality, disjointness, and cardinality. By using OWL, one can express characteristics

16
of relation properties such as functionality, symmetricity, and transitivity. Thesecharacteristics help to make more reasoning in an incomplete ontology. [27]
The example below shows how OWL can enrich the previous examples (presentedin section 3.2.2) by adding semantics to property characteristics. In addition toearlier statements, a machine can now infer that C2 is also neighbor of C1. Moreover,functional property for belongsToEnb indicates that a cell can belong to only oneeNB. Therefore, if there is a relation from one cell to two eNBs, the reasoner eithermarks the eNBs equivalent or raises an error due to a conflict.
c:hasNeighbor rdf:type owl:SymmetricProperty .c:ENB rdf:type rdfs:class .c:belongsToEnb rdf:type owl:FunctionalProperty .c:belongsToEnb rdfs:domain c:Cell .c:belongsToEnb rdfs:range c:ENB .
OWL originally had three sublanguages defined: OWL Full, OWL DL and OWLLite. OWL Full is the widest language with respect to the expressive power but itis not logically decidable. OWL DL has a correspondence to a description logic. Ithas the same elements as OWL Full but restricts the usage of the elements makingit decidable and compatible with DL reasoning. OWL Lite is a subset of OWL DLwhich provides easy but constrained usage of OWL DL. [27]
The current OWL specification, OWL 2, has been published in 2009 and it is slightlyenhancing the expressivity of the original OWL. For example, property chaining andnew property characteristics (such as asymmetricity, reflexivity, and disjointness)are available in OWL 2. Moreover, OWL 2 DL is divided into three sublanguages:EL, QL and RL. Each of the sublanguages emphasise different aspects in logicalreasoning. [28]
3.2.4 SKOS
Simple Knowledge Organisation System (SKOS) is a vocabulary (less formal ontology)used for representing concepts with simple taxonomic properties. SKOS propertiesenable designing simple hierarchical structures to the ontology. [29] The examplebelow defines hierarchical structure for concepts Cell and MicroCell which bothbelong to scheme MobileNetwork.
c:MobileNetwork a skos:ConceptScheme .c:Cell a skos:Concept .c:MicroCell a skos:Concept .

17
c:Cell skos:inScheme c:MobileNetwork .c:MicroCell skos:inScheme c:MobileNetwork .c:Cell skos:narrower c:MicroCell .c:MicroCell skos:broader c:Cell .
Similar structure, as example above shows, can be achieved with OWL but SKOSmight be more suitable in situations where a lightweight solution is desired and wherecomplex reasoning tasks are not needed.
3.2.5 SPARQL
SPARQL is a query language used for RDF data and it is an effective tool forretrieving subgraphs from an ontology or combining data from multiple ontologies.[30] Following example shows a simple SPARQL query. First, ontology namespace isdefined as a prefix and then query requests all instances having Cell type.
PREFIX c: <http://example.com/>SELECT ?cellWHERE {?cell rdf:type c:Cell .}
3.3 Markov Logic Network
The Markov Logic Network (MLN) is a model that combines the FOL from logicand the Markov network from probability theory. With the MLN, uncertain andcontradictory information can be represented by adding numerical weights to FOLclauses to indicate their priority in a rule base. MLN provides statistical inferenceand it is suitable in contexts where conflicting rules exist. For example, in a mobilenetwork might be a conflict in which SON functions have contradictory goals suchas energy saving and quality of service. With statistical reasoning these situationsmight be possible to resolve and produce an optimal (or balanced) outcome. [8]
The MLN knowledge base is constructed as pairs of (F, w) where F is a FOL statementand w its numerical weight. [8] Equation 1 shows a simple example of representingan MLN statement. The statement indicates that if a cell has low channel quality(CQI), transmission power (Txp) should be increased. The weight for this statementis 0.9.
(∀cell(Cqi(cell, low) =⇒ Txp(cell, increase)), 0.9) (1)
18
The MLN rule base allows also certain rules to be inserted. These rules can be usedas axioms for the uncertain rules. The example above could have the axiom that Txpcannot be increased and decreased at the same time, as the equation below shows.
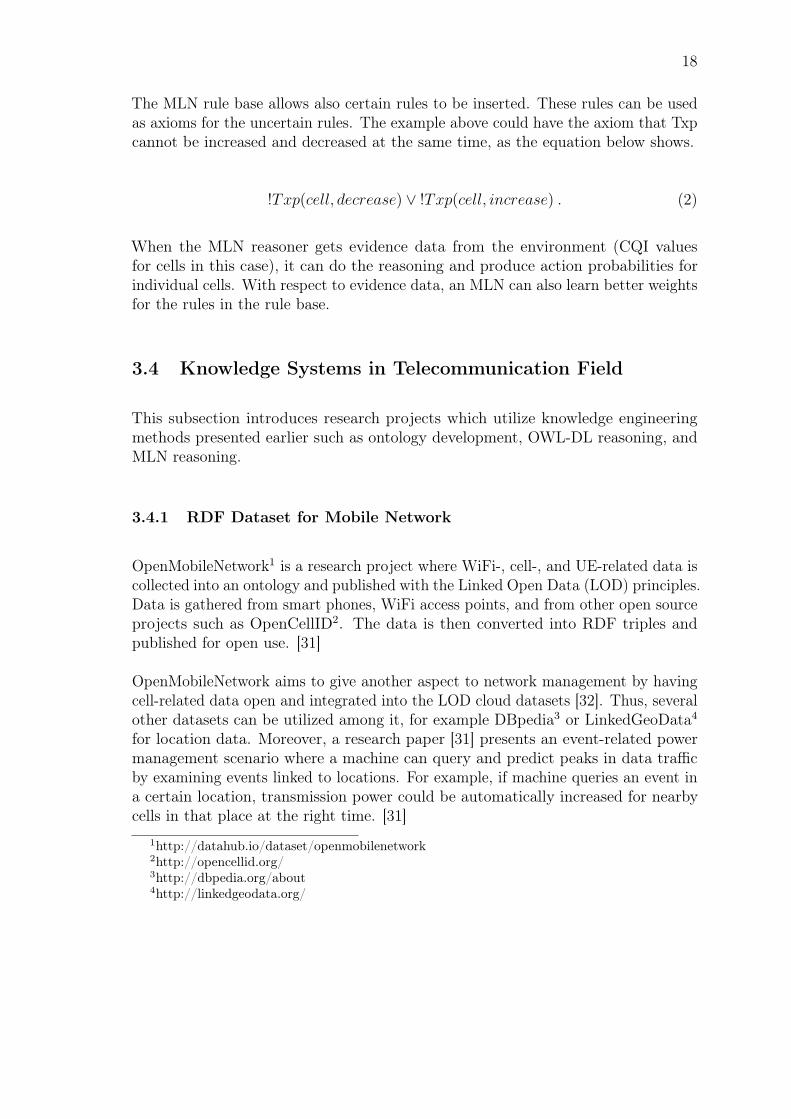
!Txp(cell, decrease) ∨ !Txp(cell, increase) . (2)
When the MLN reasoner gets evidence data from the environment (CQI valuesfor cells in this case), it can do the reasoning and produce action probabilities forindividual cells. With respect to evidence data, an MLN can also learn better weightsfor the rules in the rule base.
3.4 Knowledge Systems in Telecommunication Field
This subsection introduces research projects which utilize knowledge engineeringmethods presented earlier such as ontology development, OWL-DL reasoning, andMLN reasoning.
3.4.1 RDF Dataset for Mobile Network
OpenMobileNetwork1 is a research project where WiFi-, cell-, and UE-related data iscollected into an ontology and published with the Linked Open Data (LOD) principles.Data is gathered from smart phones, WiFi access points, and from other open sourceprojects such as OpenCellID2. The data is then converted into RDF triples andpublished for open use. [31]
OpenMobileNetwork aims to give another aspect to network management by havingcell-related data open and integrated into the LOD cloud datasets [32]. Thus, severalother datasets can be utilized among it, for example DBpedia3 or LinkedGeoData4
for location data. Moreover, a research paper [31] presents an event-related powermanagement scenario where a machine can query and predict peaks in data trafficby examining events linked to locations. For example, if machine queries an event ina certain location, transmission power could be automatically increased for nearbycells in that place at the right time. [31]
1http://datahub.io/dataset/openmobilenetwork2http://opencellid.org/3http://dbpedia.org/about4http://linkedgeodata.org/
19
3.4.2 OWL Reasoner for SON Conflict Analysis
Improvement for conflict analysis in SON coordination with OWL-DL reasoning isresearched in [33]. This approach presents a semantic description for SON functionsand network elements. The objective of the approach is to use a DL reasoner indetecting logical conflicts between active SON functions. [33]
Semantic modelling provides the detection of indirect logical conflicts. For example, ifthe actions of two SON functions are not conflicting by default but their combinationcauses an unwanted result to network performance, semantic reasoner might be ableto discover this conflict by understanding the logical relationships in the context.
The knowledge base for conflict detection contains a static SON function ontologyincluding basic function information about its type, input, and output. In run-time,dynamic data about function locations and impact areas are aggregated with theontology and a rule base is then used to identify whether there is a conflict betweenfunctions in the network. [33]
3.4.3 MLN Reasoner in SON Verification
Markov Logic Network is researched and adapted in SONVer which is a demonstrationsystem for verifying configuration changes made by SON functions. By monitoringKPIs and configuration history, SONVer detects and diagnoses anomalies in thenetwork. MLN is utilized in diagnosis phase by investigating if an abnormal value ina cell is caused by a configuration change. [34]

20
4 Visualization and Interaction Methods
This section gives a literature review to visualization and interaction technologieswhich are relevant to this thesis. First, visualization techniques and guidelinesare introduced. Second, there is discussion about the exploratory search paradigmwhich aims to support user’s knowledge acquisition with a functional search interface.Finally, a practical implementation of exploratory search, faceted search, is presented.
4.1 Visualization Techniques
Information visualization is an effective way to present a large set of information. Aproper visualization helps the user in making decisions and it prevents misinterpreta-tions from the data or information set. [35] Shneiderman [36] has divided visualizationtechniques into to seven types: 1-dimensional, 2-dimensional, 3-dimensional, multi-dimensional, temporal, tree and network. However, these are just guidelines and inreality one can use a combination of several types such as a network graph wherenodes are positioned by coordinates and coloured by their type.
In [36] a guideline for visual exploration is defined. The guideline advices to considerdifferent phases in visual exploration:
• Overview
• Zoom-in and filter
• Details-on-demand
Overview is considered as a starting point for the user and it gives a general viewof the collection. In the overview visualization, items can be grouped to achievea compact representation of the collection. With zooming and filtering user caninvestigate particular areas for more detailed information. The details of items shouldbe available (for example as a pop-up window) to provide a detailed description ofan item. [36]
4.2 Exploratory Search
4.2.1 Overview
Exploratory search is a combination of focused search (executing queries) and brows-ing. It can be seen as an attempt to first maximize the amount of relevant search

21
results (recall) and then browse through the result set to find interesting things.However, traditional search engines are focusing on providing only small amount ofrelevant documents as they are trying to minimize irrelevant documents (precision).Thus, exploratory search has different goals in search activities as what traditionalsearch engines have. [37][38]
Exploratory search is useful when a user has an information need for one or severalof the following tasks [37]:
• Define the goal of retrieval task
• Define ways to achieve the goal
• Familiarize with the domain
Exploratory search benefits a user who is unsure about the goal and wants to defineher information need better. Also, the user might know what to look for but need toexplore ways to achieve the goal. Finally, if the user knows the goal and methods toachieve it, she still might need to familiarize herself with the topic to be able to getright answers. [37]
Visualization and interaction are important supporting actions in the search processas they help users to understand the information and to discover relevant aspectsand relations. Moreover, a system can interact with user for example by helping inmaking better queries (for instance by recommending search terms [39]), offeringresult filtering or by grouping results into meaningful categories. [37]
Exploratory search behaviour depends highly on the context where it is used. Forexample, in general web search (searching with a search engine) query recommendationand query correction are important aspects. However, search scenarios related tonetwork management rather need effective result filtering to get a heterogeneousdataset reduced into relevant items.
4.2.2 Search Activities
Generally, a search process can be divided into three classes [38]:
• Lookup
• Learn
• Investigate

22
The latter two, learn and investigate, are considered as exploratory search activitieswhereas lookup is considered as a traditional search activity. Lookup aims to giveprecise results to a well-specified query such as database queries or text search insidea document. [38]
The second activity, learning search, is an iterative search process where the usermakes several queries and compares the results to learn different aspects of thedomain. In learning search the user not only executes queries but uses browsingactivities to learn related things in the collection and thus gets deeper understandingwith respect to her information need. [38]
Investigative search is a long-term search activity which can last for several weeks.In this activity, the user aims to make deductions and conclusions from the retrievedinformation over time. For instance, in investigative search the user can fill herknowledge gaps with new relations or she can make forecasts from the gatheredinformation. [38]
4.3 Faceted Search
4.3.1 Overview
The faceted search is a technology which supports the goals of exploratory search.[37] Basic idea in faceted search is in filtering search results with some criteria inorder to investigate characteristics of the result items. Facets are chosen from theavailable metadata and are utilized by grouping attributes to disjoint groups. Eachgroup can have either a hierarchical or a flat structure. For example, event instancescould have a time-related hierarchical facet with values month, week, day, and hour.[40] Facet values can be defined to be either disjunctive (allowing multiple selections)or conjunctive (allowing one selection). [41] For example, the event facet could bedesigned as disjunctive to allow events to last several hours.
In figure 5 faceted search is demonstrated with Amazon’s5 product search. Searchresults is first retrieved with keyword Faceted and after that the collection is reducedby selecting Books category. Items can be further reduced by choosing any of thevisible facets which are listed in the left column. Amazon’s search interface hidesfacets with no results and shows the amount of items for available facets.
5http://www.amazon.com/

23
Figure 5: The faceted search interface of Amazon.com with results for keywordFaceted and for selecting category Books
4.3.2 Determination of Facets
In order to avoid information overload, the number of facets should be reduced toonly those which are the most relevant to user. Some useful aspects (with respect tothe result set) to be considered in extracting the relevant facets are listed below [41]:
• High coverage
• High entropy
• Aggregation of similar facets
High coverage ensures that facet information is available for the majority of items onthe result set. High entropy means that facet values should be uniformly distributedor at least so that one facet value does not contain the majority of the results. Theaggregation of similar facets is useful when two or more facets are mainly sharingthe same results and thus they can be combined as one facet.
A more user-centric method for facet design is card sorting which can be used todefine relevant facets with respect to end-user behaviour. In card sorting, test usersare given the result set as a pile of cards where every card defines an item with atitle and description. Test users are asked to group the items as they like either byfreely defining categories for them (open card sorting) or by setting the items intopredefined categories (closed card sorting). [42][43]
24
4.3.3 Semantic Faceted Search
Semantic faceted search is a faceted search interface which utilizes Semantic Webtechnologies in the search interface construction. Thus, an ontology is used for adata model and SPARQL for query processing. [44] By means of Semantic Webtechnologies, the interface construction can be simplified with respect to the facetarchitecture and result set processing. [45] Moreover, OWL axioms [27] and semanticreasoning eases the maintenance of frequently updated dataset as reasoner canenhance the quality of an incomplete dataset. Moreover, with semantic classificationvocabularies (such as OWL and SKOS) facets can be easily designed to have a desiredstructure. [45]
In semantic faceted search, SPARQL is a natural way to process queries. Withgiven constraints it is rather straightforward to dynamically construct a query whichprocesses desired result set. As an example scenario, the user may look for cellsthat have been configured recently and that have many neighbors. User selects fromtime facet cells with configuration time smaller than one hour ago and then reducesresults to cells which have many neighbors. In SPARQL, this search task can beprocessed with the query shown below. Conditions (facet selections) can be addedand removed inside WHERE clause every time a facet value is selected or deselected.
PREFIX c: <http://example.com/cell_ontology/>SELECT ?cellWHERE {
?cell c:latestConfTime ?conf .FILTER (?time > "2015-04-30T00:00")
?cell c:amountOfNeighbors ?amount .FILTER (?amount > 6)
}
4.3.4 Fuzzy Faceted Search
In uncertain contexts or in contexts where a non-numerical simplification for facetvalue representation is needed, a fuzzy or crisp set can be used instead. With fuzzylogic, elements are defined to have a grade of membership to every facet value. Thenumerical values of elements are transformed into fuzzy set grades with membershipfunctions. [46] For example, facet values for cell neighbor amount could be definedwith fuzzy sets few, average and many. If a cell has six neighbors, the amountof neighbors could be transformed with membership functions into fuzzy values:fF EW (6) = 0, fAV G(6) = 0.7, and fMANY (6) = 0.3. Now, the facet system canretrieve items which match best to the criteria (such as to selection average) andrank the results with respect to membership grades.

25
A special case (and simplification) of fuzzy sets are crisp sets in which class boundariesare strict. Elements in crisp sets are allowed to belong to only one class without agrade of membership. [44]
Naturally, a mapping from numerical values to fuzzy or crisp values has to be designedby an expert to prevent misinterpretation by the end-user. The example shown insection 4.3.3 can be converted into a SPARQL query with crisp values as shown inthe example below.
PREFIX c: <http://example.com/cell_ontology/>SELECT ?cellWHERE {
?cell c:latestConfTime c:Recently .?cell c:amountOfNeighbors c:Many .
}

26

27
Part II
Design and Preliminaries

28
5 System Design
This section describes the underlying system as well as the design plan for thedemonstrator. The whole system (including the system architecture, its componentsand main functionality) is introduced briefly to give an overview of this project. Afterthat, the underlying statistical reasoner, Markov Logic Network (MLN) reasoner, isexplained. With respect to the reasoner functionality, some use cases are analysed forthe demonstrator and after that, the architecture of the demonstrator is described.Finally, components of the demonstrator is explained by introducing a plan for thepresentation layer (data representation in the graphical user interface) and for thedata access layer (ontology design for the network- MLN- and facet-related data).
5.1 System Description
The main idea of the MLN reasoning system is to provide more effective networkmanagement. As the real SON functions can neither handle uncertain informationnor make logical inferences, this project presents a statistical reasoner, MLN reasoner,which can assist SON functions in making optimal decisions.
Figure 6 shows the system architecture defining the communication between sys-tem components. The reasoning system is considered a combination of a customSON function and the MLN reasoner. The reasoning system reads performancemanagement (PM) data and configuration management (CM) data from the LTEsimulator. The reasoning system uses this data to produce action proposals and tolearn better weights for the rules in the rule base. The proposed actions are sentto the SON function which in turn transforms proposals with high probability intonetwork configurations.
The demonstrator has an interface with the reasoning system where it receives therule base, action proposals, and the same network data that the reasoner uses inits functionality. The demonstrator can manipulate the rule base and send updatedrules back to the reasoner.
5.2 MLN Reasoner
As described in section 3.3, the Markov Logic Network (MLN) reasoner uses proba-bilistic logic to infer actions needed in the network. Rules in this system are definedto have a specific structure which is represented in equation 3.

29
Figure 6: System architecture
w Context =⇒ (Objective ⇐⇒ Action) (3)
Every rule clause consists of three classes: context, objective and action. Contextdefines the current network state, including network topology (neighbor relationsbetween cells) and crisp values for key performance indicators (KPIs). Action is aconfiguration change and objective desired change for a KPI value. All three partscan include several predicates which need to be satisfied.
Equation 4 describes an example rule. The rule states that when cell c has a lowCqi, its Txp power and remote electrical tilt (Ret) angle should be increased in orderto achieve increment in the Cqi. Priority (weight) for this rule is set to 0.3.
0.3 I(t, c, Cqi, Low) =⇒ [O(t, c, Cqi, Inc) ⇐⇒ (A(t, c, Txp, Inc)∧A(t, c, Ret, Inc))](4)
The MLN reasoner is executed regularly and weights are updated after every reasoninground. As a reasoning output, it calculates action proposals for every individual cell.The example below shows the proposed actions and their probability for cell 5.
A(5,Ret,Inc) 0.391011

30
A(5,Ret,Dec) 0.339016A(5,Txp,Inc) 0.887961A(5,Txp,Dec) 0.0610439
5.3 Use Case Analysis
With respect to the logic of the MLN reasoning system, some use cases need to beexamined for the demonstrator. The demonstrator is targeted especially for researchand development purposes. However, this system can also be considered as a potentialproduct in the future network management and thus, the design should also help ahuman operator to understand the behaviour of the MLN reasoning system.
Figure 7 describes a use case diagram for the demonstrator. Use cases can be dividedinto two groups: knowledge acquisition (Acquire knowledge) and knowledge transfer(Update knowledge model). In knowledge acquisition, all the relevant information isrelated to the behaviour of the reasoner. This includes understanding the content andstructure of the rules to see which rules are emphasized in the network after weightlearning. One important aspect is to investigate relations between current cell states(input) and action proposals (output) which reveal the causes and consequencesfor the reasoning outcome. Moreover, the user should be allowed to evaluate howsuccessful proposed actions have been in the network (output and impact). Thus, theuser needs to explore anomalous events in KPIs and their relation to configurations.
In addition to knowledge acquisition, the user should have tools to interact withthe MLN reasoner in order to understand the behaviour better. Therefore, thereare use cases for updating the MLN model. First, the user can change rule weightto denote the significance or insignificance of a rule. The demonstrator should alsoallow creation, modification, and removal of the rules.
Figure 7: Use case diagram for the demonstrator

31
5.4 Demonstrator Architecture
This subsection gives a brief overview of the architectural design aspects of thedemonstrator.
5.4.1 Overview
The demonstrator allows the user to explore and control the functionality of theMLN reasoning system and it is designed with respect to use cases discussed earlier.To provide knowledge acquisition, a graphical user interface (GUI) is designed toassist user with visualisation and interaction methods. The GUI is implemented as aHTML 5 application.
The explorative search paradigm is considered to answer the information need ofthe user. A practical implementation of the explorative search is a faceted searchinterface which is adapted to the demonstrator. Faceted browsing enables the userto explore available information and to gain more knowledge from the context. Withrespect to the use case analysis, the demonstrator is designed to have separate facetviews for every knowledge acquisition use case. Different facet views provides morefreedom and different perspectives for the user in information exploration.
For data management, the demonstrator uses an ontology for the knowledge baseand SPARQL for querying it. As the objective is to explore relations from MLN-and network-related data, Semantic Web technologies provide a natural way for linkcreation between concepts and terms [26], too. The semantic approach simplifiesthe development and maintenance of multiple facet views [44]. In addition, a Javaapplication is implemented to retrieve and process the data into the ontology.
5.4.2 Architecture
Figure 8 describes the components of the demonstrator. Three facet views are definedas cell states, cell events, and MLN rules. By default, every facet view is visualizedas a table view. However, optional visualizations are available to provide deeperunderstanding about the data. For example, cell states could have a network graphand cell events a timeline. In addition to facet views, GUI has a view for MLN rulemodification which is implemented as a form.
Views interact with an ontology which stores data as RDF. The ontology has aSPARQL engine as an interface for GUI and REST interface for the reasoning system.The REST component retrieves the relevant reasoner- and network-related data.Data is then processed into the ontology which GUI components can query to get

32
the facet-, cell- and MLN-related data.
Figure 8: UI Design Architecture
5.5 Demonstrator Views
The following subsections describe the views of the GUI. With respect to theknowledge acquisition use cases (analysed in 5.3), a view for every case is designed:cell status view describes the input and output of the MLN reasoner, cell event viewdescribes the output and its impact to the network, and rule view describes thestructure of the uncertain rules in the MLN rule base. Every view description isdivided into data representation, visualization, and facets. However, this sectioncontains only design aspects concerning the demonstrator views. The implementationof the views (such as the actual visualizations) is presented later in section 7.
5.5.1 Cell Status View
The cell status view is designed to illustrate the relation between the input (perfor-mance data) and the output (action proposals) of the MLN reasoner. Thus, thisview should provide a visualization and a faceted search functionality which sup-port interactive searching with respect to the cell-related measurements and actionproposals.
33
Data Representation
A cell state includes attributes such as amount of neighbors, KPIs (monitored bythe MLN reasoning system), and MLN action proposals.
Cell-related measurements are simplified by grouping values into crisp sets. Forexample, KPI values are grouped into poor, medium and good, and the thresholdsfor the crisp sets correspond to values used in the MLN reasoner. A parameter-specific action proposal is represented by a combination of action direction (increaseor decrease) and action probability. The amount of neighbors is represented as anumerical value.
Visualization
The view for cell states is designed to have two visualizations: table and networkgraph. The example below shows how the table view is constructed. A table rowrepresents information about cell attributes with one column for the amount ofneighbors, one for every KPI value and one for every action proposal.
Cell(NeighborAmount,KPI_0,KPI_1,...,Action_0,Action_1,...)
The network graph is provided as an alternative visualization: the network topologycan be observed from a graph visualization. The graph represents nodes as cellsand neighbor relations as links. Node color indicates value for a KPI and node sizeindicates the probability of an action proposal.
Facets
Cell facets are generated from every KPI represented in the view. Crisp KPI valuesare used as facet values (such as low, medium, and high). KPIs are intuitive forfacets as they are relevant part of the network status and also part of the MLNreasoner input.
In addition to KPIs, neighbor amount is used as a facet. Neighbor amount isconsidered to give user a perspective to network topology and it might be useful toexamine cell characteristics also from this point of view.

34
5.5.2 Cell Event View
The cell event view aims to demonstrate what impact does the action proposals,which is turned into network configurations, have to the network performance. Thiscan be done by investigating the relation between cell events which are defined hereeither as a parameter configuration or as an anomaly in the network performance.
Data Representation
A cell event defined with attributes time, type (identifier for a parameter or indicator),direction of change, amplitude of change, previous value, and current value. Timeattribute corresponds to the timestamp of the simulator meaning the latest monitoringtime. In simulation time, the interval of monitoring is 15 minutes. Therefore, theevent time can be interpreted as: "happened inside 15 minutes before the timestamp".
In event data, crisp values are used for the direction of change and amplitude ofchange. The direction is defined either as a decrease or increase and amplitudes aredefined as low, medium, or high. Crisp values for amplitudes are set manually toevery event object as they behave differently. The idea is that an expert could laterconfigure the thresholds to correspond crisp sets more accurately.
Visualization
As in the cell status view, the event view is designed to have two visualizations: tableand timeline. A table row indicates an event with attributes shown in the examplebelow.
Event(Time,Parameter,Indicator,Impact,Amplitude,PrevVal,CurrentVal)
Event objects are divided into separate columns with respect to their type (parameteror indicator). The direction of change can be visualized with an icon and amplitudeeither with an icon or with a numerical value (in percentages).
Timeline visualization provides investigation of interesting events that have temporalrelation. For example, the user might discover that a particular configuration is aroot cause for KPI anomalies. On the other hand, visualization might also revealwhich KPI anomaly has triggered a configuration.
35
Facets
Event facets are generated from time and impact. Both of the facets are constructed ashierarchical facets. Time has three stages: day, hour and minute. Impact is structuredas direction (increase or decrease) and amplitude (low, medium or high).
5.5.3 Rule View
The rule view demonstrates the content of MLN reasoner. Therefore, the uncertainrules, which are the body of the MLN rule base, are represented in this view.
Data Representation
The third view represents the uncertain rules of the MLN reasoner with respect tothe structure explained in section 5.2. Thus, a rule is divided into context with KPIsand their values (low/high), actions with parameters and their change (dec or inc)and objectives with KPIs and their desired change (dec or inc). Also, rule weight isrepresented to user.
Visualization
Rules are designed to be visualized only in a table view as no alternative visualizationwas found to enhance user’s information exploration. The table view is representedwith a following structure:
Rule(Context,Objectives,Actions,Weight)
In the rule table, every column indicates one rule class. As one rule class mightcontain several predicates, these are listed inside a table cell.
Facets
Facets are generated from rule classes and from their parameter or indicator combina-tion. For instance, context would have distinct facets for KPIs with crisp values highand low. Objective facets are generated for KPIs with crisp impact values decreaseand increase. Similarly, for actions there are facets for every parameter with crispimpact values.
36
5.5.4 MLN Rule Updates
After user has examined faceted search views described above, she might come upwith new rules or with new ideas to modify existing rules. Rule update is implementedwith a form structure so that user does not have to learn specific syntax to expressfirst-order logic (FOL). However, expert users are allowed to create a rule with MLNsyntax. Thus, a validation for processing an MLN rule is needed.
The system assists user in filling the form by utilizing the facet selections she hasmade. For example, if user has selected low Cqi value as facet value in cell status view,the system prefills this selection to the context part of the rule (I(t, c, Cqi, low)).
5.6 Demonstrator Ontology
This subsection explains the ontology used as a data model for the GUI. The ontologyis stored as a whole but logically it can be split into three sub-ontologies: network,MLN reasoner, and facet ontologies. The ontology is also introduced in these parts.Each sub-ontology has a description and examples of the TBox (rules and structure)and ABox (instances) of the content.
5.6.1 Network Ontology
Network ontology describes the network context with respect to network data retrievedfrom the background system. The ontology aims to model the network data so thatit is both logical (the structure is understandable to a domain expert) and functionalfor the application (the structure and properties support faceted browsing). Thenetwork ontology is built as an OWL 2 ontology.
TBox
Figure 9 gives an overview of how network-related classes are represented in theontology. The most fundamental class in the ontology is Cell which have a symmetricneighbor property (cellHasNeighbor property between Cell instances) and proper-ties to different types of Parameter and Indicator classes. Subclasses of Parameterand Indicator are bound to Cell with subproperties of cellHasParameter andcellHasIndicator.
Indicator and Parameter can have relation to Event which describes a change inthe object. Event has a relation to Impact which indicates the direction (Increase

37
or Decrease) and magnitude of the change.
Figure 9: TBox example of network ontology
Figure 9 describes object properties only between instances. Classes have dataproperties such as hasValue to define numerical values for certain objects. Themostly used object property axioms are domain, range and functional relations.Functional relations are defined in case the domain is restricted to have only onesuch relation such as Event class has functional properties eventBelongsTo (inverseof hasEvent) and eventHasImpact. Defining axioms for object properties might notdirectly improve the current use (faceted search) of the demonstrator but they enableOWL 2 DL reasoning and more versatile use of the ontology in later projects.
ABox
Figure 10 demonstrates how instances are represented in the ABox part of the networkontology. The example focuses on representing cell element Cell12 and relevantobject properties to it. The red color is used in the graph to separate instances fromclasses (which are colored as grey). All cell instances in the ontology have relation tothe same indicators (Cqi and Rlf) and to parameters Txp and Ret (remote electricaltilt). Instances Cqi12 and Txp12 have relations to Event instances which both havedecreasing impacts on their objects.
5.6.2 MLN Ontology
The MLN ontology is an OWL 2 model representing the content of the MLN reasoner.Moreover, this ontology is built using properties which bind MLN-related classes tonetwork-related classes.

38
Figure 10: ABox example of the network ontology
TBox
Figure 11 describes the TBox of the MLN ontology. As the figure shows, TBox has twomain classes: MLNRule (rule base) and ActionProposal (reasoner outcome). MLNRulecan further be divided into rule classes with types of MLNContext, MLNAction, andMLNObjective (corresponding to the structure and formula 3 described in 5.2).
The figure also describes the most relevant object properties between classes. As it canbe seen, MLN classes are bound to network classes such as Parameter, Impact, andIndicator. For example, MLNAction class has relation to Parameter and Impact todefine the content of an action predicate. Similarly, MLNObjective has relation toIndicator and Impact. MLNContext has relation to Indicator but the magnitudeof the KPI value (Indicator) is described with a fuzzy value (High or Low).
Figure 11: TBox example of the MLN ontology
39
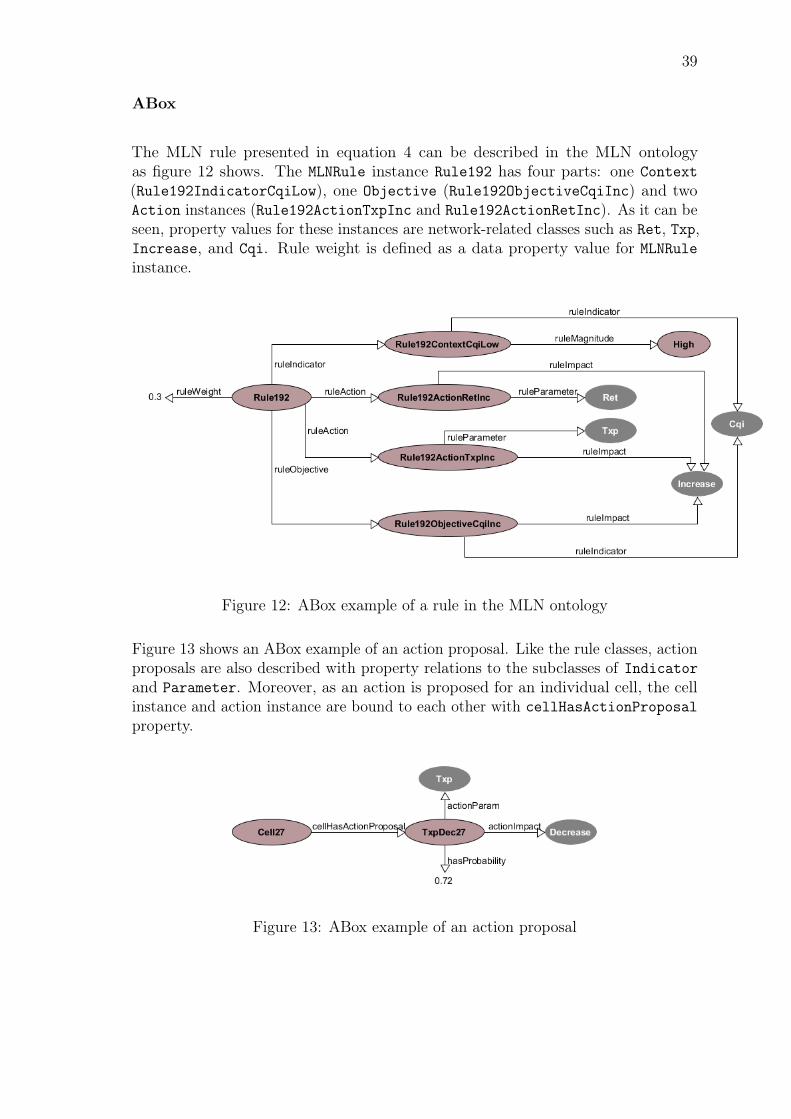
ABox
The MLN rule presented in equation 4 can be described in the MLN ontologyas figure 12 shows. The MLNRule instance Rule192 has four parts: one Context(Rule192IndicatorCqiLow), one Objective (Rule192ObjectiveCqiInc) and twoAction instances (Rule192ActionTxpInc and Rule192ActionRetInc). As it can beseen, property values for these instances are network-related classes such as Ret, Txp,Increase, and Cqi. Rule weight is defined as a data property value for MLNRuleinstance.
Figure 12: ABox example of a rule in the MLN ontology
Figure 13 shows an ABox example of an action proposal. Like the rule classes, actionproposals are also described with property relations to the subclasses of Indicatorand Parameter. Moreover, as an action is proposed for an individual cell, the cellinstance and action instance are bound to each other with cellHasActionProposalproperty.
Figure 13: ABox example of an action proposal

40
5.6.3 Facet Ontologies
The facet system is built using SKOS vocabulary [29], because it provides a simplevocabulary to describe hierarchical structures. This way facet-related semantics isseparated from other parts of the ontology and it is easier to design SPARQL queriesrelated to facets.
TBox
Figure 14 demonstrates how SKOS elements skos:ConceptScheme and skos:Conceptdefine facets and facet values and how SKOS property skos:inScheme describestheir relation. Also, SKOS properties skos:broader and skos:narrower describehierarchical relations inside a facet (between facet values).
Some concepts use data properties fuzzyMin and fuzzyMax to define numericalranges for crisp terms. For example, the indicator- and impact-related facets usenumerical ranges which are predefined into the ontology.
ABox
In figure 14 is presented one facet from every view: current CQI value from cellstates, event time from cell events, and the objective of a CQI value from rules.
Figure 14: The facet ontology with an example facet from every facet view
Every skos:Concept has an object property which binds the facet instance to an

41
ontology instance. For example, cell instance c:Cell27 can be bound to an RLFfacet value with the following statement:
c:Cell27 c:facetRlf c:HighRlf
Similarly, hierarchical facet values are bound to ontology instances with separateproperties. For example, an event instance has three facet values with respect toevent time:
c:Event123 c:facetDay t25c:Event123 c:facetHour t25_12c:Event123 c:facetMinute t25_12_05

42
6 Tools and Libraries for the Demonstrator
The earlier section defined the requirements and abstract design of the demonstrator.This section discusses about tools and libraries that can be used in the implementation.The examined components is divided into ontology- and GUI-related sections.
6.1 Ontology Management
6.1.1 SPARQL Engine
To handle ontology data, the demonstrator needs a triple store and SPARQL enginewhich supports both SPARQL queries (for facets) and SPARQL updates (for ruleupdates). One solution for a SPARQL engine is Fuseki which is part of Apache Jenaframework 6. It provides SPARQL endpoints for querying and updating RDF dataover HTTP protocol. [47]
Another SPARQL server is NanoSparqlServer7 which is built on top of a Blazegraphgraph database8. As Fuseki, also NanoSparqlServer offers SPARQL endpoints thatcan be queried over HTTP and that support both SPARQL queries and SPARQLupdates. [48]
6.1.2 DL Reasoners for OWL 2 Ontology
Because the OWL 2 ontology instances are frequently updated, there is a need for anOWL 2 description logic (DL) reasoner to check whether the ontology is consistentwith respect to the axioms (TBox). Although the facet system might work correctlyeven though the ontology would be inconsistent, it is desirable to keep the ontologyconsistent to enable use of OWL 2 DL reasoning tasks in later projects. For example,a DL reasoner can be used to infer new assertions (such as missing object properties)to the ontology.
A requirement for the DL reasoner is that it should be open source and usable inJava applications as the backend is implemented with Java. Two well-known DLreasoners which fulfils these conditions are HermIT9 and Pellet10.
6https://jena.apache.org/index.html7http://wiki.bigdata.com/wiki/index.php/NanoSparqlServer#REST_API8http://www.blazegraph.com/9http://hermit-reasoner.com/
10https://github.com/Complexible/pellet

43
Performance of the reasoners has been researched in [49] where their suitabilityare tested for several OWL ontologies and for different inference tasks. Althoughbenchmarking is done for OWL and not for OWL 2, it gives an overview how wellthe reasoners perform in different contexts. Comparing Pellet with HermIT, HermITseems to be a very fast reasoner generally but slower in loading the ontology andin checking the consistency. However, Pellet is slightly faster in ontology loadingand consistency checks but it has variance in general reasoning performance withdifferent ontologies. Especially ABoxes with large sizes can be challenging for Pellet.[49]
6.2 Graphical User Interface
The GUI is implemented as an HTML5 application and therefore Javascript is used toprogram GUI functionality. This section examines some Javascript tools for differentpurposes such as table sorting, network graph functionality, timeline functionalityand facet browsing.
6.2.1 Sortable Table
In a table view, it is intuitive to offer column-specific sorting functionality. Ta-blesorter11 is a jQuery plugin which offers sorting functionality. Plugin detectsautomatically many data types (such as strings, numbers, and dates) and sortsthem correctly without extra definitions. However, the plugin allows custom sortingfunctions which are needed in this project because some data might be representeddifferently as they should be sorted. For instance, fuzzy values should not be sortedin lexicographical order but with some other criteria.
6.2.2 Network Graph
In addition to table view, the cell network is visualized as an interactive network graph.Network graph should allow interactive functionality such as facet selections (nodefiltering). It should also provide some other interaction defined in Schneiderman’sguidelines [36] (section 4.1), for example zooming and details-on-demand (clicking anode). Moreover, graph layout should be customizable as different colors and sizesare used to describe indicators and MLN action proposals.
Force Layout12 is a D3.js package which generates a force-directed graph structure11http://tablesorter.com/docs/12https://github.com/mbostock/d3/wiki/Force-Layout

44
from given JSON file. The graph structure is then mapped to SVG elements(nodes as circles and links as lines) for final visualization. [50] D3.js does not offerinteraction functions but with other plugins and custom work some interaction canbe implemented into the graph.
Vis.js has a graph component which has basic functionality for graph drawing andinteraction. [51] The library is easy to use and it has several tutorial examples whichcan be utilized in other projects. For a large network (many thousand edges) thegraph becomes slow but with a smaller graph it works well.
Sigma.js13 is a Javascript library which is focused on robust graph drawing. Itoffers basic interaction tools such as zoom-in, details and node filtering. [52] For amore complex interaction it needs additional plugins or custom implementation. Bydefault, Sigma.js does not offer any layout (such as force-directed layout) or clusteringfeatures but some plugins are implemented also for these purposes. However, dueto its efficient graph rendering, Sigma.js is stated to be suitable for projects whichrequire basic interaction and dynamic rendering. [53]
Cytospace.js14 is another graph visualization tool for Javascript. Its advantageis compatibility with jQuery and diverse assortment of interaction tools such asbox selection, panning and pinch-to-zoom. [53][54] It also provides an API withgraph theory functions. Therefore, Cytospace does not only have network graphrendering but it also has graph analysis and algorithms such as breadth-first searchand PageRank [54] implemented as Javascript functions.
6.2.3 Timeline
The main purpose of the timeline is to visualize KPI anomalies and configurations andtemporal relations between them. As the cell states are monitored frequently (every15 minutes in simulation time), time should be represented at least in minute detail.Moreover, timeline layout should be horizontal and it must provide representation ofconcurrent events as the events from one simulation round have the same timestamp.
Vis.js has a timeline component which provides interactivity, concurrent events, andscalable time representation (from years to fractions of a second). Moreover, timelinearea can be divided into subgroups and therefore different anomaly types (as decreaseand increase) and configurations can be separated in the timeline. [51] The timelinecomponent of Vis.js has the same advantage as the network graph component: theease of use and amount of useful examples which can be utilized.
Although D3.js does not have any interaction tools by default, there are some timeline13https://github.com/jacomyal/sigma.js14https://github.com/cytoscape/cytoscape.js

45
examples15 which can be adapted to this purpose. However, these timeline examplesseem to need custom work for adapting to this context. For example, none of thetimelines have a view for events with minute detail.
One popular timeline16 library is TimelineJS (used by several newspapers). It hasdynamic scaling for events and has much interactivity for event details. TimelineJSemphasizes event descriptions whereas the timeline itself is shown rather small belowthe description. Therefore, this component is suitable especially for contexts whereuser wants to focus on details of individual events more than investigate the timelineitself.
6.2.4 Faceted Browsing
Facets need to be implemented with Javascript functions which query and processthe SPARQL statements into HTML select boxes. Some Javascript/CSS tool couldbe utilized to style select boxes and some tool could be used to add functionality tothe select boxes, for example real-time text search.
Chosen17 is a jQuery plugin which provides select box styling. It adds text searchfunctionality which filters option values in real time with respect to text input. Italso provides functionality for handling multiple selections: every selected value ispresented to user and selection can be removed by clicking it.
15https://github.com/mbostock/d3/wiki/Gallery16https://github.com/NUKnightLab/TimelineJS17https://github.com/harvesthq/chosen

46

47
Part III
Implementation

48
7 Graphical User Interface
The graphical user interface (GUI) is implemented with respect to the design of thedemonstrator views described in section 5.5. This section presents first the structureof the GUI to give an overview of the application. After that, the implementation ofthree facet views (cell states, cell events, and MLN rules) is introduced. Every facetview section includes use case tests as practical examples of their functionality.
7.1 GUI Overview
Figure 15: GUI overview (numbered parts are explained below)
Figure 15 depicts the main parts of the GUI:
1. First level navigation
2. Second level navigation
3. Content
4. Facet settings

49
5. View settings
With first level navigation the user can navigate between different faceted searchviews. Each view has a second level navigation which is implemented inside everyview as a single page application (inside the same HTML page with dynamic contentupdates). Content visualizes the view-specific information (in the figure can be seeninformation about cell states) with a visualization selected from the second levelnavigation.
In facet settings user can select facet values to give filtering conditions for theresult set. After every facet value selection, the content part is updated dynamically.Below facet settings there are view settings that are used if the content visualizationprovides some alternative options.
For an end-user this GUI structure provides an intuitive use of the application as theGUI has a layout similar to a traditional web page: navigation can be found from theheader, additional information (such as facets and view settings) from the sidebar,and the content is located in the middle of the page. This also helps the end-user tounderstand the content of the application. For example, a new user can observe fromthe navigation bar what are the main parts of the GUI (status, events, and rules).
7.2 Cell States
7.2.1 Description
The cell status view is the default view in the GUI and it provides information aboutthe input (cell states) and output (action proposals) of the MLN reasoning system.As defined in 5.5.1, this view has two visualizations: table and network graph. Also,the view has facets for neighbor amount and for every indicator monitored by theMLN reasoning system (currently there is only RLF and CQI).
The table view for cell states can be seen in figure 15. Action proposals are defined withnumeric values for probabilities and arrow icons for action directions. Indicator valueis presented with an icon corresponding to fuzzy values undefined, low, medium,and high. Cell ID and the amount of neighbors are defined with numeric values.
Figure 16 shows a graph visualization for cell states. The graph visualizes cells asnodes and neighbor relations as edges. Nodes are located with respect to their eNBcoordinates to illustrate their actual positions. The node color indicates an intra cellgroup (belonging to the same eNB) or an action proposal for a parameter. Actionproposals are color-coded as red (decrease), green (increase) or grey (no action). The

50
node size indicates magnitude of an indicator value or the amount of neighbors. Boththe node color and size can be changed to another from the view settings.
Figure 16: Network graph for cell states
Rule creation is handled with a form shown in figure 17. With the form, the usercan create rules with respect to the defined rule structure (5.2). Form selections aretransformed into MLN syntax and presented in a text field (as the figure shows). Anexpert user can modify the text field in order to create more expressive rules.
7.2.2 Use Case: Selecting Facets
A use case for the cell status view consists of following phases:
• Select values from facets
• Verify the result set in the table and graph
• Verify prefilled predicates in the rule creation form
Selected facet values are chosen as: low Cqi, high Rlf and average amount ofneighbors. These selections reduce the result set from 32 cells to five cells. Visual-izations of the result set as table and graph can be seen in figure 18.

51
Figure 17: Rule creation form with prefilled facet selections
Facet selections low Cqi and high Rlf are mapped to values in the rule creationform, as it can be seen in figure 17.
Rule creation functionality is the same in the cell status and rule view. The rulecreation form is available A use case for rule creation is described later in section7.4.3.

52
(a) Table after facet selections
(b) Graph after facet selections
Figure 18: Result set after facet selections visualized as a table and graph
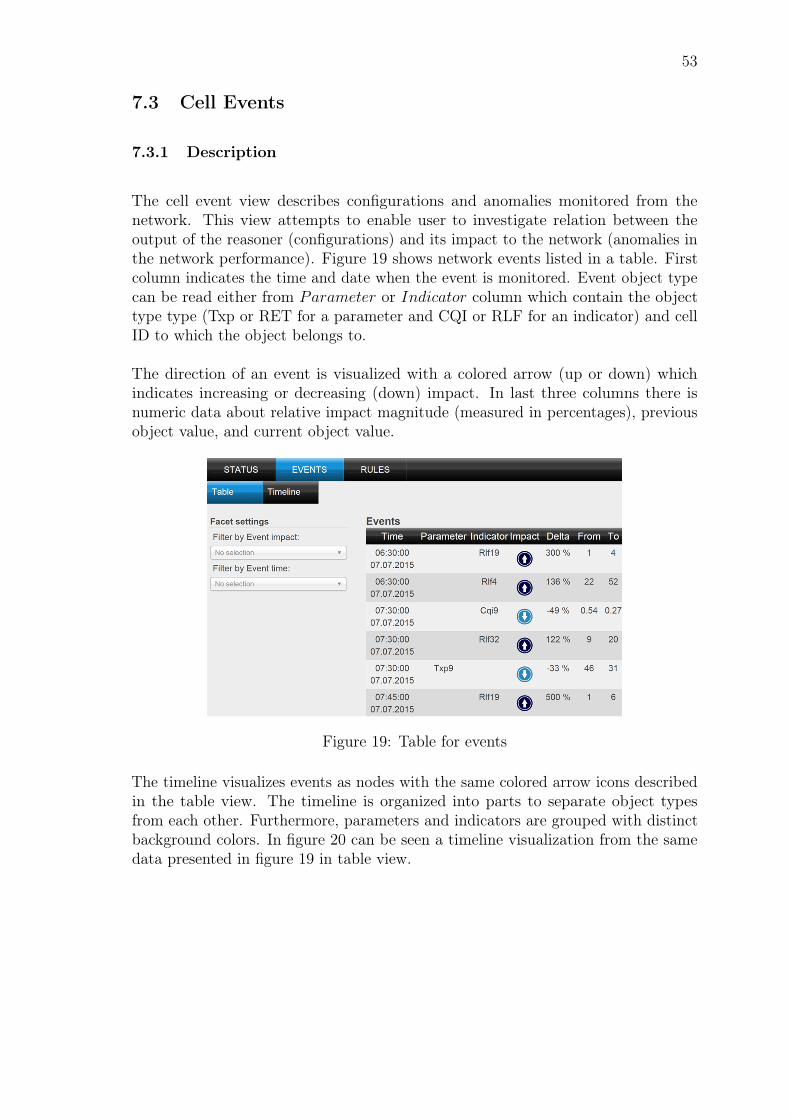
53
7.3 Cell Events
7.3.1 Description
The cell event view describes configurations and anomalies monitored from thenetwork. This view attempts to enable user to investigate relation between theoutput of the reasoner (configurations) and its impact to the network (anomalies inthe network performance). Figure 19 shows network events listed in a table. Firstcolumn indicates the time and date when the event is monitored. Event object typecan be read either from Parameter or Indicator column which contain the objecttype type (Txp or RET for a parameter and CQI or RLF for an indicator) and cellID to which the object belongs to.
The direction of an event is visualized with a colored arrow (up or down) whichindicates increasing or decreasing (down) impact. In last three columns there isnumeric data about relative impact magnitude (measured in percentages), previousobject value, and current object value.
Figure 19: Table for events
The timeline visualizes events as nodes with the same colored arrow icons describedin the table view. The timeline is organized into parts to separate object typesfrom each other. Furthermore, parameters and indicators are grouped with distinctbackground colors. In figure 20 can be seen a timeline visualization from the samedata presented in figure 19 in table view.

54
Figure 20: Timeline for events
7.3.2 Use Case: Selecting Facets
A facet selection use case for event view has two phases:
• Select values from facets
• Verify the result set in the table and timeline
Facets are chosen as: 07.07.2015 10 : 30 and Decrease. As it can be seen in figure21, three events fulfil these conditions: one Txp event and two Cqi events.

55
(a) Table after facet selections
(b) Timeline after facet selections
Figure 21: Result set after facet selections visualized as a table and timeline

56
7.4 Rules
7.4.1 Description
The rule view provides faceted search interface and modification for the uncertainrules of the MLN reasoner. Thus, the user can investigate the structure of the rulesand manipulate the rule base in order to learn its logic.
Facets are generated from rule classes so that every class combined with its parametersor indicators are presented as facets. Facet selections are bound to correspondingvalues in the rule creation form.
The table is the only visualization of the rule items. As it can be seen in figure 22,the table columns are formed from the rule weight and from the rule classes (context,objective and action). Rule classes are further divided into individual predicateswhich are listed inside the rule class field.
Figure 22 shows that above the table is presented an option to remove a set of ruleswith respect to current facet selections. There are also two buttons after every ruleitem: one for changing rule weight and another for removing the rule.
Figure 22: Rules visualized as a table
7.4.2 Use Case: Selecting Facets
A facet selection use case for the rules has three phases:
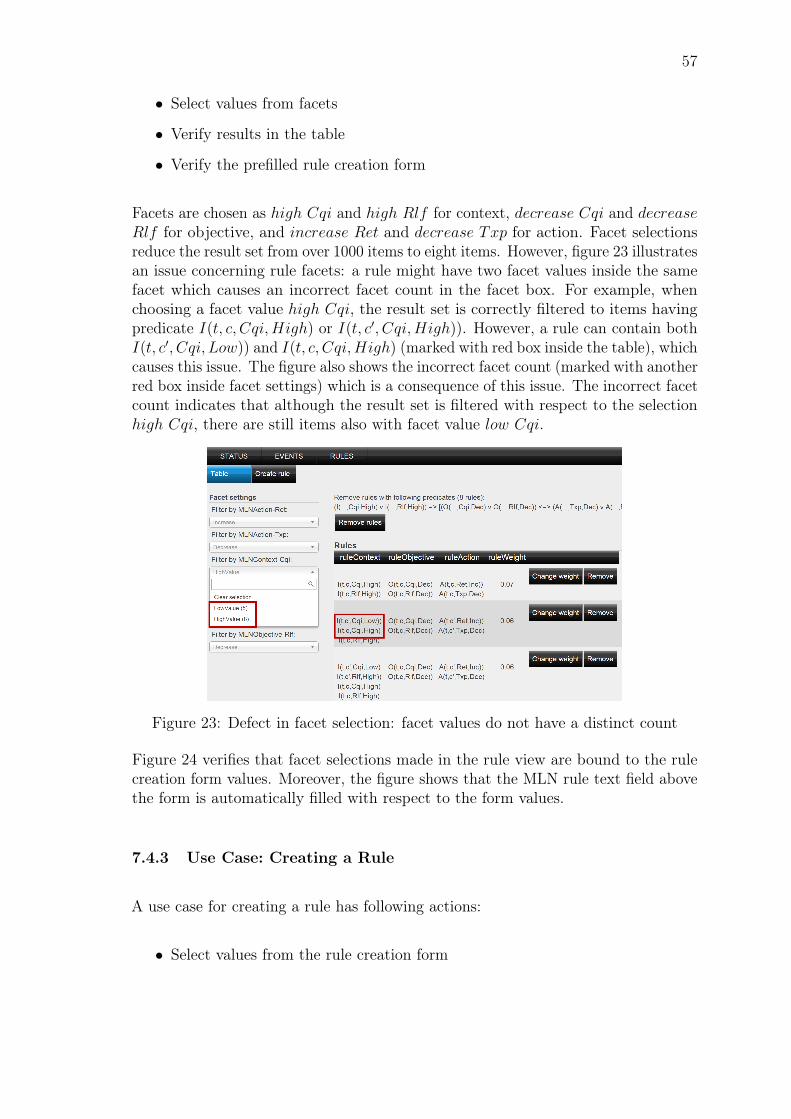
57
• Select values from facets
• Verify results in the table
• Verify the prefilled rule creation form
Facets are chosen as high Cqi and high Rlf for context, decrease Cqi and decreaseRlf for objective, and increase Ret and decrease Txp for action. Facet selectionsreduce the result set from over 1000 items to eight items. However, figure 23 illustratesan issue concerning rule facets: a rule might have two facet values inside the samefacet which causes an incorrect facet count in the facet box. For example, whenchoosing a facet value high Cqi, the result set is correctly filtered to items havingpredicate I(t, c, Cqi, High) or I(t, c′, Cqi, High)). However, a rule can contain bothI(t, c′, Cqi, Low)) and I(t, c, Cqi, High) (marked with red box inside the table), whichcauses this issue. The figure also shows the incorrect facet count (marked with anotherred box inside facet settings) which is a consequence of this issue. The incorrect facetcount indicates that although the result set is filtered with respect to the selectionhigh Cqi, there are still items also with facet value low Cqi.
Figure 23: Defect in facet selection: facet values do not have a distinct count
Figure 24 verifies that facet selections made in the rule view are bound to the rulecreation form values. Moreover, the figure shows that the MLN rule text field abovethe form is automatically filled with respect to the form values.
7.4.3 Use Case: Creating a Rule
A use case for creating a rule has following actions:
• Select values from the rule creation form

58
• Modify the input field and submit the rule
• Verify the result
Figure 25 verifies that after a valid MLN rule is submitted to the server and the pageis reloaded, the new rule appears in the table view. If the user creates an invalidMLN rule, it causes a SPARQL update error which is shown to user with a popupbox.
One defect in the rule creation is that the SPARQL update script, which creates anew rule, do not create facet values for the rule. Thus, the rule is present in thedefault view (no facet selections) but it disappears if any facet is selected (as it doesnot contain any facet information).
7.4.4 Use Case: Updating Weights
One use case for the rule view is updating a weight for an individual rule. This usecase consists of two phases described below.
• Update weight value for a rule
• Verify the result
Figure 24: Prefilled form with respect to facet selections
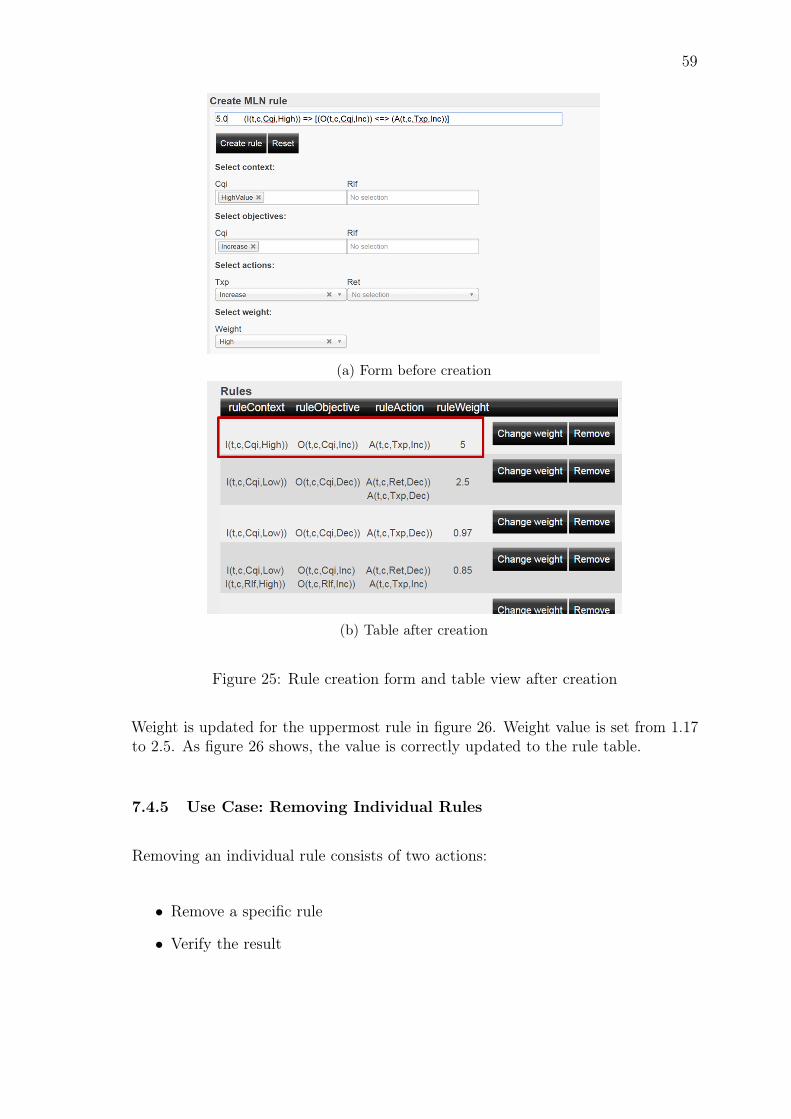
59
(a) Form before creation
(b) Table after creation
Figure 25: Rule creation form and table view after creation
Weight is updated for the uppermost rule in figure 26. Weight value is set from 1.17to 2.5. As figure 26 shows, the value is correctly updated to the rule table.
7.4.5 Use Case: Removing Individual Rules
Removing an individual rule consists of two actions:
• Remove a specific rule
• Verify the result
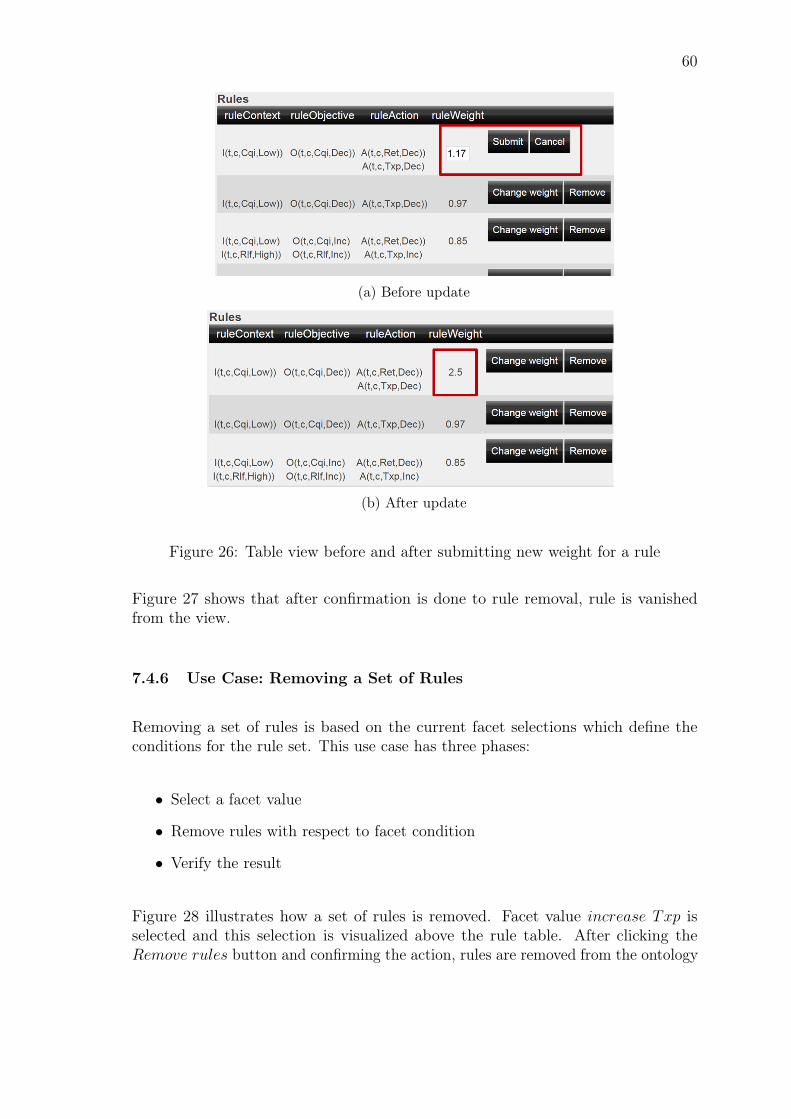
60
(a) Before update
(b) After update
Figure 26: Table view before and after submitting new weight for a rule
Figure 27 shows that after confirmation is done to rule removal, rule is vanishedfrom the view.
7.4.6 Use Case: Removing a Set of Rules
Removing a set of rules is based on the current facet selections which define theconditions for the rule set. This use case has three phases:
• Select a facet value
• Remove rules with respect to facet condition
• Verify the result
Figure 28 illustrates how a set of rules is removed. Facet value increase Txp isselected and this selection is visualized above the rule table. After clicking theRemove rules button and confirming the action, rules are removed from the ontology

61
(a) Before removal
(b) After removal
Figure 27: Table view before and after removing a rule
and from the result set. Also, all the facet selections are automatically cleared afterremoval. The figure illustrates that after the action, no facet selection for increaseTxp exists as every rule that contains this value has been removed.
7.5 Plugins for the GUI
This application has several Javascript/jQuery plugins adapted for different purposes.Suitable plugins were presented and analyzed in section 6.2. From those alternatives,following plugins were adapted to the GUI:
For select boxes and table sorting, no alternative plugins were introduced as theirfunctionalities are rather simple. Also, chosen.js and tablesorter.js were consid-ered suitable because they are jQuery plugins, easy to use, and have the requiredfunctionality.
For visualization plugins, there were some alternatives for both the network graph andtimeline. For both visualizations, vis.js plugin was chosen to simplify implementation
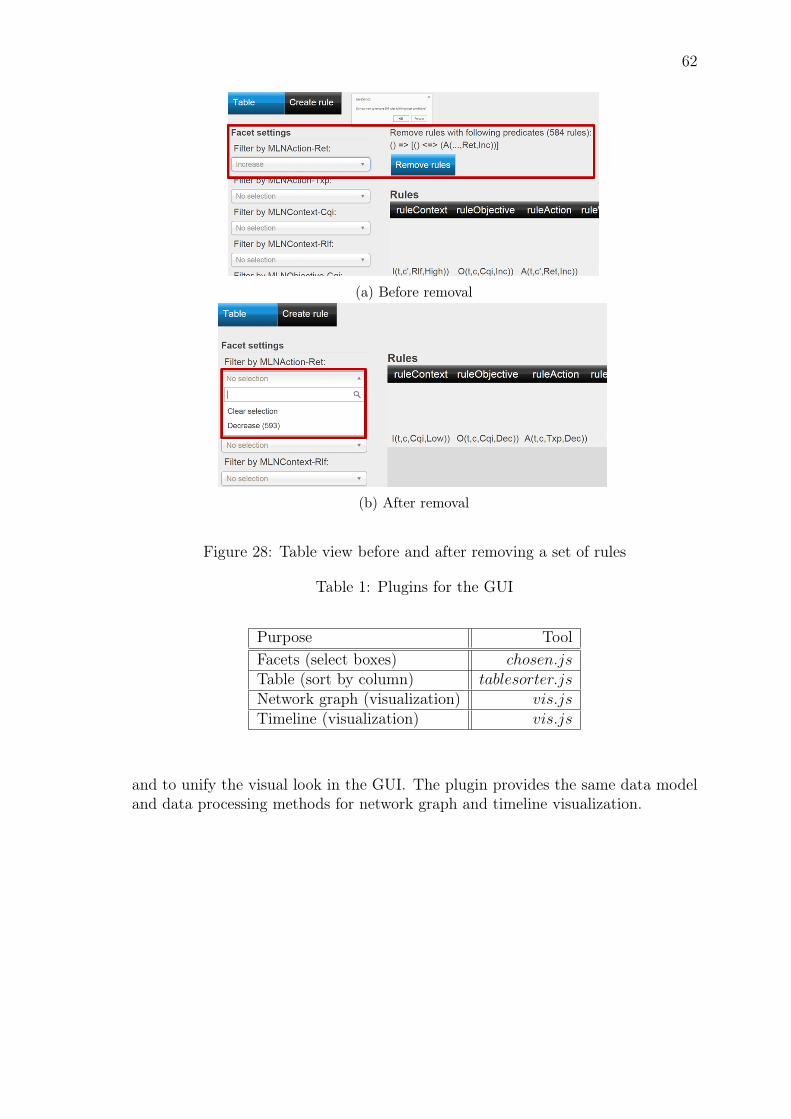
62
(a) Before removal
(b) After removal
Figure 28: Table view before and after removing a set of rules
Table 1: Plugins for the GUI
Purpose ToolFacets (select boxes) chosen.jsTable (sort by column) tablesorter.jsNetwork graph (visualization) vis.jsTimeline (visualization) vis.js
and to unify the visual look in the GUI. The plugin provides the same data modeland data processing methods for network graph and timeline visualization.

63
8 Data Management
This section presents the implementation of the data management. First sectiongives an overview of the data sequence in the demonstrator. After that, subsectionsdescribe the implementation of how the network- and MLN-related data is processedinto the ontology, how the ontology is kept consistent, and how it is queried.
8.1 Data Sequence Diagram
The demonstrator gets both network- and MLN-related data from the MLN reasoningsystem. Figure 29 explains the data sequence of the demonstrator starting from dataretrieval (from the MLN reasoning system) and ending in a rule update (from theuser interface). A Java component, named here as the Ontology Processor, retrievesthe data from the MLN reasoning system in four phases as PM (sendPM), CM(sendCM), MLN rules (sendRules) and reasoning outcome (sendActionProposals)are sent separately. The Ontology Processor parses (with methods PMtoRDF, CMtoRDF,rulesToRDF and actionsToRDF) retrieved data objects into an OWL 2 ontology(Network- and MLN sub-ontologies). When all four data objects are retrieved andparsed into the ontology, a reasoner checks the consistency of the current ontology.
The ontology is sent to a SPARQL server (updateOntology) which re-creates facets(generateFacets) with respect to the new ontology. Finally, updated ontology canbe queried by the UI (for example getItems and getFacets). As user modifies therule base a SPARQL update is sent to SPARQL server (updateRuleBase) in orderto save changes into the ontology. Moreover, MLN reasoning system can executeSPARQL queries to retrieve the updated rule base (with a method getRuleBase).
8.2 Input Data to RDF
Network-related performance and configuration data (PM and CM) are retrieved astwo separate JSON objects. The Ontology Processor parses JSON objects to OWL2 ontology instances (ABox) which are appended to the predefined TBox ontology.Following example summarises the JSON input for the PM data. The input consistsof an array of cells defined with and id ("key"). Every cell has KPI values, such as"throughput","rlf", "cqi", and "load".
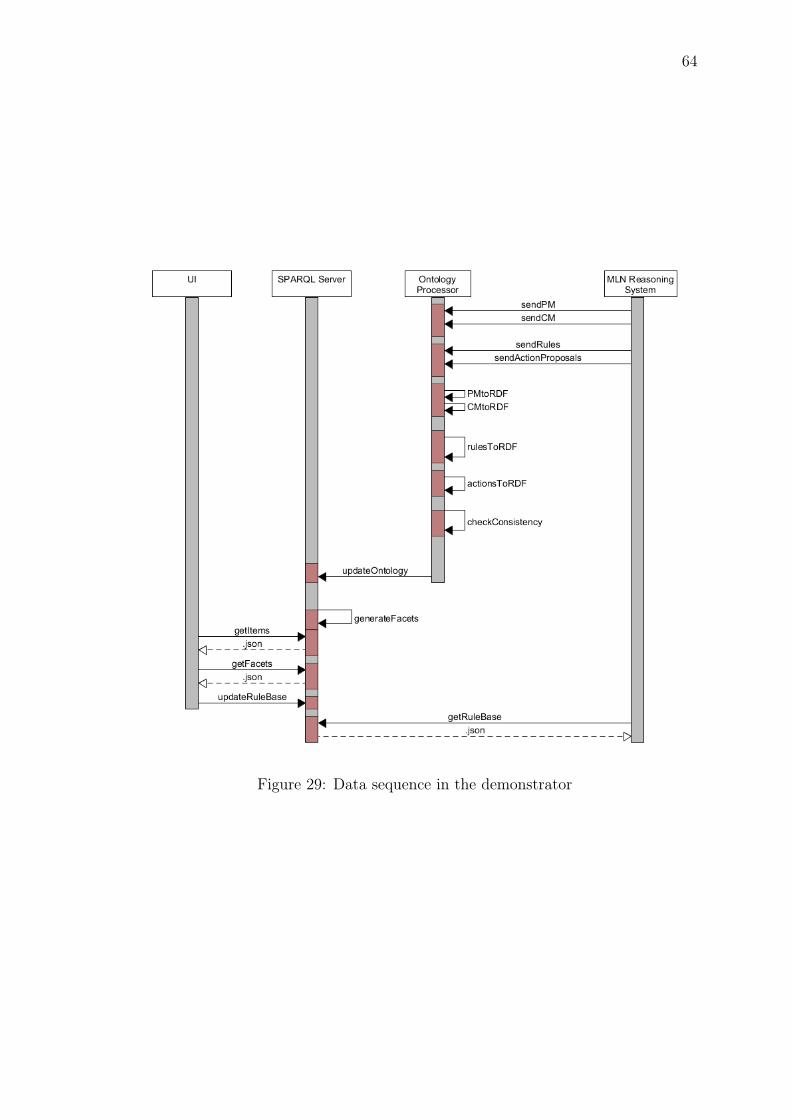
64
Figure 29: Data sequence in the demonstrator

65
[ {"key" : 12,"value" : {
"throughput" : 10388140,"rlf" : 114,"cqi" : 0.7,"load": 0.8,
...
An example below gives an insight of the CM data retrieved as JSON. Again, theinput file contains an array of cells. Every cell contains configuration data as "tilt","txPower", and "beamSteer". Moreover, every cell contains an array defining itscurrent cell neighbors.
[ {"key" : 21,"value" : {
"tilt" : 1.0,"txPower" : 46.0,"beamSteer" : 0.0,"neighbors" : [ {
"id" : 22}, {
"id" : 6}, {
"id" : 23...
The MLN files parsed in the demonstrator consist of the rule base and reasoning out-come (action proposals). An example of the rule base is described below. As it can beseen, the file contains predicate definitions (for example A(time,cell,param,delta)),certain rules (for example !O(a1,a2,a3,Dec) v !O(a1,a2,a3,Inc).), and uncer-tain rules (for example 0.158837 (I(t,c,Cqi,High)) => [(O(t,c,Cqi,Inc)) <=>(A(t,c,Txp,Inc))]). The rule base contains approximately 1300 uncertain rules.
//predicate declarationsA(time,cell,param,delta)E(time,cell,param,extremum)

66
I(time,cell,kpi,level)N(cell,cell,neighborship)O(time,cell,kpi,delta)
!E(a1,a2,a3,Min) v !E(a1,a2,a3,Max).
!A(a1,a2,a3,Dec) v !E(a1,a2,a3,Min).
!A(a1,a2,a3,Inc) v !E(a1,a2,a3,Max).
!A(a1,a2,a3,Dec) v !A(a1,a2,a3,Inc).
!O(a1,a2,a3,Dec) v !O(a1,a2,a3,Inc).
!N(a1,a1,a2).
!N(a1,a2,Inter) v !N(a1,a2,Intra).
N(a1,a2,a3) v !N(a2,a1,a3).
0.158837 (I(t,c,Cqi,High)) => [(O(t,c,Cqi,Inc)) <=> (A(t,c,Txp,Inc))]
0.267003 (I(t,c,Cqi,High)) => [(O(t,c,Cqi,Inc)) <=> (A(t,c,Txp,Dec))]
0.0499781 (I(t,c,Cqi,High)) => [(O(t,c,Cqi,Inc)) <=> (A(t,c,Ret,Inc))]
0.123257 (I(t,c,Cqi,High)) => [(O(t,c,Cqi,Inc)) <=> (A(t,c,Ret,Dec))]
....
The MLN reasoning outcome is retrieved as an other file which is described below.The file contains action proposal probability for every cell and for every action. Inthe current system there are four possible actions for every cell: increase or decreasethe remote electrical tilt (RET) or the transmission power (Txp).
A(1,Ret,Inc) 0.40401A(1,Ret,Dec) 0.364014A(1,Txp,Inc) 0.359014A(1,Txp,Dec) 0.362014A(2,Ret,Inc) 0.364014A(2,Ret,Dec) 0.380012

67
8.3 Consistency Checking of the Ontology
To ensure that the ontology stays consistent after updates, an OWL 2 DL reasoneris executed after the ontology is reloaded with new instances. Pellet18 is adaptedto the system for this purpose because it has functionality to check the ontologyconsistency and to give an explanation for inconsistencies. The example below showsthe explanation which Pellet reasoner gives for an inconsistency when Indicator andParameter are defined to be disjoint but they are sharing (rdfs:range) an objectproperty (hasEvent). The consistency report is logged to a file and expert user caninvestigate the report in order to analyse if the TBox need modification.
c:EventRlf52015-06-27_19_04_40_242 c:eventBelongsToIndicator c:Rlf5 .
[] a owl:AllDisjointClasses ;owl:members (c:Cell c:Event c:Impact c:Indicator c:Parameter c:Value) .
c:eventBelongsToIndicator rdfs:range c:Indicator .
c:Rlf5 c:hasEvent c:EventRlf52015-06-27_19_04_40_242 .
c:eventHasEffect rdfs:range c:Parameter ;owl:inversOf c:hasEvent .
8.4 SPARQL Server
After data is processed to the ontology and consistency is checked, the ontology isuploaded to Fuseki server. From the two SPARQL engines discussed in section 6.1.1,Fuseki is chosen for this system. The main reason for selecting Fuseki is the earlierexperience of using it and thus its suitability for this purpose is already known inpractice.
8.5 Creating Facets
After a new ontology is uploaded to the SPARQL server, SPARQL update scriptsare automatically executed to create new facets and facet values from the uploadedontology. Every facet has two SPARQL update queries. The first query is generatingConceptScheme, Concept (related to ConceptScheme), and facet properties (relatedto Concept instances). The second query binds ontology instances to Conceptinstances.
18https://github.com/complexible/pellet

68
Appendix A shows how facets, facet values, and facet properties are generated forevery indicator facet. For example, the query generates a ConceptScheme instancec:StatusCqi which has Concept instances c:HighCqi and c:LowCqi. Along withc:HighCqi and c:LowCqi a facet property c:facetCqi is generated.
Appendix B shows how the generated facet values are bound to cell instances. DELETEstatement is not needed in SPARQL updates as new ABox always replaces the earlierin the SPARQL server. Thus, earlier facet data is cleared when ontology is re-uploadedto the server.
8.6 SPARQL Patterns for the GUI
SPARQL server is queried by the user to retrieve the view- and facet-specific dataand the server is updated with modified rules every time user manipulates the rules.This section first describes the general structure of SPARQL query patterns (resultset query and facet query) and then explains how modifications to the rule base aredone with SPARQL update statements.
8.6.1 Result Set
The basic idea of retrieving result sets for every view is defined below. The exampleis describing the result set query for cell status view but by replacing c:Cell (firstline in SELECT statement) with c:Event or c:MLNRule and c:facetCellProperty(third line) with c:facetEventProperty or c:facetRuleProperty one can retrieveresult sets also for cell events and MLN rules. The last two lines inside the statementindicate that user has made facet selections for low CQI and high RLF. Theseselections filter the results to only those fulfilling the conditions.
SELECT ?label ?predLabel ?objLabel{?s a c:Cell .?s skos:prefLabel ?label .?predLabel rdfs:subPropertyOf c:facetCellProperty .?s ?predLabel ?facetval .?facetval skos:prefLabel ?objLabel .?s <http://www...#facetCqi> <http://...#LowCqi> .?s <http://www...#facetRlf> <http://...#HighRlf> .}ORDER BY ?label
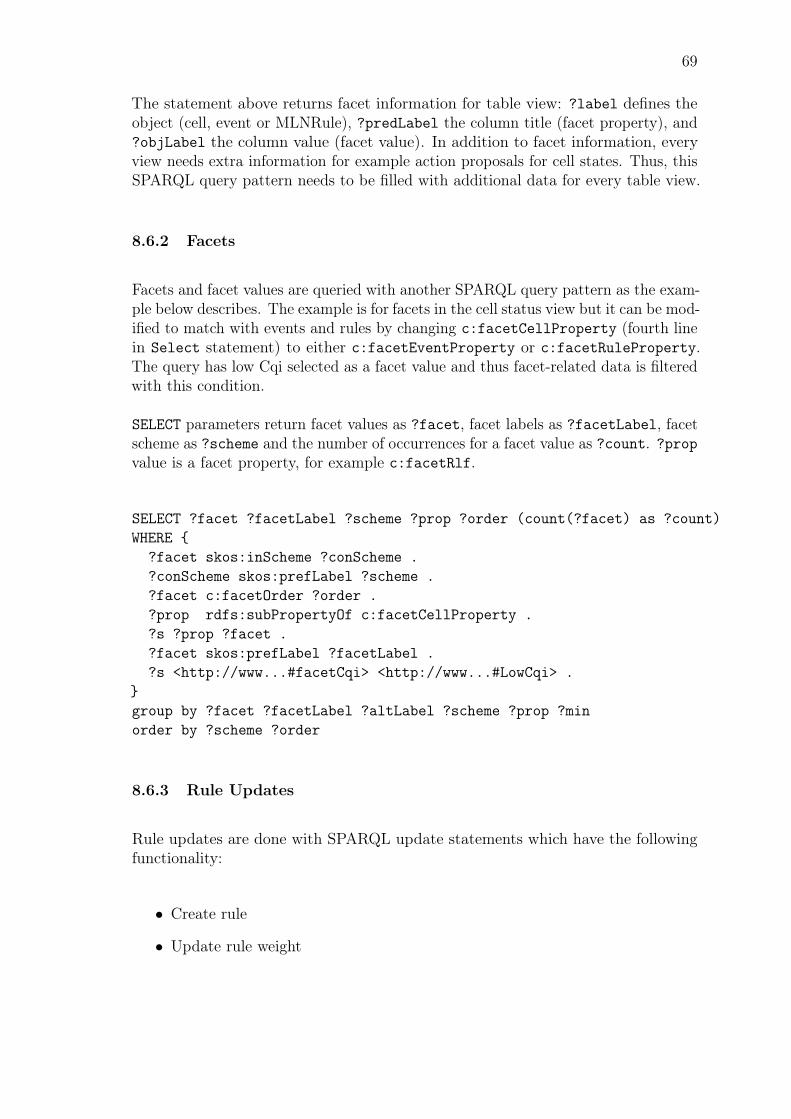
69
The statement above returns facet information for table view: ?label defines theobject (cell, event or MLNRule), ?predLabel the column title (facet property), and?objLabel the column value (facet value). In addition to facet information, everyview needs extra information for example action proposals for cell states. Thus, thisSPARQL query pattern needs to be filled with additional data for every table view.
8.6.2 Facets
Facets and facet values are queried with another SPARQL query pattern as the exam-ple below describes. The example is for facets in the cell status view but it can be mod-ified to match with events and rules by changing c:facetCellProperty (fourth linein Select statement) to either c:facetEventProperty or c:facetRuleProperty.The query has low Cqi selected as a facet value and thus facet-related data is filteredwith this condition.
SELECT parameters return facet values as ?facet, facet labels as ?facetLabel, facetscheme as ?scheme and the number of occurrences for a facet value as ?count. ?propvalue is a facet property, for example c:facetRlf.
SELECT ?facet ?facetLabel ?scheme ?prop ?order (count(?facet) as ?count)WHERE {
?facet skos:inScheme ?conScheme .?conScheme skos:prefLabel ?scheme .?facet c:facetOrder ?order .?prop rdfs:subPropertyOf c:facetCellProperty .?s ?prop ?facet .?facet skos:prefLabel ?facetLabel .?s <http://www...#facetCqi> <http://www...#LowCqi> .
}group by ?facet ?facetLabel ?altLabel ?scheme ?prop ?minorder by ?scheme ?order
8.6.3 Rule Updates
Rule updates are done with SPARQL update statements which have the followingfunctionality:
• Create rule
• Update rule weight

70
• Remove a rule
• Remove set of rules
Rule creation differs from the other rule modification tasks because the input needsto be parsed from MLN syntax to RDF triples. Parsing and validation are donewith the same string parser which is used for rule parsing in the Ontology Processor.After an MLN rule is parsed to triples, it is inserted into the server with a statementdescribed in appendix C.
Functionalities for latter rule modification tasks are more straightforward as useractions can be mapped straight to RDF triples. Appendix D shows examples of howa rule weight is updated, single rule is removed and set of rules is removed.

71
Part IV
Discussion
72
9 Evaluation
This section evaluates the implementation described in sections 8 and 7. Theevaluation is based on the research questions defined in the introduction section:
• What information is needed?
• Which visualization methods support the information need?
• Which facets support the information need?
• What other functionality supports the information need?
• How to provide scalability for the search interface?
Evaluation of every topic is divided into implementation and deficiencies parts.Implementation sections focus on discussing the positive and negative aspects of thedemonstrator with respect to the research questions. Deficiencies sections discussissues which are missing from the demonstrator.
9.1 Information Quality
Information offered in the demonstrator can be divided into three abstract types:the input and output of the MLN reasoner (cell states and action proposals), theimpacts of the reasoner output (configurations and anomalies) and content of therule base. These three information types are presented in separate faceted searchviews to bring diverse perspectives to explore the reasoning system.
9.1.1 Implementation
The cell status view describes the cell states and action proposals of the reasoner.Section 7.2 clarifies that this information is available in the view as the latest MLN-monitored KPI values and action proposals are available. In addition to KPIs andaction proposals, the amount of neighbors and neighbor relations are presented toprovide additional information about cell characteristics. Although neighbor relationmight not be relevant information in the demonstration, it is still considered as aninformative aspect in describing cell states. For example, the amount of neighborsmight reveal some pattern which occurs only with cells with many (or few) neighbors.
73
The cell event view provides user verification for the causes and consequences ofconfigurations made by the reasoning system. As section 7.3 describes, current imple-mentation is revealing temporal relationships between configurations and anomalies.However, in order to make investigations related to the reasoning system, the userneeds to assume that all configurations are actually executed by the reasoning system(no manual or SON function configuration). This is because the demonstrator doesnot recognize the type of the configuration (who or what has made it).
In the rule base representation, clauses for uncertain rules are split into rule classes,as shown in MLN ontology description 5.6.2 and in view description 7.4. The currentrepresentation of the rule base can be seen sufficient because it is not seen reasonableto split or hide rule parts any further without losing relevant information.
9.1.2 Deficiencies
In the cell event view, historical action proposals should be presented and thereshould be a relation between action proposals and configurations. This relationwould provide the user information about action proposals (type and probability)that causes successful or unsuccessful configurations. As it can be seen from the datasequence diagram (figure 29), this approach would need changes to data processing,as the current system is not collecting historical data from action proposals.
Another issue in the cell event view is that the user might be interested to seeinformation about cell neighbor relations (without changing to the cell status view)to verify relations between configurations and anomalies. The use case in section 7.3.2shows that configuration in cell 24 most probably affects to its own Cqi value butpossibly also to Cqi value of cell 17. Knowing that cell 17 and 24 are not neighborsreveals that cell 17 is not likely affected by this configuration.
An information gap in the demonstrator is that MLN reasoner-related informationis not provided about certain rules or settings data (thresholds, KPIs, parameters,etc.). Both of these would be helpful for the user to get better understanding aboutthe rule base.
9.2 Facets
9.2.1 Implementation
The use case for cell states 7.2.2 shows that especially KPI-related facets demonstratewell the relationship between action proposals and cell states. Moreover, the usecase shows that KPI facets support rule creation as they are bound to Context fields

74
in the rule creation form (figure 17). As discussed earlier, information about theamount of neighbors is not seen as an important aspect here and therefore the facetmight be unnecessary in this context.
The use case 7.3.2 for cell events shows that relations between configurations andanomalies can be revealed with time and impact facets. For example, in the use casethe user can verify that Txp for cell 24 decreases its own Cqi. However, a minor issuewith the time facet is that there are no facet values for months. In the current systemthe issue can be avoided by keeping the simulation inside a month (simulation timecan be manipulated to start at the beginning of a month). However, with respect toa more consistent system and longer simulations, also months and years should beincluded in the time facet.
In the rule view, facets are chosen as a combination of rule classes (context, objectivesand actions) and their objects (Cqi, Rlf , Txp, and Ret). As the structure of therules is fixed, these facets support well browsing activities for the rule base. The usecase 7.4.2 shows that all the facets in this view support binding to the rule creationform which eases user’s work load in rule creation.
However, rule facets might encounter an issue as the use case 7.4.2 demonstrates.System produces incorrect facet information when rule includes cell or time variableswith opposite facet values (as there is low and high Cqi values for MLNContextCqiin the use case). Disjointness could be solved by adding facet information aboutdifferent cell and time values or by limiting facet values to match only cell variableswhich indicate the cell itself (c) and not its neighbors (c′).
9.2.2 Deficiencies
Cell states should have facets for action proposals as the objective of the view is todemonstrate relation between the input and output of the reasoner. Therefore, thedemonstrator should also enable user to explore items with respect to output values.
In addition to time and impact facets in the cell event view, there should be anobject facet. User might want to filter result set with respect to different objecttypes such as parameter or indicator or with their subtypes as Txp, Ret, Cqi or Rlf .For example, a facet structure with two levels could be useful: the first level for theobject type (parameter or indicator) and the second for their subtypes (Txp, Ret,Cqi, and Rlf).
In the rule view, a facet for weight values should be available. Weights could begrouped to crisp values low, medium, and high.
75
9.3 Visualization Methods
9.3.1 Implementation
A network graph was chosen as an alternative visualization for cell states. As figures16 and 18 show, network graph visualization supports relationship discovery betweencell states and action proposals. Figure 18 also shows that user can investigate thenetwork topology after facet selections which might reveal new aspects from MLNreasoning system. Also, the observation of the cell table content has been simplifiedas KPI values and action proposals are visualized as icons instead of numerical values.
In cell events, the advantage of the timeline visualization is shown in figures 20 and21 where causes and consequences can be easily observed from the timeline. In theevent table, impacts are visualized with icons which again eases the informationexploration.
Rules are visualized only as a table because no alternative visualization is consideredto give any advantage to the rule base exploration. In the table visualization, therules are easily observable as the rule content is grouped into rule classes (see figure22).
9.3.2 Deficiencies
The network graph visualization already gives the relative positions of the nodes.However, the visualization could be enriched with spatial information so that nodesare rendered on a map. This might help user to understand why cells (and eNBs)are located in certain places.
In the timeline visualization, increasing and decreasing impacts are separated witharrows and colors (figure 20). However, there are no colors to indicate if the impact isgood or poor for the system. For example, an increase in Cqi is generally considered asgood impact but an increase in Rlf as poor. Categorization of impacts is problematicas there is no information available about impact qualities (need to be set manually).
9.4 Other Functionality
9.4.1 Implementation
Other functionality includes components which support user’s information exploration.These components include rule base manipulation tasks such as creating a rule,

76
updating a rule weight, removing a single rule, and removing a set of rules. Theseactions are successfully implemented into the system as it can be seen in use cases7.4.3, 7.4.4, 7.4.5, and 7.4.6. After MLN reasoning system retrieves the updatedrules and uses them in the reasoning, user can then investigate what effects did thechanges have to the reasoning results.
As mentioned in the rule creation use case (section 7.4.3), one minor defect is themissing facet information for the created rule. The demonstrator should bind newinstances to facet values and therefore some improvement to the current SPARQLupdate script is needed.
9.4.2 Deficiencies
Use case analysis in the system design (section 5.3) stated that the system shouldallow modification of an existing rule. However, the current system does not havemodification action implemented. Naturally, modification can already be achievedby deleting a rule and creating a new rule with desired changes.
Another functional deficiency is that the user should be able to modify the thresholdsof crisp values. The MLN reasoning system could then retrieve the modified thresholdvalues from the ontology and change its own threshold values to the reasoning system.This way user would have more tools to modify the behaviour of the reasoning systemand investigate what impact the threshold values have to the reasoning output.
9.5 Scalability
9.5.1 Implementation
The scalability of the system is ensured with the architectural design described insection 5.6 and with the implementation of data management explained in section8. Sections 8.1 and 8.2 explain briefly how the network- and MLN- related dataare aggregated and published as an OWL 2 ontology. The advantage of using anontology as a data model is that the ontology can then be queried with SPARQLqueries and be modified with SPARQL updates (section 8.6). Also, query patternsdescribed in 8.6.1 and 8.6.2 simplify the development of the faceted search view, aspatterns can be reused in the development.
Another advantage of the ontological approach is the possibility to use a semanticreasoner (such as OWL 2 DL reasoner) for consistency checks and for relationshipdiscovery. Currently, Pellet reasoner is adapted to the system and it makes aconsistency report which is logged to a file (section 8.3). A reasoning task for missing
77
properties is not yet adapted to the system as it is not seen to bring benefit forthe current implementation. However, in further projects reasoner could be used toproduce new properties to the ontology.
9.5.2 Deficiencies
One issue related to scalability is that the ontology needs some view-specific enrich-ment in order to generalize the view representation in the demonstrator. As describedin the query design of SPARQL result sets (section 8.6.1), only semantics that iscommon between the views is based on facet properties. With the view-specificenrichment, SPARQL queries could be reformulated with a more general propertystructure which would define view-specific attributes (columns and column values)and would make the query pattern more usable.
78
10 Conclusion
This section concludes this thesis by first discussing about possible follow-up projectsand then by summarising the thesis.
10.1 Future Work
Two possible future works are presented in this subsection. First is discussed howhigh-level goals could be adapted to the demonstrator for better human-reasonerinteraction. Second topic discusses how open data can be utilized in this project.
10.1.1 System Management with High-level Goals
The current implementation could be enhanced by creating high-level goals which theuser can use to modify the behaviour of the reasoning system. As it is discussed insections 2.3.2 and 2.3.3, user-defined high-level goals have been seen as a crucial aspectin the future SON architecture and generally in the automatic network management.Similarly, it would be interesting to examine how the MLN reasoning system couldbe controlled with high-level goals.
A high-level goal can be used to define active KPIs and dynamic threshold valuesfor the active KPIs. For example, an energy-saving goal could be mapped to KPIsCapacity and Cqi. Threshold values for these KPIs can be scaled so that lowerCqi value is still satisfiable whereas Capacity value should be higher than usual.Naturally, this approach assumes that the reasoning system has a larger collection ofKPIs and that the rule base can be dynamically modified by eliminating rules withirrelevant KPIs.
10.1.2 Utilizing Linked Data in Reasoning
Another research direction for this work could be examining how linked data, such asRDF-modelled linked open data (LOD), can be used to extend the MLN reasoningto other aspects which might affect the network performance. For example, weatherand event data might be relevant information with respect to quality and capacityissues.
An approach that uses LOD in network management was mentioned in section3.4.1. This project introduced a LOD dataset utilizing event-related data. Similarly,the reasoning system could also be bound to other datasets by aggregating data

79
from different SPARQL or REST endpoints. However, it is likely that processingheterogeneous data into reasoner data (with crisp classification, rule structure, etc.)needs plenty of planning and implementation. Moreover, LTE simulator data andother datasets would not have real correlation which of course complicates theevaluation of the system.
10.2 Summary
An objective of this thesis was to create a case study which examines how a semanticsearch interface demonstrates the behaviour of an automated network managementsystem. The underlying network management system consisted of a Self-OrganizingNetwork (SON) function and a Markov Logic Network (MLN) reasoner with statisticaland logical reasoning capabilities.
The search interface was implemented as a faceted search interface with an ontologyas a data storage and a SPARQL engine as a query tool. The case study has fiveresearch questions (described in section 1.2) which defines the main focus of theimplementation. The objective is to find user’s information need, useful visualizationmethods, relevant facets, supporting functionality (in addition to faceted browsing),and a data architecture which is scalable for later projects.
The scope of this thesis includes both data architecture (ontology and data flow)design as well as graphical user interface (visualization and interaction) design. Withrespect to the research questions, the implementation has two significant aspects.First, the implementation aims to show that the design plan works in practice.Second, the evaluation of the demonstrator produces new answers and thoughts tothe research questions.
Considering the objective of the thesis, the evaluation of the demonstrator is rathercritical in order to reveal the relevant aspects which answer the research questions.Section 9 gives a rather accurate evaluation of the positive, negative, and the missingaspects of the current demonstrator. Therefore, the thesis can be seen to providean encompassing case study for semantic search interface implementation in thiscontext.
Moreover, as the search interface enables the user to acquire knowledge from thereasoning system, the user might discover new ideas and enhancements for thereasoning system itself. As section 10.1 shows, some new interesting research topicshave already come up from this case study.
80
References
[1] Ericsson. Ericsson Mobility Report. Technical report, Ericsson, 072014. http://www.ericsson.com/res/docs/2014/ericsson-mobility-report-june-2014.pdf.
[2] Cisco. Cisco Visual Networking Index: Global Mobile Data Traf-fic Forecast Update 2014–2019 White Paper. Technical report, Cisco,02 2015. http://www.cisco.com/c/en/us/solutions/collateral/service-provider/visual-networking-index-vni/white_paper_c11-520862.html.
[3] Seppo Hämäläinen, Henning Sanneck, and Cinzia Sartori. LTE Self-OrganisingNetworks (SON): Network Management Automation for Operational Efficiency.Wiley Online Library, 1st edition, 2012.
[4] Horn. Autonomic Computing: IBM’s Perspective on the Stateof Information Technology. IBM Corporation. Available athttp://www.research.ibm.com/autonomic/manifesto/autonomic_computing.pdf,October 2001.
[5] Nancy Samaan and Ahmed Karmouch. Towards autonomic network manage-ment: an analysis of current and future research directions. CommunicationsSurveys & Tutorials, IEEE, 11(3):22–36, 2009.
[6] Daniel M Russell, Paul P Maglio, Rowan Dordick, and Chalapathy Neti. Dealingwith ghosts: Managing the user experience of autonomic computing. IBMSystems Journal, 42(1):177–188, 2003.
[7] Lise Getoor. Introduction to statistical relational learning. MIT Press, 2007.
[8] Matthew Richardson and Pedro Domingos. Markov logic networks. MachineLearning, 62(1-2):107–136, February 2006.
[9] C.I. Cox. An Introduction to LTE: LTE, LTE-advanced, SAE, VoLTE and 4GMobile Communications. Wiley Online Library, 2014.
[10] Stefania Sesia, Issam Toufik, and Matthew Baker. LTE: the UMTS long termevolution, From Theory to Practice. Wiley Online Library, 2nd edition, 2011.
[11] Magdalena Nohrborg. Lte. http://www.3gpp.org/technologies/keywords-acronyms/98-lt. Accessed: 2015-02-16.
[12] 3GPP. Telecommunication management; self-organizing networks (son); con-cepts and requirements. http://www.etsi.org/deliver/etsi_ts/132500_132599/132500/12.01.00_60/ts_132500v120100p.pdf. Accessed: 2015-02-16.

81
[13] Olav Østerbø and Ole Grøndalen. Benefits of Self-Organizing Networks (SON)for mobile operators. Journal of Computer Networks and Communications,2012, 2012.
[14] Lasse Laine. 3rd Generation Partnership Project Long Term Evolution. Master’sthesis, Aalto University, Sep 2011.
[15] 3GPP. Telecommunication management; Self-Organizing Networks (SON)Policy Network Resource Model (NRM) Integration Reference Point (IRP);Requirements. Technical report, 3rd Generation Partnership Project, December2013.
[16] 3GPP. Technical Specification Group Services and System Aspects; Telecom-munication management; Self-Organizing Networks (SON); Study on self-healing. Technical report, 3rd Generation Partnership Project, December 2014.http://www.etsi.org/deliver/etsi_ts/132500_132599/132541/12.00.00_60/.
[17] T Kürner, M Amirijoo, I Balan, H van den Berg, A Eisenblätter, et al. Finalreport on self-organisation and its implications in wireless access networks, 2010.http://www.fp7-socrates.eu/files/Deliverables/.
[18] Juan Ramiro and Khalid Hamied. Self-Organizing Networks (SON): Self-Planning, Self-Optimization and Self-Healing for GSM, UMTS and LTE. WileyOnline Library, 2nd edition, 2011.
[19] A Eisenblatter, B Gonzalez Rodriguez, Fredrik Gunnarsson, T Kurner, RemcoLitjens, Bart Sas, Berna Sayrac, Lars Christoph Schmelz, and Colin Willcock.Integrated self-management for future radio access networks: Vision and keychallenges. In Future Network and Mobile Summit (FutureNetworkSummit),2013, pages 1–10. IEEE, 2013.
[20] L. Jorguseski, A. Pais, F. Gunnarsson, A. Centonza, and C. Willcock. Self-organizing networks in 3gpp: standardization and future trends. Communica-tions Magazine, IEEE, 52(12):28–34, December 2014.
[21] Brendan Jennings, Sven van der Meer, Sasitharan Balasubramaniam, DmitriBotvich, Mícheál ó Foghlú, William Donnelly, and Johannes Strassner. To-wards autonomic management of communications networks. CommunicationsMagazine, IEEE, 45(10):112–121, 2007.
[22] S. Kuklinski, M. Skrocki, L. Rajewski, J. Meseguer Llopis, and Z. Wereszczynski.Garson: Management performance aware approach to autonomic and cognitivenetworks. In Globecom Workshops (GC Wkshps), 2012 IEEE, pages 914–918,Dec 2012.
[23] Stuart Russell, Peter Norvig, and Artificial Intelligence. A modern approach.Artificial Intelligence. Prentice-Hall, Egnlewood Cliffs, 25, 1995.
82
[24] Randall Davis, Howard Shrobe, and Peter Szolovits. What Is a KnowledgeRepresentation? AI Magazine, 14(1), 1993.
[25] Franz Baader, Diego Calvanese, Deborah L. McGuinness, Daniele Nardi, andPeter F. Patel-Schneider, editors. The Description Logic Handbook: Theory,Implementation, and Applications. Cambridge University Press, New York, NY,USA, 2003.
[26] Grigoris Antoniou and Frank Van Harmelen. A Semantic Web Primer. MITPress, 2004.
[27] Deborah L. McGuinnessy and Frank van Harmelen. Owl web ontology languageoverview. Technical report, W3C, February 2004. http://www.w3.org/TR/owl-features/.
[28] W3C OWL Working Group. OWL 2 Web Ontology Language DocumentOverview. second edition, W3C, December 2012. http://www.w3.org/TR/owl2-overview/.
[29] Antoine Isaac and Ed Summers. Skos simple knowledge organization systemprimer. Technical report, W3C, August 2009. http://www.w3.org/TR/skos-primer/.
[30] Steve Harris and Andy Seaborne. Sparql 1.1 query language. Technical report,W3C, December 2013. http://www.w3.org/TR/sparql11-query/.
[31] Abdulbaki Uzun and Axel Küpper. Openmobilenetwork: extending the web ofdata by a dataset for mobile networks and devices. In Proceedings of the 8thInternational Conference on Semantic Systems, pages 17–24. ACM, 2012.
[32] Anja Jentzsch Max Schmachtenberg, Christian Bizer and Richard Cyganiak. TheLinking Open Data cloud diagram 2014. http://lod-cloud.net/. Accessed:2015-08-25.
[33] Vilho Räisänen and Haitao Tang. Knowledge modeling for conflict detection inself-organized networks. In Kostas Pentikousis, Rui Aguiar, Susana Sargento,and Ramón Agüero, editors, Mobile Networks and Management, volume 97 ofLecture Notes of the Institute for Computer Sciences, Social Informatics andTelecommunications Engineering, pages 107–119. Springer Berlin Heidelberg,2012.
[34] Gabriela F Ciocarlie, Chih-Chieh Cheng, Christopher Connolly, Ulf Lindqvist,Kenneth Nitz, Szabolcs Novaczki, Henning Sanneck, and Muhammad Naseer-ulIslam. Demo: SONVer: SON verification for operational cellular networks. InWireless Communications Systems (ISWCS), 2014 11th International Symposiumon, pages 611–612. IEEE, 2014.
[35] Daniel A. Keim. Information visualization and visual data mining. IEEETransactions on Visualization and Computer Graphics, 8(1):1–8, January 2002.

83
[36] Ben Shneiderman. The eyes have it: A task by data type taxonomy forinformation visualizations. In Proceedings of the 1996 IEEE Symposium onVisual Languages, VL ’96, pages 336–343, Washington, DC, USA, 1996. IEEEComputer Society.
[37] Ryen W. White and Resa A. Roth. Exploratory Search: Beyond the Query-Response Paradigm. Synthesis Lectures on Information Concepts, Retrieval,and Services, 1(1):1–98, January 2009.
[38] Gary Marchionini. Exploratory search: From finding to understanding. Com-mun. ACM, 49(4):41–46, April 2006.
[39] Jürgen Koenemann and Nicholas J Belkin. A case for interaction: a study ofinteractive information retrieval behavior and effectiveness. In Proceedings ofthe SIGCHI conference on Human factors in computing systems, pages 205–212.ACM, 1996.
[40] Ka-Ping Yee, Kirsten Swearingen, Kevin Li, and Marti Hearst. Faceted metadatafor image search and browsing. In Proceedings of the SIGCHI Conference onHuman Factors in Computing Systems, CHI ’03, pages 401–408, New York, NY,USA, 2003. ACM.
[41] Daniel Tunkelang. Faceted search. Synthesis Lectures on Information Concepts,Retrieval, and Services, 1(1):1–80, 2009.
[42] Osma Suominen, Kim Viljanen, and Eero Hyvönen. User-centric faceted searchfor semantic portals. In Enrico Franconi, Michael Kifer, and Wolfgang May,editors, The Semantic Web: Research and Applications, volume 4519 of LectureNotes in Computer Science, pages 356–370. Springer Berlin Heidelberg, 2007.
[43] Carol Righi, Janice James, Michael Beasley, Donald L Day, Jean E Fox, JenniferGieber, Chris Howe, and Laconya Ruby. Card sort analysis best practices.Journal of Usability Studies, 8(3):69–89, 2013.
[44] Markus Holi. Crisp, Fuzzy, and Probabilistic Faceted Semantic Search. PhDthesis, Aalto University, 2010.
[45] Marcelo Arenas, Bernardo Cuenca Grau, Evgeny Evgeny, Sarunas Marciuska,and Dmitriy Zheleznyakov. Towards semantic faceted search. In Proceedings ofthe Companion Publication of the 23rd International Conference on World WideWeb Companion, WWW Companion ’14, pages 219–220, Republic and Canton ofGeneva, Switzerland, 2014. International World Wide Web Conferences SteeringCommittee.
[46] Lotfi A Zadeh. Fuzzy sets. Information and control, 8(3):338–353, 1965.
[47] A Seaborne. Fuseki: serving rdf data over http. http://jena.apache.org/documentation/serving_data/, 2011. [Online; Accessed: 2015-07-21].

84
[48] Blazegraph Wiki. Nanosparqlserver - blazegraph. https://wiki.blazegraph.com/wiki/index.php/NanoSparqlServer, 2015. [Online; Accessed: 2015-07-21].
[49] Jürgen Bock, Peter Haase, Qiu Ji, and Raphael Volz. Benchmarking OWLReasoners. In Frank van Harmelen, Andreas Herzig, Pascal Hitzler, Zuoquan Lin,Ruzica Piskac, , and Guilin Qi, editors, Proceedings of the ARea2008 Workshop,volume 350, http://ceur-ws.org, June 2008. CEUR Workshop Proceedings.
[50] Wiki. Force layout. https://github.com/mbostock/d3/wiki/Force-Layout,2015. [Online; Accessed: 2015-07-21].
[51] Almende B.V. vis.js documentation. http://visjs.org/docs. [Online;Accessed: 2015-05-30].
[52] Anonym. Sigma js. http://sigmajs.org/. [Online; Accessed: 2015-05-30].
[53] Rui Wang, Yasset Perez-Riverol, Henning Hermjakob, and Juan Antonio Viz-caíno. Open source libraries and frameworks for biological data visualisation: Aguide for developers. Proteomics, 2014.
[54] Max Franz. Cytoscape.js. http://js.cytoscape.org/. [Online; Accessed:2015-05-30].

85
A Appendix SPARQL Update Generating Indica-tor Facets
INSERT {?schemeUri a skos:ConceptScheme .?schemeUri skos:prefLabel ?prefLabel .?schemeUri a owl:namedIndividual .
?conceptUri a skos:Concept .?conceptUri skos:inScheme ?schemeUri .?conceptUri skos:prefLabel ?label .?conceptUri skos:altLabel ?label .?conceptUri c:facetOrder ?order .?conceptUri c:fuzzyMin ?min .?conceptUri c:fuzzyMax ?max .
?facetPropUri a owl:FunctionalProperty ,owl:ObjectProperty ;
rdfs:domain c:Cell ;rdfs:range ?range ;rdfs:subPropertyOf c:facetCellProperty ;
c:propertyRelationTo ?y .
}WHERE {?y rdfs:subPropertyOf c:cellHasIndicator?y rdfs:range ?range .?y skos:prefLabel ?prefLabel .BIND (URI(CONCAT("http://...#","Status",?prefLabel)) AS ?schemeUri)?x rdfs:subClassOf c:FuzzyValue .
?indType rdfs:subClassOf c:FuzzyValueForIndicator .?ind a ?indType .?ind skos:prefLabel ?label .?ind c:fuzzyMin ?min .?ind c:fuzzyMax ?max .
BIND((round(?min*100)) AS ?order)BIND (URI(CONCAT("http://...#",?label,?prefLabel)) AS ?conceptUri)BIND (URI(CONCAT("http://...#","facet",?prefLabel)) AS ?facetPropUri)FILTER (contains(str(?ind),?prefLabel))}

86
B Appendix SPARQL Update Generating RelationsBetween Facet Values and Instances
INSERT {?cell ?facetProp ?facet .
}WHERE {?prop rdfs:subPropertyOf c:hasIndicator .
?cell ?prop ?ind .?prop skos:prefLabel ?lab .BIND (URI(CONCAT("...","facet",?lab)) AS ?facetProp)BIND (URI(CONCAT("...","Status",?lab)) AS ?scheme)
?ind c:numericValue ?val .?facet skos:inScheme ?scheme .
?facet c:fuzzyMin ?min .?facet c:fuzzyMax ?max .FILTER( ?min < ?val) .FILTER( ?max >= ?val) .}
C Appendix SPARQL Update for Creating a NewRule
INSERT {
<http://www...#RuleContextCqiHigh1234>a <http://www...#MLNContext> ;<http://www...#ruleClause>
"I(t,c,Cqi,High))" ;<http://www...#ruleIndicator>
<http://www...#Cqi> ;<http://www...#ruleMagnitude>
<http://www...#HighValue> .
<http://www...#RuleObjectiveCqiDecrease1234>a <http://www...#MLNObjective> ;<http://www...#ruleClause>
"O(t,c,Cqi,Dec))" ;<http://www...#ruleImpact>
87
<http://www...#Decrease> ;<http://www...#ruleIndicator>
<http://www...#Cqi> .
<http://www...#RuleActionTxpDecrease1234>a <http://www...#MLNAction>;<http://www...#ruleClause>
"A(t,c,Txp,Dec))]" ;<http://www...#ruleImpact>
<http://www...#Decrease> ;<http://www...#ruleParameter>
<http://www...#Txp> .
<http://www...#Rule1234>a <http://www...#MLNRule> ;<http://www...#ruleAction>
<http://www...#RuleActionTxpDecrease1234> ;<http://www...#ruleClause>
"(I(t,c,Cqi,High)) => [(O(t,c,Cqi,Dec)) <=> (A(t,c,Txp,Dec))]" ;<http://www...#ruleContext>
<http://www...#RuleContextCqiHigh1234> ;<http://www...#ruleObjective>
<http://www...#RuleObjectiveCqiDecrease1234> ;<http://www...#ruleWeight>
"0.5"^^xsd:double .
}WHERE {}
D Appendix SPARQL Updates for Modifying andRemoving Rules
Updating a Weight
DELETE{c:Rule1234 c:ruleWeight ?weight .}INSERT {

88
c:Rule1234 c:ruleWeight "1.97"^^xsd:double .}WHERE {c:Rule1234 c:ruleWeight ?weight .}
Removing a Rule
DELETE{c:Rule1234 ?p ?o .?o ?p2 ?o2 .}INSERT {}WHERE {c:Rule1234 ?p ?o .OPTIONAL{?o ?p2 ?o2 . ?p2 rdfs:subPropertyOf c:RuleProperties . }}
Removing a Set of Rules
DELETE{?s ?p ?o .?o ?p2 ?o2 .}INSERT {
}WHERE {
?s <http://www...#facetMLNActionRet> <http://www...#MLNActionRetIncrease> .?s ?p ?o .OPTIONAL {?o ?p2 ?o2 . ?p2 rdfs:subPropertyOf c:RuleProperties .}
}