Embed Size (px)
Citation preview

ACTAUNIVERSITATIS
UPSALIENSISUPPSALA
2017
Digital Comprehensive Summaries of Uppsala Dissertationsfrom the Faculty of Medicine 1323
Self-rated health and respiratorysymptoms among civil aviationpilots
Occupational and non-occupational risk factors
XI FU
ISSN 1651-6206ISBN 978-91-554-9880-1urn:nbn:se:uu:diva-318806

Dissertation presented at Uppsala University to be publicly examined in Frödingsalen,Ulleråkersvägen 40, Uppsala, Monday, 22 May 2017 at 09:00 for the degree of Doctor ofPhilosophy (Faculty of Medicine). The examination will be conducted in English. Facultyexaminer: Berndt Stenberg (Department of Public Health and Clinic Medicine, UmeåUniversity).
AbstractFu, X. 2017. Self-rated health and respiratory symptoms among civil aviation pilots.Occupational and non-occupational risk factors. 79 pp. : Uppsala University.
There is concern about the indoor environment in aircraft but few stud-ies exist on self-ratedhealth (SRH) and respiratory symptoms among pilots. Occupational and non-occupational riskfactors for SRH, respira-tory symptoms and other symptoms among commercial pilots wereinvestigated in this thesis. One cohort study and one prevalence study were performed amongpilots in one Scandinavian airline company. Fungal DNA, furry pet allergens and volatileorganic compounds of microbial origin (MVOC) were measured on board. Cat (fel d1), dog (Canf1) and horse (Ecu cx) allergens were found in all dust samples and allergen levels were 27-75times higher in aircraft with textile seats as compared to leather surfaces. The sum of MVOCsin the cabin air was 3.7 times higher than in homes in Uppsala and 2-methyl-1-butanol and 3-methyl-1-butanol concentrations were 15-17 times higher. Asper-gillus/Penicillium DNA andAspergillus versicolor DNA were more common in aircraft with textile seats. One fifth reportedSRH as poor or fair, 62% had fatigue, 46% overweight/obesity and 71% insomnia. Poor or fairSRH was associated with overweight/obesity, lack of exercise, insomnia, low sense of coherence(SOC) and high work demand. Re-covery from work was worse among those with insomniaand low social support at work. Fatigue was more common among young or female pilots andrelated to insomnia and high work demand. Pilots flying MD80 or Saab 2000 aircraft had lessfatigue. Pilots exposed to environmental tobacco (ETS) on board had more eye symptoms andfatigue which were reduced after the ban of smoking (in 1997). Pilots with increased workdemand developed more rhinitis, dermal symptoms and fartigue and those with decreased workcontrol developed more eye symptoms. The incidence of doctors’ diagnosed asthma and atopywere 2.4 and 16.6 per 1000 person years, respectively. Pilots changing type of flight got moreairway infections. Those reporting decreased work control had a higher incidence of atopy. Riskfactors in the home environment included ETS, dampness or mould, window pane condensationin winter and living in houses built after 1975. In conclusion, SRH and respiratory health amongpilots are associated with specific occupational and non-occupational risk factors.
Keywords:
Xi Fu, Department of Medical Sciences, Occupational and Environmental Medicine,Akademiska sjukhuset, Uppsala University, SE-75185 Uppsala, Sweden.
© Xi Fu 2017
urn:nbn:se:uu:diva-318806 (http://urn.kb.se/resolve?urn=urn:nbn:se:uu:diva-318806)

To my family致我的家人

LIST OF PAPERS
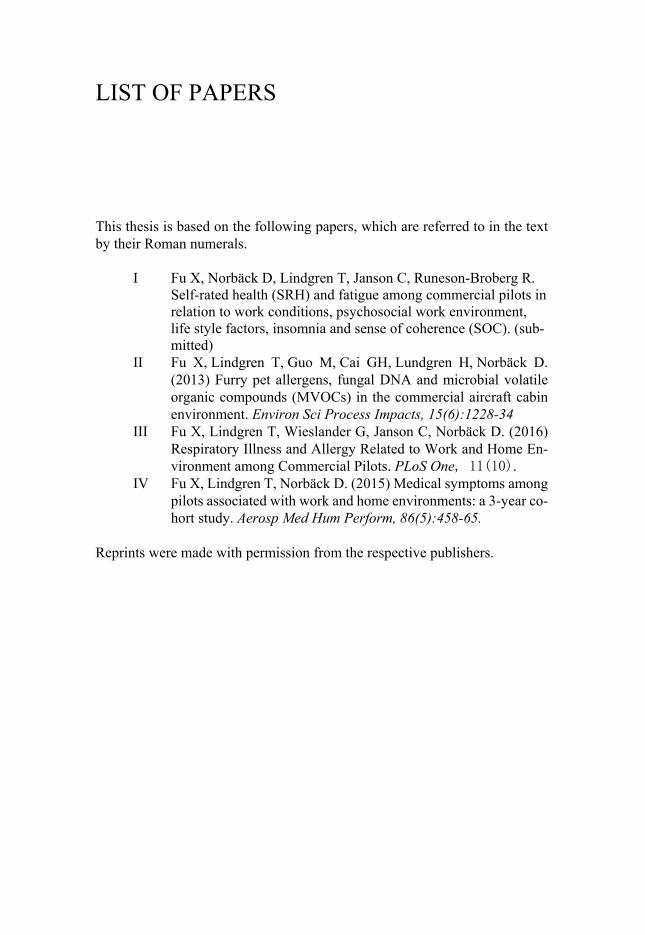
This thesis is based on the following papers, which are referred to in the text by their Roman numerals.
I Fu X, Norbäck D, Lindgren T, Janson C, Runeson-Broberg R.
Self-rated health (SRH) and fatigue among commercial pilots in relation to work conditions, psychosocial work environment, life style factors, insomnia and sense of coherence (SOC). (sub-mitted)
II Fu X, Lindgren T, Guo M, Cai GH, Lundgren H, Norbäck D. (2013) Furry pet allergens, fungal DNA and microbial volatile organic compounds (MVOCs) in the commercial aircraft cabin environment. Environ Sci Process Impacts, 15(6):1228-34
III Fu X, Lindgren T, Wieslander G, Janson C, Norbäck D. (2016) Respiratory Illness and Allergy Related to Work and Home En-vironment among Commercial Pilots. PLoS One, 11(10).
IV Fu X, Lindgren T, Norbäck D. (2015) Medical symptoms among pilots associated with work and home environments: a 3-year co-hort study. Aerosp Med Hum Perform, 86(5):458-65.
Reprints were made with permission from the respective publishers.


CONTENTS
INTRODUCTION ........................................................................................ 13 Aviation history ........................................................................................ 13 Stages during a flight ................................................................................ 14 Working conditions for pilots................................................................... 14 Ventilation in aircraft ............................................................................... 15 Exposures in the cockpit .......................................................................... 15 Exposures in the cabin .............................................................................. 16
VOCs and chemicals............................................................................ 16 Microorganisms and microbial compounds ......................................... 16 Viruses ................................................................................................. 17 Allergens .............................................................................................. 17 Environmental Tobacco Smoke (ETS) ................................................ 17
Pilots selection .......................................................................................... 18 Disease pattern in pilots ........................................................................... 18 Fatigue and sleep disturbance among pilots ............................................. 19 Self-Rated Health (SRH) .......................................................................... 19 Sense of Coherence (SOC) ....................................................................... 20 Psychosocial work environment ............................................................... 20 Indoor environment in the dwelling ......................................................... 20
BACKGROUND TO THIS THESIS ............................................................ 22
AIMS OF THE INVESTIGATION .............................................................. 23
MATERIAL AND METHODS .................................................................... 24 Study design and study population ........................................................... 24
Study I .................................................................................................. 24 Study II ................................................................................................ 24 Study III and IV ................................................................................... 24
Work conditions ....................................................................................... 25 Type of aircraft ......................................................................................... 25 Assessment of the cockpit and cabin environment ................................... 26
Dust sampling ...................................................................................... 26 Allergens analysis ................................................................................ 26 Analysis of fungal DNA by qPCR ....................................................... 26 Analysis of MVOC in the cabin air ..................................................... 27 Analysis of microbial growth in mineral insulation ............................ 27

Assessment of perceived cockpit environment ........................................ 27 Assessment of psychosocial work environment ....................................... 27 Assessment of home environmental factors ............................................. 28 Assessment of personal factors, and life style factors .............................. 29 Assessment of sleep length and insomnia ................................................ 29 Assessment of sense of coherence (SOC) ................................................ 30 Assessment of self-rated health and recovery from work ........................ 30 Assessment of respiratory health and allergy ........................................... 30 Assessment of other symptoms ................................................................ 31
Mucosal, dermal and general symptoms .............................................. 31 Fatigue and eye tiredness ..................................................................... 31
Statistical methods .................................................................................... 32 Study I .................................................................................................. 32 Study II ................................................................................................ 32 Study III and IV ................................................................................... 33
Ethics Statement ....................................................................................... 34
RESULTS ..................................................................................................... 35 Paper I ...................................................................................................... 35 Paper II ..................................................................................................... 39
Furry pet allergen levels ...................................................................... 39 Fungal DNA levels .............................................................................. 40 MVOC levels ....................................................................................... 40 Microbial growth in mineral insulation ............................................... 42
Paper III .................................................................................................... 42 Paper IV ................................................................................................... 47
GENERAL DISCUSSION ........................................................................... 51 Comments on selection bias ..................................................................... 51 Comments on internal validity of the questionnaire studies .................... 52 Comments on methodological aspects of the exposure measurements .... 52 Comments on external validity................................................................. 53 Comments on the measurements of furry pet allergens in aircraft ........... 54 Comments on exposure measurements of MVOC and fungal DNA in aircraft ...................................................................................................... 55 Comments on descriptive data on asthma and allergies ........................... 56 Associations between self-reported health and personal factors .............. 56 Comments on self-rated health (SRH) and personal factors .................... 57 Comments on recovery from work and personal factors .......................... 57 Comments on fatigue and personal factors .............................................. 57 Comments on headache and personal factors ........................................... 58 Comments on eye symptoms and personal factors................................... 58 Comments on nasal symptoms and personal factors ................................ 58 Comments on dermal symptoms and personal factors ............................. 59

Comments on health associations with the work environment ................ 59 Comments on exposure to ETS on board ................................................. 59 Comments on types of flights and type of aircraft ................................... 60 Comments on the psychosocial work environment .................................. 60 Comments on health associations with the home environment ................ 61
Age of the dwelling ............................................................................. 61 Type of dwelling .................................................................................. 62 Building dampness and indoor mould ................................................. 62 Window pane condensation in wintertime ........................................... 62 Indoor painting .................................................................................... 63 ETS at home ........................................................................................ 63 Furry pets ............................................................................................. 63
CONCLUSIONS AND IMPLICATIONS .................................................... 64
ACKNOWLEDGEMENT ............................................................................ 66
REFERENCES ............................................................................................. 69


ABBREVIATIONS
AFT Aft part of the cabin FD Flight deck FWD Forward part of the cabin IQR Interquartile range LSC Leather seat company MID Middle part of the cabin SRH Self-rated health SOC Sense of coherence TSC Textile seat company KLM Royal Dutch Airlines BETSI Building Energy, Technical Status
and Indoor environment WHO World Health Organization ETS Environmental Tobacco Smoke


13
INTRODUCTION
Aviation history Before modern aviation started, human had made thousands of attempts to fly. The earliest noted attempt was man-carrying kite flying in China in 5th century BC, and tower jumping in Europe in 9th century AD. Modern aviation started from devices lighter than air in 18th century, for instance, manned hot air bal-loons and hydrogen balloons, and airships. Leonardo da Vinci designed a hu-man-powered wing-flapping flying device in 15th century, but his manuscript remained unknown until 19th century. The first aviation paper was published by the Swedish scientist Emanuel Swedenborg in 1716, about the design of Swedenborg’s flying machine. George Cayley (1773-1857), an English engi-neer, was called “father of aeroplane”. He contributed theories to the physics of aircraft and the principle of modern heavier-than-air flight, and constructed the first modern glide. In the age of steam, steam engines with best power-to-weight ratio were developed, and the wings were also developed from bat-like wings to long, thin wings. The Wright brothers built gliders and had their own wind tunnel and did hundreds of experiments to test 200 wing designs. They made the first sustained flight with powered heavier-than-air aircraft in 1903. Based on efforts of many pioneers, flight turned to an established technology in 1910s. In 1927, the Swedish American aviator Charles Lindbergh made his non-stop solo flight from New York to Paris, 33.5h.
Early commercial flights started during World War I (1914-1918). Some military aircraft were converted as airliners for commercial use. The airliner industry matured in 1930s, and several consolidated national airlines with in-ternational services were established, including Imperial Airways in UK, Lufthansa in Germany, KLM in Netherlands and United Airlines in US. Mod-ern-looking airliners appeared, including Boeing 247 and Douglas DC-2. In 1935, the first profitable commercial aircraft Douglas DC-3 appeared, which made worldwide commercial flights possible. In 1940s, pressurized cabin were developed in airliners, in order to decrease the effect of low oxygen level and low pressure at cruise altitude.
Nowadays, airline transportation has become an important part of the global movement, and people’s life. In 2015, airlines transported 3.5 billion people all over the world. The global airlines network includes over 51000 routes, and there were 10000 flights per day on average [116].

14
Stages during a flight There are several stages during a flight: taxi, take off, climb, cruise, decent, landing. The flight sequence influences the cockpit and cabin environment. The airplane is supplied with electricity and conditioned air at the terminal. Before pushing back and taxi to the runway, the supply is disconnected. Dur-ing take-off, full power is applied to increase the speed to the pre-determined take-off speed. After take-off, the shape or the surface area of the wings are changed to increase the lift, and the airplane will climb until the cruise altitude (usually 10000-12000m). During take-off and climbing, the outdoor air flow of the cabin is decreased or shut off, and the air recirculation is up to 100%, in order not to reduce the power of engine. During cruise at 10000-12000m, the indoor air in cockpit and cabin is pressurized, and the air pressure in air-craft is provided as air pressure at 1800 - 3000m altitude, which is lower than regular indoor environment. Nowadays, the air pressure in the airplane during cruise is provided as the same level as the air pressure at 1800-2400 m alti-tude[138]. For long haul flight 7-12h, 80-90% of the flight time is under cruise condition. For the domestic short haul flights less than 1.5h, half or even more of the time could be under non-cruise situation.
Working conditions for pilots Different organizations have different definition of long-haul flight and short-haul flight. Eurocontrol defines that routes less than 1500km belong to short-haul, 1500-4000km belong to medium-haul, and over 4000km belong to long-haul [32]. American Airlines define that routes less than 4800km belong to short/medium-haul, and the routes more than that belong to long-haul.
Generally, wide-body aircraft are operated for long-haul flights, including Airbus A330/A340, A350, A380 and Boeing B747, B767, and narrow-body aircraft are operated for short/medium-haul flight, including Airbus A320, A321, Boeing B737 and other smaller aircraft.
Commercial pilots usually have contract with their airline company that they have to operate the same type of aircraft for several years. Therefore, they usually work on the same type of flight (long- or short-haul) for a period. Pi-lots working on short- and long-haul flights have different patterns. Pilots op-erating short-haul flights usually have early mornings and long duty days, and pilots operating long-haul flights usually have to work 7-12 h continuously and across several hours’ time difference. Their retire age is 60 years old.
15
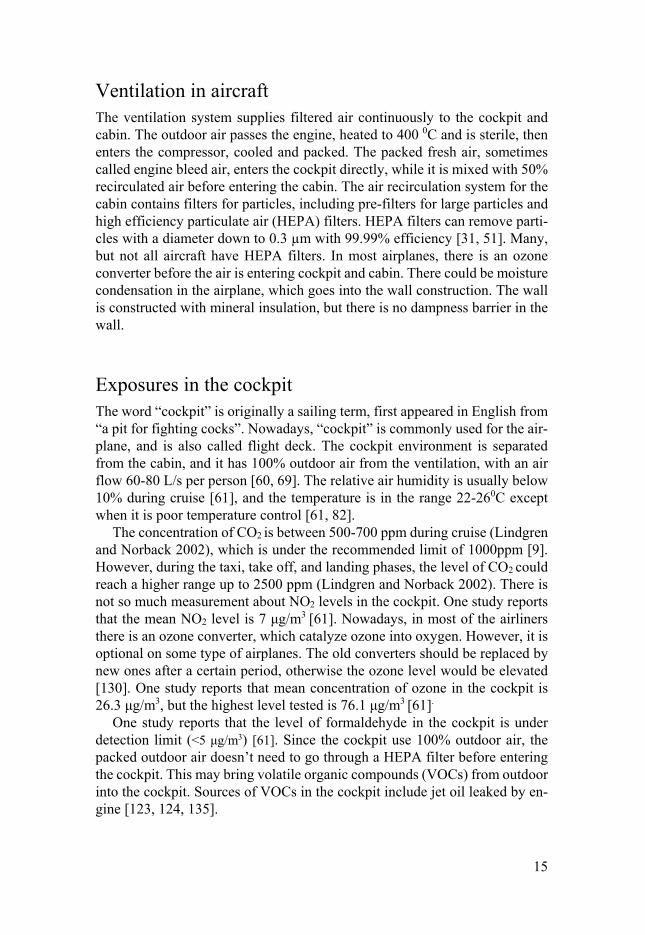
Ventilation in aircraft The ventilation system supplies filtered air continuously to the cockpit and cabin. The outdoor air passes the engine, heated to 400 0C and is sterile, then enters the compressor, cooled and packed. The packed fresh air, sometimes called engine bleed air, enters the cockpit directly, while it is mixed with 50% recirculated air before entering the cabin. The air recirculation system for the cabin contains filters for particles, including pre-filters for large particles and high efficiency particulate air (HEPA) filters. HEPA filters can remove parti-cles with a diameter down to 0.3 µm with 99.99% efficiency [31, 51]. Many, but not all aircraft have HEPA filters. In most airplanes, there is an ozone converter before the air is entering cockpit and cabin. There could be moisture condensation in the airplane, which goes into the wall construction. The wall is constructed with mineral insulation, but there is no dampness barrier in the wall.
Exposures in the cockpit The word “cockpit” is originally a sailing term, first appeared in English from “a pit for fighting cocks”. Nowadays, “cockpit” is commonly used for the air-plane, and is also called flight deck. The cockpit environment is separated from the cabin, and it has 100% outdoor air from the ventilation, with an air flow 60-80 L/s per person [60, 69]. The relative air humidity is usually below 10% during cruise [61], and the temperature is in the range 22-260C except when it is poor temperature control [61, 82].
The concentration of CO2 is between 500-700 ppm during cruise (Lindgren
and Norback 2002), which is under the recommended limit of 1000ppm [9]. However, during the taxi, take off, and landing phases, the level of CO2
could
reach a higher range up to 2500 ppm (Lindgren and Norback 2002). There is not so much measurement about NO2 levels in the cockpit. One study reports that the mean NO2 level is 7 μg/m3 [61]. Nowadays, in most of the airliners there is an ozone converter, which catalyze ozone into oxygen. However, it is optional on some type of airplanes. The old converters should be replaced by new ones after a certain period, otherwise the ozone level would be elevated [130]. One study reports that mean concentration of ozone in the cockpit is 26.3 μg/m3, but the highest level tested is 76.1 μg/m3 [61].
One study reports that the level of formaldehyde in the cockpit is under detection limit (<5 μg/m3) [61]. Since the cockpit use 100% outdoor air, the packed outdoor air doesn’t need to go through a HEPA filter before entering the cockpit. This may bring volatile organic compounds (VOCs) from outdoor into the cockpit. Sources of VOCs in the cockpit include jet oil leaked by en-gine [123, 124, 135].
16
Moisture in the airplane air may go into the airplane wall and condense, where there is a potential for bacteria and fungi growth. Smoking on board has become the history nowadays, but smoking was allowed on board several decades ago. At that time, the door between the cockpit and the cabin was sometimes open. Therefore, there was environmental tobacco smoke (ETS) exposure both in cockpit and cabin, even the pilots didn’t smoke. The smoking ban for Scandinavian airline started from Sep 1st, 1997.
Radiation exposure is from the sun. The level is elevated during the de-creasing phase of solar activity, and it is reported that elder pilots receive higher annual radiation exposure dose [39].
Exposures in the cabin There is a door between the cockpit and the cabin, which is usually locked nowadays. But before the September 11 attack in 2001, the door was some-times open, and the cockpit environment can be affected by the cabin air.
VOCs and chemicals Various chemicals are found in the cabin environment. Brominated flame re-tardants (BFR) are used in aircraft for high fire safety. Blood test reports BRF detected in serum of pilots, cabin crew and aircraft maintenance workers [113]. Compounds in the turbine and engine oil, tricresyl phosphate is detected in both wipe samples in the aircraft and samples from the HEPA filter [111].
Compounds originated from hydraulic oil, like dibutylphenyl phosphate and tri-n-butyl phosphate, emitted from vehicles on the ground [111].
There is one paper evaluating cabin environment in Airbus airplanes re-porting the levels of VOCs in the cabin. There are many VOCs detected, but most of them are under the quantification limit. The geometric mean concen-tration of the compounds quantified are as following: ethanol 593ppb, acetone 24 ppb, toluene 8ppb, formaldehyde 7 ppb, acetic acid 6 ppb, and nicotine 2 ppb [20]. A later German study reports concentrations of aldehydes in the cab-ins of Airbus airplanes during cruise, formaldehyde 5.7 µg/m3, acetaldehyde 6.5 µg/m3, and mostly very low concentrations of other aldehydes [94].
Microorganisms and microbial compounds Airborne bacteria exist in the cabin environment, due to passenger activity and high occupant density. The concentration of viable bacteria increases after during flight, possibly due to more frequent passenger and cabin crew activity [86]. A study using cultivating method reports that bacteria measured in the cabin environment include bacteria common on human skin surface or in dust

17
and outdoor air [71]. Fungi levels are low, and the predominating genera in-clude Cladosporium, Aspergillus, and Penicillium [70]. The cultivating method is very practical, but it may lose majority of the species [86]. In recent years, sequencing of 16S rRNA is used to identify microbial composition in a certain environment. A recent study analysed bacterial communities in HEPA filters from commercial aircraft cabin, by microarray sequencing of 16S rRNA and bio-informatics analysis [56]. The subfamilies detected in airplane cabin include bacteria from human skin, gastrointestinal tracts, respiratory tracts, and bacteria from water and soil. The bacterial composition in aircraft cabin differ from urban outdoor air [56]. Pathogens, as well as non-pathogens were detected [56]. There is not so much information about fungi levels in aircraft measured by molecular methods.
Endotoxin was detected both in air and dust in the cabin, and the mean endotoxin levels in air and settled dust are both higher than the mean levels reported in homes and office buildings [44]. Moreover, 3-hydroxy fatty acids, a marker of endotoxin, can be detected in settled seat dust and carpet dust [44].
Viruses HEPA filters have a high efficiency to remove particles and microorganisms with a diameter larger than 0.3 µm with 99.99% efficiency [45]. Fragment of bacteria and fungi (0.1-1.0 µm), and viruses (0.01-0.02 µm) may not be re-moved by the HEPA filter.
Allergens Aircraft cabin is a high density public indoor environment, and pet keepers may bring allergens on board. There are very few studies on pet allergen levels on board commercial aircraft. A New Zeeland study reports that, in domestic commercial aircraft cabin, cat allergen (Fel d1) level is higher on the seats than on the floor [68]. In some airlines, passengers are allowed to bring small furry pets with them, which increases the risk of allergen contamination on board.
Environmental Tobacco Smoke (ETS) Ban of smoking on board started in Sep 1, 1997 in the Scandinavian Airline. Before that, smoking was allowed on longitudinal flights, and some European flights. The level of respirable particles on board decreased drastically after the ban of smoking, from 66 to 3 microgram/m3 [61]

18
Pilots selection There are strict selection systems for commercial pilots. To be a pilot, the can-didate has to be over 18 years old, to complete secondary education and achieve national qualifications for English, mathematics, and science, to be proficient in English, and to have a Class 1 Pilot Medical Certificate [34, 37, 120], and to pass and complete the professional training program for a pilot on rules and skills regarding operating airplanes.
Disease pattern in pilots Different health issues related to pilots have been studied. A Norwegian study on medical causes of disqualification among pilots reported that pilots have been grounded due to ear, nose, and throat conditions, neurological conditions, and cardiovascular diseases [46]. Studies on mortality among commercial pi-lots reported that mortality among pilots was lower due to all causes, all cancer, and cardiovascular disease compared to general population, but it is elevated due to melanoma and aircraft accidents [139].
Some common diseases among commercial pilots have been reported. Over weight and obesity is a feature among commercial pilots, the combined prev-alence can be higher than 60% [19]. Prevalence of low back pain is 71% among Colombian airline pilots [33]. A big Nordic cohort study reports that skin cancer incidence is elevated among commercial pilots compared to na-tional incidence, including melanoma, squamous cell cancer, and basal cell carcinoma, and the risk is associated with years of employment [89]. A study on depression among pilots reports that longer duty hours are associated with feeling depressed or anxious [85]. More than half of the Danish pilots suffer from nose, and throat diseases caused by change of the air pressure, like ear, nose, or throat barotrauma, barotitis media, and barosinusitis, and the preva-lence of these diseases have increased during recent years [11].
Self-administered questionnaire studies report some common symptoms among commercial pilots. Musculoskeletal symptoms were commonly re-ported, and about half of the pilots reported neck, shoulders, and lower back pains [95]. Digestive symptoms were common reported, and more than 60% of the pilots reported bloating [62]. About 40% of the pilots reported tinnitus experience during the last year [63]. Ocular, nasal, and dermal symptoms were also reported by commercial pilots [59].

19
Fatigue and sleep disturbance among pilots Sleep disturbance and fatigue are common among commercial pilots, either working on long-haul flights or short-haul flights. One recent study reports that the prevalence of daytime sleepiness among air commercial pilots is 59.3%, and the prevalence of fatigue is high up to 90.6% [92], and about 70% of the pilots reported insomnia in another study [97]. There are sleep research among pilots done recently among pilots on short- and long-haul flight [103]. For fatigue and sleep problem, night work hours and time zone shifting are main risk factors among pilots operating long-haul flights, and frequent early mornings and long duty hours are main reasons among those operating short-haul flights [91]. These problems are associated with obesity. One study re-ports that the main risk factor for obesity among pilots is working night-shifts for several years, and having difficulties relaxing after work [19]. Besides, there are other risk factors for fatigue among pilots reported by a recent study, including higher age, more need for recovery, poorer perceived health, less physical activity, and moderate alcohol consumption [122]. One study on sleeping problems among pilots reports that psychosocial work environment is important for pilots. High demand at work and low social support are asso-ciated with sleeping problems [97].
Self-Rated Health (SRH) Self-rated health (SRH), also called self-reported health or perceived health, is a widely used indicator of health [18], and has been proved to be a reliable predictor of mortality [47]. SRH is assessed by one question asking: “In gen-eral, how would you like to describe your health?” The question usually has four or five options, from “excellent”, to “poor” or “very bad” [47, 115]. SRH is associated with a number of personal factors, life-style factors and occupa-tion risk factor. Females have lower SRH [107] and ageing is associated with poor SRH [77]. Income and education level can also influence SRH as re-ported from studies involving different countries [3, 84]. Associations be-tween obesity and poor SRH has been reported in large population studies [3, 78]. Low social support, high work demand, and bullying or violence at work have been reported as risk factors for SRH [77]. Social support is reported positively associated with SRH in older people [17, 57]. A few studies have investigated association between sleep length and SRH and they found that insufficient sleep is associated with poor SRH [38, 41, 76]. We found no pre-vious study on SRH among commercial pilots.
20
Sense of Coherence (SOC) The conception of sense of coherence was raised by Antonovsky for the salutogenic model. The SOC construct is a dispositional orientation, including comprehensibility, manageability, and meaningfulness. It reflects the capabil-ity of an individual to cope with stressful situation, and can have positive in-fluence on health [5, 6]. The life orientation questionnaire, SOC scale, was developed by Antonovsky, including 29 items, which has a shorter version of 13 items. SOC-29 and SOC-13 were both widely used [7, 29]. In recent years, a 3-item SOC scale was developed [66, 106]. A high SOC was associated with better SRH among Japanese factory workers [121]. A Canadian population study reported that SOC may act as an intermediate factors which buffers the stressors in life [93]. A review article concluded that a stronger SOC is asso-ciated with higher perceived health, better mental health, less health com-plaints, and fewer somatoform symptoms [36]. We found no previous study on SOC as a risk factor for self-rated health or respiratory symptoms among commercial pilots.
Psychosocial work environment The work demands-control model is the most dominating and commonly used model for examining occupational work stress. The model was developed by Karasek in 1979. The theory hypothesized that high demands (strain) - low control (isolated) was the most stressful situation. The model is also called iso-strain model [52-54]. The model was improved by including social support at the work place in the model. In the demands-control-support model, the occupation situation with high demands, low control, and low social support is most harmful [49, 50]. Demand-control-support structure at work is im-portant to occupational health, and it was reported to be associated with eye symptoms and fatigue [98]. We found two previous studies investigation work stress by the demand-control-support model among commercial pilots. These studies investigated the role of occupational stress among pilots for sleep [97] and musculoskeletal symptoms [95]. We found no previous study on occupa-tional stress measured by the demand-control-support model as a risk factor for self-rated health or respiratory symptoms among commercial pilots.
Indoor environment in the dwelling The home environment is the indoor environment where we spend most of our time. There are a number of environmental risk factors in the home environ-ment, including building dampness and indoor mould, bacteria, furry pet al-
21
lergens, environmental tobacco smoke, and chemical emissions such as for-maldehyde and volatile organic compounds [10, 73]. Dampness and microbial growth, causing increased levels of mould, bacteria, microbial compounds and chemical related to degradation of building materials due to dampness is a well-recognised cause of asthma and respiratory symptoms [136]. The nation-wide Swedish BETSI study have demonstrated that dampness and mould is common in Swedish homes [128, 129]. Moreover, many homes does not fulfil the Swedish ventilation standard of at least 0.5 air exchanges per hour [128]. Window pane condensation in wintertime is an indicator of a combination of high air humidity and low air exchange rate, and is related to impaired indoor home [25, 131]. In the nationwide BETSI study, window pane condensation is a risk factor for rhinitis and asthmatic symptoms [129]. New building ma-terials have an increased emission of various chemical compounds, and one study from South Korea have demonstrated an increase of respiratory symp-toms in new dwellings [58]. Moreover, recent redecoration and indoor paint-ing has been demonstrated to be associated with an increase of respiratory symptoms [73]. Moreover, it has been demonstrated that the ownership of the building and the type of building can influence the prevalence of medical symptoms [26, 27]. We found no previous study on how indoor exposures in the home environment can influence asthma, rhinitis, respiratory symptoms and other types of medical symptoms among commercial pilots.

22
BACKGROUND TO THIS THESIS
There is an increasing concern about the indoor exposure in civil aviation, both for passengers, cabin attendants and pilots. Measurements of indoor ex-posure in aircraft have mainly focused on exposure in the aircraft cabin and few measurements have been performed in the cockpit. There is a need to bet-ter characterize the indoor environment in the cockpit. Since the ventilation systems are separated between the cabin and the cockpit, measurements in the cabin may not reflect the exposure among the pilots. Pilots are selected to be healthy but can develop different types of disease over time. Epidemiological studies among pilots have mainly focused on mortality, cancer risk and sleep disorders. Few studies exist on self-rated health, asthma, allergies and respir-atory symptoms among pilots. The increased competition between the airlines have increased the work-related stress. There is a need for more studies on the role of work stress and personality for self-rated health, stress-related diseases and symptoms among pilots. Since health among pilots can be influence by non-occupational risk factors such as lifestyle factors and the home environ-ment, epidemiological studies are needed that include all these aspects of life.

23
AIMS OF THE INVESTIGATION
1. To study associations between self-rated health (SRH), recovery from work, fatigue and eye tiredness, and selected personal and life style factors (age, gender, BMI tobacco use, marital status, number of children, exercise fre-quency), work conditions (employment time, position, type of aircraft), psy-chosocial work environment (demand, control, social support model), sense of coherence (SOC), insomnia and sleep length.
2. To measure the concentrations of cat (Fel d1), dog (Can f1) and horse (Ecu cx) allergens and five sequences of fungal DNA in vacuumed dust from the cabin and the cockpit of aircraft with textile seats and leather seats.
3. To measure MVOC concentrations in the cabin in aircraft and to compare these levels with MVOC levels measured by the same methodology in a ran-dom sample of homes in Northern Europe. 4. To investigate the prevalence and 3-year incidence of self-reported asthma, asthma symptoms, bronchitis, nonspecific hyper-reactivity and respiratory in-fections among commercial airplane pilots 5. To investigate the prevalence and 3-year incidence of ocular, nasal and der-mal symptoms, headache, tiredness and perceptions of dry air, stuffy air and odour at work among commercial airplane pilots.
6. To study associations between these health variables and flight type (long/short-haul flight), environmental tobacco smoke (ETS) on board, self-reported psychosocial work conditions and selected home environment factors (dampness/mould, window pane condensation, recent redecoration, age of the building and type of building).
7. To study how changes of these risk factors (personal, psychosocial, occu-pational and domestic factors) are associated with changes of environmental perceptions and medical symptoms.
8. To study long-term health effects on pilots of eliminating ETS on board in the 3-year cohort.
24
MATERIAL AND METHODS
Study design and study population Study I This study was based on questionnaire investigations among commercial pi-lots in a Scandinavian airline company. In 2008 February to March, a self-administered questionnaire was sent to all Stockholm-based pilots (flight cap-tains and flight officers) on duty in the airline company (N=585), and 61% participated (N=354).
Study II Dust samples were collected from 18 flights belonging to two airline compa-nies, 9 flights from each company. In each flight, four dust samples represent-ing flight deck (FD), forward part of the cabin (FWD), the middle part of the cabin (MID) and the aft part of the cabin (AFT) were collected. One MID sample was missing. Therefore, 35 dust samples from TSC and 36 dust sam-ples from LSC were available for the studies. Airborne MVOC were sampled in the cabin in TSC airplanes, during cruise, in 42 other aircraft (Boeing 767, Airbus 320 and Airbus 340).
Study III and IV These two studies were based on questionnaire investigations among commer-cial pilots in a Scandinavian airline company. A self-administered question-naire was mailed to all Stockholm-based pilots (flight captains and flight of-ficers) on duty in the airline company in February to March 1997 (N=622), 577 pilots participated (93%). Three years later, in February to March 2000, the same questionnaire was sent to all pilots who participated in 1997, 436 participated (76%). The cohort of 436 pilots participating twice was the study cohort.
25
Work conditions All pilots had a rotating work schedule, changing aircraft from day to day, but they operated the same type of aircraft for a longer period, one year or more, as they were contracted with the company.
In study I, there were questions on number of years being an active pilot, position (flight captain or flight officer) and type of airplanes. Short haul flights were defined as flights within Europe with duration of less than 7 hours. Long haul flights were defined as intercontinental flights between Scandinavia and America or Asia with flight duration of 7-12 hours. When the baseline questionnaire study for Study III and IV was performed in 1997, smoking was allowed on all intercontinental flights and on flights to destinations south of the Alps (3–5 h), and to Greenland (5 h), but not on shorter European flights (1–3 h) or Scandinavian domestic flights (0.6–1.5 h). After 1st September 1997, smoking was banned on all flights, but sporadic occupational ETS ex-posure could occur in other workplace indoor environments (e.g. in meeting rooms in countries where smoking was allowed). Questions on work environ-ment factors included long/short haul flight in last three months. Working on long-haul flights at baseline was an indicator of environmental tobacco smoke (ETS) exposure on board. Study I was performed in 2008 February to March, and there were major organisational changes introduced in the airline com-pany during spring 2004. The hotel nights for crew on long distance flights were cut down from 2-3 to 1-2, and the time off duty after a long flight was cut down from 5 to 3 days. There was an approximately 20% increase of yearly work hours (120-160 hrs).
Type of aircraft In study I, the types of plane included Airbus 330/340, the MD80 series, Boe-ing737, and Saab 2000. Airbus 330/340 were operated for inter-continental flights with a duration 7-12 h. Boeing 737 and MD80 series were operated for European flights and domestic Scandinavian flights with a duration less than 6 h, and Saab 2000 was only operated for domestic flights. In study II, flights from TSC included four Airbus 340 airplanes, three Boeing 737 airplanes and two McDonnell Douglas MD-80 airplanes, while all air-planes from LSC were airbus models 320-340. In study III and IV, the types of airplane included Fokker F-28, Mc Donnell Douglas DC-9-21/41/81, and Mc Donnell Douglas MD-80/90 series. All intercontinental flights were operated by Boeing 767 series.

26
Assessment of the cockpit and cabin environment Dust sampling In study II, dust sampling was performed while the airplane was on the ground, between flights, before the ordinary cleaning staff arrived to clean the cabin. Settled dust was collected by a vacuum cleaner (Siemens Super XS din e 188W) operated at 1200 W. It was provided with a special ALK dust collec-tor equipped with a filter. Vacuum cleaning was performed for totally 4 minutes per sample, 2 minutes on upper surfaces (passenger seats) and 2 minutes on the floor as in previous indoor studies [55, 140]. For the sample from the cockpit all seats and floor area were vacuumed. For each sample from the cabin, 10 passenger seats and the floor area below the seats were vacu-umed. All filters were sealed in plastic bags and stored at –20 °C until dust samples were taken for allergen and fungal DNA analysis.
Allergens analysis Samples of settled dust (100 mg) were extracted and analyzed for the content of allergens. Enzyme-Linked Immunosorbent Assay (ELISA) was applied to determine the allergen levels of cat (Fel d1), dog (Can f1) (Indoor Biotechnol-ogies Ltd, Manchester, UK), and horse (Equ cx) allergens (Mabtech, Stock-holm, Sweden) [55] as previously described [24, 140]. The cat and dog aller-gen concentrations were presented as ng/g dust, while the horse allergen was presented as Units/g dust (U/g), where 1 Unit is a standard equal to 1 ng pro-tein extracted from horsehair and dander (Allergon, Valinge, Sweden and NIBSC, Hertfordshire, UK). The detection limits for Fel d1, Can f1 and Equ cx were 50 ng/g, 160 ng/g and 80 ng/g dust.
Analysis of fungal DNA by qPCR The method has been previously described. Briefly fungal DNA was extracted from 10 mg of sieved dust and five multiplex reactions [14] were performed in five separate tubes targeting the DNA of the following species: total fungi, Aspergillus/Penicillium (Asp/Pen), Aspergillus versicolor (A. versicolor), Stachybotrys chartarum (S. chartarum) and Streptomyces. The reaction tar-geting A. versicolor simultaneously amplified an internal positive control that was used to detect PCR inhibition. The DNA level was expressed as cell equivalents (CE), assuming one sequence per cell [14]. The final result was presented as CE/g dust.

27
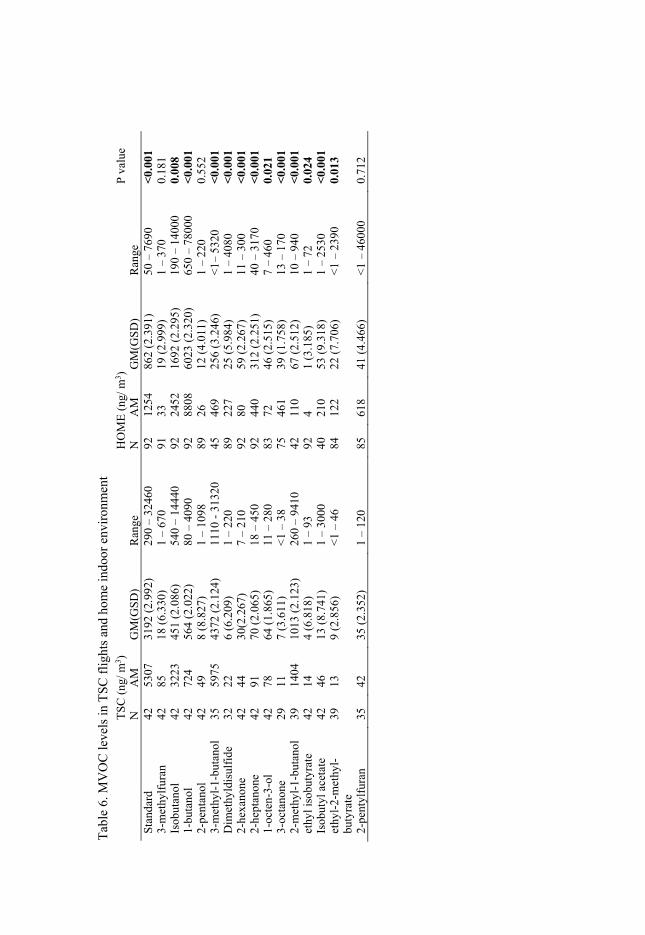
Analysis of MVOC in the cabin air In study II, airborne MVOC were sampled on charcoal tubes (Anasorb 747, SKC Inc) (0.25 L/min; 4 hours) during cruise. The tubes were desorbed with methylene chloride and analyzed by selective ion monitoring (SIM) gas chro-matography mass spectrometry (GC-MS) [99, 140]. The following 15 com-pounds were measured; 3-methylfuran, 2-butanol, 1-butanol, 2-pentanol, 3-metyl-1-butanol, dimethyldisulfid (DMDS), 2-hexanone, 2-heptanone, 1-oc-ten-3-ol, 3-octanone, 2-metyl-1-butanol, ethylisobutyrate, isobutylacetate, ethyl-2-metylbutyrate, 2-pentylfuran. The total concentration of the selected MVOC was calculated (13 compounds), by mass summation, excluding the butanols. The detection limit was 1 ng/m3 for all MVOC. The levels of MVOC were compared with previously collected data from a random sample of 92 homes in Reykjavik (Iceland), Uppsala (Sweden) and Tartu (Estonia) [99].
Analysis of microbial growth in mineral insulation In study II, we have analyzed one mineral insulation sample taken from the wall of one aircraft, when the interior of the wall removed for a scheduled inspection. The sample was analyzed for total and viable mould and bacteria by the CAMNEA method [87, 127]. This method analyzes total levels of mould and bacteria by staining and fluorescence microscopy. In addition, vi-able mould and bacteria were analyzed by cultivation on two media. We ap-plied empirical reference values from the microbiological laboratory.
Assessment of perceived cockpit environment In Study III and IV, there were three questions on perceived work environment in the questionnaire: perception of stuffy air, perception of dry air and passive smoking at work, all with a recall time of 3 months. Work environment for pilots mainly referred to the flight deck environment, but they also spent some time in the cabin and shorter times in meeting rooms in the airports. Each question had three alternatives, never, sometimes, and often (every week). The questions on air quality perceptions were obtained from a standardized indoor questionnaire (MM 040 NA) developed by the Department of Occupational and Environmental Medicine in Örebro University Hospital [4]
Assessment of psychosocial work environment The demand-control-support model, also called the iso-strain model, was used to assess the psychosocial work environment [50] as described in the previous study [53, 97, 104]. In Study I, there were five questions on work demand, six
28
questions on work control, and sixteen questions on psychosocial support from colleagues and supervisors. There were four options of each question, from most favourable condition to most unfavourable condition. The answers were assigned 0 to 3 scores accordingly, which means more unfavourable con-ditions gains the higher scores. High demands was defined as having too much to do in a short period of time. Low control was defined as not having enough influence over the way the work should be performed. Low support was de-fined as not having a sufficient support from co-workers and supervisors. The validity of the questionnaire for the iso-stain part was previously tested [117]. The validity and internal homogeneity were high for the demands index. The index for control was found to be well suited for population studies involving a wide range of work tasks. The reliability of the demands and control indices had Cronbach’s alpha 0.84 and 0.83 respectively [125] and social support in-dex had Cronbach’s alpha 0.79 [126].
In Study III and IV, a short version, containing four questions, of demand-control-support model was used. The question ‘‘interesting/stimulation at work’’ measure work satisfaction. The question ‘‘opportunity to influence working conditions’’ measure the degree of influence on working conditions, and the question ‘‘Do you get help from your colleagues when you have a problem at work’’ measure the degree of social support. Finally there was a question on ‘‘too much work to do’’, which covered stress due to an excess of work. The questions on psychosocial conditions had four possible answers: ‘‘yes, often’’, ‘‘yes sometimes’’, ‘‘no, seldom’’, and ‘‘no, never’’. These questions were obtained from another questionnaire [4, 60], which was devel-oped by the Clinic for Occupational and Environmental Medicine, Depart-ment of Medical Sciences, Uppsala University [101].
Assessment of home environmental factors In Study III and IV, information on the current home environment included type of home (single-family house, apartment, other), ownership (own house, own apartment, rented apartment) construction year of the building, year mov-ing to the current home, furry pet keeping, and environmental tobacco smoke (ETS). There were three levels for construction year, including “before 1960”, “1960-1975”, and “after 1975”. Moreover, there were yes/no questions about the indoor painting and redecoration last 12 months, window pane condensa-tion in winter, and four yes/no questions on water damage, visible indoor mould, signs of floor dampness (bubbles on vinyl floor or blackened parquet) and mould odour at home the last 12 months. The four questions on dampness were combined (any dampness yes/no). The questions about the home envi-ronment were obtained from an additional home environment questionnaire developed for the European Community Respiratory Health Survey (ECRHS) adapted for North European home environment conditions [79].

29
Assessment of personal factors, and life style factors The questions on personal information included age, gender, height, weight, smoking history, and use of oral tobacco (snuff). In study I, age was catego-rized in four groups: 31-40 y, 41-50 y, 51-60 y, and more than 60 y, and in study III and IV, age was a continuous variable. The normal retiring age was 60 y. Body mass index (BMI) was calculated, defined as body mass divided by the square of height. As defined by World Health Organization [137], BMI was categorized as: underweight (<18.5), normal (18.5-24.99), overweight (>= 25.00), and obese (>= 30.00). The variables for smoking habits and use of snuff were both categorized into three classes: daily or sometimes, quit, and never smoked or never used snuff. Moreover, there were questions on marital status, number of children and age of the children living at home. Marital sta-tus was categorized as married/couple, weekend couple, or single. People who were married or lived together with their partner were defined as “mar-ried/couple”. People who had a relationship but did not live with their partner were defined as “weekend couple”. There was one question on exercise fre-quency with five options coded as: “sometimes” (0), “1 time/week”(2) , “2-4 times per week” (3) and “more than 5 times per week” (4). Finally, there was one question on the average amount of free time after work, without any re-quirements. There were four options coded as: “half an hour/day” (0), “1-2 hours/day” (1), “3-4 hours/day” (2) and “5-6 hours/day” (3). (Study I)
The questions on personal factors in Study III and IV included age, gender, smoking habits and atopy. A current smoker was defined as a subject who reported current smoking (>1 cigarette/ day) in the questionnaire, or who had stopped smoking <6 months ago.
Assessment of sleep length and insomnia There were one question on average number of sleeping hours per night with three options: “4-5 hours”, “6-8 hours” and “more than 8 hours”. Questions on sleep disturbance were adapted from a previous sleep questionnaire [1]. There were three questions asking about difficulty to sleep, repeated awaken-ings with difficulty falling back to sleep, and too early final awakening, with a 3 months recall period. There were four options for each question: “most of the time”, “sometimes”, “seldom” or “never”. Insomnia was defined as report-ing at least one of the three symptoms most of the time or sometimes [62].

30
Assessment of sense of coherence (SOC) A short version of SOC was adapted from Lundberg and Nyström[66]. There were one question for each of three dimensions- a) manageability, b) mean-ingfulness, and c) comprehensibility. The questions were as follows:
a) Do you usually see a solution to problems and difficulties that other people find hopeless?
b) Do you usually feel that your daily life is a source of personal satis-faction?
c) Do you usually feel that the things that happen to you in your daily life are hard to understand?
There were five options for each question: “very often”, “quite often”, “some-times”, “seldom” and “never”. Manageability and meaningfulness were cate-gorized and assigned scores as four categories: very often (3), quite often (2), sometimes (1), and seldom or never (0) due to small numbers for the never options. The variable of comprehensibility was categorized and assigned scores as: very or quite often (0), sometimes (1), seldom (2), and never (3), due to small numbers for the “very often” option. The SOC variable was de-fined as a total SOC score which was the sum of the three variables, ranging from 0-9. (Study I)
Assessment of self-rated health and recovery from work There was one question assessing SRH: “In general, how would you like to describe your health?” [18, 47]. There were four options: “excellent”, “very good”, “fair”, and “poor”. The variable was coded as: excellent (2), very good (1) and fair or poor (0) since there were few pilots reporting poor health.
There was one question on recovery from work: “Do you feel rested and recovered when you start working again after a couple of days off?” [43]. There were five options: “very often”, “quite often”, “sometimes”, “seldom”, and “never”. The variable “recovery from work” was coded as: very often (3), quite often (2), sometimes (1), and seldom or never (0) since few pilots re-ported “never”.
Assessment of respiratory health and allergy In Study III, there were five “yes/no” questions about asthma symptoms with a recall time of 12 months, including wheezing in chest at any time, attack of breathlessness at rest, attacks of breathlessness after exercise, woken up by attacks of breathlessness, and asthma attacks last 12 month. Subjects reporting at least one of these symptoms were defined as having current asthma symp-toms. In addition, there were two more “yes/no” questions on ever had doctor

31
diagnosed asthma, and any current medication for asthma (spray, inhalation powder or tablets). Moreover, there were three “yes/no” questions about other respiratory symptoms, including bronchitis (coughing up phlegm often), non-specific hyper-reactivity in eyes or airways (easily irritated in eyes or respira-tory tract by cigarettes smoke, exhaust or solvents), and airway infections (common cold and other respiratory infections). Besides, there were two “yes/no” questions on hay fever/pollen allergy and allergy to furry pets re-spectively. Atopy was defined as allergy to pollen or furry pets. The questions on asthma and respiratory symptoms were obtained from ECRHS study [79], and two Swedish population studies [80, 96].
Assessment of other symptoms Mucosal, dermal and general symptoms Questions about symptoms last week included eye symptoms (7 questions), nose symptoms (4 questions), skin symptoms (5 questions), headache (1 ques-tion) and tiredness (1 question) [132, 134]. There were two options to answer in this section (yes/no). At least one “yes” in each group of questions (eye, nose and dermal symptoms) was required to be counted for the relevant symp-tom last week.
The questions about symptoms the last 3 months included eye symptoms (1 question), nose symptoms (1 question), skin symptoms (3 questions), head-ache (1 question) and tiredness (1 question). There were three alternatives to each question, no never, yes sometimes and yes often (every week).The ques-tions for skin symptoms were combined as any skin symptom if there was one “yes” for any of the three questions. Eye symptoms were defined as reporting either history of itching, burning or irritation of the eyes. Nose symptoms were defined as irritated, stuffy or runny nose [133]. Skin symptoms were defined as reporting either history of dry flushed facial skin, scaling/itching scalp or ears and hands dry, itching, red skin [4, 59]. Dichotomous variables called any eye symptom, any nose symptom, and any skin symptom were created by counting whether there was at least one “yes” answer for these symptoms in the last week. Symptom scores were used to count all the “yes” answers to each symptoms in the last 3 months.
Fatigue and eye tiredness The question on fatigue asked about tiredness or sleepiness during work or lei-sure time. The question on eye tiredness asked about irritation or tiredness in eyes. There were four options for both questions: “most of the time”, “some-times”, “seldom”, and “never”. Both variables were categorized as dichotomous variables: most of the time or sometimes (1) and seldom or never (0) [1, 97].

32
Statistical methods
Study I In study I, associations between different factors and SRH and recovery were calculated by ordinal regression, and associations between different factors and fatigue and eye tiredness were calculated by multiple logistic regression.
For SOC, work demand, work control, and social support at work, mean, median and the interquartile range (IQR) were calculated. Initially, ordinal regression models was constructed for SRH and recovery from work, includ-ing age, gender, BMI category, smoking habit, and use of snuff (considered as confounders). As a next step, ordinal regressions were run for SRH and recovery from work, including each of the other independent variables, ad-justing for age, gender, BMI category, smoking and use of snuff. Finally, we constructed final ordinal regression models with mutual adjustment including independent variables with a p-value < 0.2 in the single factor analysis, ad-justing for age, gender, BMI category, smoking, and use of snuff. For all or-dinal regression models, test of parallel lines were done, to verify that ordinal regression could be used. Pearson’s correlation coefficient was checked be-tween all independent variables, and the correlation between age and year of employment was above 0.7. Therefore, year of employment was excluded from the mutual models. Fatigue and eye tiredness was analysed in the same types of models, except that we used multiple logistic regression instead. For all models, odds ratios (OR) with a 95% confidence interval (CI) was calcu-lated. A p-value <0.05 was considered statistically significant. Calculations were done by SPSS 21.
Study II In Study II, concentrations of allergens, fungal DNA and MVOC were calcu-lated and presented as geometric mean (GM) and geometric standard devia-tion (GSD). For samples where the results were below the detection limit, half the detection limit was used when calculating GM values. The differences in allergen and fungal DNA concentrations between TSC and LSC groups and between different locations within the aircraft were tested by Mann-Whitney U test (2 groups) and Kruskal-Wallis test (more than 2 groups). MVOC levels were analysed by Mann-Whitney U test, comparing with data from the homes. For all tests, the significant level was p<0.05. Median allergen concentrations were also calculated for later comparison with other studies.

33
Study III and IV In Study III and IV, for all yes/no questions, no was coded “0” and yes was coded “1”. For the psychosocial questions, “no, never” was coded “3”, “no seldom” was coded “2”, “yes sometimes” was coded “1” and yes, “often” was coded “0”. For the question about ‘‘too much work to do’’, the values were assigned the reverse way. The values were then divided by 3, in order to obtain four psychosocial variables each ranging from 0–1, where 0 is the most fa-vourable condition and 1 is the most unfavourable condition. In Study III, the questions on asthma symptoms consisted of five questions, including wheeze, attacks of breathlessness at rest, attacks of breathlessness after exercise, woken up by attacks of breathlessness, asthma attacks last 12 months. A di-chotomous variable of “asthma symptoms” was created, coded as yes if there was a “yes” answer to at least one of these questions and coded as “no” if there were no asthma symptoms. Differences in baseline prevalence of symptoms and exposures between participants and nonparticipants were calculated by Chi-2 test. Differences in age or years of employment, between participants and nonparticipants, were calculated by Student’s t-test. The prevalence and incidence of asthma symptoms, bronchitis, non-specific hyper-reactivity and respiratory infections (Study III), the prevalence of any eye, nose, skin symp-tom in the last week, headache, tiredness and cockpit air perceptions (Study IV), and prevalence of work and home environment factors were calculated for both baseline and follow-up. The difference in prevalence of symptoms and exposures at baseline and follow-up were compared by McNemars’s test and Wilcoxon Matched Pairs Signed Rank Test.
In Study III, since all dependent variables were dichotomous variables, we used multiple logistic regression analysis. Initially, cross-sectional analysis was performed by forward stepwise logistic regression (Wald), including in-dependent variables with p<0.1. One stepwise regression model was created for the prevalence of each of the four dependent variables (asthma symptoms, bronchitis, nonspecific hyperreactivity and airway infections). Baseline work and home environment factors and gender, age, atopy and smoking habit were included initially. In the final mutually adjusted models, confounders (age, gender, smoking and atopy) were always kept in the models irrespectively of their statistical significance, as well as exposure variables with a p-value <0.1. As a next step, associations between incidence of the four health variables were analysed by forward stepwise logistic regression (Wald), including in-dependent variable with p<0.1. Baseline work and home environment factors, changes of work and home environment factors and gender, age, atopy and smoking habit were included initially. In the final mutually adjusted models, confounders (age, gender, smoking and atopy) were always kept in the models irrespectively of statistical significance, as well as exposure variables with a p-value <0.1. Finally, stepwise forward logistic regression analysis (Wald) were performed for prevalence and incidence of self-reported atopy, using the

34
same models and procedures as for the four respiratory health variables. The only difference was that atopy was not included as a confounder.
In Study IV, a cross-sectional analysis of baseline data was performed by stepwise multiple logistic regression (Wald, backward elimination, p>0.1 as exclusion criteria) to analyse associations between personal and environmen-tal risk factors at home and at work and symptoms the last week, initially. Symptoms the last week was chosen to be used in the cross-sectional analysis at base-line since there were detailed information on type of flight that the pilots had been on the last week. The workplace ETS variable was used a cat-egorical variable, coded as no flight with ETS, any European flight with ETS and any long haul flight (all with ETS) the last week. The category of no ETS flight the last week was used as reference category. As a next step, multiple ordinal regression was used to study changes of symptoms and environmental perceptions from 1997 to 2000 in relation to baseline exposure in 1997. In this analysis, changes of symptoms and environmental perceptions reported for the last 3 months were dependent variables. This model included personal factors, work factors and home factors at the baseline level in 1997. Finally, a second set of multiple ordinal model regression models studied changes of symptoms and environmental perceptions the last 3 months in relation to changes of per-sonal factors and environmental factors at home or at work. Two different models were used, one with and one without the home environment factors. Information on type of the flight during the last 3 months was used. The flight duration variable in the longitudinal analysis was coded as a categorical vari-able, by combining information on flight duration type in 1997 and 2000. Working on a short haul flight both at baseline and at follow up was used as reference category.
All statistical calculations were done by SPSS version 21, and a p-value <0.05 was considered statistically significant. Odds ratio (OR) with a 95% confidence interval (CI) was calculated for the stepwise logistic regression models, the ordinal regression models and the multinominal regression mod-els. In all regression models, associations for age was expressed as changes per 10 years.
Ethics Statement The protocol of the Studies were approved by the Ethical Committee of the Medical Faculty at Uppsala University or the Regional Ethical Review Board in Uppsala, Sweden. All participants gave their informed consent. An infor-mation letter sent together with the questionnaire stated that if the subjects answered and returned the questionnaire, it meant they had given their in-formed consent.

35
RESULTS
Paper I A total of 354 of 585 pilots participated (61%). The majority (88.9%) of the participants were between 41-60 years old, and 91.0% of the participants were males. Few (5.1%) were current smokers, but 22.8% had quit smoking. About one fifth (18.2%) were current snuff users, and 14.8% have used snuff but quit. A lot of the pilots were overweight (41.5%), and 4.1% of the pilots were obese (Table 1).
Table 1. Prevalence of personal factors among commercial pilots (N=354). Personal factorsa Prevalence (%) Age 31-40 8.8 41-50 60.2 51-60 28.7 61- 2.3 Gender Man 91.0 Woman 9.0 Smoking Non-smoker 72.1 Ex-smoker 22.8 Current smoker 5.1 Oral tobacco (snuff) use Never used 67.0 Have used but quit 14.8 Current snuff user 18.2 BMI b Underweight 0 Normal 54.4 Overweight 41.5 Obese 4.1
a. The scales of the health variables were listed above. Some of the groups were merged because of small numbers in the group. The categories of these health variables in the statistic models are as following: SRH- poor or fair, good, excellent; Recovery- never or seldom, sometimes, quite often, very often; Fatigue- never or seldom, sometimes or often; Eye tiredness- never or seldom, sometimes or often. b. Body mass index (BMI) was defined as the body mass divided by the square of body length. BMI variable was categorized as: underweight (<18.5), normal (18.5-24.99), overweight (>= 25.00), and obese (>= 30.00). Overweight and obese were merged into one group for the statis-tical model.

36
Prevalence of dependent variables is shown in Figure 1. A total of 78.2% of the pilots reported good or excellent SRH, and 64.4% of the pilots reported quite or very often feeling recovered after several days off work. Fatigue (61.9%) and eye tiredness (33.1%) were commonly reported.
Around half (55.3%) of pilots had been employed by this airline company over 20 years, and 68.9% were full-time employee. Doing exercise was very popular, and 71.8% had exercise at least twice a week (Table 2).
Table 2. Prevalence of working conditions and life style among commercial pilots (N=354).
Factors Prevalence (%) Years of employment a 5-20 44.7 21-30 36.8 31-50 18.5 Employment Fulltime 68.9 75-80% 28.0 50% 3.1 Position Captain 61.0 First officer (co-pilot) 39.0 Type of aircraft B737 34.3 MD80serie 32.0 A330/340 25.8 Saab 2000 7.9 Exercise frequency Sometimes 10.7 1 time /week 17.5 2-4 times /week 62.2 >5 times /week 9.6 Marital status Married/couple 89.4
37
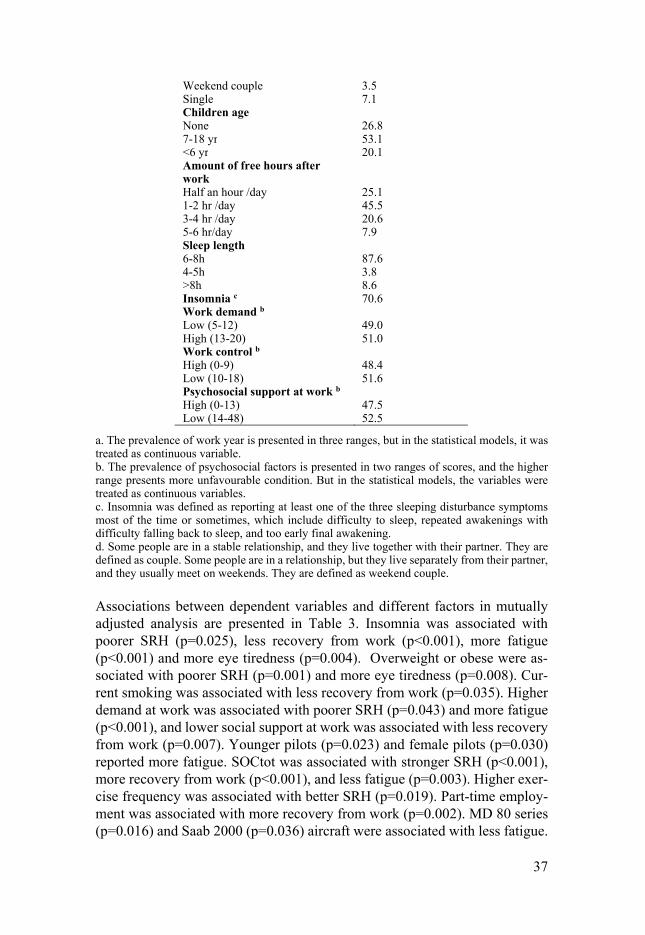
Weekend couple 3.5 Single 7.1 Children age None 26.8 7-18 yr 53.1 <6 yr 20.1 Amount of free hours after work
Half an hour /day 25.1 1-2 hr /day 45.5 3-4 hr /day 20.6 5-6 hr/day 7.9 Sleep length 6-8h 87.6 4-5h 3.8 >8h 8.6 Insomnia c 70.6 Work demand b Low (5-12) 49.0 High (13-20) 51.0 Work control b High (0-9) 48.4 Low (10-18) 51.6 Psychosocial support at work b High (0-13) 47.5 Low (14-48) 52.5
a. The prevalence of work year is presented in three ranges, but in the statistical models, it was treated as continuous variable. b. The prevalence of psychosocial factors is presented in two ranges of scores, and the higher range presents more unfavourable condition. But in the statistical models, the variables were treated as continuous variables. c. Insomnia was defined as reporting at least one of the three sleeping disturbance symptoms most of the time or sometimes, which include difficulty to sleep, repeated awakenings with difficulty falling back to sleep, and too early final awakening. d. Some people are in a stable relationship, and they live together with their partner. They are defined as couple. Some people are in a relationship, but they live separately from their partner, and they usually meet on weekends. They are defined as weekend couple.
Associations between dependent variables and different factors in mutually adjusted analysis are presented in Table 3. Insomnia was associated with poorer SRH (p=0.025), less recovery from work (p<0.001), more fatigue (p<0.001) and more eye tiredness (p=0.004). Overweight or obese were as-sociated with poorer SRH (p=0.001) and more eye tiredness (p=0.008). Cur-rent smoking was associated with less recovery from work (p=0.035). Higher demand at work was associated with poorer SRH (p=0.043) and more fatigue (p<0.001), and lower social support at work was associated with less recovery from work (p=0.007). Younger pilots (p=0.023) and female pilots (p=0.030) reported more fatigue. SOCtot was associated with stronger SRH (p<0.001), more recovery from work (p<0.001), and less fatigue (p=0.003). Higher exer-cise frequency was associated with better SRH (p=0.019). Part-time employ-ment was associated with more recovery from work (p=0.002). MD 80 series (p=0.016) and Saab 2000 (p=0.036) aircraft were associated with less fatigue.

38
Table 3. Associations between SRH, recovery, fatigue, and eye tiredness, and se-lected factors in mutual models (Selection: p<0.2), including age, gender, BMI, smoking habit, oral tobacco (snuff) use a.
Factors OR (95% CI) p-value
SRH c
BMI 0.43 (0.26-0.69) 0.001
Excercis frequency 1.45 (1.06-1.99) 0.019
Insomnia 0.56 (0.34-0.93) 0.025
SOCtot 1.53 (1.29-1.83) <0.001
High demand 0.69 (0.47-0.99) 0.043
Recovery d
Current smoker (Reference: never smoke) 0.35 (0.13-0.93) 0.035
Part time 1.99 (1.29-3.07) 0.002
Insomnia 0.27 (0.16-0.46) <0.001
SOCtot b 1.62 (1.37-1.93) <0.001
Low social support b 0.60 (0.41-0.87) 0.007
Fatigue e
Age 0.55 (0.33-0.92) 0.023
Woman 4.08 (1.14-14.63) 0.030
Type of aircraft
MD80 (Reference: B737) 0.39 (0.18-0.84) 0.016
Saab 2000 (Reference: B737) 0.29 (0.09-0.92) 0.036
Insomnia 12.29 (6.16-24.53) <0.001
SOCtot 0.72 (0.58-0.89) 0.003
High demand 2.87 (1.58-3.05) <0.001
Eye tiredness f
BMI 2.04 (1.20-3.47) 0.008
Insomnia 2.47 (1.33-4.59) 0.004
a. For self-rated health and recovery from work, multiple ordinal regression models were used for mutual analysis, and for fatigue and eye tiredness, multiple logistic regression models were used. For each dependent variable, the mutual models included factors with a p<0.2 in single factor analysis, and age, gender, BMI, smoking habit, and oral tobacco (snuff) use. All the three of psychosocial variables were always included at the same time, though “low control” was not selected sometimes by the p-value. Table 5 shows the associations between the dependent var-iables and those selected factors, and the personal factors with a significant p-value. b. The associations between dependent variables and the SOCtot and psychosocial variables were calculated by their interquartile range.

39
c. The selected factors for SRH included: marital status, exercise frequency, free hour after work, sleep length, insomnia, SOCtot, high demand, low control, and low social support. d. The selected factors for recovery from work included: employment, marital status, age of children, exercise frequency, free hour after work, sleep length, insomnia, SOCtot, high de-mand, low control, and low social support. e. The selected factors for fatigue included: type of aircraft, marital status, free hour after work, sleep length, insomnia, SOCtot, high demand, low control, and low social support. f. The selected factors for eye tiredness included: employment, sleep length, insomnia, SOCtot, high demand, low control, and low social support.
Paper II Furry pet allergen levels Among TSC (textile seat company) samples, samples from the flight deck and cabin had similar total dust weight. Fel d1 and Can f1 concentrations were higher in the cabin samples as compared to flight deck (p<0.05), and the amount of dog allergen was almost 2 times higher in the cabin samples. In LSC (leather seat company) aircraft, samples from flight deck contained more dust than cabin samples. Moreover, LSC flight deck samples contained larger amounts and higher concentrations of Fel d1, Can f1 and Equ cx (p<0.05) than in the cabin. In TSC aircraft, median concentrations for Fel d1, Can f1 and Equ cx are 2285 ng/g, 2288 ng/g and 9537 ng/g in flight deck. In LSC aircraft, median concentrations for Fel d1, Can f1 and Equ cx are 589 ng/g, 450 ng/g and 1966 ng/g respectively in flight deck and 181 ng/g.
Table 4. Pet allergens concentration in flight deck and cabin in both companies N AM GM(GSD) Range TSC flight deck Fel d1(ng/g) 9 3883 3503 (1.60) a 2137 – 6516 Can f1(ng/g) 9 2552 2413 (1.43) a 1254 – 4169 Equ ex(U/g) 9 11418 10814 (30.01) a 7405 – 18576 LSC flight deck Fel d1(ng/g) 9 686 587 (1.82) 248 – 1187 Can f1(ng/g) 9 495 438 (1.71) 169 – 960 Equ ex(U/g) 9 1839 1761 (1.38) 1000 – 2751 TSC cabin Fel d1(ng/g) 26 6154 5359 (1.76) b 1452 – 13795 Can f1(ng/g) 26 6551 6067 (1.51) b 1810 – 12469 Equ ex(U/g) 26 18061 13703 (2.16) b 2793 - 55990 LSC cabin Fel d1(ng/g) 27 182 107 (3.27) 25 – 502 Can f1(ng/g) 27 400 227 (2.52) 79 – 2850 Equ ex(U/g) 27 343 183 (3.35) 39 – 1794
Significant level is p <0.05.
40
a. In the flight deck, the concentrations of cat, dog and horse allergens in TSC are signifi-cantly higher than in LSC. The p values are all <0.001. b. In the cabin, the concentrations as well as the amounts of cat, dog and horse allergens in TSC are significantly higher than LSC. The p values are all <0.001.
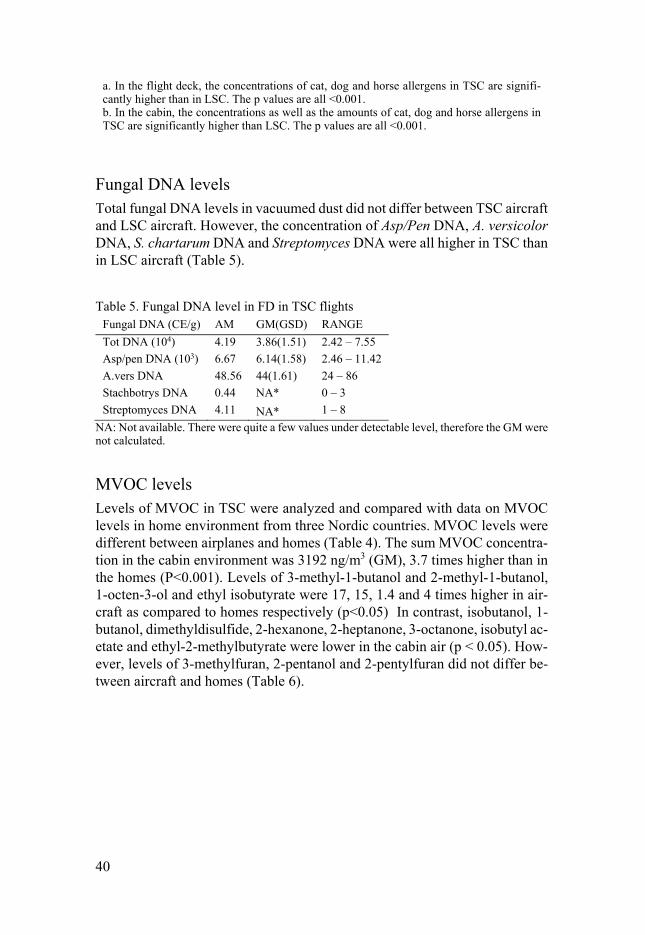
Fungal DNA levels Total fungal DNA levels in vacuumed dust did not differ between TSC aircraft and LSC aircraft. However, the concentration of Asp/Pen DNA, A. versicolor DNA, S. chartarum DNA and Streptomyces DNA were all higher in TSC than in LSC aircraft (Table 5).
Table 5. Fungal DNA level in FD in TSC flights Fungal DNA (CE/g) AM GM(GSD) RANGE
Tot DNA (104) 4.19 3.86(1.51) 2.42 – 7.55
Asp/pen DNA (103) 6.67 6.14(1.58) 2.46 – 11.42
A.vers DNA 48.56 44(1.61) 24 – 86
Stachbotrys DNA 0.44 NA* 0 – 3
Streptomyces DNA 4.11 NA* 1 – 8
NA: Not available. There were quite a few values under detectable level, therefore the GM were not calculated.
MVOC levels Levels of MVOC in TSC were analyzed and compared with data on MVOC levels in home environment from three Nordic countries. MVOC levels were different between airplanes and homes (Table 4). The sum MVOC concentra-tion in the cabin environment was 3192 ng/m3 (GM), 3.7 times higher than in the homes (P<0.001). Levels of 3-methyl-1-butanol and 2-methyl-1-butanol, 1-octen-3-ol and ethyl isobutyrate were 17, 15, 1.4 and 4 times higher in air-craft as compared to homes respectively (p<0.05) In contrast, isobutanol, 1-butanol, dimethyldisulfide, 2-hexanone, 2-heptanone, 3-octanone, isobutyl ac-etate and ethyl-2-methylbutyrate were lower in the cabin air (p < 0.05). How-ever, levels of 3-methylfuran, 2-pentanol and 2-pentylfuran did not differ be-tween aircraft and homes (Table 6).
Tab
le 6
. MV
OC
leve
ls in
TSC
flig
hts
and
hom
e in
door
env
iron
men
t T
SC
(ng
/m3 )
HO
ME
(ng/
m3 )
P va
lue
N
AM
G
M(G
SD
)R
ange
NA
MG
M(G
SD
) R
ange
Sta
ndar
d42
53
07
3192
(2.
992)
290
–32
460
9212
5486
2 (2
.391
) 50
–76
90<
0.00
1 3-
met
hylf
uran
42
85
18 (
6.33
0)1
–67
091
33
19 (
2.99
9)
1 –
370
0.18
1 Is
obut
anol
42
3223
45
1 (2
.086
)54
0 –
1444
092
2452
16
92 (
2.29
5)
190
–14
000
0.00
8 1-
buta
nol
42
724
56
4 (2
.022
)80
–40
9092
8808
60
23 (
2.32
0)
650
–78
000
<0.
001
2-pe
ntan
ol42
49
8
(8.8
27)
1 –
1098
8926
12
(4.
011)
1
–22
00.
552
3-m
ethy
l-1-
buta
nol
35
5975
4372
(2.
124)
1110
-31
320
4546
9 25
6 (3
.246
) <
1–53
20<
0.00
1 D
imet
hyld
isul
fide
32
22
6
(6.2
09)
1 –
220
8922
7 25
(5.
984)
1
–40
80<
0.00
1 2-
hexa
none
42
44
30(2
.267
)7
–21
092
80
59 (
2.26
7)
11 –
300
<0.
001
2-he
ptan
one
42
91
70 (
2.06
5)18
–45
092
440
312
(2.2
51)
40 –
3170
<0.
001
1-oc
ten-
3-ol
42
78
64 (
1.86
5)11
–28
083
72
46 (
2.51
5)
7 –
460
0.02
1 3-
octa
none
29
11
7 (3
.611
)<
1 –
3875
461
39 (
1.75
8)
13 –
170
<0.
001
2-m
ethy
l-1-
buta
nol
39
1404
10
13 (
2.12
3)26
0 –
9410
4211
0 67
(2.
512)
10
–94
0<
0.00
1 et
hyl i
sobu
tyra
te
42
14
4 (6
.818
)1
–93
924
1 (3
.185
) 1
–72
0.02
4 Is
obut
yl a
ceta
te
42
46
13 (
8.74
1)1
–30
0040
210
53 (
9.31
8)
1 –
2530
<0.
001
ethy
l-2-
met
hyl-
buty
rate
39
13
9
(2.8
56)
<1
–46
8412
2 22
(7.
706)
<
1 –
2390
0.01
3
2-pe
ntyl
fura
n35
42
35
(2.
352)
1 –
120
8561
8 41
(4.
466)
<
1 –
4600
00.
712

42
Microbial growth in mineral insulation According to classification for mineral insulation published before, mineral insulations with total fungi or bacteria level less than 104 organisms/g insula-tion were classified as normal, while mineral insulations with total fungi or bacteria level more than 106 organisms/g insulation were classified as “ele-vated” [127]. Both total bacteria level and total fungi level of the mineral in-sulation sample were above the standard for elevated level (106 organisms/g insulation). The viable bacteria level was also elevated according to the stand-ard. Among viable species from the insulation sample, yeast and the gram negative bacteria Pesudomonas sp. were identified.
Paper III There was no difference between the prevalence of respiratory health symp-toms and allergies at base-line and the prevalence during follow-up (Table 7). However, most of the psychosocial work conditions had improved during the three year follow up period, except for the demand variable which was not changed (Table 8). The pilots tended to move from multifamily houses to sin-gle-family houses and had less ETS and less furry pets at home during follow up (Table 8).
Table 7. Prevalence of demographic data, allergies and respiratory illness among nonparticipants at baseline, participants at baseline and participants at follow-up
Respiratory health variable
Participants at baseline
(N=436) (%)
Participants at follow-up
(N=436) (%) P-valuea
Female gender 5.3 5.3 1.00 Current smoker 12.1 8.4 0.33 Ever had asthma 2.6 2.3 1.00
Doctors’ diagnosed asthma 1.4 2.5 0.06
Pollen allergy 16.9 19.4 0.06 Furry pet allergy 10.3 10.8 0.75
Wheeze or whistling in the chest last 12
months 7.6 5.7 0.27
Current bronchitis 8.1 7.1 0.76 Nonspecific hyperre-
activity 19.8 21.7 0.34
Airway infections 10.7 9.7 0.62 a. Comparing prevalence among participants at baseline and at follow-up, calculated by McMe-mar test.

43
Table 8. Prevalence of work factors and home factors. Environment fac-tors
Prevalence (%) p valuea
Work factors
1997 2000
Low stimulation Never (0) 83.1 87.4 0.008
Seldom (1) 13.9 11.9
Sometimes (2)
2.8 0.7
Often (3) 0.2 0
High demand Never (0) 5.3 5.1 0.56
Seldom (1) 53.8 52.9
Sometimes (2)
38.3 38.8
Often (3) 2.5 3.2
Low control Never (0) 8.6 11.1 <0.001
Seldom (1) 31.1 38.0
Sometimes (2)
46.6 41.7
Often (3) 13.7 9.3
Low support Never (0) 50.5 52.5 0.02
Seldom (1) 32.6 35.8
Sometimes (2)
11.9 8.4
Often (3) 5.0 3.3
Long haul flight 25.9 25.2 0.46
Current home factors
Construction year
before 1960 31.3 34.3 0.52
1961-1975 23.8 20.9
after 1975 44.9 44.8
Multifam-ily/house
21.9 15.8 <0.001
Furry pet keep-ing
21.3 26.5 0.001
ETS at home 8.3 4.6 0.001
Indoor painting last 12 months 26.3 26.7 1.00
Dampness/ mold last 12 months 7.6 6.0 0.39
Window condensation in winter 13.7 11.8 0.21
a. Work factors and construction year were calculated by Wilcoxon Signed Rank Test, other home factors were calculated by McNemar´s Test.

44
Further calculations of number of new cases and the 3-year incidence of the health variables are presented in Table 9. At baseline, totally eleven pilots (2.5%) reported that they had ever had asthma (lifetime incidence) and six of them had the asthma diagnosed by a doctor before the study started. Six of the eleven persons with asthma at baseline (55%) reported that their first asthma attack occurred when they were 1-10 years old (childhood asthma). Two of the eleven pilots with asthma at baseline got asthma diagnosed by a doctor during the follow up period and three other pilots without asthma at baseline got a new asthma diagnosis by a doctor during follow up (incidence cases). The prevalence of doctors’ diagnosed asthma at baseline and during follow-up were 1.4% and 2.5% respectively and the incidence of doctors diagnosed asthma was 2.4 per 1000 person·years. Totally 5.3% were females. Prevalence of current smoking at baseline was 9.9%, and the prevalence of current smok-ing at follow-up was 8.4%. There were 10 new smokers and 16 pilots had been giving up smoking. In total, 17 pilots developed atopy during follow-up, and the incidence rate of atopy was 16.6 per 1000 person·years.
Table 9. Number of new cases and symptom incidence during follow up
Outcome N c N d Number of new cases
3-year incidence (%)
Wheezing in chest any time last 12 months
403 396 16 (12) e 4.0 (3.0) e
Attacks of breathless-ness at rest last 12
months 434 423 1 (1) e 0.2 (0.2) e
Attacks of breathless-ness after exercise last
12 months 428 418 5 (4) e 1.2 (1.0) e
Woken up by attacks of breathlessness last 12
months 431 420 1 (1) e 0.2 (0.2) e
Asthma attacks last 12 months
435 425 0 (0) e 0 (0) e
Asthma symptomsa 395 388 18 (14) e 4.6 (3.6) e Doctors’ diagnosed
asthma 430 425 5 (3) e 1.2 (0.7) e
Bronchitis 395 20 5.1 Nonspecific hyperreac-
tivity 345 40 11.6
Airway infections 385 17 4.4 A history of atopyb 342 17 5.0
a. Asthma symptoms: wheezing in chest at any time, attack of breathlessness at rest, attacks of breathlessness after exercise, woken up by attacks of breathlessness, and asthma attack last 12 month. b. Pollen or furry pet allergy. c. Number of participants without particular symptom at baseline. d. Number of participants without particular symptom at baseline, and the subjects who had ever had asthma at baseline (N=11) were excluded. e. Data in parenthesis refers to number of new cases and incidence of asthma symptoms when subjects who had ever had asthma at baseline (N=11) were excluded.

45
Table 10 presents the cross-sectional analysis for the baseline data. Women reported more nonspecific hyperreactivity (p=0.013), while smokers reported more bronchitis (p=0.027), but less nonspecific hyperreactivity (p=0.033). Older pilots reported less airway infections (p=0.004) and less atopy (p=0.004). Pilots with atopy reported more nonspecific hyperreactivity (p=0.026). Pilots who reported dampness/mould at home in last 12 months reported more asthma symptoms (p=0.006) and more airway infections (p=0.013). Pilots who kept furry pets at home reported less atopy (p=0.018). Psychosocial work conditions or ETS exposure in the aircraft at baseline were not significantly associated with any of the four investigated health variables.
Table 10. Associations between symptom prevalence and baseline exposure (N=436) b
Selected variables a adj OR(CI 95%) p-value Asthma symptoms Women 2.82 (0.96-8.28) 0.059 Dampness/ mould last 12 months 3.55 (1.43-8.82) 0.006 Bronchitis
Current smoking 2.65 (1.12-6.92) 0.027 Nonspecific hyperreactivity
Women 3.32 (1.29-8.56) 0.013 Current smoking 0.21 (0.05-0.88) 0.033 Atopy 1.91 (1.08-3.38) 0.026 High demand 1.32 (0.89-1.95) c 0.17 Airway infections
Age 0.51 (0.32-0.81) d 0.004 Dampness/ mould last 12 months 3.12 (1.27-7.68) 0.013 A history of atopy Age 0.63 (0.45-0.86) d 0.004 Furry pet keeping 0.41 (0.19-0.86) 0.018
a. The variables were selected by Wald stepwise logistic regression, and the cut-off p-value for the inclusion of variables in the model was 0.1. The stepwise logistic regression model for prevalence of asthma symptoms, bronchitis, nonspecific hyperreactivity and airway infections included following candidate variables: age, gender, atopy, smoking habits; work-related fac-tors: flight type, stimulation at work, work demand, work control, support at work; home envi-ronment factors: construction year, multifamily/house, furry pet keeping, ETS at home, indoor painting last 12 months, dampness/mould last 12 months, window condensation in winter. The stepwise logistic regression model for atopy included all the factors included in the other mod-els except atopy. b. The associations between health variables displayed in this table were calculated by a mutual logistic regression model separately, including the selected independent variables for each health variable, adjusted by age, gender, and smoking habit. c. For the psychosocial variables, OR was calculated for one step on the scale (0-1). d. For the variable of age, OR was calculated for each escalation of 10 years.
The longitudinal analysis is presented in Table 11. Older pilots (p=0.011) had a lower incidence of airway infections. The baseline exposure of window pane condensation (p=0.015) were positively associated with the incidence of

46
asthma symptoms. The variable of “ever had window pane condensation” (p=0.030) either at baseline or during follow-up were included in the model for the incidence of asthma symptoms and change of exposures, and it was positively associated with the incidence of asthma symptoms. Pilots who changed type of flight during follow-up (p=0.002), either from long-haul to short-haul or from short-haul to long-haul, had a higher incidence of airway infections than those who continued with the same type of flight. Pilots re-porting low psychosocial support at work at baseline had lower incidence of atopy, though the significance level is on the border (p=0.06). Pilots who re-ported lower control at work (p=0.039) during follow-up had more onset of atopy. Pilots living in newer dwellings at baseline (p=0.012) had a higher in-cidence of airway infections. ETS at home at baseline (p=0.010) was posi-tively associated with new onset of atopy. The variable of “ETS at home ever” either at baseline or during follow-up (p=0.005) was positively associated with new onset of atopy. There was no association observed for incidence of bron-chitis and nonspecific hyperreactivity. There were no associations between ETS exposure in the aircraft at baseline and incidence of any of the four health variables.
Table 11. Associations between symptom 3-year incidence and baseline exposure and change of exposure b
Selected variables a adj OR(CI 95%) p-value Asthma symptoms Window pane condensation at baseline
4.14 (1.32-12.97) 0.015
Airway infections
Age 0.33 (0.14-0.77) d 0.011 Construction year of dwelling 5.23 (1.43-19.10) 0.012 Flight type change 11.27 (2.39-53.14) 0.002 Construction year change 0.19 (0.04-0.81) 0.025 A history of atopy Low support 0.39 (0.15-1.03) c 0.06 ETS at home at baseline 3.73 (1.09-12.83) 0.010 Low control change 1.85 (1.03-3.31) c 0.039
a. The variables were selected by Wald stepwise logistic regression, and the cut-off p-value for the inclusion of variables in the model was 0.1. The stepwise logistic regression model for incidence of asthma symptoms, bronchitis, nonspecific hyper-reactivity and airway infections included variables stating baseline exposure and the change during follow-up of following fac-tors : age, gender, atopy, smoking habits; work-related factors: flight type, stimulation at work, work demand, work control, support at work; home environment factors: construction year, multifamily/house, furry pet keeping, ETS at home, indoor painting last 12 months, damp-ness/mould last 12 months, window condensation in winter. The stepwise logistic regression model for atopy included all the factors included in the other models except atopy. b. The associations between symptoms displayed in this table were calculated by a mutual lo-gistic regression model separately, including the selected independent variables for each health variable, adjusted by age, gender, and smoking habit. c. For the psychosocial variables, OR was calculated for one step on the scale (0-1). d. For the variable of age, OR was calculated for each escalation of 10 years.

47
Paper IV The prevalence of eye symptoms the last week (p=0.03) and the last 3 months (p=0.001) had increased during the follow up, and dermal symptoms in last 3 months had decreased (p<0.001). Moreover, exposure to ETS at work had de-creased drastically (p<0.001). For other symptoms or environmental percep-tions, the prevalence had not changed significantly (Table 12).
Table 12. Prevalence of symptoms during the last week and the last 3 months.
a. 7 days symptoms were calculated by McNemar´s Test, and 3 months symptoms were calcu-lated by Wilcoxon Signed Rank Test.
Table 13 shows the results from stepwise logistic regression model for base-line data. Older pilots reported less nose symptom (adjusted OR 0.55, 95%CI
Symptom prevalence (%) p value a
1997 2000
7 days symptoms
Eye 38.5 44.6 0.03
Nose 39.9 39.6 0.87
Skin 19.8 17.1 0.19
Headache 17.2 16.9 1.00
Tiredness 29.9 30.9 0.86
3 months symptoms
Eye Sometimes 27.0 31.1 0.001
Often 2.8 5.3
Nose Sometimes 45.3 43.7 0.67
Often 7.7 9.1
Skin Sometimes 42.0 23.2 <0.001
Often 14.0 9.3
Headache Sometimes 26.3 27.4 0.85
Often 1.2 0.9
Tiredness Sometimes 69.1 64.8 0.54
Often 13.7 15.0
Stuffy air Sometimes 39.5 40.1 0.18
Often 7.5 9.6
Dry air Sometimes 30.6 33.1 0.28
Often 55.1 51.2
ETS at work Sometimes 48.7 1.9 <0.001
Often 3.5 0.2

48
0.42-0.72; p<0.001) and headache (adjusted OR 0.55, 95%CI 0.38-0.82; p=0.003). Female pilots had more skin symptom (adjusted OR 3.68, 95%CI 1.41-9.59; p=0.008) and headache (adjusted OR 3.11, 95%CI 1.19-8.12; p=0.02) than men. Pilots who had been on a long haul flight with ETS expo-sure the last week had more eye symptoms (adjusted OR 1.91, 95%CI 1.10-3.33; p=0.02) and more tiredness (adjusted OR 2.73, 95%CI 1.57-4.75; p<0.001). Those living in multifamily houses had more eye symptoms (ad-justed OR 1.90, 95% CI 1.14-3.17; p=0.01) and those keeping furry pets had less eye symptoms (adjusted OR 0.53, 95% CI 0.31-0.95; p=0.03). Pilots liv-ing in homes with signs of dampness and mould growth the last 12 months reported more tiredness (adjusted OR 2.25, 95%CI 1.01-5.03; p=0.049), and those who had their home painted indoors the last 12 months had more head-ache (adjusted OR 1.84, 95%CI 1.03-3.28; p=0.04). Finally, those reporting window pane condensation in winter, an indicator of poor ventilation and high relative air humidity, reported less skin symptoms (adjusted OR 0.34, 95% CI 0.13-0.86; p=0.02). Among the psychosocial variables, high demands was as-sociated with more eye symptoms (adjusted OR 3.59, 95% CI 1.26-10.25; p=0.02). No significant associations were found for the other psychosocial scales.

49
Table 13. Associations between symptoms (last week) at baseline and work environ-ment and home environment.
adj OR(95% CI) p-value
Any eye symptom
High demand 3.59 (1.26-10.25) 0.02
Low control 2.05 (0.93-4.53) 0.07
No ETS at work (ref) 1
European flight with ETS 1.55 (0.89-2.69) 0.12
Long haul flight ETS 1.91 (1.10-3.33) 0.02
Furry pet keeping 0.53 (0.31-0.95) 0.03
Window pane condensation in winter
1.82 (0.99-3.37) 0.06
Multifamily house 1.90 (1.14-3.17) 0.01
Any nose symptom
Age per 10 years 0.55 (0.42-0.72) <0.001
Pollen/pet allergy 1.71 (1.02-2.86) 0.04
Any skin symptom
Woman 3.68 (1.41-9.59) 0.008
Low control 2.32 (0.86-6.20) 0.10
Construction year of dwelling 0.76 (0.56-1.03) 0.08
Dampness/mold at home last 12 months
2.29 (0.94-5.60) 0.07
Window condensation in win-ter
0.34 (0.13-0.86) 0.02
Headache
Age per 10 years 0.55 (0.38-0.82) 0.003
Woman 3.11 (1.19-8.12) 0.02
Indoor painting last 12 months
1.84 (1.03-3.28) 0.04
Tiredness
Age per 10 years 0.53 (0.40-0.72) <0.001
No ETS at work (ref) 1
European flight with ETS 1.53 (0.85-2.74) 0.16
Long haul flight ETS 2.73 (1.57-4.75) <0.001
Dampness/mold at home last 12 months
2.25 (1.01-5.03) 0.049
Associations between symptoms in last week and work factors, home factors, by stepwise lo-gistic regression.

50
When analysing associations between personal factors and exposures at base-line and change of symptoms and environmental perceptions over the 3-year period, women got less headache as compared to men in the follow-up (Score change -1.14; 95% CI -2.17 - -0.11; P=0.03). Older pilots reported less stuffy air (Score change -0.30; 95% CI -0.56 - -0.05; P=0.02) during the follow-up. Pilots being on long haul flights with ETS exposure at baseline reported less tiredness (Score change -1.12; 95% CI -1.70 - -0.55; P<0.001) at follow up, as compared to those who were on smoke free flights at baseline. There were no associations between psychosocial work conditions at baseline, and changes of medical symptoms or environmental perceptions during follow up. Finally, pilots living in new houses developed more tiredness during the fol-low-up (Score change 0.30; 95% CI 0.04-0.56; P=0.023) but there were no other associations between home environmental factors at baseline and changes of medical symptoms or environmental perceptions.
Finally, associations between changes of symptoms, changes of own smok-ing status and changes of environmental factors at home and at work were analysed. Female pilots developed less nose symptoms (P=0.048) and less headache (P=0.04) at follow-up and reported less stuffy air (P=0.03) than men. Those who had started smoking reported more problems with stuffy air at work (P=0.04). Pilots who changed from short haul flight to long haul flight reported more nose problems (P<0.001) as compared to those working on short haul flights all the time (reference category). Moreover, changes of psy-chosocial variables were associated with changes of symptoms and environ-mental perceptions. Those who reported less work stimulation during follow up reported more stuffy air (P=0.009). Pilots reporting increased demand at work got more nose symptoms (P=0.035), skin symptoms (P=0.017) and tired-ness (P=0.001) and reported more often stuffy air (P=0.01) and dry air at work (P=0.029). Those reporting less work control got more eye symptoms (P=0.002). Changes of home environment factors were not significantly asso-ciated with any changes of symptoms or environmental perceptions at work.

51
GENERAL DISCUSSION
This thesis have investigated different aspects of health and the work environ-ment among commercial pilots. The most important personal factors associ-ated with poorer self-rated health, lack of recovery from work or fatigue were overweight or obesity, insomnia, sense of coherence SOC and high work de-mand. The environmental measurements found high levels of cat, dog and horse allergens in the aircraft, and the concentrations were higher in aircraft with textile seats as compared to those with leather seats. The sum of concen-trations of volatile organic compounds of possible microbial origin (MVOC) in the cabin air was higher than in a random sample of homes in northern Europe, mainly because of the elevated levels of 2-methyl-1-butanol and 3-methyl-1-butanol in the cabin air. The levels of total fungal DNA in vacuumed dust from the aircraft were relatively low. The longitudinal questionnaire study found that mucosal, dermal and general symptoms were common, espe-cially eye and nose symptoms and tiredness. The psychosocial work environ-ment and exposure to environmental tobacco smoke (ETS) on long haul flights were associated with an increased prevalence of symptoms. Increased demand and lower work control were associated with an increase of mucosal and der-mal symptoms, tiredness and reports on stuffy air and dry air at work. The ban of smoking on board in 1997 decreased eye symptoms, tiredness and the per-ception of stuffy air at work. Moreover, there were associations between symptoms and certain factors in the home environment, including recent in-door painting, dampness and indoor mould growth, living in a multi-family house and living in a new house.
Comments on selection bias Epidemiological studies can be influenced by selection bias and information bias (recall bias). Airline pilots are initially selected to be healthy and are not comparable with the general adult population. In addition, there can be a se-lection effects (the healthy worker effect) after employment and those devel-oping health problems may leave the occupation.The initial three year cohort study was performed in the end of the 1990’ies and represent historical data from pilots in one Scandinavian airline company. The participation rate was 93% at the baseline investigation, and 76% of the participants at baseline par-ticipated in the 3-year follow up. Despite the relatively high participation rate,

52
we found that nonparticipants were older and had a higher prevalence of wheeze and self-reported nonspecific hyperreactivity at baseline, as compared to participants. Moreover, nonparticipants were less satisfied with their work-ing conditions and were less exposed to ETS on board at baseline. These re-sults indicate a health based selection where more healthy pilots tended to join the cohort. This could lead to an underestimation of the risks of the occupa-tional exposure. In contrast, we found no differences between participants and nonparticipants for exposure related to the home environment. The later cross-sectional study among pilots at the same airline company had good response rate (61%), and a previous analysis demonstrated that there were no difference in age or gender between participants and non-participants [97]. In conclusion, selection bias is not likely to have had any major influence on the results but the tendency that more health pilots joined the cohort could have caused an underestimation of work-related risks.
Comments on internal validity of the questionnaire studies The questionnaire studies included questions on medical symptoms, the work environment and the home environment. This may introduce information bias (reporting bias) especially in the cross-sectional analysis. However, in the lon-gitudinal analysis of the development of symptoms over three years, using baseline data of exposure as independent variables, recall bias should not be a major concern. There were associations between specific dependent variables and specific risk factors, rather than a general increase of many associations with the same order of magnitude. Exposure assessment for ETS at work was based on type of flight, long haul or short haul, not on self-reported data on ETS exposure. Since the pilots have a contract to work on certain types of airplanes for a number of years, recall bias for this ETS variable is unlikely. In conclusion, information bias is not likely to have played an important role in our two questionnaire studies. However, there are certain limitations of the questionnaire studies. One limitation is the lack of clinical data and another limitation is the limited study size. Finally, the cross-sectional study design of the later study on self-rated health, recovery from work, and fatigue limits the possibility to draw conclusions on causality.
Comments on methodological aspects of the exposure measurements One limitation of the exposure measurement study is the small number of sam-ples. However, despite this limitation, highly significant differences were

53
found. Another important issue is the types of aircraft included in the study. Air samples for MVOC and dust samples from textile seats were taken from both Boeing and Airbus aircraft but all dust samples from aircraft with leather seats were taken from Airbus aircraft. However, it is less likely that these dif-ferences in types of aircraft would have any major influence on the air or dust sampling. The ventilation system has a similar design in all modern aircraft, using about 50% air recirculation and air filtration of return air [22, 60] so it is less likely that the type of aircraft would have influence the levels of sam-pled pollutants. Another limitation is that we did not measure allergens or fun-gal DNA in the air. However, other studies have shown a correlation between allergen levels in vacuumed dust and in air samples, using Petri dishes or elec-trostatic samplers to collect airborne allergens over longer periods (correlation coefficients 0.27–0.58) [16, 21]. Moreover, a reasonable correlation (correla-tion coefficient 0.65) has been reported between measured endotoxin level in indoor dust and in air [83]. Moreover, most previous epidemiological studies on associations between exposure to furry pet allergens and asthmatic symp-toms have used allergen measurements in settled dust [2, 55, 88, 109]. Thus, we conclude that the exposure study has a reasonable internal validity.
Comments on external validity In the exposure measurement study, different types of aircraft used by two different airlines were included and the study should have a reasonable repre-sentativeness of the airplanes used in current commercial air transportation. However, the study may not be representative for airlines operating in other parts of the world where the microbial load or the furry pet allergen levels in the society is different. The initial three year cohort study and the later cross-sectional questionnaire study included all pilots in one Scandinavian airline. The limitation to one north-European airline limits the external validity but our study may be representative for north-European conditions. Commercial pilots have a similar type of work all over the world but cultural differences, differences in life style factors, differences in the home environment as well as differences in work conditions may differ for pilots working for different airlines. In the future, similar exposure measurements and questionnaire stud-ies should be performed among commercial airlines in other parts of the world.

54
Comments on the measurements of furry pet allergens in aircraft We found cat (Fel d1), dog (Can f1) and horse (Ecu cx) allergens in all dust samples from the cabin and the cockpit. The geometric mean level of Fel d1 was 6551 ng/g in dust from cabins with textile seats, 107 ng/g in dust from cabins with leather seats, 3383 ng/g in cockpit dust from aircraft with textile seats in the cabin and 657 ng/g in cockpit dust from aircraft with leather seats in the cabin. The cockpit had textile seats in all aircraft even if the cabin had leather seats. We found only one previous study measuring Fel d1 in the cabin environment. In this study from New Zeeland, they found cat allergen in all dust samples and the mean level of Fel d1 was 33 300 ng/g dust [68], a mean level even higher than in our study.
The geometric mean level of Can f1 was 6551 ng/g in dust from cabins with textile seats, 227 ng/g in dust from cabins with leather seats, 2552 ng/g in cockpit dust from aircraft with textile seats in the cabin and 495 ng/g in cockpit dust from aircraft with leather seats in the cabin. The geometric mean level of Ecu cx f1 was 13703 ng/g in dust from cabins with textile seats, 183 ng/g in dust from cabins with leather seats, 11418 ng/g in cockpit dust from aircraft with textile seats in the cabin and 1839 ng/g in cockpit dust from air-craft with leather seats in the cabin. We found no previous studies on dog or horse allergen contamination in aircraft.
The allergen levels were much higher in aircraft with textile seats as com-pared to leather seats. The main source of the allergens is most likely transfer of allergens from the home environment among those keeping cat or dogs or riding horses. In addition, some airline companies allow small pets to be kept in the cabin. Cabins are cleaned on a regular basis in the airports, between flights, but the cleaning procedure only involves cleaning of the floor. This enables allergens to accumulate in the seats in the cabin and in the cockpit, especially in seats with textile material. The levels of cat, dog and horse aller-gens in aircraft with textile seats were higher than levels previously reported from Swedish schools [55, 88, 110]. Cat, dog and horse allergens can cause allergic respiratory symptoms in sensitized subjects. One review study on the potential risks of cat allergens and furry pet transportation in aircraft cabins concluded that the allergen levels in the cabin is high enough to cause allergic reactions among sensitized passengers [75]. Studies from schools have demonstrated that cat allergen contaminations in the classroom can be a risk factor for asthma symptoms in sensitized children [2, 88] and horse allergens has been reported to cause anaphylaxis in rare cases [40]. So far, studies about health risks with allergens in aircraft have focused on allergic reactions to cer-tain food allergens such as tree nuts and peanuts [20]. Our study have demon-strated that there is a considerable contamination of both cat, dog and horse allergens both in the cabin and in the cockpit and the allergen levels are such

55
that this allergen contamination could be a as a risk factor for sensitized sub-jects, both pilots and passengers. In conclusion, furry pet allergen contamina-tion can be an important issue in civil aviation, and measurement should be taken to reduce this exposure.
Comments on exposure measurements of MVOC and fungal DNA in aircraft Mould may grow under moist conditions in indoor environments, including aircraft. We used two different methods, measurement of fungal DNA and MVOCs, to measure fungal contamination in the aircraft cabin. We found no previous publication on measurements of fungal DNA or MVOCs in aircraft. The air levels of the sum of MVOCs were 3.7 times higher in the cabin air as compared to randomly selected homes in three cities in Northern Europe, and levels of 3-methyl-1-butanol, 2-methyl-1-butanol, 1-octen-3-ol were elevated 17, 15 and 1.4 times, respectively. Other MVOC compounds were found at lower levels in the cabin air as compared to homes. MVOCs as damp indica-tors have been questioned. However, a home environment study showed that levels of 2-methyl-1-butanol and 1-octen-3-ol were elevated in homes with verified mould growth [105] though with weak association. These two MVOC compounds were elevated in our study, and may indicate mould growth in the airplane but there are other possible sources for the elevated levels of these compounds. Both 3-methyl-1-butanol and 2-methyl-1-butanol can be pro-duced by mould like bacteria [72] but 3-methyl-1-butanol is widely used as a fragrance ingredient [30]. A possible source of microbial contamination in the cabin could be microbial growth in the mineral insulation in the cabin wall. There is no dampness barrier in the aircraft wall and there is a considerable condensation of humidity in the wall construction during the flights (cold wall condensation). We took one sample from the mineral insulation of one aircraft and found elevated levels of total fungi and total bacteria according to the normal values of the laboratory (more than 106 organisms per g mineral insu-lation). The health significance of indoor MVOCs is unclear but two home environment studies reported associations between levels of 1-octen-3-ol in indoor air and the prevalence of symptoms compatible with the Sick Building Syndrome (SBS) [8, 99]. Since none of these two studies found associations between 3-methyl-1-butanol or 2-methyl-1-butanol and medical symptoms, MVOC exposure in the cabin air may be of limited health significance.
When comparing our data on fungal DNA with data from European schools, the total fungal level in dust from the cabin was about one fifth of that in European classrooms [108]. In accordance with the data on allergen levels, we found higher levels of fungal DNA in aircraft with textile seats as compared to those leather seats, suggesting an accumulation of mould in the

56
textile material. However, the levels of fungal DNA is relatively low and the health significance of this contamination may be limited. The health signifi-cance and type of sources of fungal contamination in aircraft deserves further attention.
Comments on descriptive data on asthma and allergies In the three year cohort study, at baseline, totally eleven pilots reported that they had ever had asthma and six of them had the asthma diagnosed by a doc-tor (1.4%). The low prevalence of doctor’s diagnosed asthma could be due to selection since pilots have regular medical examinations and are not allowed to have severe or uncontrolled asthma. However, mild or moderate asthma is allowed if it is well controlled [15]. The incidence of doctors’ diagnosed asthma was 2.4 cases per 1000 person-years in our study, if we exclude the eleven pilots reporting asthma at baseline. A total of 94.7% of the pilots were males. A Swedish population based cohort study (mean age 34 years at base-line) from 1980–1993 reported an overall incidence rate of adult onset asthma of 1.1 per 1000 person-years, 1.0 per 1000 person-years among males and 1.3 per 1000 person-years among females [119]. A study among general Nordic population (mean age 40 years at baseline) performed in 1999–2001 reported that the incidence of doctor diagnosed asthma was 2.2 cases per 1000 person-years, 1.5 cases per 1000 person-years among males, and 2.9 cases per 1000 person-years among females [118]. Our study was conducted during a similar study period (1997–2000), and the mean age of the pilots was 45 years Thus we can conclude that the incidence of doctor diagnosed asthma in our study among commercial pilots was similar as in the general population in the Northern Europe.
In our cohort study, the prevalence of self-reported pollen allergy was 16.9% at baseline (1997) and 19.4% at follow-up (2000). These are somewhat higher numbers than reported from two previous Swedish population studies. They found 14% pollen allergy in 1997 [100] and 16% in 2001 [102]. We found no previous study on incidence of self-reported atopy in the general population in Sweden from the same time as out study.
Associations between self-reported health and personal factors Associations between personal factors or life style factors and a number of self-reported health variables and medical symptoms have been investigated. Comments on these associations are given below.

57
Comments on self-rated health (SRH) and personal factors A total of 21.8% of the pilots reported SRH as poor or fair and poor or fair SRH was associated with obesity and insomnia. We found no previous study on SRH in commercial pilots but associations between obesity and poor SRH has been reported previously in large population studies [3, 78]. We found only a few studies on associations between sleep and SRH and they found that insufficient sleep was associated with poor SRH [38, 41, 76], but they meas-ured sleep length, not insomnia. We found no previous studies on associations between SRH and insomnia. Moreover, we found that regular physical exer-cise was associated with better SRH: This is in agreement with some previous studies. Physical activity was reported to be positively associated with SRH among employees from high-tech companies in China [48], and in general population in Ireland [78]. Finally, we found that a high sense of coherence were associated with better SRH. This is in agreement with some previous studies. A high SOC was associated with better SRH among Japanese factory workers [121]. Moreover, a Canadian population study reported that SOC may act as an intermediate factors which buffers the stressors in life [93]. In con-clusion, there is a need to reduce obesity and improve the sleep quality among pilots.
Comments on recovery from work and personal factors A total of 35.6% of the pilots did not feel recovered after several days off work. We used a question on recovery from work adapted from a previous publication among government employees [43]. We found that current smok-ers and those with insomnia had poorer recovery from work. We found no previous study using this question on recovery from work among commercial pilots. Recovery from work among pilots is an important issue especially since the increased competition in the aviation sector has increased the stress and the work hours for the pilots.
Comments on fatigue and personal factors In the three year cohort study, 69.9% reported sometimes tiredness and 13.4% reported often tiredness in the past 3 months (at baseline). In the later cross-sectional study, 61.9% of the pilots reported fatigue (sometimes or often). Fe-male pilots had more often fatigue and older pilots had less often fatigue. Most of the commercial pilots are men and gender differences in medical symptoms among pilots have rarely been studied. However, among office workers a large number of studies have shown that females have more tiredness than men [13,
58
112]. Older pilots have more experience and this could explain why they have less tiredness, but it could also be a selection effect, causing symptomatic pi-lots to change to another occupation.
Comments on headache and personal factors In the three year cohort study, 26.3% reported sometimes headache and 1.2% reported often headache during the past 3 months (at baseline).The prevalence of headache at baseline was higher among males than females but females developed less headache during the follow up than men. We found no previous studies on gender difference in headache among pilots. However, among of-fice workers several studies have demonstrated that females have more medi-cal symptoms than men, including headache [13, 112]. We have no explana-tion why females develop less headache than men, but since more and more pilots are women, this is beneficial. In our study, older pilots had a lower prev-alence of headache. Older pilots have more experience and this could explain why they have less headache but it could also be healthy worker selection effect.
Comments on eye symptoms and personal factors In the three year cohort study, 27.0% reported sometimes eye symptoms and 2.8% reported often eye symptoms in the past 3 months (at baseline). In the later cross-sectional study, 33.1% of the pilots reported eye tiredness (some-times or often). We found that overweight or obesity and insomnia were risk factors for eye tiredness. We found no previous studies on eye symptom and obesity among pilots, but it is reasonable that insomnia could lead to eye tired-ness. Moreover, obesity is linked to inflammation [12, 42, 90], which could be linked to eye symptoms.
Comments on nasal symptoms and personal factors In the three year cohort study, 45.3% reported sometimes and 7.7% reported weekly nasal symptoms (runny nose or nasal irritation) during the past 3 months (at baseline). Those with self-reported atopy (pollen or furry pet al-lergy) had a higher prevalence of nasal symptoms. This is expected since nasal symptoms are linked to atopy (allergic rhinitis). Older pilots had less nasal symptoms. This could be due to a selection effect (the health worker effect) or because older pilots have less allergies. Moreover, females developed less nasal symptoms than men during the follow up. We have no explanation why

59
females develop less nasal symptoms than men, but since more and more pi-lots are women, this is beneficial.
Comments on dermal symptoms and personal factors In the three year cohort study, 42.0% reported sometimes and 14.0% reported weekly dermal symptoms ( dry flushed facial skin, scaling/itching scalp or ears, and hands with dry, itching, red skin) during the past 3 months (at base-line). The prevalence of dermal symptoms was higher among female than among men. As for headache and tiredness, a number of studies from the of-fice environment, it is well known that females report more dermal symptoms than men [13, 112]. The reason is unclear, but could be due to a general excess of symptoms among females, or different social roles [13, 112]. Since the number of female pilots was limited in our study, gender differences needs to be studied further in newer studies with more female pilots included.
Comments on health associations with the work environment We have investigated health associations for selected physical work environ-ment factors as well as the self-reported psychosocial work environment. Comments on these associations are given below.
Comments on exposure to ETS on board Before the ban of smoking in 1997, pilots were exposed to environmental to-bacco smoke (ETS) on board, especially on long haul (intercontinental) flights. The particle levels in the cabin was high [61] and the concentration of cotinine in urine increased among non-smoking airline crew after the ETS ex-posure on intercontinental flights [64]. We found that pilots working on long haul flights with ETS exposure (7-12 h flight duration) had more eye symptom and tiredness. For shorter European flights with ETS exposure there was a nonsignificant tendency to an increase of these symptoms. After the ban on smoking on board, tiredness decreased and reports of stuffy air at work were less common. One previous study from the same airline company, including both pilots and cabin attendants, investigated symptom improvements and changes of clinical signs from the ocular and nasal mucosa a few weeks after the ban on smoking in 1997. The ban of smoking on board caused a drastic decrease in respirable particles in the cabin, from 66 µg/m3 to 3 µg/m3·and the prevalence of ocular symptoms and headache was reduced. Moreover, the tear

60
film stability was increased, indicating less eye irritation [133]. We found no other longitudinal studies investigating health improvement after the ban on smoking on commercial airlines. Pilots spend the most time on the flight deck, which has a separate ventilation system, usually without any air recirculation, so their ETS exposure should be considerably less than for cabin attendants. However, since this study was done before the September 11th terrorist at-tacks, pilots could spend shorter periods in the forward galley when they had a break, and then they were exposed to ETS in the cabin environment. ETS exposure should be eliminated or reduced as much as possible in all types of indoor environment.
Comments on types of flights and type of aircraft In the 3-year cohort study, pilots who changed type of flights, both those from long- to short-haul and those from short- to long-haul, reported more airway infections at follow-up. We have no clear explanation to this finding, but it is possible that some pilots change flight type because of some health problems and that these health problems are associated with an increased risk for respir-atory infections. In the later cross-sectional study, pilots operating MD80 se-ries and Saab 2000 reported a lower prevalence of fatigue, as compared to other types of aircraft (Airbus 330/340 or Boeing 737). Pilots and flight at-tendants have reported to the occupational health services that the MD80 se-ries of aircraft had less noise in the cabin and on flight deck and this has been verified by noise measurements by the occupational health service of the air-line company (Håkan Lundström, personal communication). However, this type of aircraft is not used anymore by the airline. Saab 2000 is a small air-plane used for domestic routes and has an active noise reduction system in the cabin. Thus it can be concluded that the noise level inside the airplane can be a risk factor of fatigue among the pilots. In conclusion, psychosocial work environment is an important occupational risk factor for commercial pilots.
Comments on the psychosocial work environment In the 3 year cohort study, we assessed the psychosocial work environment by a short version of the demand-control-social support model used in the Örebro indoor questionnaire [4]. The questionnaire use only four questions so it is not directly comparable with the more extensive questionnaires used in previous cross-sectional studies on the psychosocial work environment [95, 97, 98]. We found that increased demands and less work control was associated with increased symptom scores for eye symptoms, nose symptoms, skin symptoms and tiredness. Moreover, increased work demands increased reports of stuffy air and dry air during the follow-up. Associations were more pronounced in
61
the longitudinal analysis when changes of the psychosocial work environment were used as independent variables. In addition, we found that pilots who re-ported less control over the work situation during the follow up developed more self-reported atopy. We have no clear explanation of this finding but less control over the work conditions is expected to be a psychosocial risk factor at work. In a previous cross-sectional study in the Swedish workforce, atopy and asthma symptoms, no associations were found between low control and atopy [96]. In the later cross-sectional study we used the iso-strain model to assess the psychosocial work environment [97] [50]. In the final mutually ad-justed models, pilots with high work demands reported poorer self-rated health (SRH). Those reporting low social support at work reported less recov-ery from work and those reporting high work demands had more often fatigue. We found no previous epidemiological study on the psychosocial work envi-ronment among commercial pilots analysing the same type of health variables and medical symptoms as in this thesis. However, in one cross sectional study in a random sample of the adult Swedish population, associations were found between eye symptoms and low social support combined with strained work situations. In addition, tiredness was more common with low social support combined with strained job situations [98].
Comments on health associations with the home environment We have investigated health associations for selected home environment fac-tors in the 3-year cohort study. Comments on these associations are given be-low.
Age of the dwelling Pilots living in newer houses (built after 1975) had a higher incidence of tired-ness and airway infections. In a previous population study among adults in Sweden, there was an increased prevalence of respiratory infections among adults living in houses constructed from 1976-1985 while no increased prev-alence was observed for homed constructed after 1985, using older buildings (constructed before 1960) used as reference category [129]. The drastic in-crease of the energy price in 1975 initiated measures to reduce the energy con-sumption in Swedish buildings. Moreover, a self- level mortal containing ca-sein was used in Swedish buildings from 1997-1983. This product caused emission of odorous compounds such as ammonia and 2-acetophenone from the floor [67]. Thus it is possible that the increased prevalence of respiratory infections among pilots living in homes constructed after 1975 was due to en-ergy saving measures as well as the introduction of new building materials,
62
resulting in an impairment of the indoor environment. Moreover, one recent study from South Korea found that moving to a new house may increase the prevalence of asthma symptoms [58]. Newer buildings could be a risk factor for respiratory infections.
Type of dwelling The prevalence of eye symptoms were more common among pilots living in multifamily houses (apartments). Type of home (apartment or single-family house) can reflect different types of ownership and different type of building constructions. Single-family homes are owned by the inhabitant while some of the apartments are rented. Two studies among multifamily-houses in Stock-holm found that eye symptoms were more common in public owned rented apartments as compared to privately owned apartments [26, 27]. The type of dwelling could influence ocular symptoms.
Building dampness and indoor mould In the 3-year cohort study, at baseline, the prevalence of tiredness was higher in homes with dampness and indoor mould. A similar association have been reported in a longitudinal population study from the adult Swedish population. In this study, dampness and indoor mould was associated with a higher inci-dence and a lower remission of general symptoms [102]. In the Stockholm study, an association was found between tiredness among adults and damp-ness and indoor mould in apartments in multi-family buildings [28]. Moreo-ver, one study from China found a higher prevalence of tiredness among adults in homes with signs of dampness and indoor mould [65].
Moreover, we found that dampness or mould at home were associated with increased prevalence of asthma symptoms and airway infections among the pilots. This finding is in agreement with previous studies and a review from WHO have concluded that there is sufficient evidence that dampness and mould is associated with asthma symptoms [136] A recent review article con-cluded that building dampness and indoor mould is associated with respiratory infections [74]. Our study support that the indoor dampness and mould is an important risk factor in dwellings.
Window pane condensation in wintertime Window pane condensation in wintertime in a cold climate is a proxy variable for poor indoor environment linked to high relative air humidity and low air exchange rate. Window pane condensation has been shown to be a risk factor for growth of house dust mites in homes in Stockholm [131]. Moreover homes with window pane condensation in winter has significantly lower air exchange rate, higher relative air humidity and higher levels of house dust mite allergens

63
and total volatile organic compounds (TVOC) as compared to homes without window condensation [23]. We found that pilots living in homes with window pane condensation in winter had a higher incidence of asthma symptoms. Moreover, change of window pane condensation status was associated with incidence of asthma symptoms. Window pane condensation has been reported to be associated with increased prevalence of wheeze among children in Swe-den [25] and among adults in Japan [114].
In contrast, we found that the prevalence of skin symptoms were lower among pilots living in homes with window condensation in wintertime. The protective effect on skin symptoms could be due to the higher air humidity being beneficial for the skin. In conclusion, window condensation in winter is associated with increased risk of asthma symptoms.
Indoor painting The prevalence of headache was higher in homes with recent indoor painting. A similar association have been reported in a population study from the adult Swedish population. Indoor painting was associated with less remission (more persistence) of general symptoms (including headache and tiredness) [102]. In conclusion, Chemical emissions from indoor painting could trigger head-ache.
ETS at home We found that pilots exposed to environmental tobacco smoke (ETS) at home, either at baseline or at follow-up, had an increased incidence of self-reported atopy (pollen or furry pet allergy). We have not found any other study on as-sociations between ETS exposure and development of atopy among adults, but a number of studies have demonstrated that ETS exposure in early child-hood is associated with increased risk of atopic sensitization [35].
Furry pets Pilots with furry pets at home had less eye symptoms and a lower prevalence of atopy. This is in agreement with a recent population study among adults in Stockholm, showing a negative association between keeping furry pets and pollen allergy [81]. The most probable reason for the negative association is selection, where allergic persons avoid keeping furry pets.

64
CONCLUSIONS AND IMPLICATIONS
Airline transportation has become an important part of the global develop-ment. There has been an increased focus on the indoor environment in aircraft, both in the cabin and on flight deck. The elimination of ETS on board and the introduction of ozone converters have been important achievements improv-ing the indoor environment in civil aviation aircraft. However, exposure to bio-aerosols and allergens is still an important issue. In areas of the world where the habit of keeping cats and dogs as pets is common, there could be a considerable contamination of cat and dog allergens in the cabin and on flight deck. In areas where horse riding is common, such as in northern Europe, there is a similar indoor contamination of the aircraft environment with horse aller-gen. The contamination with furry pet allergens in the aircraft can be high enough to cause health problems in sensitised passengers, cabin attendants and pilots. Measures should be taken to reduce this allergen exposure. Regular cleaning of seats and use of smooth materials rather than textile material should be encouraged. Fungal contamination of the indoor environment in the cabin and on flight deck was detected, especially in aircraft with textile seats. The sources and the health impact of this fungal contamination needs to be further investigated. There is a need to further identify and quantify mould species as well as bacteria species in the cabin and cockpit environment by molecular methods.
Self-rated health, respiratory symptoms and self-reported allergy among the pilots are associated with specific occupational and non-occupational risk factors. The psychosocial work environment is an important occupational risk factor for the pilots, related to self-rated health and medical symptoms. High work demand can be a risk factor for self-rated health, fatigue, rhinitis and dermal symptoms and decreased work control can be a risk factor for eye symptoms. The ban of ETS in commercial aircraft was a major environmental improvement and ETS should be eliminated or reduced as much as possible in all types of indoor environments. Pilots operating certain types of aircraft (MD80 series and Saab 2000) reported less fatigue. These aircraft have less noise on board. This suggest that there is a need to reduce the noise level in the cockpit, e.g. by active noise reduction systems.
The prevalence of fatigue and insomnia was high among pilots. Sleep prob-lems among pilots is a well-known issue. Previous research has focused on “jet lag”, caused by moving between different time zones, but other risk fac-tors can also be of importance. Overweight or obesity was common and there
65
is a need to reduce this well-known life-style related risk factor among pilots. We found gender differences in certain medical symptoms and more studies are needed on gender differences in health among commercial pilots. Moreo-ver, personality aspects of health among the pilots needs to be further investi-gated. Risk factors in the home environment included ETS, dampness or mould, window pane condensation in winter and living in houses built after 1975. These results indicate a need for further improvements of the indoor environment in dwellings in Sweden, and illustrate that the home environment is an important indoor environment for pilots. In epidemiological studies on occupational risk factors the impact of the home environment should not be neglected. Finally, there is a need for more studies of the indoor environment in the cabin and cockpit and a need for larger health studies among pilots as well as cabin attendants, including airlines operating in different parts of the world.

66
ACKNOWLEDGEMENT
A lot of people helped me and supported me during my PhD study. Without their support, I would never accomplish my thesis and the PhD study. I wish to express my sincere gratitude to: Chinese Scholarship Council, for providing me the financial support. Dan Norbäck, my tutor, for excellent guidance of my study. Thank you for your tolerance and patience. I learnt a lot from you, not by what you said, but by how you behaved. The best thing I learn from you is your attitude, attitude to research, attitude to work, attitude to friends, and attitude to life. Christer Janson, my co-tutor, for excellent guidance of my study, and helpful suggestions for the articles and my thesis. Magnus Svartengren, head of department, for your fully support for my study, and nice discussion and helpful comments during seminars. Gunilla Wieslander, for kindly teaching me the inspections for pupils at pri-mary schools, and for taking me as a friend. Roma Runesson-Broberg, for nice cooperation in research, and for your fully support. Torsten Lindgren, for the great help of collecting data and samples from the airline company, and for providing me support in the knowledge that I can never get by searching in Google or Wikipedia, regarding aircraft and pilots. Guihong Cai, for helpful suggestions for my first article, and nice discussion during seminars. Juan Wang, for being a colleague, a friend. It’s really nice to have your ac-company at work, and really challenging to compete with you in the PhD work. I admire your perseverance in learning Swedish. Linda Dunder, for your warmness, for taking me as a friend, and a colleague to ask for advice. Thank you for accepting to be my toast master.

67
All colleagues at our department, for the nice and warm atmosphere, for the kindness of speaking English to me, and for the passion of teaching me Swe-dish. Qijiang Xu, for telling me not to take responsibility for others’ mistake, even that person is with high power, and teaching me not to be afraid. Lene Uhrbom, for telling me that I know more than I think, for encouraging me to be confident. Lena Claesson-Welsh, for telling me that I’m a tough woman like you. Di Yu, for telling me that if I can accomplish a task well when I don’t have interest in it, then I can do it even better when I’m really interested. Xiujuan Li, for your kindness and warmness, for your support, and for your help. Xin Zhang, for caring about me, for kind advices for career and for life. Yichuan Liang, my old friend from high school, for keeping me in your mind all the time, sending me messages important or not, which warmed me up very much. My friends, who are here in Sweden, or who already left for their own future, Shixin Liu, Anqi Xiong, Di Wu, Yanling Cai, Shuang Gao, Jinzhi Hu, Li Li, Xiaoyu Wang, Jing Zhang, Chuan Jin, Di Yu, Xiang Jiao, Yifei Wu, Su-Chen Li, Shang-Feng Lou, Haisha Ma, Bo Xu, Miao Fang, Yan Hao, Yiwen Jiang, Shi Cheng, Chengxi Shi, Yan zhou, Yang Sun, Xiaohu Guo, Yani Zhao, Hua Huang, Lei Chen, Yanyu Zhang, Lei Zhang, Wangshu Jiang, Zhoujie Ding, Hui Xu, Junhong Yan, Yao Shi, Xingqi Chen, Shuangwei Hu, Changgang Xu, Xiaoze Li, Yuan Xie, Xue Wu, Shanshan Zhang, Farhana Ninni Haque, and Anna Edlund, for the accompany, listening to me, hanging out at weekends, sharing your stories with me, and offer me help and support when it is needed. Yu Sun, my husband, for walking into my life. It makes me want to be a better person, being together with you. Your faith in me makes me more confident, and stronger. 感谢爸爸妈妈的养育之恩, 做了妈妈之后,更能体会养育儿女的不易。谢谢你们给了我良好的教育,在我步入社会之后,不断地给予我支持和鼓励,告诉我要坚强,勇敢,但家里永远是可以休憩的港湾,从北京,到深圳,再到 Uppsala, 从来没有变过。

68
感谢公公婆婆,在还没见到面时,就帮我准备热乎乎的饭菜。感谢你们对我的包容和忍让。 感谢爸爸妈妈,公公婆婆对我和孙峪事业的支持, 腾出大量时间和精力帮我们照顾宝宝,照顾家里。 感谢我的宝贝们, 菀晴,梓晴。谢谢你们,让妈妈体会到了做妈妈是一件多么幸福的事。在妈妈感到疲惫的时候, 只要看到你们熟睡的小脸儿,就会重新充满动力。 感谢我的家人们,爷爷, 叔叔婶婶们,舅舅舅妈,九姨,弟弟妹妹们,谢谢你们万里之外的支持和关心。
69
REFERENCES
[1] Akerstedt T. Work schedules and sleep. Experientia. 1984 May 15;40(5):417-22.
[2] Almqvist C, Wickman M, Perfetti L, Berglind N, Renstrom A, Hedren M, et al. Worsening of asthma in children allergic to cats, after indirect exposure to cat at school. American journal of respiratory and critical care medicine. 2001 Mar;163(3 Pt 1):694-8.
[3] Alvarez-Galvez J, Rodero-Cosano ML, Motrico E, Salinas-Perez JA, Garcia-Alonso C, Salvador-Carulla L. The impact of socio-economic status on self-rated health: Study of 29 countries using European social surveys (2002–2008). International journal of environmental research and public health. 2013;10(3):747-61.
[4] Andersson K. Epidemiological approach to indoor air problems. INDOOR AIR-INTERNATIONAL JOURNAL OF INDOOR AIR QUALITY AND CLIMATE. 1998:32-9.
[5] Antonovsky A. Health, stress, and coping. 1979. [6] Antonovsky A. Unraveling the mystery of health: How people manage
stress and stay well: Jossey-Bass 1987. [7] Antonovsky A. The structure and properties of the sense of coherence
scale. Social science & medicine. 1993;36(6):725-33. [8] Araki A, Kanazawa A, Kawai T, Eitaki Y, Morimoto K, Nakayama K,
et al. The relationship between exposure to microbial volatile organic compound and allergy prevalence in single-family homes. The Science of the total environment. 2012 Apr 15;423:18-26.
[9] ASHRAE. Ventilation for acceptable indoor air quality. In: American Society of Heating RaA-CE, ed. 2003.
[10] Bernstein JA, Alexis N, Bacchus H, Bernstein IL, Fritz P, Horner E, et al. The health effects of non-industrial indoor air pollution. The Journal of allergy and clinical immunology. 2008 Mar;121(3):585-91.
[11] Boel NM, Klokker M. Upper Respiratory Infections and Barotrauma Among Commercial Pilots. Aerospace medicine and human performance. 2017 Jan 01;88(1):17-22.
[12] Boulet LP. Asthma and obesity. Clinical and experimental allergy : journal of the British Society for Allergy and Clinical Immunology. 2013 Jan;43(1):8-21.

70
[13] Brasche S, Bullinger M, Morfeld M, Gebhardt HJ, Bischof W. Why do women suffer from sick building syndrome more often than men?--subjective higher sensitivity versus objective causes. Indoor air. 2001 Dec;11(4):217-22.
[14] Cai GH, Hashim JH, Hashim Z, Ali F, Bloom E, Larsson L, et al. Fungal DNA, allergens, mycotoxins and associations with asthmatic symptoms among pupils in schools from Johor Bahru, Malaysia. Pediatric allergy and immunology : official publication of the European Society of Pediatric Allergy and Immunology. 2011 May;22(3):290-7.
[15] Civil Aviation Authority. CAA Asthma Class 1/2 Certification Guidelines. 1992.
[16] Custis NJ, Woodfolk JA, Vaughan JW, Platts-Mills TA. Quantitative measurement of airborne allergens from dust mites, dogs, and cats using an ion-charging device. Clinical and experimental allergy : journal of the British Society for Allergy and Clinical Immunology. 2003 Jul;33(7):986-91.
[17] Dai Y, Zhang CY, Zhang BQ, Li Z, Jiang C, Huang HL. Social support and the self-rated health of older people: A comparative study in Tainan Taiwan and Fuzhou Fujian province. Medicine. 2016 Jun;95(24):e3881.
[18] De Bruin A. Health Interview Surveys: Towards International Harmonization of Methods and Instruments. WHO Regional Publications, European Series, No. 58: ERIC 1996.
[19] de Souza Palmeira ML, Cristina Marqueze E. Excess weight in regular aviation pilots associated with work and sleep characteristics. Sleep Science (Sao Paulo, Brazil). 2016 Oct-Dec;9(4):266-71.
[20] Dechow M, Sohn H, Steinhanses J. Concentrations of selected contaminants in cabin air of airbus aircrafts. Chemosphere. 1997;35(1):21-31.
[21] Elfman L, Mi Y., Norbäck D., and Smedje G. . School-a source for exposure to furry-pet allergens. 2007: World Allergy Organization Journal; 2007.
[22] Elwood H. Hunt DRS. The airplane cabin environment. TSP. 1994;3(2):1-000.
[23] Emenius G, Korsgaard J, Wickman M. Window pane condensation and high indoor vapour contribution - markers of an unhealthy indoor climate? Clinical and experimental allergy : journal of the British Society for Allergy and Clinical Immunology. 2000 Mar;30(3):418-25.
[24] Emenius G, Larsson PH, Wickman M, Harfast B. Dispersion of horse allergen in the ambient air, detected with sandwich ELISA. Allergy. 2001 Aug;56(8):771-4.
[25] Emenius G, Svartengren M, Korsgaard J, Nordvall L, Pershagen G, Wickman M. Building characteristics, indoor air quality and recurrent wheezing in very young children (BAMSE). Indoor air. 2004;14(1):34-42.

71
[26] Engvall K, Hult M, Corner R, Lampa E, Norback D, Emenius G. A new multiple regression model to identify multi-family houses with a high prevalence of sick building symptoms "SBS", within the healthy sustainable house study in Stockholm (3H). International archives of occupational and environmental health. 2010 Jan;83(1):85-94.
[27] Engvall K, Norrby C, Bandel J, Hult M, Norback D. Development of a multiple regression model to identify multi-family residential buildings with a high prevalence of sick building syndrome (SBS). Indoor air. 2000 Jun;10(2):101-10.
[28] Engvall K, Norrby C, Norback D. Sick building syndrome in relation to building dampness in multi-family residential buildings in Stockholm. International archives of occupational and environmental health. 2001 May;74(4):270-8.
[29] Eriksson M, Lindström B. Validity of Antonovsky’s sense of coherence scale: a systematic review. Journal of epidemiology and community health. 2005;59(6):460-6.
[30] Ernstgard L, Norback D, Nordquist T, Wieslander G, Walinder R, Johanson G. Acute effects of exposure to vapors of 3-methyl-1-butanol in humans. Indoor air. 2013 Jun;23(3):227-35.
[31] European Committee for Standardization. High efficiency air filters(HEPA and ULPA)-Part 1: Classification, performance testing, marking. 1998;EN1822-1,Brussels.
[32] European Organization for the Safty of Air Navigation (EUROCONTROL). Study into the impact of the global economic crisis on airframe utilisation. 2011 [cited; Available from: www,eurocontrol.int
[33] Fajardo Rodriguez HA, Ortiz Mayorga VA. Characterization of Low Back Pain in Pilots and Maintenance Technicians on a Commercial Airline. Aerospace medicine and human performance. 2016 Sep;87(9):795-9.
[34] Federal Aviation Administration. 2017 [cited; Available from: www.faa.gov
[35] Feleszko W, Ruszczyński M, Jaworska J, Strzelak A, Zalewski BM, Kulus M. Environmental tobacco smoke exposure and risk of allergic sensitisation in children: a systematic review and meta-analysis. Archives of disease in childhood. 2014;99(11):985-92.
[36] Flensborg-Madsen T, Ventegodt S, Merrick J. Sense of coherence and physical health. A review of previous findings. The Scientific World Journal. 2005;5:665-73.
[37] Flying Academy. Class-1 and Class-2 Medical Certificates. 2016 [cited; Available from: http://www.flyingacademy.com/EN/class-1-and-class-2-medical-certificates
[38] Frange C, de Queiroz SS, da Silva Prado JM, Tufik S, de Mello MT. The impact of sleep duration on self-rated health. Sleep science. 2014;7(2):107-13.

72
[39] Frasch G, Kammerer L, Karofsky R, Schlosser A, Stegemann R. Radiation exposure of German aircraft crews under the impact of solar cycle 23 and airline business factors. Health physics. 2014 Dec;107(6):542-54.
[40] Gawlik R, Pitsch T, Dubuske L. Anaphylaxis as a manifestation of horse allergy. The World Allergy Organization journal. 2009 Aug;2(8):185-9.
[41] Geiger SD, Sabanayagam C, Shankar A. The relationship between insufficient sleep and self-rated health in a nationally representative sample. Journal of environmental and public health. 2012;2012.
[42] Gruchala-Niedoszytko M, Malgorzewicz S, Niedoszytko M, Gnacinska M, Jassem E. The influence of obesity on inflammation and clinical symptoms in asthma. Advances in medical sciences. 2013;58(1):15-21.
[43] Gustafsson K, Lindfors P, Aronsson G, Lundberg U. Relationships between self-rating of recovery from work and morning salivary cortisol. Journal of occupational health. 2008;50(1):24-30.
[44] Hines CJ, Waters MA, Larsson L, Petersen MR, Saraf A, Milton DK. Characterization of endotoxin and 3-hydroxy fatty acid levels in air and settled dust from commercial aircraft cabins. Indoor air. 2003 Jun;13(2):166-73.
[45] Hocking MB, Hocking D. Air quality in airplane cabins and similar encloased spaces: Springer Sciences & Business Media 2005.
[46] Hova JK, Thorheim L, Wagstaff AS. Medical Reasons for Loss of License in Norwegian Professional Pilots. Aerospace medicine and human performance. 2017 Feb 01;88(2):146-9.
[47] Idler EL, Angel RJ. Self-rated health and mortality in the NHANES-I Epidemiologic Follow-up Study. American journal of public health. 1990;80(4):446-52.
[48] Jia Y, Gao J, Dai J, Zheng P, Wu X, Li G, et al. Difference of the associations between self-rated health and demographic characteristics, lifestyle, and psychosocial work environment between two types of Chinese worksite. BMC Public Health. 2014;14(1):1.
[49] Johnson JV. The impact of workplace social support, job demands and work control upon cardiovascular disease in Sweden: ProQuest Information & Learning; 1986.
[50] Johnson JV, Hall EM. Job strain, work place social support, and cardiovascular disease: a cross-sectional study of a random sample of the Swedish working population. American journal of public health. 1988 Oct;78(10):1336-42.
[51] Joint Aviation Authorities. Joint Aviation Requirements. Cosmic Radiation. 2001;JAR OPS 1.309.
[52] Karasek Jr RA. Job demands, job decision latitude, and mental strain: Implications for job redesign. Administrative science quarterly. 1979:285-308.
73
[53] Karasek R, Brisson C, Kawakami N, Houtman I, Bongers P, Amick B. The Job Content Questionnaire (JCQ): an instrument for internationally comparative assessments of psychosocial job characteristics. Journal of occupational health psychology. 1998 Oct;3(4):322-55.
[54] Karasek RA, Theorell T. Healthy work: stress, productivity, and the reconstruction of working life: Basic books 1992.
[55] Kim JL, Elfman L, Mi Y, Johansson M, Smedje G, Norback D. Current asthma and respiratory symptoms among pupils in relation to dietary factors and allergens in the school environment. Indoor air. 2005 Jun;15(3):170-82.
[56] Korves T, Piceno Y, Tom L, Desantis T, Jones B, Andersen G, et al. Bacterial communities in commercial aircraft high ‐ efficiency particulate air (HEPA) filters assessed by PhyloChip analysis. Indoor air. 2013;23(1):50-61.
[57] Krause N. Satisfaction with social support and self-rated health in older adults. The Gerontologist. 1987;27(3):301-8.
[58] Kwon JW, Kim BJ, Song Y, Seo JH, Kim TH, Yu J, et al. Changes in the prevalence of childhood asthma in seoul from 1995 to 2008 and its risk factors. Allergy, asthma & immunology research. 2011 Jan;3(1):27-33.
[59] Lindgren T, Andersson K, Dammstrom BG, Norback D. Ocular, nasal, dermal and general symptoms among commercial airline crews. International archives of occupational and environmental health. 2002 Sep;75(7):475-83.
[60] Lindgren T, Andersson K, Norback D. Perception of cockpit environment among pilots on commercial aircraft. Aviation, space, and environmental medicine. 2006 Aug;77(8):832-7.
[61] Lindgren T, Norback D. Cabin air quality: indoor pollutants and climate during intercontinental flights with and without tobacco smoking. Indoor air. 2002 Dec;12(4):263-72.
[62] Lindgren T, Runeson R, Wahlstedt K, Wieslander G, Dammström B-G, Norbäck D. Digestive functional symptoms among commercial pilots in relation to diet, insomnia, and lifestyle factors. Aviation, space, and environmental medicine. 2012;83(9):872-8.
[63] Lindgren T, Wieslander G, Dammstrom BG, Norback D. Tinnitus among airline pilots: prevalence and effects of age, flight experience, and other noise. Aviation, space, and environmental medicine. 2009 Feb;80(2):112-6.
[64] Lindgren T, Willers S, Skarping G, Norback D. Urinary cotinine concentration in flight attendants, in relation to exposure to environmental tobacco smoke during intercontinental flights. International archives of occupational and environmental health. 1999 Oct;72(7):475-9.

74
[65] Lu C, Deng Q, Li Y, Sundell J, Norback D. Outdoor air pollution, meteorological conditions and indoor factors in dwellings in relation to sick building syndrome (SBS) among adults in China. The Science of the total environment. 2016 Aug 01;560-561:186-96.
[66] Lundberg O, Peck MN. A simplified way of measuring sense of coherence. The European Journal of Public Health. 1995;5(1):56-9.
[67] Lundholm M, Lavrell G, Mathiasson L. Self-leveling mortar as a possible cause of symptoms associated with “Sick Building Syndrome”. Archives of Environmental Health: An International Journal. 1990;45(3):135-40.
[68] Martin IR, Wickens K, Patchett K, Kent R, Fitzharris P, Siebers R, et al. Cat allergen levels in public places in New Zealand. The New Zealand medical journal. 1998 Sep 25;111(1074):356-8.
[69] Martinez I. Aircraft environmental control. 2015 [cited; Available from: http://webserver.dmt.upm.es/~isidoro/tc3/Aircraft%20ECS.pdf
[70] McKernan LT, Burge H, Wallingford KM, Hein MJ, Herrick R. Evaluating fungal populations by genera/species on wide body commercial passenger aircraft and in airport terminals. The Annals of occupational hygiene. 2007 Apr;51(3):281-91.
[71] McKernan LT, Wallingford KM, Hein MJ, Burge H, Rogers CA, Herrick R. Monitoring microbial populations on wide-body commercial passenger aircraft. Annals of Occupational Hygiene. 2008;52(2):139-49.
[72] McNerney R, Mallard K, Okolo PI, Turner C. Production of volatile organic compounds by mycobacteria. FEMS microbiology letters. 2012 Mar;328(2):150-6.
[73] Mendell MJ. Indoor residential chemical emissions as risk factors for respiratory and allergic effects in children: a review. Indoor air. 2007 Aug;17(4):259-77.
[74] Mendell MJ, Mirer AG, Cheung K, Tong M, Douwes J. Respiratory and allergic health effects of dampness, mold, and dampness-related agents: a review of the epidemiologic evidence. Environmental health perspectives. 2011 Jun;119(6):748-56.
[75] Mohrenschlager M, Ring J, Lauener R. Possible in-cabin exposure to cat allergen: a 2010 airline survey on live animal transport and a review of literature. Allergy. 2010 Nov;65(11):1496-8.
[76] Nakata A. Investigating the associations between work hours, sleep status, and self-reported health among full-time employees. International journal of public health. 2012;57(2):403-11.
[77] Niedhammer I, Chastang J-F, David S. Importance of psychosocial work factors on general health outcomes in the national French SUMER survey. Occupational Medicine. 2008;58(1):15-24.
[78] Niedhammer I, Kerrad S, Schütte S, Chastang J-F, Kelleher CC. Material, psychosocial and behavioural factors associated with self-reported health in the Republic of Ireland: cross-sectional results from the SLAN survey. BMJ open. 2013;3(5):e002797.

75
[79] Norback D, Bjornsson E, Janson C, Palmgren U, Boman G. Current asthma and biochemical signs of inflammation in relation to building dampness in dwellings. The international journal of tuberculosis and lung disease : the official journal of the International Union against Tuberculosis and Lung Disease. 1999 May;3(5):368-76.
[80] Norback D, Edling C. Environmental, occupational, and personal factors related to the prevalence of sick building syndrome in the general population. British journal of industrial medicine. 1991 Jul;48(7):451-62.
[81] Norbäck D, Lampa E, Engvall K. Asthma, Allergy and Eczema among Adults in Multifamily Houses in Stockholm (3-HE Study) - Associations with Building Characteristics, Home Environment and Energy Use for Heating. PloS one. 2014;9(12).
[82] Norback D, Lindgren T, Wieslander G. Changes in ocular and nasal signs and symptoms among air crew in relation to air humidification on intercontinental flights. Scandinavian journal of work, environment & health. 2006 Apr;32(2):138-44.
[83] Noss I, Wouters IM, Visser M, Heederik DJ, Thorne PS, Brunekreef B, et al. Evaluation of a low-cost electrostatic dust fall collector for indoor air endotoxin exposure assessment. Appl Environ Microbiol. 2008 Sep;74(18):5621-7.
[84] Nummela OP, Sulander TT, Heinonen HS, Uutela AK. Self-rated health and indicators of SES among the ageing in three types of communities. Scandinavian journal of public health. 2007;35(1):39-47.
[85] O'Hagan AD, Issartel J, Nevill A, Warrington G. Flying Into Depression. Workplace health & safety. 2017 Mar;65(3):109-17.
[86] Osman S, La Duc MT, Dekas A, Newcombe D, Venkateswaran K. Microbial burden and diversity of commercial airline cabin air during short and long durations of travel. The ISME journal. 2008;2(5):482-97.
[87] Palmgren U, Strom G, Blomquist G, Malmberg P. Collection of airborne micro-organisms on Nuclepore filters, estimation and analysis--CAMNEA method. The Journal of applied bacteriology. 1986 Nov;61(5):401-6.
[88] Perzanowski MS, Ronmark E, Nold B, Lundback B, Platts-Mills TA. Relevance of allergens from cats and dogs to asthma in the northernmost province of Sweden: schools as a major site of exposure. The Journal of allergy and clinical immunology. 1999 Jun;103(6):1018-24.
[89] Pukkala E, Aspholm R, Auvinen A, Eliasch H, Gundestrup M, Haldorsen T, et al. Cancer incidence among 10,211 airline pilots: a Nordic study. Aviation, space, and environmental medicine. 2003 Jul;74(7):699-706.
[90] Rasmussen F, Hancox RJ. Mechanisms of obesity in asthma. Current opinion in allergy and clinical immunology. 2014 Feb;14(1):35-43.

76
[91] Reis C, Mestre C, Canhao H, Gradwell D, Paiva T. Sleep and Fatigue Differences in the Two Most Common Types of Commercial Flight Operations. Aerospace medicine and human performance. 2016 Sep;87(9):811-5.
[92] Reis C, Mestre C, Canhao H, Gradwell D, Paiva T. Sleep complaints and fatigue of airline pilots. Sleep Science (Sao Paulo, Brazil). 2016 Apr-Jun;9(2):73-7.
[93] Richardson CG, Ratner PA. Sense of coherence as a moderator of the effects of stressful life events on health. Journal of epidemiology and community health. 2005;59(11):979-84.
[94] Rosenberger W, Beckmann B, Wrbitzky R. Airborne aldehydes in cabin-air of commercial aircraft: Measurement by HPLC with UV absorbance detection of 2,4-dinitrophenylhydrazones. Journal of chromatography B, Analytical technologies in the biomedical and life sciences. 2016 Apr 15;1019:117-27.
[95] Runeson-Broberg R, Lindgren T, Norback D. Musculoskeletal symptoms and psychosocial work environment, among Swedish commercial pilots. International archives of occupational and environmental health. 2014 Oct;87(7):685-93.
[96] Runeson-Broberg R, Norback D. Work-related psychosocial stress as a risk factor for asthma, allergy, and respiratory infections in the Swedish workforce. Psychological reports. 2014 Apr;114(2):377-89.
[97] Runeson R, Lindgren T, Wahlstedt K. Sleep problems and psychosocial work environment among Swedish commercial pilots. American journal of industrial medicine. 2011 Jul;54(7):545-51.
[98] Runeson R, Wahlstedt K, Wieslander G, Norback D. Personal and psychosocial factors and symptoms compatible with sick building syndrome in the Swedish workforce. Indoor air. 2006 Dec;16(6):445-53.
[99] Sahlberg B, Gunnbjornsdottir M, Soon A, Jogi R, Gislason T, Wieslander G, et al. Airborne molds and bacteria, microbial volatile organic compounds (MVOC), plasticizers and formaldehyde in dwellings in three North European cities in relation to sick building syndrome (SBS). The Science of the total environment. 2013 Feb 1;444:433-40.
[100] Sahlberg B, Mi YH, Norback D. Indoor environment in dwellings, asthma, allergies, and sick building syndrome in the Swedish population: a longitudinal cohort study from 1989 to 1997. International archives of occupational and environmental health. 2009 Nov;82(10):1211-8.
[101] Sahlberg B, Norback D, Wieslander G, Gislason T, Janson C. Onset of mucosal, dermal, and general symptoms in relation to biomarkers and exposures in the dwelling: a cohort study from 1992 to 2002. Indoor air. 2012 Aug;22(4):331-8.

77
[102] Sahlberg B, Wieslander G, Norback D. Sick building syndrome in relation to domestic exposure in Sweden--a cohort study from 1991 to 2001. Scandinavian journal of public health. 2010 May;38(3):232-8.
[103] Sallinen M, Sihvola M, Puttonen S, Ketola K, Tuori A, Harma M, et al. Sleep, alertness and alertness management among commercial airline pilots on short-haul and long-haul flights. Accident; analysis and prevention. 2017 Jan;98:320-9.
[104] Sanne B, Torp S, Mykletun A, Dahl AA. The Swedish Demand-Control-Support Questionnaire (DCSQ): factor structure, item analyses, and internal consistency in a large population. Scandinavian journal of public health. 2005;33(3):166-74.
[105] Schleibinger H, Laussmann D, Bornehag CG, Eis D, Rueden H. Microbial volatile organic compounds in the air of moldy and mold-free indoor environments. Indoor air. 2008 Apr;18(2):113-24.
[106] Schumann A, Hapke U, Meyer C, Rumpf HJ, John U. Measuring sense of coherence with only three items: a useful tool for population surveys. British journal of health psychology. 2003 Nov;8(Pt 4):409-21.
[107] Schütte S, Chastang J-F, Parent-Thirion A, Vermeylen G, Niedhammer I. Social differences in self-reported health among men and women in 31 countries in Europe. Scandinavian journal of public health. 2013;41(1):51-7.
[108] Simoni M, Cai GH, Norback D, Annesi-Maesano I, Lavaud F, Sigsgaard T, et al. Total viable molds and fungal DNA in classrooms and association with respiratory health and pulmonary function of European schoolchildren. Pediatric allergy and immunology : official publication of the European Society of Pediatric Allergy and Immunology. 2011 Dec;22(8):843-52.
[109] Smedje G, Norback D. Incidence of asthma diagnosis and self-reported allergy in relation to the school environment--a four-year follow-up study in schoolchildren. The international journal of tuberculosis and lung disease : the official journal of the International Union against Tuberculosis and Lung Disease. 2001 Nov;5(11):1059-66.
[110] Smedje G, Norback D. Irritants and allergens at school in relation to furnishings and cleaning. Indoor air. 2001 Jun;11(2):127-33.
[111] Solbu K, Daae HL, Olsen R, Thorud S, Ellingsen DG, Lindgren T, et al. Organophosphates in aircraft cabin and cockpit air--method development and measurements of contaminants. Journal of environmental monitoring : JEM. 2011 May;13(5):1393-403.
[112] Stenberg B, Wall S. Why do women report 'sick building symptoms' more often than men? Social science & medicine (1982). 1995 Feb;40(4):491-502.
[113] Strid A, Smedje G, Athanassiadis I, Lindgren T, Lundgren H, Jakobsson K, et al. Brominated flame retardant exposure of aircraft personnel. Chemosphere. 2014 Dec;116:83-90.
78
[114] Takaoka M, Norback D. The home environment of Japanese female university students-association with respiratory health and allergy. Indoor and Built Environment. 2011;20(3):369-76.
[115] Taloyan M, Leineweber C, Hyde M, Westerlund H. Self-rated health amongst male and female employees in Sweden: a nationally representative study. International archives of occupational and environmental health. 2015 Oct;88(7):849-59.
[116] The International Air Transport Association. IATA Annual review 2016. 2016 [cited; Available from: http://www.iata.org/publications/Pages/annual-review.aspx
[117] Theorell T, Michelsen H, R. N. Validity testing of indices psychological demands, decision latitude (intellectual descretion and authority over decisions), positive factors (= social support at work), sleep disturbance and covert and open coping. (In Swedish). Stockholm.: Arbetsmiljöinstitutet. 1993.
[118] Toren K, Gislason T, Omenaas E, Jogi R, Forsberg B, Nystrom L, et al. A prospective study of asthma incidence and its predictors: the RHINE study. The European respiratory journal. 2004 Dec;24(6):942-6.
[119] Toren K, Hermansson BA. Incidence rate of adult-onset asthma in relation to age, sex, atopy and smoking: a Swedish population-based study of 15813 adults. The international journal of tuberculosis and lung disease : the official journal of the International Union against Tuberculosis and Lung Disease. 1999 Mar;3(3):192-7.
[120] UK Civil Aviation Authority. 2017 [cited; Available from: www.caa.co.uk
[121] Urakawa K, Yokoyama K, Itoh H. Sense of coherence is associated with reduced psychological responses to job stressors among Japanese factory workers. BMC research notes. 2012;5(1):1.
[122] van Drongelen A, Boot CR, Hlobil H, Smid T, van der Beek AJ. Risk factors for fatigue among airline pilots. International archives of occupational and environmental health. 2017 Jan;90(1):39-47.
[123] van Netten C. Analysis and implications of aircraft disinsectants. The Science of the total environment. 2002 Jul 03;293(1-3):257-62.
[124] van Netten C, Leung V. Hydraulic fluids and jet engine oil: pyrolysis and aircraft air quality. Arch Environ Health. 2001 Mar-Apr;56(2):181-6.
[125] Wahlstedt K, Edling, C. Psychosocial factors and psychosomatic complaints among postal workers,. The European Journal of Public Health. 1994;4(1):60-4.
[126] Wahlstedt K, Edling, C. . Organizational changes at a postal sorting terminal - their effects upon work satisfaction, psychosomatic complaints and sick leave. Work & Stress. 1997;11(3):279-91.
[127] Walinder R, Norback D, Wessen B, Venge P. Nasal lavage biomarkers: effects of water damage and microbial growth in an office building. Arch Environ Health. 2001 Jan-Feb;56(1):30-6.

79
[128] Wang J, Engvall K, Smedje G, Nilsson H, Norback D. Current wheeze, asthma, respiratory infections, and rhinitis among adults in relation to inspection data and indoor measurements in single-family houses in Sweden-The BETSI study. Indoor air. 2016 Dec 22.
[129] Wang J, Engvall K, Smedje G, Norback D. Rhinitis, asthma and respiratory infections among adults in relation to the home environment in multi-family buildings in Sweden. PloS one. 2014;9(8):e105125.
[130] Weisel C, Weschler CJ, Mohan K, Vallarino J, Spengler JD. Ozone and ozone byproducts in the cabins of commercial aircraft. Environmental science & technology. 2013 May 7;47(9):4711-7.
[131] Wickman M, Emenius G, Egmar AC, Axelsson G, Pershagen G. Reduced mite allergen levels in dwellings with mechanical exhaust and supply ventilation. Clinical and experimental allergy : journal of the British Society for Allergy and Clinical Immunology. 1994 Feb;24(2):109-14.
[132] Wieslander G, Kumlin A, Norback D. Dampness and 2-ethyl-1-hexanol in floor construction of rehabilitation center: Health effects in staff. Archives of environmental & occupational health. 2010 Jan-Mar;65(1):3-11.
[133] Wieslander G, Lindgren T, Norback D, Venge P. Changes in the ocular and nasal signs and symptoms of aircrews in relation to the ban on smoking on intercontinental flights. Scandinavian journal of work, environment & health. 2000 Dec;26(6):514-22.
[134] Wieslander G, Norback D, Venge P. Changes of symptoms, tear film stability and eosinophilic cationic protein in nasal lavage fluid after re-exposure to a damp office building with a history of flooding. Indoor air. 2007 Feb;17(1):19-27.
[135] Winder C, Balouet JC. The toxicity of commercial jet oils. Environmental research. 2002 Jun;89(2):146-64.
[136] World Health Organization. WHO Guidelines for Indoor Air Quality: Dampness and Mould. . 2009.
[137] World Health Organization. BMI classification. 2016 [cited; Available from: http://apps.who.int/bmi/index.jsp?introPage=intro_3.html
[138] World Health Organization. International travel and health. 2016 [cited; Available from: http://www.who.int/ith/mode_of_travel/cab/en/
[139] Yong LC, Pinkerton LE, Yiin JH, Anderson JL, Deddens JA. Mortality among a cohort of U.S. commercial airline cockpit crew. American journal of industrial medicine. 2014 Aug;57(8):906-14.
[140] Zhao ZH, Elfman L, Wang ZH, Zhang Z, Norback D. A comparative study of asthma, pollen, cat and dog allergy among pupils and allergen levels in schools in Taiyuan city, China, and Uppsala, Sweden. Indoor air. 2006 Dec;16(6):404-13.
Acta Universitatis UpsaliensisDigital Comprehensive Summaries of Uppsala Dissertationsfrom the Faculty of Medicine 1323
Editor: The Dean of the Faculty of Medicine
A doctoral dissertation from the Faculty of Medicine, UppsalaUniversity, is usually a summary of a number of papers. A fewcopies of the complete dissertation are kept at major Swedishresearch libraries, while the summary alone is distributedinternationally through the series Digital ComprehensiveSummaries of Uppsala Dissertations from the Faculty ofMedicine. (Prior to January, 2005, the series was publishedunder the title “Comprehensive Summaries of UppsalaDissertations from the Faculty of Medicine”.)
Distribution: publications.uu.seurn:nbn:se:uu:diva-318806
ACTAUNIVERSITATIS
UPSALIENSISUPPSALA
2017