Embed Size (px)
Citation preview

Itron, Inc. 1 SGIP RFU Report No. 21
Self-Generation Incentive Program Semi-Annual Renewable Fuel Use Draft Report No. 21 for the Six-Month Period Ending December 2012
1. Overview
Report Purpose
This report complies with Decision 02-09-051 (September 19, 2002) of the California Public Utilities Commission (CPUC). That decision requires Self-Generation Incentive Program1 (SGIP or Program) Program Administrators (PAs) to provide updated information every six months2 on completed SGIP projects using renewable fuel.3 The purpose of these Renewable Fuel Use (RFU) reports is to provide the Energy Division of the CPUC with the required updated renewable fuel use information. In addition, the reports help assist the Energy Division in making recommendations concerning modifications to the renewable project aspects of the SGIP. Traditionally, these reports have included updated information on project fuel use and installed costs.
1 The SGIP provides incentives to eligible utility customers for the installation of new qualifying technologies that are installed to meet all or a portion of the electric energy needs of a facility. The program is implemented by the CPUC and administered by Pacific Gas and Electric Company (PG&E), Southern California Edison (SCE) and Southern California Gas Company (SCG) in their respective territories, and the California Center for Sustainable Energy (CCSE) in San Diego Gas and Electric (SDG&E) territory.
2 Ordering Paragraph 7 of Decision 02-09-051 states: “Program administrators for the self-generation program or their consultants shall conduct on-site inspections of
projects that utilize renewable fuels to monitor compliance with the renewable fuel provisions once the projects are operational. They shall file fuel-use monitoring information every six months in the form of a report to the Commission, until further order by the Commission or Assigned Commissioner. The reports shall include a cost comparison between Level 3 and 3-R projects….”
Ordering Paragraph 9 of Decision 02-09-051 states: “Program administrators shall file the first on-site monitoring report on fuel-use within six months of the
effective date of this decision [September 19, 2002], and every six months thereafter until further notice by the Commission or Assigned Commissioner.”
3 The Decision defines renewable fuels as wind, solar, biomass, digester gas, and landfill gas. Renewable fuel use in the context of this report effectively refers to biogas fuels obtained from landfills, wastewater treatment plants, food processing facilities, and dairy anaerobic digesters.

SGIP Semi-Annual Renewable Fuel Use Report No. 21
Itron, Inc. 2 SGIP RFU Report No. 21
Due to a growing interest in the potential for renewable fuel use projects to reduce greenhouse gas (GHG) emissions,4 a section on GHG emission impacts from renewable fuel SGIP projects has been added to the reports beginning with RFU Report No. 15.
RFU Report No. 21 covers projects completed during the last six months (i.e., July 1, 2012 to December 31, 2012) as well as all renewable fuel use projects installed previously under the SGIP since the Program’s inception in 2001. Results of analysis of renewable fuel use compliance presented in this RFU Report are based on the 12 months of operation from January 1, 2012, to December 31, 2012.
RFU and RFUR Projects
The incentives and requirements for SGIP projects utilizing renewable fuel have varied throughout the life of the SGIP. In this report, assessing compliance with the Program's minimum renewable fuel use requirements is restricted to the subset of projects actually subject to those requirements (i.e., Renewable Fuel Use Requirement (RFUR) projects) by virtue of their participation year, project type designation, and warranty status.5 However, the analysis of project costs included in this report covers all projects using some renewable fuel (i.e., Renewable Fuel Use (RFU) projects). All RFUR projects are also RFU projects; however, not all RFU projects are RFUR projects. This distinction is responsible for differences in project counts in this report's tables. Differences between RFU and RFUR projects are summarized in Table 1. Similarly, Table 2 reports only on RFUR projects whereas Table 16 lists all RFU projects, including those not subject to the Program’s minimum renewable fuel use requirements (“Other RFU projects”).
4 While the SGIP was initially implemented in response to AB 970 (Ducheny, chaptered 09/07/00) primarily to reduce demand for electricity, SB 412 (Kehoe, chaptered 10/11/09) limits the eligibility for incentives pursuant to the SGIP to distributed energy resources that the CPUC, in consultation with the state board, determines will achieve reduction of greenhouse gas emissions pursuant to the California Global Warming Solutions Act of 2006.
5 The SGIP requires such projects to limit use of non-renewable fuel to 25 percent on an annual fuel energy input basis. This requirement is based on FERC definitions of qualifying small power production facilities from the original Public Utility Regulatory Policy Act (PURPA) of 1978; Subpart B; section 292.204 (Criteria for qualifying small power production facilities).

SGIP Semi-Annual Renewable Fuel Use Report No. 21
Itron, Inc. 3 SGIP RFU Report No. 21
Table 1: Summary of RFU vs. RFUR Parameters
Parameter
RFU
“Other” RFU6,7 RFUR
Annual Renewable Fuel Use 0 – 100% 75% - 100%
Heat Recovery Required Not Required
Incentive Level Same as non-renewable projects
Higher than non-renewable projects
No. of Projects 8 116 Directed Biogas Projects
In CPUC Decision 09-09-048 (September 24, 2009), eligibility for RFUR incentives was expanded to include “directed biogas” projects. Deemed to be renewable fuel use projects, directed biogas projects are eligible for higher incentives under the SGIP, and subject to the fuel use requirements of renewable fuel use projects. Directed biogas projects purchase biogas fuel that is produced at another location than the project site. The procured biogas is processed, cleaned-up, and injected into a natural gas pipeline for distribution. Although the purchased biogas is not likely to be delivered and used at the SGIP renewable fuel project, the SGIP project using the directed biogas is credited with renewable fuel use. In turn, the project and the SGIP in general benefit from GHG emission reductions associated with the overall use of biogas resources. The relative positions of key parties to directed biogas transactions are depicted graphically in Figure 1.
6 The number of “Other” RFU projects increased from eight to nine in RFU Report No. 19 due to the completion of SCE project PY10-003. This project was completed in December of 2010 but was not included in RFU Reports Nos. 17 and 18. The project was initially listed as non-renewable only but examination of metered data revealed the presence of renewable fuel.
7 The number of “Other” RFU projects decreased from nine to eight in RFU Report No. 21 due to the completion of SCE project 2011-0334. This project was completed in November 2012 as a change for SCE project PY10-003 from level 3 to level 2. To properly account for this project’s change in level, SCE project PY10-003 was removed from this report.

SGIP Semi-Annual Renewable Fuel Use Report No. 21
Itron, Inc. 4 SGIP RFU Report No. 21
Figure 1: Schematic Depiction of Directed Biogas Arrangement
RFU Report No. 17 marked the first appearance of completed directed biogas projects under the SGIP. Each project is equipped with an on-site supply of utility-delivered natural gas. As such, the directed biogas is not literally delivered, but notionally delivered, as the biogas may actually be utilized at any other location along the pipeline route. Forty six directed biogas projects have been operational for at least one full calendar year and therefore are required to be in compliance with renewable fuel use requirements.
A description of the compliance methodology for dual-fueled and directed biogas projects is provided later in this report.
Summary of RFU Draft Report No. 21 Findings
The following bullets represent a summary of key findings from this report:
As of December 31, 2012, there were 124 RFU facilities deployed under the SGIP, representing approximately 59.7 megawatts (MW) of rebated capacity. One hundred and sixteen of these facilities were RFUR projects and represented approximately 55.9 MW

SGIP Semi-Annual Renewable Fuel Use Report No. 21
Itron, Inc. 5 SGIP RFU Report No. 21
of rebated capacity. The remaining eight “Other” RFU projects represented approximately 3.8 MW of rebated capacity.
RFU Report No. 21 marks the fifth appearance of completed SGIP projects utilizing directed biogas. Five of the seven RFUR projects added during the second half of 2012 were natural gas fuel cells that fulfill renewable fuel use requirements via purchase of directed biogas that is produced off-site.
Of the 116 RFUR projects, 38 (33 percent) operated solely from on-site renewable fuels and as such inherently comply with renewable fuel use requirements. Of the remaining 78 dual-fuel RFUR facilities:
Six were found to be in compliance with renewable fuel use requirements,
Forty one (52 percent) were directed biogas projects that could not have their compliance determined due to either a lack of information or because unexpected complications were uncovered during the audit process that require resolution before future RFU Reports can report on the compliance of these projects,
Eight were found to be out of compliance,
Twenty three were found not subject to reporting and compliance requirements
- Six were out of contract and as such were no longer subject to reporting and compliance requirements,
- Seventeen were found not to be applicable with respect to the requirements as they have not yet been operational for a full year.
Consequently, of the 93 RFUR projects that were subject to the renewable fuel use requirements, 44 (47 percent) were found to be in compliance; 8 (9 percent) were found to be out of compliance and for 41 (44 percent) compliance could not be determined.
RFU facilities are powered by a variety of renewable fuel (i.e., biogas) resources. However, approximately 76 percent of the rebated capacity of RFU facilities deployed through December 31, 2012, were powered by biogas derived from landfills or wastewater treatment facilities.
Prime movers used at RFUR facilities include fuel cells, microturbines, and internal combustion (IC) engines. Historically, IC engines have been the dominant prime mover technology of choice at RFUR facilities. Starting in 2010, there was an upsurge in directed biogas projects using fuel cells as the prime mover. As a result, IC engines have as of this reporting period been surpassed by fuel cells as the dominant prime mover technology, but remain the dominate prime mover for on-site biogas applications. Fuel cells provide approximately 38.1 MW (about 68 percent) of the overall 55.9 MW of rebated RFUR capacity. IC engines provided 13.8 MW (about 27 percent of all RFUR capacity).

SGIP Semi-Annual Renewable Fuel Use Report No. 21
Itron, Inc. 6 SGIP RFU Report No. 21
Based on samples of costs of RFU facilities, the average costs of renewable projects appeared to be higher than the average costs of non-renewable projects. However, limited and highly variable cost data prevent the conclusion that there is a 90 percent certainty that the mean cost of renewable-powered fuel cells and IC engines is higher than the mean cost of fuel cells and IC engines powered by non-renewable resources. In the case of fuel cells, other factors such as system size and fuel cell chemistry confound sample comparisons.
RFU facilities have considerable potential for reducing GHG emissions. The magnitude of the GHG emission reduction depends largely on the manner in which the biogas would have been treated in the absence of the program (i.e., the “baseline” condition). RFU facilities that would have been venting biogas directly to the atmosphere have a much higher GHG emission reduction potential than RFU facilities that would have been required to capture and flare biogas.8
In general, RFU facilities for which flaring biogas was the baseline condition decreased GHG emissions by around 0.4 tons of carbon dioxide equivalent (CO2eq) per megawatt-hour (MWh) of generated electricity.
Conversely, the GHG emission reduction potential for RFU facilities for which venting biogas was the baseline condition is around five (5) tons of CO2(eq) per MWh of generated electricity; an order of magnitude greater in GHG emission reduction potential.
Potential for GHG emission reductions from RFU facilities may also be affected by the use of waste heat recovery at the RFU facility. In general, RFU facilities that use waste heat recovery increase the potential for GHG emission reduction if natural gas would otherwise have been used to generate process heat.
Conclusions and Recommendations
In accordance with the original 02-09-051 CPUC decision in September 2002, a primary purpose of the renewable fuel use reports is to identify if projects receiving increased incentives for being renewably fueled are in compliance with the renewable fuel use requirements. Compliance findings could be made for 56 percent of the projects subject to renewable fuel use requirements. For the remaining 44 percent of the projects subject to the requirements, unexpected difficulties in obtaining necessary information prevented us from making a compliance finding.
8 Biogas which is vented to the atmosphere has a significant amount of methane. Methane is a very powerful GHG compound with approximately 21 times the GHG impact of CO2.

SGIP Semi-Annual Renewable Fuel Use Report No. 21
Itron, Inc. 7 SGIP RFU Report No. 21
We also note that there in a small but significant number of on-site biogas projects that are repeatedly out of compliance. It was beyond the scope of the RFUR to investigate reasons why projects failed to comply or if they are capable of meeting the requirements. However, as on-site biogas projects may be an important source of GHG emission reductions in the future, there may be value in learning why these projects are out of compliance.
For the 44 percent of projects for which we could not determine compliance, we found there to be unexpected complications in identifying and obtaining clear information in the time needed to assess compliance of directed biogas projects. Specific sources of the difficulties include:
The need for new methods for identifying and obtaining information required to make a compliance determination,
Timeframes for the delivery of documentation that is in line with the SGIP’s reporting requirements, and
Development of new methods for reconciling differences between information provided by gas marketers, project participants, and gas companies.9
Issues associated with compliance findings are most commonly associated with directed biogas projects. Typically, information on the amount of directed biogas supplied to any particular RFU or RFUR project is based on invoices instead of metered gas flow data. Use of invoices to track gas delivery and receipt is more complicated than use of metered gas flow data and subject to greater uncertainties. In addition, invoices and gas transportation validation data in many instances have not been reported in time to make a compliance assessment. Lastly, where there have been differences in information on gas deliveries and receipts provided by different sources, there were no methods for resolving the differences in a timely and clear fashion. Methods established early on for collecting and reconciling information needed to be adjusted as the amount and complexity of the data needs became more apparent. As a result of these unexpected complications, there were delays in obtaining needed compliance information.
In light of these conclusions, we make the following recommendations:
9 Issues encountered during the compliance assessment of directed biogas projects include: 1) Established methods for identifying all points of directed biogas receipt and delivery along the transportation network, including the landfill source(s) and utility receipt locations were not robust enough to identify the necessary information. The evolving nature of new methods led to delays early on in requesting and obtaining necessary information on directed biogas deliveries, 2) Methods for confirming receipts of gas delivery into California need improvement, 3) There were delays in establishing new methods for auditing directed biogas deliveries for fuel cells on a fleet versus individual projects basis, and 4) There were errors and omissions in fuel supplier invoice documentation and utility gas consumption records. The need to develop more robust methods for handling discrepancies between fuel supplier invoices and utility gas consumption documentation led to delays in reconciling differences.

SGIP Semi-Annual Renewable Fuel Use Report No. 21
Itron, Inc. 8 SGIP RFU Report No. 21
Expand Scope to Investigate Reasons for Non-compliance
This report marks the seventh consecutive occurrence of non-compliance with renewable fuel use requirements. While some of these instances of non-compliance are due to projects occasionally falling below the minimum renewable fuel limit, some projects are consistently out of compliance. In RFUR #20, we recommended further investigation into the reasons why certain projects are consistently not in compliance with the SGIP standards. We continue to recommend that further study be conducted into projects that are consistently out of compliance as this information could potentially be useful to ensure higher levels of compliance in the future.
Continue to Clarify and Define Protocols to Assess Compliance of Directed Biogas projects
As indicated in the summary bullets, over 50 percent of the RFUR projects assessed in RFUR #21 were directed biogas projects with untimely and/or insufficient information upon which to assess compliance. To resolve these issues, we recommend the following actions be taken well in advance of the next RFUR so as to allow compliance determinations be made in the report:
1. Further define protocols that identify the directed biogas receipt and delivery information necessary to adequately determine and verify directed biogas transportation from source to the California city gate; the parties responsible for supplying the information and the processes to be followed in providing the data to the CPUC or its contractor. These protocols should be reviewed by all involved parties to ensure the protocols’ methods are reasonable and can be implemented. In the event the information is viewed as proprietary or confidential, the protocols should provide for use of non-disclosure agreements that enable delivery of the information and enable compliance determinations that safeguard the confidential or proprietary information.
2. Establish timeframes for expeditious delivery of the directed biogas receipt and delivery information needed to make compliance findings. The established timeframes should provide clear and specific deadlines for each of the parties involved in providing the necessary information and be based on deadlines associate with filing of the draft and final Renewable Fuel Use reports.
3. Establish protocols for reconciling differences in information provided by gas marketers, project participants, and gas companies. These protocols should be reviewed by all involved parties to ensure the methods are reasonable and can be implemented.
.

SGIP Semi-Annual Renewable Fuel Use Report No. 21
Itron, Inc. 9 SGIP RFU Report No. 21
Project Capacity, Fuel Types, and Prime Mover Technology
The capacity of RFUR and Other RFU projects, and the combined total (RFU projects) covered by each RFU Report is depicted graphically in Figure 2.
Figure 2: Project Capacity Trend (RFU Reports 1–21)
While all RFUR projects are allowed to use as much as 25 percent non-renewable fuel, 33 percent (by project count) of RFUR projects operate completely from on-site renewable fuel resources. Up to and including RFU Report No. 12, there had been no instances where available data indicated non-compliance with the Program’s renewable fuel use requirements. However, note that prior to RFU Report No. 13 some data were not available to evaluate compliance of all dual-fuel projects. The current report contains eight instances of non-compliance with these requirements. Figure 3 shows the history of compliance back to RFU Report No. 13 for all projects that were subject to the renewable fuel use requirement when the respective report was written.

SGIP Semi-Annual Renewable Fuel Use Report No. 21
Itron, Inc. 10 SGIP RFU Report No. 21
Figure 3: History of Compliance with RFU Requirement
* This figure contains information limited to systems that are subject to the renewable fuel use requirement – systems under warranty and operational for at least one calendar year during each RFU Report’s specific reporting period. Other systems are excluded from this figure.
** No data label is drawn when n=1
RFU projects typically use biogas derived from landfills or anaerobic digestion processes that convert biological matter to a renewable fuel source. Anaerobic digesters are used at dairies, wastewater treatment plants, or food processing facilities to convert wastes from these facilities to biogas. Figure 4 shows a breakout of RFU projects as of December 31, 2012, by source of biogas (e.g., landfill gas, dairy digester gas, food processing digester gas) on a rebated capacity basis. It illustrates that the majority of biogas used in SGIP RFU projects is derived from landfills and wastewater treatment plants, with 40 and 36 percent, respectively. The recently completed directed biogas projects have noticeably increased the proportion of projects using landfill gas. Dairy digesters provide the smallest contribution at two percent of the total rebated RFU project capacity.

SGIP Semi-Annual Renewable Fuel Use Report No. 21
Itron, Inc. 11 SGIP RFU Report No. 21
Figure 4: Renewable Fuel Use Project Rebated Capacity by Fuel Type
LFG = landfill gas; WWTP = wastewater treatment plants; DG=digester gas
Figure 5 provides a breakdown of the relative contribution of the different biogas fuels by prime mover technology. Several observations can be made from examining Figure 5. Fuel cells and IC engines are the dominant technologies with 65 and 26 percent of rebated capacity, respectively. RFU Report No. 21 marks the fifth appearance of directed biogas projects installed under the SGIP; many of these projects are fuel cells utilizing directed biogas sourced from landfills. These directed biogas projects have increased the prominence of fuel cells as a prime mover technology.

SGIP Semi-Annual Renewable Fuel Use Report No. 21
Itron, Inc. 12 SGIP RFU Report No. 21
Figure 5: Contribution of Biogas Fuel Type by Prime Mover Technology
LFG = landfill gas; WWTP = wastewater treatment plants; MT = micro-turbines; ICE = internal combustion engine; FC = fuel cells; DG = digester gas
Cost Data
Itron also analyzed project cost data available for the renewable and non-renewable SGIP projects completed to date. Average costs of renewable projects were higher than the average costs of non-renewable projects – however the combined influence of relatively small sample sizes and substantial variability preclude us from estimating incremental costs for future SGIP participants that are accurate enough to be used directly for program incentive design purposes.
Confidence intervals estimated for the entire population of SGIP participants (both past and future) are very large. There was a limited quantity of cost data for fuel cells and IC engines. This limited amount of data increases the uncertainty associated with estimates of population mean costs of fuel cells and IC engines. As a result, it is impossible to say with 90 percent confidence that the population mean costs of renewable IC engines and fuel cells are any higher than the population mean costs of non-renewable IC engines and fuel cells.10 This lack of
10 As per the original ALJ ruling in 2002, these costs only include prime mover and gas clean-up costs, and do not include any capital costs associated with equipment needed to generate the renewable fuel (e.g., digester cost).

SGIP Semi-Annual Renewable Fuel Use Report No. 21
Itron, Inc. 13 SGIP RFU Report No. 21
confidence suggests that data for past projects should not be used as the sole basis for SGIP design elements affecting future participants. Engineering estimates, budget cost data, and rules-of-thumb likely continue to be more suitable for this purpose at this time.
2. Summary of Completed RFUR Projects
There were seven new RFUR SGIP projects completed during the subject six-month reporting period. All of the recently completed projects were fuel cells ranging in size from 250 kW to 1,400 kW. A total of 116 RFUR projects had been completed as of December 31, 2012. A list of all SGIP projects utilizing renewable fuel (RFUR and Other RFU) is included as Appendix A.
The 116 completed RFUR projects represent approximately 55.9 MW of rebated generating capacity. The prime mover technologies used by these projects are summarized in Table 2. Fuel cells and IC engines together account for almost 93 percent of RFUR rebated capacity, with microturbines making up the remaining 7 percent. The average sizes of fuel cell and IC engine projects are two to three times as large as the average microturbine project size.
Table 2: Summary of Prime Movers for RFUR Projects
Prime Mover Num. of Projects Total Rebated Capacity (kW)
Average Rebated Capacity Per Project (kW)*
FC 73 38,085 522 ICE 24 13,846 577 MT 19 3,970 209
Total 116 55,901 482
FC = fuel cell; MT = micro-turbine; ICE = internal combustion engine * Represents an arithmetic average
Many of the RFUR projects recover waste heat even though they are exempt from heat recovery requirements. Waste heat recovery incidence by renewable fuel type is summarized in Table 3. Verification inspection reports obtained from PAs and information from secondary sources such as direct contact with the participant, technical journals, industry periodicals, and news articles indicate that 42 of the 116 RFUR projects recover waste heat. All but three of the 41 on-site digester gas systems include waste heat recovery.11 Waste heat recovered from digester gas systems is generally used to pre-heat waste water sludge prior to being pumped to digester tanks. Conversely, 4 of 15 on-site landfill gas systems include waste heat recovery. In addition, those
11 In several RFU Reports up to and including RFU Report No. 15 three (3) projects were incorrectly reported as not including heat recovery. This error resulted from misinterpretation of contents of Installation Verification Inspection Reports.

SGIP Semi-Annual Renewable Fuel Use Report No. 21
Itron, Inc. 14 SGIP RFU Report No. 21
landfill gas systems that do recover heat do not use it directly at the landfill site. Instead, the landfill gas is piped to an adjacent site that has both electric and thermal loads, and the gas is used in a prime mover at that site.12 None of the 60 completed directed biogas projects include waste heat recovery.
Table 3: Summary of Waste Heat Recovery Incidence by Type of Renewable Fuel for RFUR Projects
Renewable Fuel Source(Type) Total No. of Sites
Sites With Heat Recovery
Sites Without Heat Recovery13
Digester Gas 41 38 3 Digester Gas (Directed) 2 0 2 Landfill Gas 15 4 11 Landfill Gas (Directed) 38 0 38 TBD (Directed) 20 0 20 Total 116 42 74
Figure 6 shows the total renewable fuel capacity for each year by technology. The peak project year for internal combustion engines was 2006 for a total capacity of 5.2 MW. Fuel cells were by far the most common renewable fuel projects introduced in 2011 and 2012 with over 30 MW of rebated capacity completed in both years.14
12 In general, above-ground digesters have a built-in thermal load as they operate better if heated. Landfill gas and covered lagoon operations do not typically use recovered waste heat to increase the rate of the anaerobic digestion process.
13 It is important to recognize that directed biogas fuel cell systems provided by Bloom Energy under the SGIP are specifically designed not to provide useful waste heat to the host site. Instead, useful waste heat is recovered and used within the fuel cell to improve electrical efficiency to high levels.
14 Note that CHP systems were ineligible to receive incentives under the SGIP in 2007 and it was not until 2011 that CHP was reinstituted as an eligible technology under the program.

SGIP Semi-Annual Renewable Fuel Use Report No. 21
Itron, Inc. 15 SGIP RFU Report No. 21
Figure 6: Rebated RFUR Capacity by Technology and Project Completion Year
3. Fuel Use at RFUR Projects
RFUR projects are allowed to use a maximum of 25 percent non-renewable fuel; the remaining 75 percent must be renewable fuel. The period during which RFUR projects are obliged to comply with this requirement is specified in the SGIP contracts between the host customer, the system owner, and the PAs. Specifically, this compliance period is the same as the equipment warranty requirement. For PY01-PY10 applications, microturbine and IC engine systems must be covered by a warranty of not less than three years. Fuel cell systems must be covered by a minimum five-year warranty. For PY11 projects, all generation systems must have a minimum 10 year warranty.15 Therefore, the fuel use requirement period is three, five, or ten years, depending on the technology type and program year. The SGIP applicant must provide warranty (and/or maintenance contract) start and end dates in the Reservation Confirmation and Incentive Claim Form.
15 No such projects applying to the program in 2012 have been completed yet.

SGIP Semi-Annual Renewable Fuel Use Report No. 21
Itron, Inc. 16 SGIP RFU Report No. 21
Facilities are grouped into three categories in assessing renewable fuel use compliance:
“Dedicated” RFU facilities located where biogas is produced (e.g., wastewater treatment facilities, landfill gas recovery operations) and the biogas is the only fuel source used for powering the RFU system;
“Blended” RFU facilities located where biogas is produced that use a blend of biogas and non-renewable fuel (e.g., natural gas); and
“Directed” RFU facilities, located somewhere other than where biogas is produced and not necessarily directly receiving any of the biogas.
For the 38 RFUR facilities where biogas was produced and acted as the only fuel source for the RFUR system, the facility was automatically in compliance. For dual-fueled RFUR facilities using both renewable and non-renewable fuel, assessing compliance requires information on the amount of biogas consumed relative to the amount of non-renewable fuel consumed on-site. It is not possible to use the same method in assessing compliance of directed biogas projects as that used for assessing compliance of “blended” RFUR projects. In “blended” RFUR projects using biogas produced on-site, the metered amount of non-renewable fuel is used to determine if it is less than or equal to 25% of the total annual energy input to the RFUR facility. However, in directed biogas RFUR projects, metering of SGIP systems captures total fuel use only; it provides no information on how much biogas was actually produced and allocated to the project.
Assessing compliance of directed biogas projects requires information about off-site biogas production, transportation, and subsequent allocation to customers that may or may not be SGIP participants. The left side of Figure 7 depicts the injection of biogas into the natural gas transportation and delivery system. The right side depicts the extraction of natural gas from the system and allocation to specific customers. On an energy content basis injections and extractions depicted in Figure 7 must be in balance.

SGIP Semi-Annual Renewable Fuel Use Report No. 21
Itron, Inc. 17 SGIP RFU Report No. 21
Figure 7: Parties to Notional Deliveries of Directed Biogas
Specification of the approach used to assess the balance of injections and extractions is dictated by the properties of transactions at the two points. These properties are summarized in Table 4. The properties at the extraction point represent a significant departure from conditions encountered to date for Dedicated and Blended RFU facilities. Specifically, at the extraction point the transaction type is notional rather than physical, and information is obtained from invoices rather than metering. To assess the system’s balance and thereby enable accurate assessment of the role of SGIP specifically in increasing overall biogas production and consumption, complete information for injections and extractions is required.
Table 4: Properties of Directed Biogas Injection and Extraction
Property At Injection At Extraction Carrier for renewable fuel Biogas Natural gas Transaction type Physical Notional Information source Metering Invoices
The properties of directed biogas injection and extraction have a direct bearing on information needed to assess renewable fuel use compliance of directed biogas projects. In this report, compliance of these projects was assessed by verifying that quantities of biogas shown in invoices were transported to California and comparing a project’s total metered natural gas consumption data to the biogas amount purchased as shown by invoices.
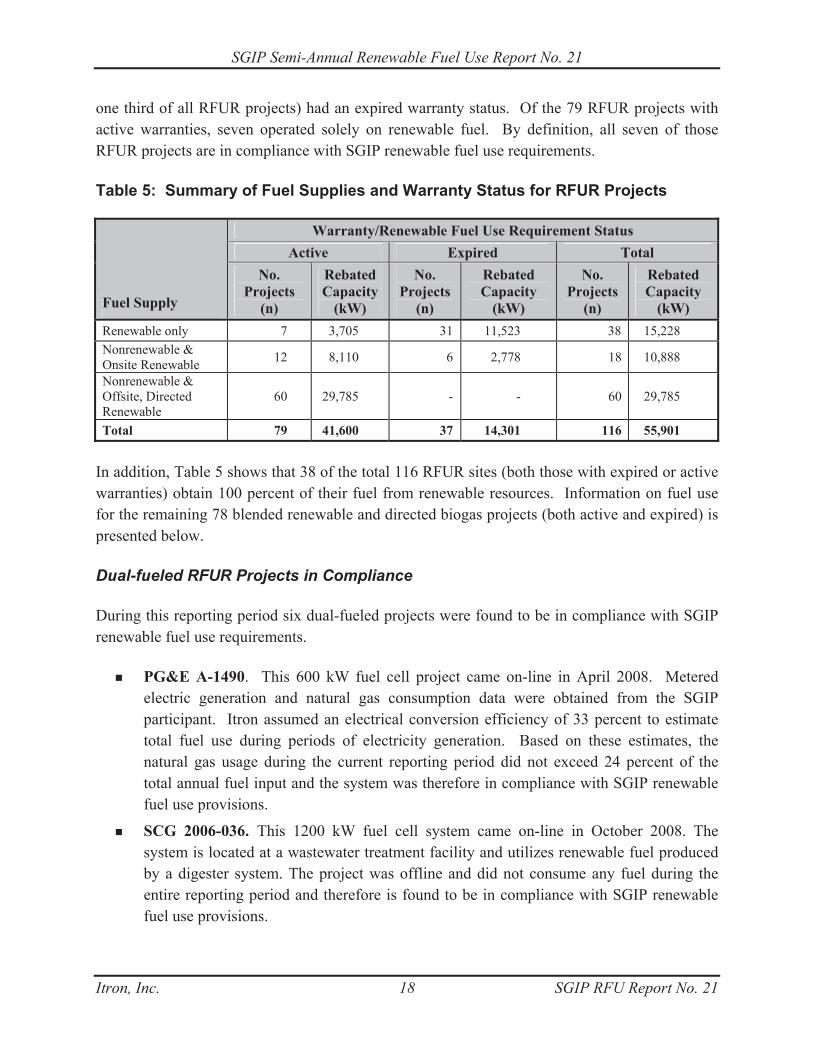
Fuel supply and contract status for RFUR projects are summarized in Table 5. Seventy-nine of the total 116 RFUR projects had active warranty status. Thirty-seven RFUR projects (almost
SGIP Semi-Annual Renewable Fuel Use Report No. 21
Itron, Inc. 18 SGIP RFU Report No. 21
one third of all RFUR projects) had an expired warranty status. Of the 79 RFUR projects with active warranties, seven operated solely on renewable fuel. By definition, all seven of those RFUR projects are in compliance with SGIP renewable fuel use requirements.
Table 5: Summary of Fuel Supplies and Warranty Status for RFUR Projects
Fuel Supply
Warranty/Renewable Fuel Use Requirement Status Active Expired Total
No. Projects
(n)
Rebated Capacity
(kW)
No. Projects
(n)
Rebated Capacity
(kW)
No. Projects
(n)
Rebated Capacity
(kW) Renewable only 7 3,705 31 11,523 38 15,228 Nonrenewable & Onsite Renewable 12 8,110 6 2,778 18 10,888
Nonrenewable & Offsite, Directed Renewable
60 29,785 - - 60 29,785
Total 79 41,600 37 14,301 116 55,901
In addition, Table 5 shows that 38 of the total 116 RFUR sites (both those with expired or active warranties) obtain 100 percent of their fuel from renewable resources. Information on fuel use for the remaining 78 blended renewable and directed biogas projects (both active and expired) is presented below.
Dual-fueled RFUR Projects in Compliance
During this reporting period six dual-fueled projects were found to be in compliance with SGIP renewable fuel use requirements.
PG&E A-1490. This 600 kW fuel cell project came on-line in April 2008. Metered electric generation and natural gas consumption data were obtained from the SGIP participant. Itron assumed an electrical conversion efficiency of 33 percent to estimate total fuel use during periods of electricity generation. Based on these estimates, the natural gas usage during the current reporting period did not exceed 24 percent of the total annual fuel input and the system was therefore in compliance with SGIP renewable fuel use provisions.
SCG 2006-036. This 1200 kW fuel cell system came on-line in October 2008. The system is located at a wastewater treatment facility and utilizes renewable fuel produced by a digester system. The project was offline and did not consume any fuel during the entire reporting period and therefore is found to be in compliance with SGIP renewable fuel use provisions.

SGIP Semi-Annual Renewable Fuel Use Report No. 21
Itron, Inc. 19 SGIP RFU Report No. 21
SCG 2006-012. This 900 kW fuel cell project came on-line in December 2009 and consists of three 300 kW fuel cells. The system is located at a wastewater treatment facility and utilizes renewable fuel produced from two digesters and natural gas from SCG. These digesters are provided sewage sludge and fat, oil, and grease as feedstock. The fat, oil, and grease feedstock comes from local restaurants and is supplied by a vendor under a contractual agreement. No description of how or when natural gas is used by this system was included in SCG’s installation verification inspection report. Itron received metered electric generation and natural gas consumption data from the SGIP participant. Itron assumed an electrical conversion efficiency to estimate total fuel use during periods of electricity generation. Based on these estimates, the natural gas usage during the current reporting period did not exceed 24 percent. The system was in compliance with SGIP renewable fuel use provisions for this reporting period.
CCSE-0351-07. This 560 kW IC engine system came on-line in April 2010. The system is located at a waste water treatment facility and utilizes the anaerobic digester gas from five digesters on-site to provide base load electric power to the treatment facility. When sufficient digester gas is not available to run this system at full load, natural gas is mixed in. Electrical output and natural gas consumption data are being collected by the host customer and were provided to Itron. Itron assumed an electrical conversion efficiency to estimate total fuel use during periods of electricity generation. Based on these estimates, the natural gas usage during the reporting period did not exceed 23 percent of the total energy consumed. The project was in compliance with SGIP renewable fuel use provisions for this reporting period.
PG&E 1802. This 400 kW fuel cell project utilizes directed biogas from a landfill and natural gas. The system became operational in December 2010 and therefore is required to comply with SGIP renewable fuel use requirements. Itron has obtained directed biogas invoices and allocation/imbalance reports from the gas marketer. Itron also collected electrical generation and natural gas consumption data from the manufacturer. Based on a review of the data and documentation, the natural gas usage during the current reporting period did not exceed 24 percent. This project is found to be in compliance with SGIP renewable fuel use provisions for this reporting period.
PG&E 1874. This 500 kW fuel cell project utilizes directed biogas from a landfill and natural gas. The system became operational in September 2011 and therefore is required to comply with SGIP renewable fuel use requirements. Itron has obtained directed biogas invoices and allocation/imbalance reports from the gas marketer for the twelve month period ending September 2012 (the reporting period for this project’s first directed biogas audit). Itron also collected electrical generation and natural gas consumption data from the manufacturer for the same period. Based on a review of the data and documentation, the natural gas usage did not exceed 10 percent. This project is found to be in compliance

SGIP Semi-Annual Renewable Fuel Use Report No. 21
Itron, Inc. 20 SGIP RFU Report No. 21
with SGIP renewable fuel use provisions for this reporting period based on the findings of the directed biogas audit for the one year period ending September 2012.
Dual-fueled RFUR Projects Not in Compliance
Eight projects were found to be using more non-renewable fuel than allowed during this reporting period. For some of these projects it was necessary to estimate the electrical conversion efficiency because metered biogas consumption data were not available.16
SCE PY06-062. This 900 kW fuel cell system came on-line in March 2008. The system is located at a wastewater treatment facility and utilizes renewable fuel produced by a digester system. Metered electric generation and natural gas consumption data were obtained from the SGIP participant. Itron assumed an electrical conversion efficiency of 33 percent to estimate total fuel use during periods of electricity generation. Based on these estimates, Itron believes natural gas usage during the current reporting period exceeded 26 percent of the total annual fuel input. The system therefore was not in compliance with SGIP renewable fuel use provisions during this reporting period.
SCG 2008-003. This 600 kW fuel cell project came on-line in December 2009 and consists of two 300 kW fuel cells. The system utilizes renewable fuel produced from onion feedstock and natural gas from SCG. At the time of the SCG installation verification inspection, the fuel cells were using a 21 percent natural gas and 79 percent renewable fuel mix. Metered electric generation and natural gas consumption data were obtained from the SGIP participant. Itron assumed an electrical conversion efficiency to estimate total fuel use during periods of electricity generation. Based on these estimates, the natural gas usage during the current reporting period exceeded 44 percent. The system was not in compliance with SGIP renewable fuel use provisions for this reporting period.
SCE PY10-002. This project is a 750 kW fuel cell system consisting of three 250 kW stacks, of which only two are rebated as dual fueled systems. The system is located at a waste water treatment plant and at the time of the SCE installation verification inspection was capable of producing sufficient anaerobic digester gas (ADG) to run two of the units using 100% ADG. Itron assumed an electrical conversion efficiency of 33 percent to estimate total fuel use during periods of electricity generation. Based on these estimates, the natural gas usage during the current reporting period exceeded 42 percent of the total
16 In these calculations an electrical conversion efficiency of 33 percent was assumed. The intent was to develop an efficiency likely to be lower than the actual efficiency. If the actual efficiency is higher than 33 percent (which is likely), then the actual non-renewable fuel use is higher than the estimated percent.

SGIP Semi-Annual Renewable Fuel Use Report No. 21
Itron, Inc. 21 SGIP RFU Report No. 21
annual fuel input. The system was not in compliance with SGIP renewable fuel use provisions for this reporting period.
PG&E 1810, PG&E 1811, and PG&E 1812. These three 400 kW fuel cell projects (1,200 kW total) utilize directed biogas from a landfill and natural gas. The projects became operational in November 2010 and therefore are required to comply with SGIP renewable fuel use requirements. Itron has obtained directed biogas invoices and allocation/imbalance reports from the gas marketer. Itron also collected electrical generation and natural gas consumption data from the manufacturer. Based on a review of the data and documentation, the natural gas usage during the current reporting period was 35 percent. These projects are found to be out of compliance with SGIP renewable fuel use provisions for this reporting period.
SCE PY09-003. This 300 kW fuel cell is one of four systems installed at the City of Tulare water pollution control facility. The system utilizes a combination of waste water digester gas and natural gas. The system became operational in August 2011 and is therefore required to comply with SGIP renewable fuel use requirements. Itron collected electrical generation and natural gas consumption data from the manufacturer. Itron assumed an electrical conversion efficiency of 33 percent to estimate total fuel use during periods of electricity generation. Based on these estimates, Itron believes natural gas usage during the current reporting period exceeded 26 percent of the total annual fuel input. The system was found to be out of compliance with SGIP renewable fuel use provisions for this reporting period.
CCSE 0362-09. This 300 kW fuel cell utilizes a blend of digester gas from a waste water treatment plant and natural gas. The system became operational in December 2011 and is therefore required to comply with SGIP renewable fuel use requirements. When sufficient digester gas is not available to run this system at full load, natural gas is mixed in. Electrical output and natural gas consumption data are being collected by the participant and were provided to Itron. Itron assumed an electrical conversion efficiency of 33 percent to estimate total fuel use during periods of electricity generation. Based on the data provided, the natural gas usage during the reporting period exceeded 28 percent of the total energy consumed. The project was not in compliance with SGIP renewable fuel use provisions for this reporting period.
Dual-Fueled RFUR Project Compliance Status to Be Determined
A dual-fueled RFUR project is assigned compliance status “To Be Determined” if its compliance verification is required but either Itron did not have sufficient information to make a determination or the information provided did not allow to a compliance determination. There are 41 directed biogas project in this category. Summary information about projects where

SGIP Semi-Annual Renewable Fuel Use Report No. 21
Itron, Inc. 22 SGIP RFU Report No. 21
enough information was not available to make a compliance determination requirements is presented exclusively in Table 6.
Dual-Fueled RFUR Project Compliance Status Not Applicable
A dual-fueled RFUR project is assigned compliance status “Not Applicable” if it has not yet been operational for a complete calendar year. There are 14 directed-biogas fuel cells and 3 blended renewable projects in this category. A dual-fueled RFUR projects is also assigned compliance status “Not Applicable” if its warranty has expired. There are six blended renewable projects in this category.
Historically, a summary of projects and a preliminary compliance assessment was attempted for projects not yet operational for a complete calendar year. In this report, information about projects not yet subject to compliance determination requirements is presented exclusively in Table 6. Summary information about projects no longer under warranty will continue to be presented in this section.
The following is a summary of projects that are no longer required to comply with renewable fuel use requirements.
Warranty Expired
SCE PY03-092. This 500 kW fuel cell project uses natural gas for backup fuel supply and piloting purposes. The fuel cell system is composed of two molten carbonate fuel cells, each of which is rated for 250 kW of electrical output. Renewable fuel used by this system is produced as a by-product of a municipal wastewater treatment process. A natural gas metering system has been installed by SCG to monitor natural gas usage. Biogas use is not metered. In December 2010 the fuel cells were removed and decommissioned after the warranty period had lapsed. During the period when data were provided and the system was under contract the actual contribution of non-renewable fuel never exceeded 25 percent on an annual fuel input basis.
SCE PY03-017. This IC engine system was designed to use natural gas for back-up and piloting purposes. The SGIP participant provided metered electric generation, biogas consumption, and natural gas consumption data for previous reporting periods. However, in Q2 2008 the participant’s SGIP contract reached the end of its term and data were no longer available from this participant. During the period when data were provided and the system was under contract the actual contribution of non-renewable fuel never exceeded 25 percent on an annual fuel input basis.

SGIP Semi-Annual Renewable Fuel Use Report No. 21
Itron, Inc. 23 SGIP RFU Report No. 21
SCE PY04-158 and SCE PY04-159. These two systems are located at the same wastewater treatment facility and utilize renewable fuel produced by the same digester system. The two projects are grouped together here because they share a common fuel blending system. The fuel blending system controls the mix of renewable and non-renewable fuel. In the second quarter of 2008 the participant’s SGIP contract reached the end of its term and no metered data have been available to assess the actual fuel mix since this time. In SCE’s September 2006 installation verification inspection reports, the participant reported that the systems were using 80 percent digester gas and 20 percent natural gas.
PG&E 1313. This 240 kW system consists of eight 30 kW microturbines installed at a wastewater treatment facility and uses heat recovered from the system to warm the digesters. Metered daily electric generation, biogas consumption, and natural gas consumption data were obtained from the SGIP participant for this microturbine system. In January 2009 the system stopped operating; it has been off during the last five reporting periods.
PG&E A-1749. This 130 kW IC engine system uses renewable fuel from a wastewater treatment plant digester and recovers waste heat from the engine to preheat the digester sludge. The system became operational in November 2009 and is therefore no longer required to be in compliance with SGIP renewable fuel use requirements. Electrical generation data showing that the system was online during this reporting period were collected from PG&E. Natural gas and renewable fuel consumption data from the host are no longer available.
A summary of renewable fuel use compliance for the 78 dual-fuel systems is presented in Table 6.

SGIP
Sem
i-Ann
ual R
enew
able
Fue
l Use
Rep
ort N
o. 2
1
Itron
, Inc
. 24
SG
IP R
FU R
epor
t No.
21
Tabl
e 6:
Fue
l-Use
Com
plia
nce
of D
ual-F
uele
d R
FUR
Pro
ject
s (P
roje
cts
Util
izin
g N
on-R
enew
able
Fue
l)
PA
Res
No
Ince
ntiv
e L
evel
T
ech
Ren
ewab
le
Fuel
Typ
e C
apac
ity
(kW
) O
pera
tiona
l D
ate*
Ann
ual N
atur
al
Gas
Ene
rgy
Flow
(M
MB
tu) †
Ren
ewab
le
Fuel
Use
(%
of T
otal
E
nerg
y In
put)
SGIP
W
arra
nty
Stat
us
Mee
ts P
rogr
am
Ren
ewab
le F
uel
Use
R
equi
rem
ents
?
PG&
E 14
90
Leve
l 2
FC
DG
- W
WTP
60
004
/24/
2008
9,
370
76%
Act
ive
Yes
SCG
20
06-0
36
Leve
l 2
FC
DG
- W
WTP
1,
200
10/2
7/20
08
0N
/AA
ctiv
e Y
es
SCG
20
06-0
12
Leve
l 2
FC
DG
- W
WTP
90
012
/18/
2009
8,
306
76%
Act
ive
Yes
CC
SE
SDR
EO-0
351-
07
Leve
l 2
ICE
DG
- W
WTP
56
004
/16/
2010
12
,130
78%
Act
ive
Yes
PG&
E 18
02
Leve
l 2
FC
Land
fill
Gas
(D
irect
ed)
400
12/2
2/20
10
23,0
5976
%A
ctiv
e Y
es
PG&
E 18
74
Leve
l 2
FC
Land
fill
Gas
(D
irect
ed)
500
09/0
7/20
11
29,9
69 ¥
¥90
%A
ctiv
e Y
es
SCE
PY06
-062
Le
vel 2
FC
D
G -
WW
TP
900
03/0
4/20
08
12,3
2474
%A
ctiv
e N
o
SCG
20
08-0
03
Leve
l 2
FC
DG
-
Food
Pr
oces
sing
60
012
/14/
2009
18
,324
55%
Act
ive
No
SCE
PY10
-002
Le
vel 2
FC
D
G -
WW
TP
500
10/3
1/20
10
10,0
1258
%A
ctiv
e N
o
PG&
E 18
11
Leve
l 2
FC
Land
fill
Gas
(D
irect
ed)
400
11/1
0/20
10
23,2
2465
%A
ctiv
e N
o
PG&
E 18
12
Leve
l 2
FC
Land
fill
Gas
(D
irect
ed)
400
11/1
0/20
10
23,6
2165
%A
ctiv
e N
o

SGIP
Sem
i-Ann
ual R
enew
able
Fue
l Use
Rep
ort N
o. 2
1
Itron
, Inc
. 25
SG
IP R
FU R
epor
t No.
21
PA
Res
No
Ince
ntiv
e L
evel
T
ech
Ren
ewab
le
Fuel
Typ
e C
apac
ity
(kW
) O
pera
tiona
l D
ate*
Ann
ual N
atur
al
Gas
Ene
rgy
Flow
(M
MB
tu) †
Ren
ewab
le
Fuel
Use
(%
of T
otal
E
nerg
y In
put)
SGIP
W
arra
nty
Stat
us
Mee
ts P
rogr
am
Ren
ewab
le F
uel
Use
R
equi
rem
ents
?
PG&
E 18
10
Leve
l 2
FC
Land
fill
Gas
(D
irect
ed)
400
11/1
0/20
10
23,6
2365
%A
ctiv
e N
o
SCE
PY09
-003
Le
vel 2
FC
D
G -
WW
TP
300
08/3
0/20
11
4,95
874
%A
ctiv
e N
o
CC
SE
CC
SE-0
362-
09
Leve
l 2
FC
DG
- W
WTP
30
012
/21/
2011
6,
505
71%
Act
ive
No
CC
SE
CC
SE-0
369-
10
Leve
l 2
FC
Land
fill
Gas
(D
irect
ed)
400
12/3
1/20
10
TBD
TB
D
Act
ive
TBD
¥
CC
SE
CC
SE-0
370-
10
Leve
l 2
FC
Land
fill
Gas
(D
irect
ed)
400
12/3
1/20
10
TBD
TB
D
Act
ive
TBD
¥
PG&
E 18
05
Leve
l 2
FC
Land
fill
Gas
(D
irect
ed)
200
01/1
8/20
11
TBD
TB
D
Act
ive
TBD
¥
SCG
20
10-0
12
Leve
l 2
FC
Land
fill
Gas
(D
irect
ed)
1,00
001
/24/
2011
TB
D
TBD
A
ctiv
e TB
D ¥
PG&
E 18
59
Leve
l 2
FC
Land
fill
Gas
(D
irect
ed)
500
03/1
1/20
11
TBD
TB
D
Act
ive
TBD
¥
PG&
E 18
71
Leve
l 2
FC
Land
fill
Gas
(D
irect
ed)
300
03/1
4/20
11
TBD
TB
D
Act
ive
TBD
¥
SCE
PY10
-004
Le
vel 2
FC
La
ndfil
l G
as
(Dire
cted
) 80
003
/23/
2011
TB
D
TBD
A
ctiv
e TB
D ¥

SGIP
Sem
i-Ann
ual R
enew
able
Fue
l Use
Rep
ort N
o. 2
1
Itron
, Inc
. 26
SG
IP R
FU R
epor
t No.
21
PA
Res
No
Ince
ntiv
e L
evel
T
ech
Ren
ewab
le
Fuel
Typ
e C
apac
ity
(kW
) O
pera
tiona
l D
ate*
Ann
ual N
atur
al
Gas
Ene
rgy
Flow
(M
MB
tu) †
Ren
ewab
le
Fuel
Use
(%
of T
otal
E
nerg
y In
put)
SGIP
W
arra
nty
Stat
us
Mee
ts P
rogr
am
Ren
ewab
le F
uel
Use
R
equi
rem
ents
?
PG&
E 18
49
Leve
l 2
FC
Land
fill
Gas
(D
irect
ed)
500
05/0
9/20
11
TBD
TB
D
Act
ive
TBD
¥
PG&
E 18
56
Leve
l 2
FC
Land
fill
Gas
(D
irect
ed)
300
05/0
9/20
11
TBD
TB
D
Act
ive
TBD
¥
PG&
E 18
82
Leve
l 2
FC
Land
fill
Gas
(D
irect
ed)
400
05/2
4/20
11
TBD
TB
D
Act
ive
TBD
¥
PG&
E 18
86
Leve
l 2
FC
Land
fill
Gas
(D
irect
ed)
300
05/2
4/20
11
TBD
TB
D
Act
ive
TBD
¥
PG&
E 18
53
Leve
l 2
FC
Land
fill
Gas
(D
irect
ed)
600
05/2
4/20
11
TBD
TB
D
Act
ive
TBD
¥
PG&
E 18
85
Leve
l 2
FC
Land
fill
Gas
(D
irect
ed)
300
05/3
1/20
11
TBD
TB
D
Act
ive
TBD
¥
PG&
E 18
78
Leve
l 2
FC
Land
fill
Gas
(D
irect
ed)
500
06/2
9/20
11
TBD
TB
D
Act
ive
TBD
¥
PG&
E 18
51
Leve
l 2
FC
Land
fill
Gas
(D
irect
ed)
300
06/2
9/20
11
TBD
TB
D
Act
ive
TBD
¥
SCE
PY10
-023
Le
vel 2
FC
La
ndfil
l G
as
(Dire
cted
) 40
008
/08/
2011
TB
D
TBD
A
ctiv
e TB
D ¥

SGIP
Sem
i-Ann
ual R
enew
able
Fue
l Use
Rep
ort N
o. 2
1
Itron
, Inc
. 27
SG
IP R
FU R
epor
t No.
21
PA
Res
No
Ince
ntiv
e L
evel
T
ech
Ren
ewab
le
Fuel
Typ
e C
apac
ity
(kW
) O
pera
tiona
l D
ate*
Ann
ual N
atur
al
Gas
Ene
rgy
Flow
(M
MB
tu) †
Ren
ewab
le
Fuel
Use
(%
of T
otal
E
nerg
y In
put)
SGIP
W
arra
nty
Stat
us
Mee
ts P
rogr
am
Ren
ewab
le F
uel
Use
R
equi
rem
ents
?
SCE
PY10
-022
Le
vel 2
FC
La
ndfil
l G
as
(Dire
cted
) 40
008
/08/
2011
TB
D
TBD
A
ctiv
e TB
D ¥
SCE
PY10
-009
Le
vel 2
FC
La
ndfil
l G
as
(Dire
cted
) 30
008
/08/
2011
TB
D
TBD
A
ctiv
e TB
D ¥
SCE
PY10
-012
Le
vel 2
FC
La
ndfil
l G
as
(Dire
cted
) 30
008
/08/
2011
TB
D
TBD
A
ctiv
e TB
D ¥
PG&
E 18
92
Leve
l 2
FC
Land
fill
Gas
(D
irect
ed)
210
09/0
7/20
11
TBD
TB
D
Act
ive
TBD
¥
PG&
E 18
93
Leve
l 2
FC
Land
fill
Gas
(D
irect
ed)
210
09/0
7/20
11
TBD
TB
D
Act
ive
TBD
¥
PG&
E 18
50
Leve
l 2
FC
Land
fill
Gas
(D
irect
ed)
420
09/0
7/20
11
TBD
TB
D
Act
ive
TBD
¥
SCG
20
10-0
05
Leve
l 2
FC
Land
fill
Gas
(D
irect
ed)
100
09/2
0/20
11
TBD
TB
D
Act
ive
TBD
¥
SCG
20
10-0
11
Leve
l 2
FC
Land
fill
Gas
(D
irect
ed)
900
09/2
1/20
11
TBD
TB
D
Act
ive
TBD
¥
PG&
E 18
55
Leve
l 2
FC
Land
fill
Gas
(D
irect
ed)
300
09/2
9/20
11
TBD
TB
D
Act
ive
TBD
¥

SGIP
Sem
i-Ann
ual R
enew
able
Fue
l Use
Rep
ort N
o. 2
1
Itron
, Inc
. 28
SG
IP R
FU R
epor
t No.
21
PA
Res
No
Ince
ntiv
e L
evel
T
ech
Ren
ewab
le
Fuel
Typ
e C
apac
ity
(kW
) O
pera
tiona
l D
ate*
Ann
ual N
atur
al
Gas
Ene
rgy
Flow
(M
MB
tu) †
Ren
ewab
le
Fuel
Use
(%
of T
otal
E
nerg
y In
put)
SGIP
W
arra
nty
Stat
us
Mee
ts P
rogr
am
Ren
ewab
le F
uel
Use
R
equi
rem
ents
?
SCE
PY10
-014
Le
vel 2
FC
TB
D
(Dire
cted
) 42
011
/15/
2011
TB
D
TBD
A
ctiv
e TB
D ¥
SCG
20
10-0
20
Leve
l 2
FC
Land
fill
Gas
(D
irect
ed)
420
12/1
5/20
11
TBD
TB
D
Act
ive
TBD
¥
SCG
20
10-0
19
Leve
l 2
FC
Land
fill
Gas
(D
irect
ed)
420
12/1
5/20
11
TBD
TB
D
Act
ive
TBD
¥
SCG
20
10-0
18
Leve
l 2
FC
Land
fill
Gas
(D
irect
ed)
420
12/1
5/20
11
TBD
TB
D
Act
ive
TBD
¥
SCG
20
10-0
15
Leve
l 2
FC
Land
fill
Gas
(D
irect
ed)
420
12/1
6/20
11
TBD
TB
D
Act
ive
TBD
¥
CC
SE
CC
SE-0
363-
09
Leve
l 2
FC
DG
- W
WTP
(D
irect
ed)
2800
12/2
1/20
11
TBD
TB
D
Act
ive
TBD
¥
CC
SE
CC
SE-0
375-
10
Leve
l 2
FC
TBD
(D
irect
ed)
300
12/2
1/20
11
TBD
TB
D
Act
ive
TBD
¥
CC
SE
CC
SE-0
361-
09
Leve
l 2
FC
DG
- W
WTP
(D
irect
ed)
1,40
012
/21/
2011
TB
D
TBD
A
ctiv
e TB
D ¥
PG&
E 18
77
Leve
l 2
FC
TBD
(D
irect
ed)
200
12/2
9/20
11
TBD
TB
D
Act
ive
TBD
¥

SGIP
Sem
i-Ann
ual R
enew
able
Fue
l Use
Rep
ort N
o. 2
1
Itron
, Inc
. 29
SG
IP R
FU R
epor
t No.
21
PA
Res
No
Ince
ntiv
e L
evel
T
ech
Ren
ewab
le
Fuel
Typ
e C
apac
ity
(kW
) O
pera
tiona
l D
ate*
Ann
ual N
atur
al
Gas
Ene
rgy
Flow
(M
MB
tu) †
Ren
ewab
le
Fuel
Use
(%
of T
otal
E
nerg
y In
put)
SGIP
W
arra
nty
Stat
us
Mee
ts P
rogr
am
Ren
ewab
le F
uel
Use
R
equi
rem
ents
?
PG&
E 18
52
Leve
l 2
FC
TBD
(D
irect
ed)
400
12/2
9/20
11
TBD
TB
D
Act
ive
TBD
¥
PG&
E 18
76
Leve
l 2
FC
TBD
(D
irect
ed)
200
12/2
9/20
11
TBD
TB
D
Act
ive
TBD
¥
PG&
E 18
69
Leve
l 2
FC
TBD
(D
irect
ed)
600
12/2
9/20
11
TBD
TB
D
Act
ive
TBD
¥
PG&
E 18
68
Leve
l 2
FC
TBD
(D
irect
ed)
400
12/2
9/20
11
TBD
TB
D
Act
ive
TBD
¥
PG&
E 18
58
Leve
l 2
FC
Land
fill
Gas
(D
irect
ed)
300
12/2
9/20
11
TBD
TB
D
Act
ive
TBD
¥
PG&
E 19
29
Leve
l 2
FC
Land
fill
Gas
(D
irect
ed)
420
12/2
9/20
11
TBD
TB
D
Act
ive
TBD
¥
PG&
E 18
57
Leve
l 2
FC
TBD
(D
irect
ed)
300
12/2
9/20
11
TBD
TB
D
Act
ive
TBD
¥
CC
SE
CC
SE-0
376-
10
Leve
l 2
FC
TBD
(D
irect
ed)
210
02/2
7/20
12
TBD
TB
D
Act
ive
Not
A
pplic
able
‡‡
CC
SE
CC
SE-0
374-
10
Leve
l 2
FC
TBD
(D
irect
ed)
210
02/2
7/20
12
TBD
TB
D
Act
ive
Not
A
pplic
able
‡‡

SGIP
Sem
i-Ann
ual R
enew
able
Fue
l Use
Rep
ort N
o. 2
1
Itron
, Inc
. 30
SG
IP R
FU R
epor
t No.
21
PA
Res
No
Ince
ntiv
e L
evel
T
ech
Ren
ewab
le
Fuel
Typ
e C
apac
ity
(kW
) O
pera
tiona
l D
ate*
Ann
ual N
atur
al
Gas
Ene
rgy
Flow
(M
MB
tu) †
Ren
ewab
le
Fuel
Use
(%
of T
otal
E
nerg
y In
put)
SGIP
W
arra
nty
Stat
us
Mee
ts P
rogr
am
Ren
ewab
le F
uel
Use
R
equi
rem
ents
?
PG&
E 18
60
Leve
l 2
FC
TBD
(D
irect
ed)
800
02/2
8/20
12
TBD
TB
D
Act
ive
Not
A
pplic
able
‡‡
PG&
E 19
26
Leve
l 2
FC
Land
fill
Gas
(D
irect
ed)
400
02/2
8/20
12
TBD
TB
D
Act
ive
Not
A
pplic
able
‡‡
SCE
PY10
-028
Le
vel 2
FC
TB
D
(Dire
cted
) 60
003
/28/
2012
TB
D
TBD
A
ctiv
e N
ot
App
licab
le
‡‡
SCE
PY10
-011
Le
vel 2
FC
TB
D
(Dire
cted
) 21
003
/28/
2012
TB
D
TBD
A
ctiv
e N
ot
App
licab
le
‡‡
SCE
PY09
-013
Le
vel 2
FC
D
G -
WW
TP
600
03/2
8/20
12
TBD
TB
D
Act
ive
Not
A
pplic
able
‡‡
PG&
E PG
E-SG
IP-
2011
-195
0 Le
vel 2
FC
La
ndfil
l G
as
(Dire
cted
) 50
004
/11/
2012
TB
D
TBD
A
ctiv
e N
ot
App
licab
le
‡‡
CC
SE
CC
SE-0
399-
10
Leve
l 2
FC
TBD
(D
irect
ed)
630
05/0
1/20
12
TBD
TB
D
Act
ive
Not
A
pplic
able
‡‡
CC
SE
CC
SE-0
398-
10
Leve
l 2
FC
TBD
(D
irect
ed)
420
05/0
1/20
12
TBD
TB
D
Act
ive
Not
A
pplic
able
‡‡

SGIP
Sem
i-Ann
ual R
enew
able
Fue
l Use
Rep
ort N
o. 2
1
Itron
, Inc
. 31
SG
IP R
FU R
epor
t No.
21
PA
Res
No
Ince
ntiv
e L
evel
T
ech
Ren
ewab
le
Fuel
Typ
e C
apac
ity
(kW
) O
pera
tiona
l D
ate*
Ann
ual N
atur
al
Gas
Ene
rgy
Flow
(M
MB
tu) †
Ren
ewab
le
Fuel
Use
(%
of T
otal
E
nerg
y In
put)
SGIP
W
arra
nty
Stat
us
Mee
ts P
rogr
am
Ren
ewab
le F
uel
Use
R
equi
rem
ents
?
SCE
PY10
-039
Le
vel 2
FC
TB
D
(Dire
cted
) 31
508
/08/
2012
TB
D
TBD
A
ctiv
e N
ot
App
licab
le
‡‡
SCE
PY10
-038
Le
vel 2
FC
TB
D
(Dire
cted
) 63
010
/04/
2012
TB
D
TBD
A
ctiv
e N
ot
App
licab
le
‡‡
SCE
SCE-
SGIP
-20
11-0
334
Leve
l 2
FC
DG
- W
WTP
25
011
/09/
2012
TB
D
TBD
A
ctiv
e N
ot
App
licab
le
‡‡
PG&
E 18
67
Leve
l 2
FC
DG
- W
WTP
1,
400
11/2
9/20
12
TBD
TB
D
Act
ive
Not
A
pplic
able
‡‡
SCE
PY10
-035
Le
vel 2
FC
TB
D
(Dire
cted
) 1,
110
12/1
7/20
12
TBD
TB
D
Act
ive
Not
A
pplic
able
‡‡
SCE
PY10
-041
Le
vel 2
FC
TB
D
(Dire
cted
) 84
012
/24/
2012
TB
D
TBD
A
ctiv
e N
ot
App
licab
le
‡‡
SCE
PY10
-037
Le
vel 2
FC
TB
D
(Dire
cted
) 1,
050
12/2
4/20
12
TBD
TB
D
Act
ive
Not
A
pplic
able
‡‡
SCE
PY03
-092
Le
vel 1
FC
D
G -
WW
TP
500
03/1
1/20
05
Not
Ava
ilabl
e N
ot
Ava
ilabl
e Ex
pire
d N
ot
App
licab
le
‡

SGIP
Sem
i-Ann
ual R
enew
able
Fue
l Use
Rep
ort N
o. 2
1
Itron
, Inc
. 32
SG
IP R
FU R
epor
t No.
21
PA
Res
No
Ince
ntiv
e L
evel
T
ech
Ren
ewab
le
Fuel
Typ
e C
apac
ity
(kW
) O
pera
tiona
l D
ate*
Ann
ual N
atur
al
Gas
Ene
rgy
Flow
(M
MB
tu) †
Ren
ewab
le
Fuel
Use
(%
of T
otal
E
nerg
y In
put)
SGIP
W
arra
nty
Stat
us
Mee
ts P
rogr
am
Ren
ewab
le F
uel
Use
R
equi
rem
ents
?
SCE
PY03
-017
Le
vel 3
R
ICE
DG
- W
WTP
50
005
/11/
2005
N
ot A
vaila
ble
Not
A
vaila
ble
Expi
red
Not
A
pplic
able
‡
SCE
PY04
-158
Le
vel 3
R
ICE
DG
- W
WTP
70
410
/25/
2006
N
ot A
vaila
ble
Not
A
vaila
ble
Expi
red
Not
A
pplic
able
‡
SCE
PY04
-159
Le
vel 3
R
ICE
DG
- W
WTP
70
4**
10/2
6/20
06
Not
Ava
ilabl
e N
ot
Ava
ilabl
e Ex
pire
d N
ot
App
licab
le
‡
PG&
E 13
13
Leve
l 3R
M
T D
G -
WW
TP
240
03/0
6/20
07
Not
Ava
ilabl
e N
ot
Ava
ilabl
e Ex
pire
d N
ot
App
licab
le
‡
PG&
E 17
49
Leve
l 3R
IC
E D
G -
WW
TP
130
11/0
9/20
09
Not
Ava
ilabl
e N
ot
Ava
ilabl
e Ex
pire
d N
ot
App
licab
le
‡

SGIP
Sem
i-Ann
ual R
enew
able
Fue
l Use
Rep
ort N
o. 2
1
Itron
, Inc
. 33
SG
IP R
FU R
epor
t No.
21
* S
ince
ass
ignm
ent o
f a p
roje
ct’s
ope
ratio
nal d
ate
is su
bjec
t to
indi
vidu
al ju
dgm
ent,
the
ince
ntiv
e pa
ymen
t dat
e as
repo
rted
by th
e PA
s is u
sed
as a
pro
xy fo
r the
op
erat
iona
l dat
e fo
r rep
ortin
g pu
rpos
es.
† T
his
field
repr
esen
ts th
e na
tura
l gas
con
sum
ptio
n du
ring
the
12-m
onth
per
iod
endi
ng D
ecem
ber 3
1, 2
012.
The
bas
is is
the
low
er h
eatin
g va
lue
(LH
V) o
f the
fu
el.
‡ S
GIP
rene
wab
le fu
el u
se re
quire
men
ts a
re n
ot a
pplic
able
to p
roje
cts n
o lo
nger
und
er w
arra
nty
** I
n R
FU R
epor
ts N
o. 9
and
No.
10
this
pro
ject
’s s
ize
was
repo
rted
as 2
96 k
W.
That
was
the
capa
city
use
d in
ince
ntiv
e ca
lcul
atio
ns.
The
actu
al p
hysi
cal s
ize
of th
e sy
stem
is
704
kW.
In th
is p
artic
ular
circ
umst
ance
, the
re w
ere
two
sepa
rate
app
licat
ions
, bot
h 70
4 kW
of
phys
ical
cap
acity
, for
a to
tal c
ombi
ned
capa
city
of
1,40
8 kW
. Th
e m
axim
um to
tal i
ncen
tive
is o
ne M
W.
As
a re
sult,
one
app
licat
ion
was
reb
ated
in f
ull (
reba
ted
capa
city
of
704
kW)
whi
le th
e se
cond
app
licat
ion
was
reb
ated
up
to th
e re
mai
nder
of
the
elig
ible
kW
(29
6 kW
). T
he r
esul
t was
a m
uch
low
er v
alue
for
reb
ated
cap
acity
than
phy
sica
l ca
paci
ty.
‡‡ T
his s
ite h
as n
ot b
een
oper
atio
nal f
or a
yea
r, th
us th
e is
sue
of c
ompl
ianc
e is
not
yet
app
licab
le.
¥ I
nfor
mat
ion
requ
ired
to re
ach
a co
mpl
ianc
e de
term
inat
ion
for t
his s
ite w
as n
ot a
vaila
ble
ther
efor
e a
com
plia
nce
dete
rmin
atio
n is
to b
e de
term
ined
.
¥¥ T
he ti
me
perio
d of
the
com
plia
nce
dete
rmin
atio
n fo
r thi
s si
te is
not
per
fect
ly a
ligne
d w
ith th
is re
porti
ng p
erio
d du
e to
the
diff
eren
ce b
etw
een
dire
cted
bio
gas
audi
t rep
ortin
g re
quire
men
ts a
nd re
new
able
fuel
use
repo
rting
requ
irem
ents
.

SGIP Semi-Annual Renewable Fuel Use Report No. 21
Itron, Inc. 34 SGIP RFU Report No. 21
4. Greenhouse Gas Emissions Impacts
Due to increased interest in the GHG emission aspects of biogas projects, information regarding GHG emission impacts is presented in this section. The GHG emission information presented here is derived from data used to prepare the SGIP Eleventh-Year Impact Evaluation Final Report. Additionally, key factors that could influence GHG emission impacts from renewable fuel projects in the future are discussed.
Table 7 presents capacity-weighted average GHG emission results developed for 2011. Results in Table 7 suggest one important observation: The assumed baseline for the biogas (i.e., whether the biogas would have been vented to the atmosphere or flared) is the most influential determinant of GHG emission impacts.17 This is due to the global warming potential of methane (CH4) vented directly into the atmosphere, which is much higher than the global warming potential of CO2 resulting from the flaring of CH4.
Table 7: Summary of CO2 Emission Impacts from SGIP Biogas Projects in 2011
Baseline Biogas Assumption
Prime Mover Technology
Capacity-Weighted Average
(Metric Tons CO2 /MWh)
Flare FC -0.35
IC Engine -0.46 MT -0.45
Vent IC Engine -4.50 FC = fuel cell; IC Engine = internal combustion engine; MT = microturbine
Simplifying assumptions underlying the above results include:
Heat recovered from RFUR projects was used to satisfy heating load that otherwise would have been satisfied using biogas (e.g., in a boiler)18
17 The baseline treatment of biogas is an influential determinant of GHG emission impacts for renewable-fueled SGIP systems. Baseline treatment refers to the typical fate of the biogas in lieu of use for energy purposes (e.g., the biogas could be vented directly to the atmosphere or flared).
18 Heat recovered from non-RFUR projects utilizing renewable fuel was assumed to displace natural gas. There are very few such projects. The first Program Year of the SGIP (2001) was the only one in which renewable-fueled systems were required to recover heat and meet system efficiency requirements of Public Utilities Code 218.5 (now 216.6).

SGIP Semi-Annual Renewable Fuel Use Report No. 21
Itron, Inc. 35 SGIP RFU Report No. 21
A single representative electrical conversion efficiency was assumed for each technology based on metered data.
Fuel Cell: 46%
IC Engine: 31%
Microturbine: 23%
All SGIP annual impact evaluations (Impact Evaluations) prior to the Ninth-Year (2009) Impact Evaluation assumed biogas baselines by type of biomass input and rebated capacity of system. Requirements regarding venting and flaring of biogas projects are governed by a variety of regulations in California. At the local level, venting and flaring at the different types of biogas facilities is regulated by California’s 35 air quality agencies.19 At the state level, the California Air Resources Board (CARB) provides guidelines for control of methane and other volatile organic compounds from biogas facilities.20 At the federal level, New Source Performance Standards and Emission Guidelines regulate methane capture and use.21
Biogas baseline assumptions used to calculate GHG impact estimates for 2007-2009 were based on previous studies.22 23 Because of the importance of the baseline treatment of biogas in the GHG analysis, SGIP biogas facilities were contacted in 2009 to gather baseline-related information. This research suggested a venting baseline for dairy digesters and a flaring baseline for all other project types. For the 2009 through 2011 Impact Evaluations the biogas baseline was modified for WWTP and food processing SGIP projects smaller than 150 kW.
The evolution of biogas baseline assumptions is summarized in Table 8.
19 An overview of California’s air quality districts is available at: http://www.capcoa.org 20 In June of 2007, CARB approved the Landfill Methane Capture Strategy.
See http://www.arb.ca.gov/cc/landfills/landfills.htm for additional information. 21 EPA’s Landfill Methane Outreach Program provides background information on control of methane at the
federal level. See: http://www.epa.gov/lmop/ 22 California Energy Commission, Landfill Gas-to-Energy Potential in California, CEC Report 500-02-041V1,
September 2002. 23 Simons, G., and Zhang, Z., “Distributed Generation From Biogas in California,” presented at Interconnecting
Distributed Generation Conference, March 2001.

SGIP Semi-Annual Renewable Fuel Use Report No. 21
Itron, Inc. 36 SGIP RFU Report No. 21
Table 8: Biogas Baseline Assumptions
Renewable Fuel Source Facility Type* Size of Rebated
System (kW) Impact Report
PY07-08 PY09-11
Digester Gas WWTP <150 Vent Flare
150 Flare Flare
Digester Gas Food Processing <150 Vent Flare
150 Flare Flare Landfill Gas LFG All Sizes Flare Flare Digester Gas Dairy All Sizes Vent Vent * WWTP = Waste Water Treatment Plant; LFG = Landfill Gas
The equivalent tons of CO2 emissions associated with SGIP systems for which flaring and venting baselines were assumed for 2011 are presented in Figure 8 and Figure 9. GHG emission impacts are depicted graphically as the difference between SGIP emissions and the total baseline emissions. Total baseline emissions exceed SGIP emissions in these two cases; hence a reduction in GHG emissions is attributed to participation in the SGIP.
Figure 8: Equivalent Tons of CO2 Emissions - Flaring Baseline
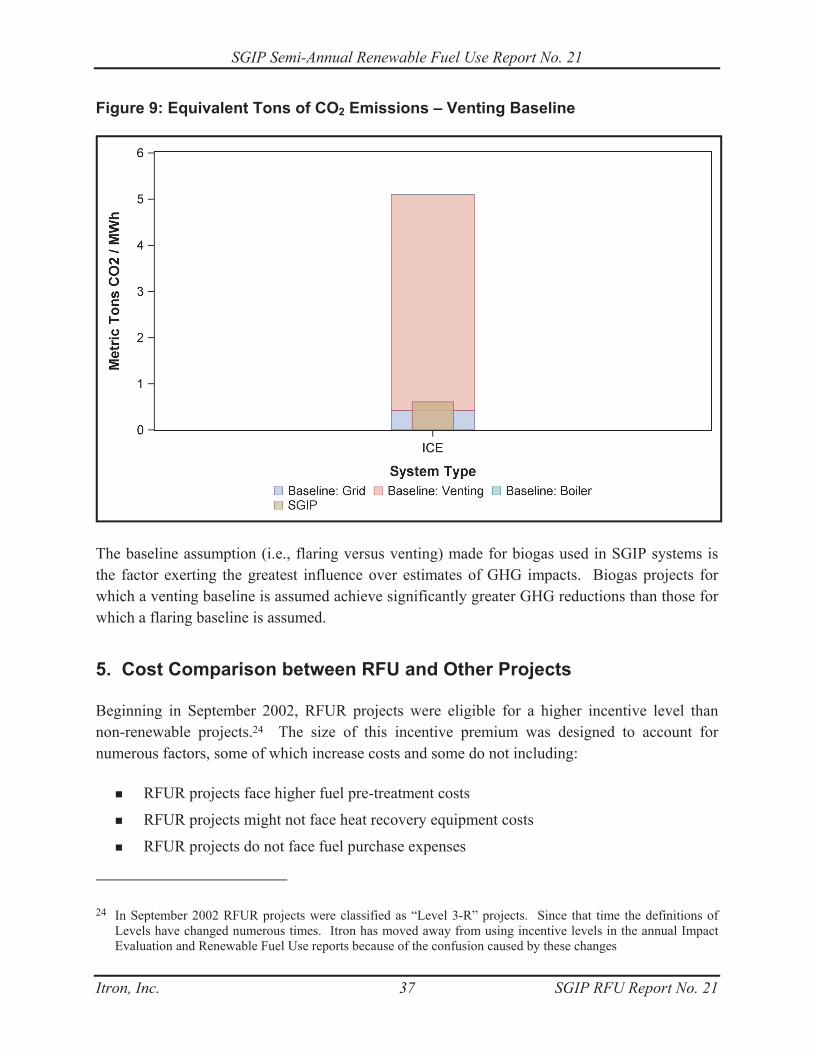
SGIP Semi-Annual Renewable Fuel Use Report No. 21
Itron, Inc. 37 SGIP RFU Report No. 21
Figure 9: Equivalent Tons of CO2 Emissions – Venting Baseline
The baseline assumption (i.e., flaring versus venting) made for biogas used in SGIP systems is the factor exerting the greatest influence over estimates of GHG impacts. Biogas projects for which a venting baseline is assumed achieve significantly greater GHG reductions than those for which a flaring baseline is assumed.
5. Cost Comparison between RFU and Other Projects
Beginning in September 2002, RFUR projects were eligible for a higher incentive level than non-renewable projects.24 The size of this incentive premium was designed to account for numerous factors, some of which increase costs and some do not including:
RFUR projects face higher fuel pre-treatment costs
RFUR projects might not face heat recovery equipment costs
RFUR projects do not face fuel purchase expenses
24 In September 2002 RFUR projects were classified as “Level 3-R” projects. Since that time the definitions of Levels have changed numerous times. Itron has moved away from using incentive levels in the annual Impact Evaluation and Renewable Fuel Use reports because of the confusion caused by these changes

SGIP Semi-Annual Renewable Fuel Use Report No. 21
Itron, Inc. 38 SGIP RFU Report No. 21
Concerns were expressed in CPUC Decision 02-09-051 that RFUR project costs could fall below non-renewable project costs as RFUR projects are exempt from waste heat recovery requirements. As a result, RFUR projects could potentially be receiving a greater-than-necessary incentive, which could lead to fuel switching. To address this concern, the CPUC directed SGIP PAs to monitor non-renewable project and RFUR project costs.
Eligible project costs from all completed SGIP projects provide the data for monitoring and analyzing differences in project costs. However, these are historical costs, raising a key question faced by the CPUC and other Program designers:
How accurately do the cost differences calculated for projects completed in the past represent the cost differences that are likely
to be faced by Program participants in the future?
This question is difficult to answer and the answer depends on many factors, including:
1. The number of projects completed in the past.
2. The variability exhibited by cost data for the projects completed in the past.
3. The possible changes in system costs through time yielded by experience, economies of scale, and/or technology innovation.
The following analysis provides insight into mean costs and cost differences due to renewable fuel use and heat recovery.
Eligible installed costs for all fuel cell, microturbine, and IC engine projects operational as of June 30, 2012, are summarized in Table 9, along with simple statistics of the data. The summary distinguishes between fuel type and heat recovery incidence to facilitate independent examination of the principal factors influencing costs of projects utilizing renewable fuel. Several of the groups comprise only a few projects and others have extreme variability in project costs, greater than an order of magnitude. Sample sizes and overall cost variability play a very important role in the ability to draw conclusions from the data. The combined influence of sample size and sample variability on the inferential statistics is discussed below in the section titled Uncertainty Analysis.

SGIP Semi-Annual Renewable Fuel Use Report No. 21
Itron, Inc. 39 SGIP RFU Report No. 21
Table 9: Summary of Project Costs by Technology, Heat Recovery Provisions & Fuel Type
Tech
Includes Renewable
Fuel?* Includes Heat
Recovery? No.
Projects
$/Watt Eligible Installed Costs
Range Median Mean Std. Dev.
Size-Wtd. Avg.
FC
Yes Yes 13 4.51 - 10.98 8.28 8.00 2.31 6.88 Yes No 1 6.8 - 6.8 6.80 6.80 0.00 6.80 Yes Yes or No 14 4.51 - 10.98 7.15 7.91 2.23 6.87 No Yes 20 5.06 - 18 7.18 8.19 3.27 7.20 No No 30 3.57 - 11.27 10.03 9.79 1.51 8.12 No Yes or No 50 3.57 - 18 9.69 9.10 2.53 7.74
DBG No 60 5.09 - 18.21 11.18 10.54 2.34 7.61
ICE
Yes Yes 24 1.08 - 7.58 2.76 3.00 1.51 2.92 Yes No 2 1.71 - 2.87 2.29 2.29 0.82 2.71 Yes Yes or No 26 1.08 - 7.58 2.76 2.94 1.47 2.90 No Yes 230 0.85 - 10.71 2.31 2.61 1.32 2.31
MT
Yes Yes 13 2.26 - 11.32 3.99 5.13 2.69 4.55 Yes No 11 1.23 - 5.39 3.47 3.44 1.21 2.98 Yes Yes or No 24 1.23 - 11.32 3.61 4.36 2.27 3.70 No Yes 116 0.7 - 8.4 3.21 3.34 1.31 3.25
FC = fuel cell; MT = microturbine; ICE = internal combustion engine; DBG = directed biogas.
* To assess the difference in costs between those technologies using renewable fuel resources versus those using only non-renewable fuels, fuel types are differentiated in Table 9 by identifying those using any amount of renewable fuel with a “Yes” classification.
The cost of waste heat recovery equipment and fuel clean-up may account for much of the difference between renewable and non-renewable project costs. The basis for heat recovery equipment and fuel clean-up equipment cost comparisons are described below.

SGIP Semi-Annual Renewable Fuel Use Report No. 21
Itron, Inc. 40 SGIP RFU Report No. 21
Heat Recovery Equipment Costs
The cost difference due to heat recovery equipment can be evaluated by comparing costs of projects with heat recovery to the costs of otherwise similar projects without heat recovery. The analysis is limited to projects that use renewable fuel to keep that variable constant and since those are the projects of most interest in this report. Additionally, analysis is performed separately for each technology type. For example, the cost difference due to heat recovery equipment for microturbine projects is calculated as $5.13 minus $3.47, or $1.66.
HRowRFU
HRwRFU
eryHeat//
covRe Equation 1
Where
RFU = renewable fuel use
HR = heat rate
w/ = with
w/o = without
Table 10: Cost Effect of Heat Recovery
Tech
Includes Renewable
Fuel? Includes Heat
Recovery? No. Projects
$/Watt Eligible Installed Costs
Range Median Mean Std. Dev.
Size-Wtd. Avg.
FC Yes Yes 13 4.51-10.98 8.28 8.00 2.31 6.88
ICE
Yes Yes 24 1.08- 7.58 2.76 3.00 1.51 2.92 Yes No 2 1.71- 2.87 2.29 2.29 0.82 2.71
Increase due to Heat Recovery - - 0.47 0.71 0.69 0.20
MT
Yes Yes 13 2.26-11.32 3.99 5.13 2.69 4.55 Yes No 11 1.23- 5.39 3.47 3.44 1.21 2.98
Increase due to Heat Recovery - - 0.51 1.68 1.48 1.57 The mean costs for heat recovery is higher than non-heat recovery systems. The statistical significance of these differences is examined later in this report with uncertainty analysis. Note there was only one renewable fueled fuel cell that did not include heat recovery, so it is not possible to perform this analysis for fuel cells.

SGIP Semi-Annual Renewable Fuel Use Report No. 21
Itron, Inc. 41 SGIP RFU Report No. 21
Fuel Treatment Equipment Costs
Renewable fueled projects utilize fuel treatment equipment, which is usually used for gas clean-up, such as removal of hydrogen sulfide. To examine whether this fuel treatment equipment significantly increases project costs, the differences in costs between renewable and non-renewable fueled projects are analyzed. However, we must take into account whether the project also includes heat recovery equipment to avoid influencing the results. The analysis is limited to projects with heat recovery for this reason and to maximize the sample size of non-renewable fueled projects. Any difference observed between the costs of these two groups could be due to the difference in provisions for fuel treatment. For example, the cost difference for fuel treatment equipment in IC engine projects is calculated as $3.00 minus $2.60, or $0.40.
HRw
NGHRw
RFUTreatmentFuel
// Equation 2
Where
NG = natural gas
Table 11: Cost Effect of Renewable Fuel Treatment Equipment
Tech
Includes Renewable
Fuel? Includes Heat
Recovery? No. Projects
$/Watt Eligible Installed Costs
Range Median Mean Std. Dev.
Size-Wtd. Avg.
FC Yes Yes 13 4.51-10.98 8.28 8.00 2.31 6.88 No Yes 20 5.06-18.00 7.18 8.19 3.27 7.20
Increase due to RF Equipment - - -1.10 0.19 0.97 0.32
ICE Yes Yes 24 1.08- 7.58 2.76 3.00 1.51 2.92 Yes No 2 1.71- 2.87 2.29 2.29 0.82 2.71
Increase due to RF Equipment - - 0.45 0.39 0.19 0.61
MT Yes Yes 13 2.26-11.32 3.99 5.13 2.69 4.55 No Yes 116 0.70- 8.40 3.21 3.34 1.31 3.25
Increase due to RF Equipment - - 0.78 1.78 1.38 1.30

SGIP Semi-Annual Renewable Fuel Use Report No. 21
Itron, Inc. 42 SGIP RFU Report No. 21
The mean and median costs of renewable fueled ICE and MT projects are higher than non-renewable fueled projects. Interestingly, for renewable fueled fuel cells, the mean cost is lower while the median cost is higher than non-renewable systems. This is due to a skewed distribution of fuel cell project costs. Costs for all technology and fuel types display great variability, making it difficult to draw significant conclusions about cost differences for renewable fueled systems. Statistical significance of the results is further explored via uncertainty analysis later in this report.
Overall RFU Costs
An alternative and more general analysis of cost differences between renewable and non-renewable fueled projects is to compare costs of the two groups without regard to heat recovery provision. Note that all of the non-renewable fuel projects include heat recovery equipment, with the exception of a few fuel cell projects, and many of the renewable fuel projects include heat recovery even though many were not required to do so. By looking at the observed difference in costs of these two groups, it is possible to see the average overall influence of the different SGIP requirements for renewable and non-renewable projects. For example, the cost difference between renewable and non-renewable fueled IC engine projects is calculated as $2.94 minus $2.60, or $0.34.
HRw
NGHRoworw
RFURFU
/// Equation 3
Table 12: Cost Effect of Renewable Fuel Use
Tech Includes
Renewable Fuel? Includes Heat
Recovery? No.
Projects
$/Watt Eligible Installed Costs
Range Median Mean Std. Dev.
Size-Wtd. Avg.
FC Yes Yes or No 14 4.51-10.98 7.15 7.91 2.23 6.87 No Yes or No 50 3.57-18.00 9.69 9.10 2.53 7.74
Increase due to RFU . -2.54 -1.19 -0.30 -0.87
ICE Yes Yes or No 26 1.08- 7.58 2.76 2.94 1.47 2.90 No Yes 230 0.85-10.71 2.31 2.61 1.32 2.31
Increase due to RFU . 0.45 0.33 0.15 0.59
MT Yes Yes or No 24 1.23-11.32 3.61 4.36 2.27 3.70 No Yes 116 0.70- 8.40 3.21 3.34 1.31 3.25
Increase due to RFU . 0.40 1.01 0.95 0.44

SGIP Semi-Annual Renewable Fuel Use Report No. 21
Itron, Inc. 43 SGIP RFU Report No. 21
Uncertainty Analysis
This section augments the difference of means analysis with an uncertainty analysis that provides a confidence interval for the mean differences. The confidence intervals are calculated with the sample statistics (e.g., n, mean, and std. dev.) presented in Table 9. The presented confidence intervals are based on a 90 percent confidence level, meaning there is 90 percent confidence that the true mean difference falls within the stated range. Note that if the range spans across zero, it is possible that there is no difference in cost between the two groups being analyzed.
Microturbine Project Cost Comparisons
Cost comparison results for microturbines are summarized in Table 13. These data show, for instance, that the average incremental cost associated with presence of heat recovery was $1.66 per watt for SGIP participants with completed projects. When this value is used to estimate the incremental cost of heat recovery not only for completed projects but also for projects that will be completed in the future, it is necessary to summarize the uncertainty of the estimate.25
Table 13: Microturbine Project Cost Comparison Summary
Physical Difference
Difference of Means ($/Watt)
90% Confidence Interval ($/Watt)
Heat Recovery 1.68 0.18 to 3.19
Fuel Treatment 1.78 1.06 to 2.51
RFU 1.01 0.45 to 1.57
The 90 percent confidence intervals presented in Table 13 summarize uncertainty in estimates of the incremental costs associated with several key physical differences for the population comprising projects already completed as well as those that will be completed in the future. For heat recovery, the lower bound of the confidence interval is just seven cents per watt. This counterintuitive result implies that systems without heat recovery might be nearly the same cost as those with it. The possibility of this unlikely result, along with the very large confidence interval, are likely simply due to the small quantity of, and considerable variability exhibited by cost data available for SGIP projects completed in the past. This is a representative example of
25 Uncertainty is assessed by calculating confidence intervals around the point estimates. Standard statistical tests are used to describe the likelihood that the two samples underlying the two means used to calculate each incremental difference came from the same population. When n1 & n2 30, a z-Test is used to determine confidence intervals. When n1 or n2 <30, a t-Test is used.

SGIP Semi-Annual Renewable Fuel Use Report No. 21
Itron, Inc. 44 SGIP RFU Report No. 21
the general rule that caution must be exercised when interpreting summary statistics when sample sizes are small.
IC Engine Project Cost Comparisons
Cost comparison results for IC engine projects are summarized in Table 14. The differences between means are small in comparison to the variability exhibited by past costs of renewable fuel projects. This variability, combined with relatively small numbers of renewable fuel projects, results in very large confidence intervals. Each of the confidence intervals span across zero, meaning there is not 90% confidence that there is a difference in cost for the factors analyzed.
Table 14: IC Engine Project Cost Comparison Summary
Physical Difference
Difference of Means ($/Watt)
90% Confidence Interval ($/Watt)
Heat Recovery 0.71 -1.16 to 2.58
Fuel Treatment 0.39 -0.08 to 0.86
RFU 0.33 -0.12 to 0.79
Fuel Cell Project Cost Comparisons
Due to the sensitivity of fuel cells to contaminants in the gas stream, gas clean-up costs for fuel cells powered by renewable fuels—which contain sulfur, halide, and other contaminants—should be higher than gas clean-up costs for fuel cells operating with cleaner fuels, such as natural gas. Cost comparison results for fuel cells are summarized in Table 15. Results for the incremental difference due to heat recovery are not presented because all but one of the renewable fuel cell projects completed to date have included heat recovery even though they were not required to by the SGIP. The 90 percent confidence interval for fuel cells is very large, which is not surprising given the emerging status of this technology and the small number of facilities. Again, the confidence intervals span across zero and there is not 90% confidence that cost differences exist for the analyzed factors.

SGIP Semi-Annual Renewable Fuel Use Report No. 21
Itron, Inc. 45 SGIP RFU Report No. 21
Table 15: Fuel Cell Project Cost Comparison Summary
Physical Difference
Difference of Means ($/Watt)
90% Confidence Interval ($/Watt)
Heat Recovery --- ---
Fuel Treatment -0.19 -1.97 to 1.58
RFU -1.19 -2.44 to 0.05
Cost Comparison Summary
Comparison of the installed costs between renewable- and non-renewable-fueled generation systems operational as of December 31, 2012, reveals that average non-renewable generator costs have typically been lower than average renewable-fueled generator costs. However, these averages pertain to past Program participants. The fundamental question motivating examination of RFUR project costs is stated explicitly below:
Do SGIP project cost data for past participants suggest that project costs are changing in ways that could necessitate modification of incentive levels
received by future SGIP participants?
Confidence intervals calculated for populations comprising both past and future SGIP participants are very large. In fact, these confidence intervals prevent drawing conclusions about cost differences in IC Engine and Fuel Cell projects; only Microturbine projects exhibit cost differences at 90% confidence. This suggests that data for past projects should not be used as the sole basis for SGIP design elements affecting future participants. Engineering estimates, budget cost data, and rules-of-thumb likely continue to be more suitable for this purpose at this time.

Itron, Inc. Appendix A-1 SGIP RFU Report No. 21
Appendix A List of All SGIP Projects Utilizing Renewable Fuel
All SGIP projects supplied with renewable fuel are listed in Table 16. Renewable Fuel Use Requirement (RFUR) projects subject to renewable fuel use requirements and exempt from heat recovery requirements are identified in the column titled “RFUR Project?” Only a portion of these projects (67 percent) are also equipped with a non-renewable fuel supply. These projects are identified in the “Any Non-Renewable Fuel Supply?” column.
Table 16: SGIP Projects Utilizing Renewable Fuel
Res No. PA Incentive
Level Tech Renewable Fuel Type
Capacity (kW)
Operational Date*
RFUR Project?
Any Non-Renewable
Fuel Supply?
SDREO-0007-01 CCSE Level 3 MT DG - WWTP 84 08/30/2002 No No
PY02-055 SCE Level 3R MT Landfill Gas 420 05/19/2003 Yes No
PY01-031 SCE Level 3 ICE Landfill Gas 991 09/29/2003 No No
110 PG&E Level 3 ICE DG - WWTP 900 10/23/2003 No Yes
PY02-074 SCE Level 3R MT Landfill Gas 300 02/11/2004 Yes No
SDREO-0026-01 CCSE Level 3 MT DG - WWTP 120 04/23/2004 No No
514 PG&E Level 3R MT DG - WWTP 90 05/19/2004 Yes No
SDREO-0023-01 CCSE Level 3 MT DG - WWTP 360 09/03/2004 No No
379 PG&E Level 3R MT Landfill Gas 280 01/14/2005 Yes No
PY03-092 SCE Level 1 FC DG - WWTP 500 03/11/2005 Yes Yes
641 PG&E Level 3R MT Landfill Gas 70 04/14/2005 Yes No

SGIP Semi-Annual Renewable Fuel Use Report No. 21
Itron, Inc. Appendix A-2 SGIP RFU Report No. 21
Res No. PA Incentive
Level Tech Renewable Fuel Type
Capacity (kW)
Operational Date*
RFUR Project?
Any Non-Renewable
Fuel Supply?
640 PG&E Level 3R MT Landfill Gas 70 04/14/2005 Yes No
PY03-045 SCE Level 1 FC DG - WWTP 250 04/19/2005 Yes No
PY03-008 SCE Level 3R MT Landfill Gas 70 05/11/2005 Yes No
PY03-017 SCE Level 3R ICE DG - WWTP 500 05/11/2005 Yes Yes
842A PG&E Level 3R MT DG - WWTP 60 05/27/2005 Yes No
PY03-038 SCE Level 3R MT DG - WWTP 250 07/12/2005 Yes No
747 PG&E Level 3R MT DG - WWTP 60 07/18/2005 Yes No
653 PG&E Level 2 FC DG - Food Processing 1000 08/09/2005 No Yes
833 PG&E Level 3N MT DG - Food Processing 70 11/07/2005 No Yes
483 PG&E Level 3R ICE DG - Dairy 300 01/13/2006 Yes No
313 PG&E Level 3R MT DG - WWTP 300 03/16/2006 Yes No
1297 PG&E Level 3R MT DG - WWTP 280 04/07/2006 Yes No
856 PG&E Level 3R MT Landfill Gas 210 05/05/2006 Yes No
658 PG&E Level 3R ICE DG - Dairy 160 05/22/2006 Yes No
1222 PG&E Level 3R ICE Landfill Gas 970 07/05/2006 Yes No
1316 PG&E Level 3R ICE Landfill Gas 970 10/02/2006 Yes No
PY04-158 SCE Level 3R ICE DG - WWTP 704 10/25/2006 Yes Yes
PY04-159 SCE Level 3R ICE DG - WWTP 704 10/26/2006 Yes Yes
1308 PG&E Level 3R ICE DG - Dairy 400 11/17/2006 Yes No
1505 PG&E Level 2 ICE Landfill Gas 970 11/24/2006 Yes No
298 PG&E Level 3R MT DG - WWTP 30 01/31/2007 Yes No
1313 PG&E Level 3R MT DG - WWTP 240 03/06/2007 Yes Yes

SGIP Semi-Annual Renewable Fuel Use Report No. 21
Itron, Inc. Appendix A-3 SGIP RFU Report No. 21
Res No. PA Incentive
Level Tech Renewable Fuel Type
Capacity (kW)
Operational Date*
RFUR Project?
Any Non-Renewable
Fuel Supply?
PY05-093 SCE Level 3R ICE Landfill Gas 1030 03/16/2007 Yes No
1559 PG&E Level 2 ICE DG - WWTP 160 05/16/2007 Yes No
1298 PG&E Level 3N MT DG - WWTP 250 06/11/2007 No Yes
1528 PG&E Level 2 MT DG - Food Processing 70 06/15/2007 Yes No
PY06-094 SCE Level 2 ICE DG - WWTP 500 11/08/2007 Yes No
1577 PG&E Level 2 ICE DG - Dairy 80 12/31/2007 Yes No
2005-082 SCG Level 3R ICE DG - Food Processing 1080 01/15/2008 Yes No
2006-014 SCG Level 2 ICE Landfill Gas 1030 02/21/2008 Yes No
PY06-062 SCE Level 2 FC DG - WWTP 900 03/04/2008 Yes Yes
SDREO-0270-05 CCSE Level 3R MT Landfill Gas 210 04/04/2008 Yes No
1490 PG&E Level 2 FC DG - WWTP 600 04/24/2008 Yes Yes
1640 PG&E Level 3R ICE DG - WWTP 643 07/29/2008 Yes No
1498 PG&E Level 3R MT Landfill Gas 210 08/05/2008 Yes No
2006-036 SCG Level 2 FC DG - WWTP 1200 10/27/2008 Yes Yes
1749 PG&E Level 3R ICE DG - WWTP 130 11/09/2009 Yes Yes
2008-003 SCG Level 2 FC DG - Food Processing 600 12/14/2009 Yes Yes
2006-012 SCG Level 2 FC DG - WWTP 900 12/18/2009 Yes Yes
1775 PG&E Level 2 ICE DG - Dairy 75 02/03/2010 Yes No
SDREO-0351-07 CCSE Level 2 ICE DG - WWTP 560 04/16/2010 Yes Yes
PY10-002 SCE Level 2 FC DG - WWTP 500 10/31/2010 Yes Yes

SGIP Semi-Annual Renewable Fuel Use Report No. 21
Itron, Inc. Appendix A-4 SGIP RFU Report No. 21
Res No. PA Incentive
Level Tech Renewable Fuel Type
Capacity (kW)
Operational Date*
RFUR Project?
Any Non-Renewable
Fuel Supply?
1812 PG&E Level 2 FC Landfill Gas (Directed) 400 11/10/2010 Yes Yes
1811 PG&E Level 2 FC Landfill Gas (Directed) 400 11/10/2010 Yes Yes
1810 PG&E Level 2 FC Landfill Gas (Directed) 400 11/10/2010 Yes Yes
1802 PG&E Level 2 FC Landfill Gas (Directed) 400 12/22/2010 Yes Yes
1761 PG&E Level 2 ICE DG - WWTP 330 12/23/2010 Yes No
1759 PG&E Level 2 ICE DG - WWTP 1696 12/24/2010 Yes No
CCSE-0369-10 CCSE Level 2 FC
Landfill Gas (Directed) 400 12/31/2010 Yes Yes
CCSE-0370-10 CCSE Level 2 FC
Landfill Gas (Directed) 400 12/31/2010 Yes Yes
1805 PG&E Level 2 FC Landfill Gas (Directed) 200 01/18/2011 Yes Yes
2010-012 SCG Level 2 FC Landfill Gas (Directed) 1000 01/24/2011 Yes Yes
1859 PG&E Level 2 FC Landfill Gas (Directed) 500 03/11/2011 Yes Yes
1871 PG&E Level 2 FC Landfill Gas (Directed) 300 03/14/2011 Yes Yes
PY10-004 SCE Level 2 FC Landfill Gas (Directed) 800 03/23/2011 Yes Yes
1856 PG&E Level 2 FC Landfill Gas (Directed) 300 05/09/2011 Yes Yes
1849 PG&E Level 2 FC Landfill Gas (Directed) 500 05/09/2011 Yes Yes

SGIP Semi-Annual Renewable Fuel Use Report No. 21
Itron, Inc. Appendix A-5 SGIP RFU Report No. 21
Res No. PA Incentive
Level Tech Renewable Fuel Type
Capacity (kW)
Operational Date*
RFUR Project?
Any Non-Renewable
Fuel Supply?
1886 PG&E Level 2 FC Landfill Gas (Directed) 300 05/24/2011 Yes Yes
1882 PG&E Level 2 FC Landfill Gas (Directed) 400 05/24/2011 Yes Yes
1853 PG&E Level 2 FC Landfill Gas (Directed) 600 05/24/2011 Yes Yes
1885 PG&E Level 2 FC Landfill Gas (Directed) 300 05/31/2011 Yes Yes
1878 PG&E Level 2 FC Landfill Gas (Directed) 500 06/29/2011 Yes Yes
1851 PG&E Level 2 FC Landfill Gas (Directed) 300 06/29/2011 Yes Yes
2007-013 SCG Level 2 ICE DG - WWTP 150 07/13/2011 Yes No
PY10-023 SCE Level 2 FC Landfill Gas (Directed) 400 08/08/2011 Yes Yes
PY10-022 SCE Level 2 FC Landfill Gas (Directed) 400 08/08/2011 Yes Yes
PY10-012 SCE Level 2 FC Landfill Gas (Directed) 300 08/08/2011 Yes Yes
PY10-009 SCE Level 2 FC Landfill Gas (Directed) 300 08/08/2011 Yes Yes
PY09-003 SCE Level 2 FC DG - WWTP 300 08/30/2011 Yes Yes
1892 PG&E Level 2 FC Landfill Gas (Directed) 210 09/07/2011 Yes Yes
1874 PG&E Level 2 FC Landfill Gas (Directed) 500 09/07/2011 Yes Yes
1893 PG&E Level 2 FC Landfill Gas (Directed) 210 09/07/2011 Yes Yes

SGIP Semi-Annual Renewable Fuel Use Report No. 21
Itron, Inc. Appendix A-6 SGIP RFU Report No. 21
Res No. PA Incentive
Level Tech Renewable Fuel Type
Capacity (kW)
Operational Date*
RFUR Project?
Any Non-Renewable
Fuel Supply?
1850 PG&E Level 2 FC Landfill Gas (Directed) 420 09/07/2011 Yes Yes
2010-005 SCG Level 2 FC Landfill Gas (Directed) 100 09/20/2011 Yes Yes
2010-011 SCG Level 2 FC Landfill Gas (Directed) 900 09/21/2011 Yes Yes
PY07-017 SCE Level 2 ICE DG - WWTP 364 09/27/2011 Yes No
1855 PG&E Level 2 FC Landfill Gas (Directed) 300 09/29/2011 Yes Yes
2007-036 SCG Level 2 ICE DG - WWTP 340 11/01/2011 Yes No
PY10-014 SCE Level 2 FC TBD
(Directed) 420 11/15/2011 Yes Yes
2010-020 SCG Level 2 FC Landfill Gas (Directed) 420 12/15/2011 Yes Yes
2010-019 SCG Level 2 FC Landfill Gas (Directed) 420 12/15/2011 Yes Yes
2010-018 SCG Level 2 FC Landfill Gas (Directed) 420 12/15/2011 Yes Yes
2010-015 SCG Level 2 FC Landfill Gas (Directed) 420 12/16/2011 Yes Yes
CCSE-0363-09 CCSE Level 2 FC
DG - WWTP (Directed) 2800 12/21/2011 Yes Yes
CCSE-0362-09 CCSE Level 2 FC DG - WWTP 300 12/21/2011 Yes Yes
CCSE-0361-09 CCSE Level 2 FC
DG - WWTP (Directed) 1400 12/21/2011 Yes Yes
CCSE-0375-10 CCSE Level 2 FC
TBD (Directed) 300 12/21/2011 Yes Yes

SGIP Semi-Annual Renewable Fuel Use Report No. 21
Itron, Inc. Appendix A-7 SGIP RFU Report No. 21
Res No. PA Incentive
Level Tech Renewable Fuel Type
Capacity (kW)
Operational Date*
RFUR Project?
Any Non-Renewable
Fuel Supply?
1929 PG&E Level 2 FC Landfill Gas (Directed) 420 12/29/2011 Yes Yes
1877 PG&E Level 2 FC TBD
(Directed) 200 12/29/2011 Yes Yes
1876 PG&E Level 2 FC TBD
(Directed) 200 12/29/2011 Yes Yes
1869 PG&E Level 2 FC TBD
(Directed) 600 12/29/2011 Yes Yes
1868 PG&E Level 2 FC TBD
(Directed) 400 12/29/2011 Yes Yes
1858 PG&E Level 2 FC Landfill Gas (Directed) 300 12/29/2011 Yes Yes
1857 PG&E Level 2 FC TBD
(Directed) 300 12/29/2011 Yes Yes
1852 PG&E Level 2 FC TBD
(Directed) 400 12/29/2011 Yes Yes
CCSE-0376-10 CCSE Level 2 FC
TBD (Directed) 210 02/27/2012 Yes Yes
CCSE-0374-10 CCSE Level 2 FC
TBD (Directed) 210 02/27/2012 Yes Yes
1926 PG&E Level 2 FC Landfill Gas (Directed) 400 02/28/2012 Yes Yes
1860 PG&E Level 2 FC TBD
(Directed) 800 02/28/2012 Yes Yes
PY10-028 SCE Level 2 FC TBD
(Directed) 600 03/28/2012 Yes Yes
PY10-011 SCE Level 2 FC TBD
(Directed) 210 03/28/2012 Yes Yes

SGIP Semi-Annual Renewable Fuel Use Report No. 21
Itron, Inc. Appendix A-8 SGIP RFU Report No. 21
Res No. PA Incentive
Level Tech Renewable Fuel Type
Capacity (kW)
Operational Date*
RFUR Project?
Any Non-Renewable
Fuel Supply?
PY09-013 SCE Level 2 FC DG - WWTP 600 03/28/2012 Yes Yes
PGE-SGIP-
2011-1950 PG&E Level 2 FC Landfill Gas (Directed) 500 04/11/2012 Yes Yes
CCSE-0399-10 CCSE Level 2 FC
TBD (Directed) 630 05/01/2012 Yes Yes
CCSE-0398-10 CCSE Level 2 FC
TBD (Directed) 420 05/01/2012 Yes Yes
PY07-006 SCE Level 2 MT Landfill Gas 750 06/12/2012 Yes No
PY10-039 SCE Level 2 FC TBD
(Directed) 315 08/08/2012 Yes Yes
PY10-038 SCE Level 2 FC TBD
(Directed) 630 10/04/2012 Yes Yes
SCE-SGIP-2011-0334 SCE Level 2 FC DG - WWTP 250 11/09/2012 Yes Yes
1867 PG&E Level 2 FC DG - WWTP 1400 11/29/2012 Yes Yes
PY10-035 SCE Level 2 FC TBD
(Directed) 1110 12/17/2012 Yes Yes
PY10-041 SCE Level 2 FC TBD
(Directed) 840 12/24/2012 Yes Yes
PY10-037 SCE Level 2 FC TBD
(Directed) 1050 12/24/2012 Yes Yes
* Since assignment of a project’s operational date is subject to individual judgment, the incentive payment date as reported by the PAs is used as a proxy for the operational date for reporting purposes.