Embed Size (px)
Citation preview

Fressnius' ,Journal of Fresenius J Anal Chem (1992) 342:597--600
Selective spectrofluorimetric determination of zinc in biological samples by Flow Injection Analysis (FIA)
© Springer-Verlag 1992
P. Fernfindez, C. P6rez Conde, A. Guti6rrez, and C. Cfimara
Dcpartamento de Quimica Analitica, Facultad de Ciencias Quimicas de la Universidad Complutense, E-28040 Madrid, Spain
Received June 17, 1991
Summary. The automatization of a spectrofluorimetric method for the determination of zinc at trace level is de- scribed. It is based on the formation of the fluorescent complex Zn(II)-5,7-dibromo-8-quinolinol [Zn(II)-DBQ] followed by extraction into diethylether using flow injection analysis. The optimum fluorescent emission is reached in hexamethylenetetramine (H2MTA+/HMTA) buffer pH 6.0. A membrane phase separator was used. The calibration graph is linear up to 1.5 ~tg/ml of Zn(II). The proposed method (detection limit 3 ng/ml) is very selective and has been successfully applied to determine Zn(II) in biological samples, tap waters and various food items.
Introduction
Development in flow injection analysis (FIA) has been astonishing this decade, partly as a result of two of its mayor features: simplicity and versatility. These advantages are increased when continuous liquid-liquid extraction is used. The FIA method avoids the problems involved in a batch method: tedious procedures, sample contamination, high reagent consumption, etc.
As zinc is an essential element [1], its monitoring in biological samples, food items, drinking waters, etc. is of great interest to determine possible deficiencies of this ele- ment.
The determination of Zn(II) by automatized analytical methods has usually been carried out by atomic absorption spectrometry [2, 3], inductively coupled plasma [4] and spectrophotometry [5]. Nevertheless, these techniques usu- ally tack sensitivity when determining very low concentra- tions of this element in food and other biological samples.
The spectrofluorimetric technique potentially provides a very high sensitivity for this analyte at ultratrace level [6]. One of the most sensitive methods is based on the formation of a complex in the presence of surfactants [7]. However, this complex is not suitable for automatization due to its slow kinetics. Other fluorescent reagents for Zn (II) are 8- quinolinol and its derivates.
A previous work made in our laboratory [8] showed that 5,7-dibromo-8-quinolinol (DBQ) gives a highly sensitive fluorescent chelate in diethylether as compared with other 8-quinolinol derivates. So far no automatic fluorimetric method for zinc analysis has been reported in the literature. This study was undertaken to develop an automatic method
Offprint requests to." C. Citmara
for measuring zinc in biological samples, based on the extrac- tion of its fluorescent 5,7-dibromo-8-quinolinol complex into diethylether.
Experimental
Reagents and solutions
Zn(II) stock solution (1.12 × 10 -2 mol/1), prepared by dis- solving the appropriate amount of Zn(NO3)2 in deionized water. Its concentration was determinated by titration with EDTA. Standard solutions were prepared by diluting this stock solution.
5,7-Dibromo-8-quinolinol (DBQ) (Flucka) solution, 0.05% (w/v) in diethylether (Carlo Erba).
Buffer, 0.5mol/1 hexamethylenetetramine (HMTA) (Merck) acidified with perchloric acid (Merck) to pH 6.0.
All chemicals were of analytical reagent grade and deionized water (milli-Q water) was used throughout.
Apparatus
Fluorimetric data were recorded with a Perkin-Elmer Model MPF-44A spectrofluorimeter equipped with a Hellma flow- cell (optical path I cm, inner volume 18 ~tl) and connected to a Perkin-Elmer 56 recorder.
A Gilson HP4 peristaltic pump and an Omnifit injection valve (six-way) were used.
Teflon tubes (i.d. 0.5 mm) and connectors were employed to build the manifold.
A displacement flask (Omnifit) and a laboratory made phase separator were used [9].
Flow injection system
A schematic diagram of the flow injection system is shown in Fig. 1. The sample solution was injected from an injection valve (A) into a carrier solution. The organic phase was pumped from a displacement flask (E) and mixed with the aqueous phase in an extraction coil (C). The stream leaving the extraction coil was treated in a membrane separator (D) to separate the alternative aqueous and organic phases. Then the fluorescence of the organic stream was measured in the flow cell in the fluorimeter (F).
Procedures
Sample mineralization. About 0.25 g of sample (H-4 animal muscle, A-I 1 milk powder and H-9 whole diet sample) were
598
H2MTA÷/HMTA
H 2 0
S o l u t i o n I S o m p J e
R e j e c t
1 D B Q / E t h e r
E
Fig. 1. Scheme of the FIA system with liquid-liquid extraction for Zn(II) determination. A injection valve; B segrnenter; C reaction coil; D phase separator; E displacement flask; F fluorimeter
accurately weighed into a small porcelain crucible and kept in a muffle furnace at 500°C for 2 h. The residues obtained were dissolved in 0.5 ml of conc. nitric acid and the volume completed in a 25 ml volumetric flask with Milli-Q water [10].
Determination of Zn(II). A volume of 125 gl of different samples was injected into a 0.5 tool/1 H2MTA+/HMTA carrier solution (pt{ 6.0) whose flow rate was 0.62 ml/min. The organic phase (0.05% DBQ in diethylether) was pumped at 0.36ml/min. After extraction, the two phases were separated and the organic phase, containing the complex, passed through the flow cell to give the fluorescent signal which was measured as peak height (Xex = 410 nm; )~em = 550 rim). The manifold shown in Fig. I was used. Sample concentration was extrapolated from the calibration graph [3 • 10-3 to 1 ~tg/ml of Zn(II)], obtained by the same proce- dure.
Results and discussion
All variables, both chemical and physical, that might affect the yield of the on-line extraction process were studied.
140-
120
I00-
8 0
IF 60-
40 -
0 & . - - T ', I I I I
2 4 6 8 10 12 14
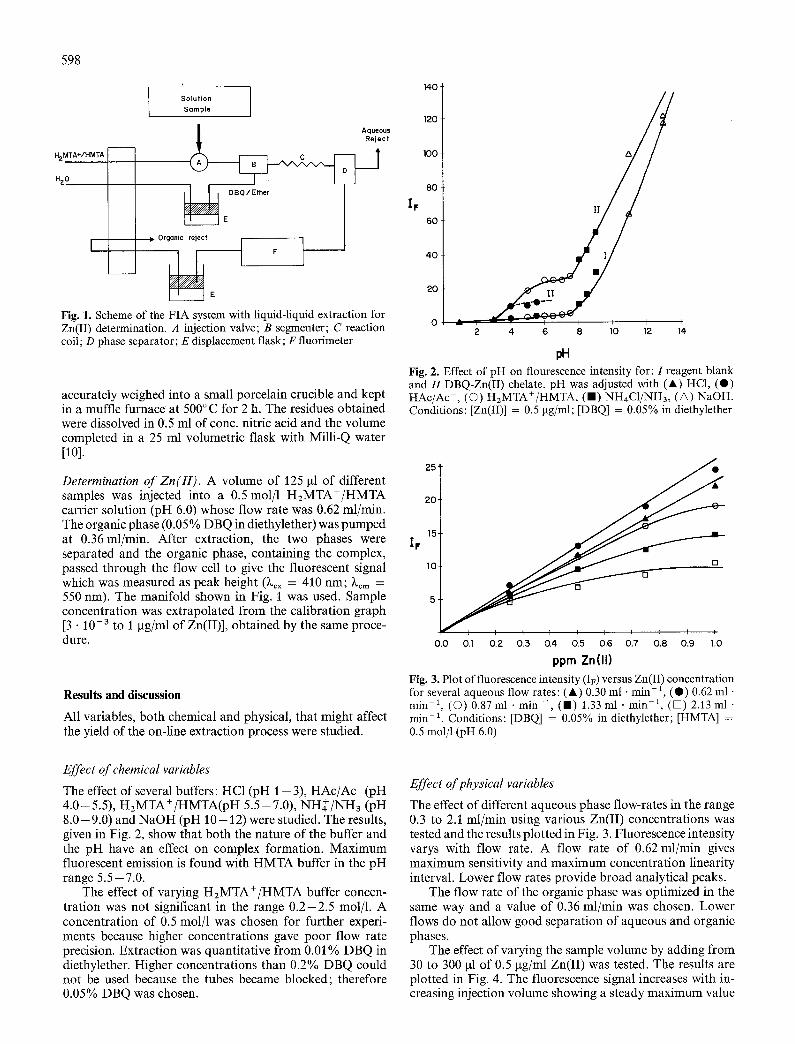
pH Fig. 2. Effect of pH on flourescence intensity for: I reagent blank and H DBQ-Zn(II) chelate, pH was adjusted with (A) HC1, (0) HAc/Ac-, (O) H2MTA+/HMTA, ( I ) NH4C1/NH3, (A) NaOH. Conditions: [Zn(II)] = 0.5 gg/ml; [DBQI = 0.05% in diethylether
25
2O
15 IT
'i l L I I I I I I [ I
0.0 0.1 o.a 0.3 0.4 o.s 0.6 0.7 0.8 0.9 ~.0
ppm Zn( l l )
Fig. 3. Plot of fluorescence intensity (Iv) versus Zn(II) concentration for several aqueous flow rates: (A) 0.30 ml - rain -1, (0) 0.62 ml • rain -1, (©) 0.87 ml • min -1, (11) 1.33 ml • min -1, ([~) 2.13 ml • rain-1. Conditions: [DBQ] = 0.05% in diethylether; [HMTA] = 0.5 mol/l (pH 6.0)
Effect of chemical variables
The effect of several buffers: HC1 (pH 1 - 3 ) , HAc/Ac- (pH 4 . 0 - 5.5), H2MTA +/HMTA(pH 5.5 - 7.0), NH~-/NH3 (pH 8.0-9.0) and NaOH (pH 10-12) were studied. The results, given in Fig. 2, show that both the nature of the buffer and the pH have an effect on complex formation. Maximum fluorescent emission is found with HMTA buffer in the pH range 5.5-7.0.
The effect of varying H2MTA+/HMTA buffer concen- tration was not significant in the range 0 .2 -2 .5 mol/1. A concentration of 0.5 tool/1 was chosen for further experi- ments because higher concentrations gave poor flow rate precision. Extraction was quantitative from 0.01% DBQ in diethylether. Higher concentrations than 0.2% DBQ could not be used because the tubes became blocked; therefore 0.05% DBQ was chosen.
Effect of physical variables
The effect of different aqueous phase flow-rates in the range 0.3 to 2.1 ml/min using various Zn(II) concentrations was tested and the results plotted in Fig. 3. Fluorescence intensity varys with flow rate. A flow rate of 0.62 ml/min gives maximum sensitivity and maximum concentration linearity interval. Lower flow rates provide broad analytical peaks.
The flow rate of the organic phase was optimized in the same way and a value of 0.36 ml/min was chosen. Lower flows do not allow good separation of aqueous and organic phases.
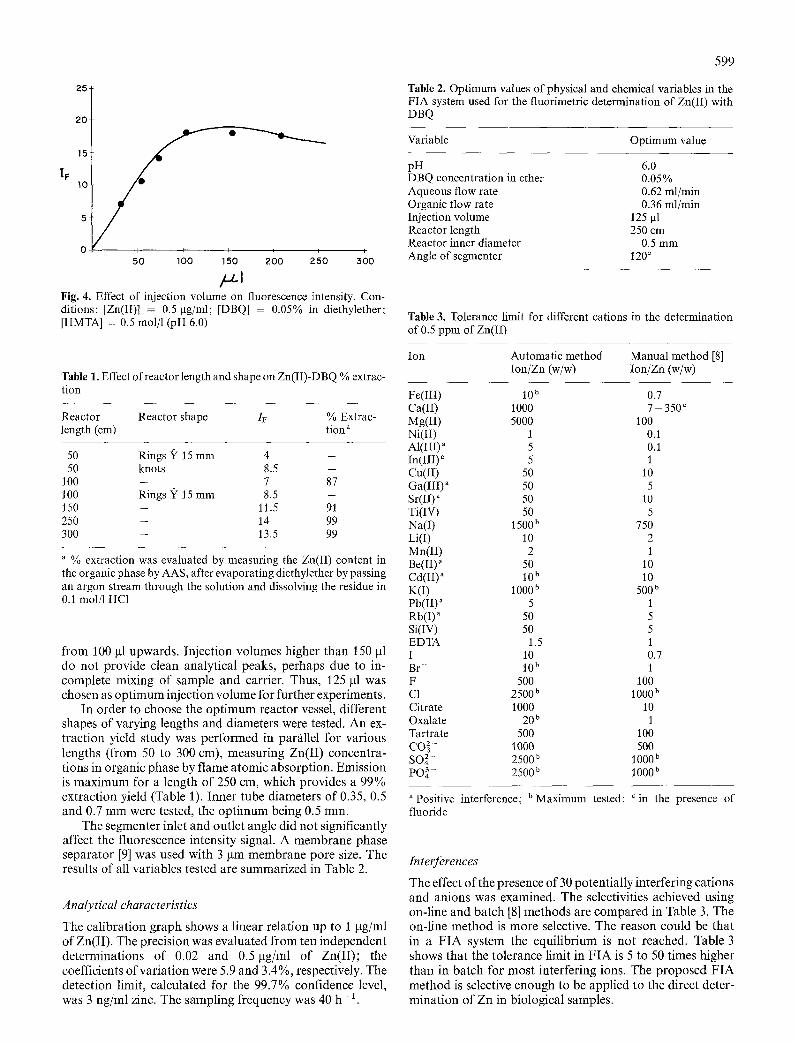
The effect of varying the sample volume by adding from 30 to 300 ~tl of 0.5 gg/ml Zn(II) was tested. The results are plotted in Fig. 4. The fluorescence signal increases with in- creasing injection volume showing a steady maximum value
599
25
2O
15
IF 10
5
0 I i i i
5 0 lO0 1 5 0 200 250 .300
/.1.1 Fig. 4. Effect of injection volume on fluorescence intensity. Con- ditions: [Zn(II)] = 0.5 ~tg/ml; [DBQ] = 0.05% in diethylether; [HMTA] = 0.5 tool/1 (pH 6.0)
Table 2. Optimum values of physical and chemical variables in the FIA system used for the fluorimetric determination of Zn(II) with DBQ
Variable Optimum value
pH 6.0 DBQ concentration in ether 0.05% Aqueous flow rate 0.62 ml/min Organic flow rate 0.36 ml/min Injection volume 125 btl Reactor length 250 cm Reactor inner diameter 0.5 mm Angle of segmenter 120 °
Table 3. Tolerance limit for different cations in the determination of 0.5 ppm of Zn(II)
Table 1. Effect of reactor length and shape on Zn(II)-DBQ % extrac- tion
Reactor Reactor shape Iv % Extrac- length (cm) tion a
50 Rings S f l 5 m m 4 - 50 knots 8.5 -
100 - 7 87 100 Rings Y t 5 m m 8.5 - 150 - 11.5 91 250 - 14 99 300 - 13.5 99
a % extraction was evaluated by measuring the Zn(II) content in the organic phase by AAS, after evaporating diethylether by passing an argon stream through the solution and dissolving the residue in 0.1 mol/1 HC1
from 100 btl upwards. Inject ion volumes higher than 150 btl do not provide clean analytical peaks, perhaps due to in- complete mixing of sample and carrier. Thus, 125 btl was chosen as op t imum injection volume for further experiments.
In order to choose the op t imum reactor vessel, different shapes of varying lengths and diameters were tested. A n ex- t ract ion yield s tudy was performed in par~tllel for various lengths (from 50 to 300 cm), measuring Zn(II) concentra- tions in organic phase by flame atomic absorpt ion. Emission is maximum for a length of 250 cm, which provides a 99% extract ion yield (Table 1). Inner tube diameters of 0.35, 0.5 and 0.7 mm were tested, the op t imum being 0.5 mm.
The segmenter inlet and outlet angle did not significantly affect the fluorescence intensity signal. A membrane phase separa tor [9] was used with 3 ~tm membrane pore size. The results of all variables tested are summarized in Table 2.
Analytical characteristics
The cal ibrat ion graph shows a l inear relat ion up to 1 gg/ml of Zn(II). The precision was evaluated from ten independent determinat ions of 0.02 and 0.5txg/ml of Zn(II) ; the coefficients of var ia t ion were 5.9 and 3.4%, respectively. The detection limit, calculated for the 99.7% confidence level, was 3 ng/ml zinc. The sampling frequency was 40 h - 1.
Ion Automatic method Manual method [8] Ion/Zn (w/w) Ion/Zn (w/w)
Fe(III) 10 b 0.7 Ca(II) 1000 7 - 350 c Mg(II) 5000 t00 Ni(II) 1 0.t AI(III)" 5 0.1 In(III) a 5 t Cu(II) 50 10 Ga(III)" 50 5 Sr(II) a 50 10 Ti(IV) 50 5 Na(I) t 500 b 750 Li(I) 10 2 Mn(II) 2 t Be(II) a 50 10 Cd(II) a t 0 b t 0 K(I) 1000 b 500 b Pb(II)" 5 t Rb(I) ~ 50 5 Si(IV) 50 5 EDTA 1.5 t I - t0 0.7 Br- l 0 b t
F - 500 100 C 1 - 2 5 0 0 b 1 0 0 0 b
Citrate 1000 t0 Oxalate 20 b 1 Tartrate 500 100 CO g- 1000 500 SO 2- 2500b 1000 b PO~- 2500 h t 000 b
a Positive interference; b Maximum tested; c in the presence of fluoride
Interferences
The effect of the presence of 30 potent ia l ly interfering cat ions and anions was examined. The selectivities achieved using on-line and batch [8] methods are compared in Table 3. The on-line method is more selective. The reason could be that in a F I A system the equil ibrium is not reached. Table 3 shows that the tolerance limit in F I A is 5 to 50 times higher than in batch for most interfering ions. The p roposed F I A method is selective enough to be appl ied to the direct deter- mina t ion of Zn in biological samples.

600
Table 4. Determination of the Zn(II) content in several samples using the spectrofluorimetric method and compared with FAAS and certified samples. Results (X)a are expressed in gg/g
Sample FIA-Fluor FAAS Certified value
X" C.V. X" C.V. X C.V.
Tap water 0.17 2.9 0.17 2.0 - - - Well water 0.14 3.6 0.13 2.0 - H-4 Muscle 87.6 1.0 86.0 3.5 A-11 Powder milk 38.9 3.7 38.9 4.7 H-9 Diet 27.3 2.4 27.6 7.9
a Average of six determinations
Applications
The method described was successfully appl ied to the deter- minat ion of Zn in whole human diets and some biological materials, using the dry mineral izat ion procedure described above [10]. The results (Table 4) show that there are no significant differences between the values obta ined by the fiuorimetric method and certified values or those verified by other methods at the 95% confidence level.
Conclusions
The method is fairly selective for determining Zn(II) in bio- logical samples and food samples and provides results which agree with those obtained using alternative methods or certified values. The main features of the p roposed F I A fluorimetric method are: high sampling frequency (40 h - 1), low detect ion limit (3 ng/ml), good precision, high selectivity, and low sample and reagent consumption. I t offers a selective, simple, economic and rapid al ternative to other existing methods for the determinat ion of Zn(II).
Acknowledgements. The authors wish to thank CICYT for their financial support under contract No. PB 88/0094 and Max Gorman for the revision of this manuscript.
References
1. IAEA (1980) Elemental Analysis of Biological Materials. Tech Rep Ser, Vienna
2. Araujo AN, Lima JL (1989) J Trace Elem 3:97 3. Andrade JC, Strong FC, Martin NJ (1990) Talanta 37(7):711 4. Wang X, Barnes RM (1989) J Anal At Spectrom 4:509 5. Ferreira JR, Guidetti EA, Zezzi MA, Boscolo SM (1990)
Analyst 115 : 779 6. Fern~mdez Guti6rrez A, Mufioz de la Pefia A (1985) In:
Shulman SG (ed) Molecular luminescence spectroscopy: method and applications, part I. Wiley, New York, p 423
7. Hern~ndez F, Medina J, Gasc6 MT (1986) Talanta (33): 537 8. Fernfindez P, P6rez-Conde C, Guti6rrez AM, Cfimara C (1986)
J Mol Struct 143 : 549 9. de Le6n E, Separator ofinmixing liquid phases. Es. P.-8900971
10. Fernfindez P, P6rez-Conde C, Guti6rrez AM, Cfimara C (1989) Talanta 36 : 960