Embed Size (px)
Citation preview

SELECTIVE LOADING OF ORGANOFILIC Ag
NANOPARTICLES IN PS/PMMA BLENDS
A Thesis Submitted to
the Graduate School of Engineering and Sciences of
İzmir Institute of Technology
in Partial Fulfillment of the Requirements for the Degree of
MASTER OF SCIENCE
in Material Science and Engineering
by
Şeyda TÜZÜNER
September 2014
İZMİR

We approve the thesis of Şeyda TÜZÜNER
Examining Committee Members:
________________________
Prof. Dr. Mustafa M. DEMİR
Department of Material Science and Engineering,
İzmir Institute of Technology
_______________________________________
Assist. Prof. Dr. Yaşar AKDOĞAN
Department of Material Science and Engineering,
İzmir Institute of Technology
____________________________________
Assoc. Prof . Dr. Mustafa EMRULLAHOĞLU
Department of Chemistry, İzmir Institute of Technology
19 September 2014
________________________ ________________________
Prof. Dr. Mustafa M. DEMİR Asisst. Prof. Dr. Özgenç EBİL
Supervisor, Department of Material Science Co-Advisor, Department of
and Engineering, İzmir Institute of Technology Chemical Engineering, İzmir
Institute of Technology
_____________________________ ___________________________
Prof. Dr. Mustafa M. DEMİR Prof. Dr. R. Tuğrul SENGER
Head of the Department of Dean of the Graduate School of
Material Science and Engineering Engineering and Science

ACKNOWLEDGEMENTS
I would like to thank my supervisor Prof. Dr. Mustafa M. DEMİR, for this
supervision, guidance, endless support, and encouragement throughout my thesis study.
Also I would like to thank to my co-advisor Assist. Prof. Dr. Özgenç EBİL for
his kind support, guidance for helping to me.
Special thanks to group members of Material Research Center, Işın ÖZÇELİK,
Mine BAHÇECİ and Sinem HORTOĞLU for their scientific guidance, helping in
analysis and valuable comments.
Besides, I would like to thank my friends; Assist. Prof. Dr. Nesrin HORZUM
POLAT, Özlem KAP, Tuğba ISIK, Derya METE, Aslı ÇELİK, Anıl İNCEL, Alper
İNAN and Emine BERBER for their helps and friendship during laboratory studies.
Finally, I am also grateful to my husband and my parents for their endless love,
supports, patience and encouragements. I dedicate my thesis at first to my parents, Ali
and Çağlayan BAĞCI and then to my husband (my sweet pie), İbrahim TÜZÜNER.

iv
ABSTRACT
SELECTIVE LOADING OF ORGANOPHILIC
Ag NANOPARTICLES IN PS/PMMA BLENDS
The association of nanoparticles with polymer blends offers significant features
beyond the advantages of polymer composites prepared by single homopolymer. Since
the blends undergo phase separation due to incompatibility of the constituent polymers
into various internal structures, the particles can be segregated into one of the phases.
Different location of the particles allows to develop novel microstructures; and thus,
control over physical properties. In this study, Ag nanoparticles were prepared by
reduction of AgNO3 via NaBH4. The particles were capped by cetyl ammonium
bromide (CTAB) and were mixed with equimass blend of polystyrene (PS) and
poly(methyl methacrylate) (PMMA) in tetrahydrofurane (THF). The solid content of
blend solution was fixed at 2.5% w/v. The concentration of the particles with respect to
polymer blend was at 0.7 wt %. The composite film was cast on glass slide. Surface
feature of the composite films was examined by atomic force microscopy (AFM) and
scanning electron microscopy (SEM). The surface of blend film without particles shows
spherical pits with a size of 4.5 μm and rich in terms of PMMA. When particle size was
small (diameter is around 20 nm), they preferentially located at the interface of the
domains. The large particles with a diameter of 90 nm were found to locate in PMMA
phase. Upon annealing of the composite film at 165 ˚C for 3 days, the particles move to
the PS domains independent of the particle size and merely PS loaded composite is
achieved.

v
ÖZET
ORGANOFİLİK Ag NANOTANECİKLERİN PS/PMMA
KARIŞIMLARI İÇERİSİNDEKİ SEÇİMLİ YÜKLENMESİ
Nanotaneciklerin polimer karışımlarıyla birleşimi tek tür homopolimerlerle
hazırlanan polimer kompozitlerin avantajlarının ötesinde malzemeye önemli özellikler
sunar. Çeşitli iç yapılar içinde bileşen polimerlerin uyumsuzluğu nedeniyle bu
karışımlar faz ayırımı gösterdikleri için tanecikler, fazlardan birinde bulunabilirler.
Taneciklerin farklı yerleşimleri yeni mikro yapıların gelişimine; bu nedenle de fiziksel
özellikleri üzerindeki kontrolüne izin verir. Bu çalışmada, Ag nanotanecikler, AgNO3’ın
indirgenmesiyle hazırlandı. Bu taneciklerin yüzeyi hexadecyltrimethylammonium
bromide (CTAB) ile kaplandı ve tetra hidro furan (THF) içinde eşit kütleli polistiren
(PS) ve polimetil metakrilat (PMMA) ile karıştırıldı. Karışım solüsyonunun katı içeriği
%2.5 w/v. Taneciklerin polimer karışımlarına oranla konsantrasyonu % 0,7. Kompozit
film cam yüzeye dökülerek hazırlandı. Kompozit filmlerin yüzey özellikleri atomik
kuvvet mikroskopu (AFM) ve taramalı elektron mikroskopuyla (SEM) incelendi.
Tanecik içermeyen kompozit filmlerin yüzeyi PMMA açısında zengin ve PS fazlar 4,5
μm çapında yuvarlak çukurlar şeklinde olduğu gözlemlendi. Tanecik boyutu küçük
olduğunda (yaklaşık 20 nm), tanecikler tercihen fazların arayüzeylerine yerleştiler. 90
nm çapında daha büyük parçacıklar ise PMMA fazının içinde bulundular.
Nanokompozit filmleri 165 ˚C de 3 gün tavlandıktan sonra, tanecikler boyuttan
bağımsız PS fazına taşındılar ve sadece PS yönelimli kompozitler elde edildi.

vi
TABLE OF CONTENTS
LIST OF FIGURES ........................................................................................................ vii
LIST OF TABLES ........................................................................................................... ix
CHAPTER 1 INTRODUCTION ...................................................................................... 1
1.1.Phase Separation of Polymer Blends .............................................. 3
1.2. Literature Review on BCP/nanoparticle composite systems......... 6
1.2.1. Thermodynamics of Polymer/Particle Composites ................ 10
CHAPTER 2 EXPERIMENTAL STUDY .................................................................... 13
2.1. Chemical and Reagents ............................................................... 13
2.2. Sythesis of Organophilic Silver Nanoparticles............................ 13
2.3.Preparation of Ag/PS-PMMA Blends of The Composite Films .. 14
2.4.Characterization of Samples ......................................................... 15
CHAPTER 3 RESULTS AND DISCUSSION ............................................................... 17
3.1.Synthesis of Ag Nanoparticles ..................................................... 17
3.2.PMMA/PS Blends ........................................................................ 26
3.3.Nanocomposites prepared by PS-PMMA blend and Ag
nanoparticles ................................................................................ 27
CHAPTER 4 CONCLUSION ........................................................................................ 36
REFERENCES ...............................................................................................................37

vii
LIST OF FIGURES
Figure Page
Figure 1.1. Phase Diagram of PS/PMMA polymer blend ............................................ ....5
Figure 1.2. Structural model of PS/PMMA blends as spin-cast a) and upon
annealing above the glass transition temperature in early stage b) and
later stage c). Arrows indicate the movements of the PS-rich and
PMMA-rich domains at their interface .......................................................... 7
Figure 1.3. AFM images of the surface topography of PS and PMMA in single
component and blended thin films cast from 1% (w/v) solution ................... 8
Figure 1.4. AFM images of a dip-coated a) PS film (with film thickness A=60
nm), b)PS25%:PMMA75% film (with film thickness A=40 nm),
c)PS50%:PMMA50% film (film thickness A=40 nm), d)
PS75%:PMMA25% film (film thickness A=80 nm) on crystalline
Si(100), e) PS75%:PMMA25% film (film thickness A=20 nm) on
silica. .............................................................................................................. 9
Figure 1.5. SEM images of dPMMA:SAN films with 10 wt% MST (b,c) and 10
wt% P2K (d, e) ............................................................................................ 10
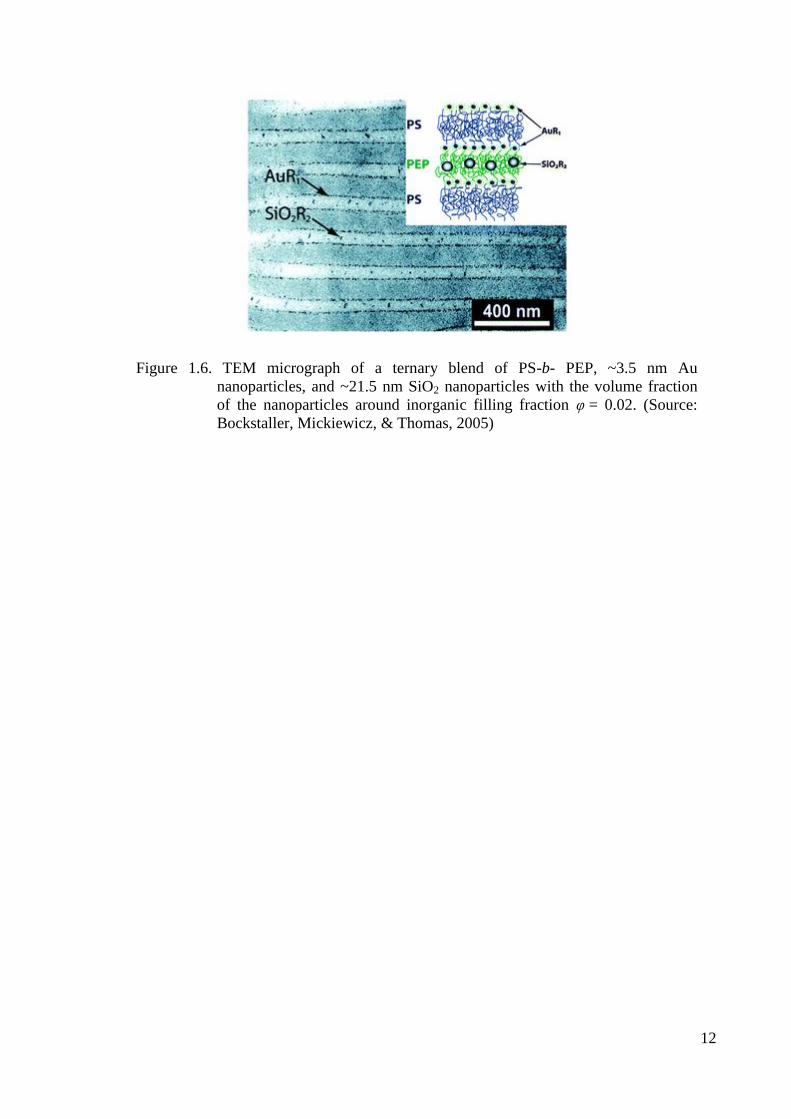
Figure 1.6. TEM micrograph of a ternary blend of PS-b- PEP, ~3.5 nm Au
nanoparticles, and ~21.5 nm SiO2 nanoparticles with the volume
fraction of the nanoparticles around inorganic filling fraction φ = 0.02 ...... 12
Figure 2.1. Schematic representation of reaction A) Synthesis of Ag Nanoparticles
and B) Coating surface of Ag NPs with CTAB. .......................................... 14
Figure 2.2. Schematic representation of cast film process ............................................. 15
Figure 3.1. TEM image of Ag nanoparticles .................................................................. 18
Figure 3.2. DLS number Size distribution of Ag and CTAB capped Ag particles. ....... 18
Figure 3.3. NMR spectra for Ag/CTAB NPs with different carbon atom. ..................... 19
Figure 3.4. Absorbance spectrum of before functionalization with CTAB and after
CTAB treatment. a) Ag nanoparticles dispersion in water, b)
Ag/CTAB NPs. ............................................................................................ 20
Figure 3.5. Surface potential values; black line: before functionalization with
redline: after CTAB treatment. .................................................................... 21
Figure 3.6. Surface potential values by adding different volume of CTAB solution. .. 22

viii
Figure 3.7. a) SEM Image of Ag nanoparticles, 1μm b) SEM images of
agglomerated Ag nanoparticles, 1μm. ...................................................... 23
Figure 3.8. a) STEM Image of Ag nanoparticles b) STEM images of Ag/CTAB
nanoparticles. The scale bars refer to 200 nm. .......................................... 23
Figure 3.9. EDX result of Spectrum 6) 2 mM of CTAB capped Ag nanoparticles
b) 0.02 M of CTAB capped with Ag Nanoparticles. ................................ 24
Figure 3.10. TGA results of Ag/CTAB NPs .................................................................. 25
Figure 3.11. Tapping mode AFM images of PS(5x5 μm) and PS:PMMA(50x50μm) .. 26
Figure 3.12. Glass transition temperature of polymer nanocomposite films. ................ 28
Figure 3.13. Tapping mode AFM images of AG/CTAB-PS/ PMMA
nanocomposite films at 25 ˚C, the particles in a) and b) in PMMA
domain. ...................................................................................................... 29
Figure 3.14. Tapping mode AFM images of Ag/CTAB-PS/ PMMA
nanocomposite films at 25 ˚C, the particles in a) and b) at interface. ..... 30
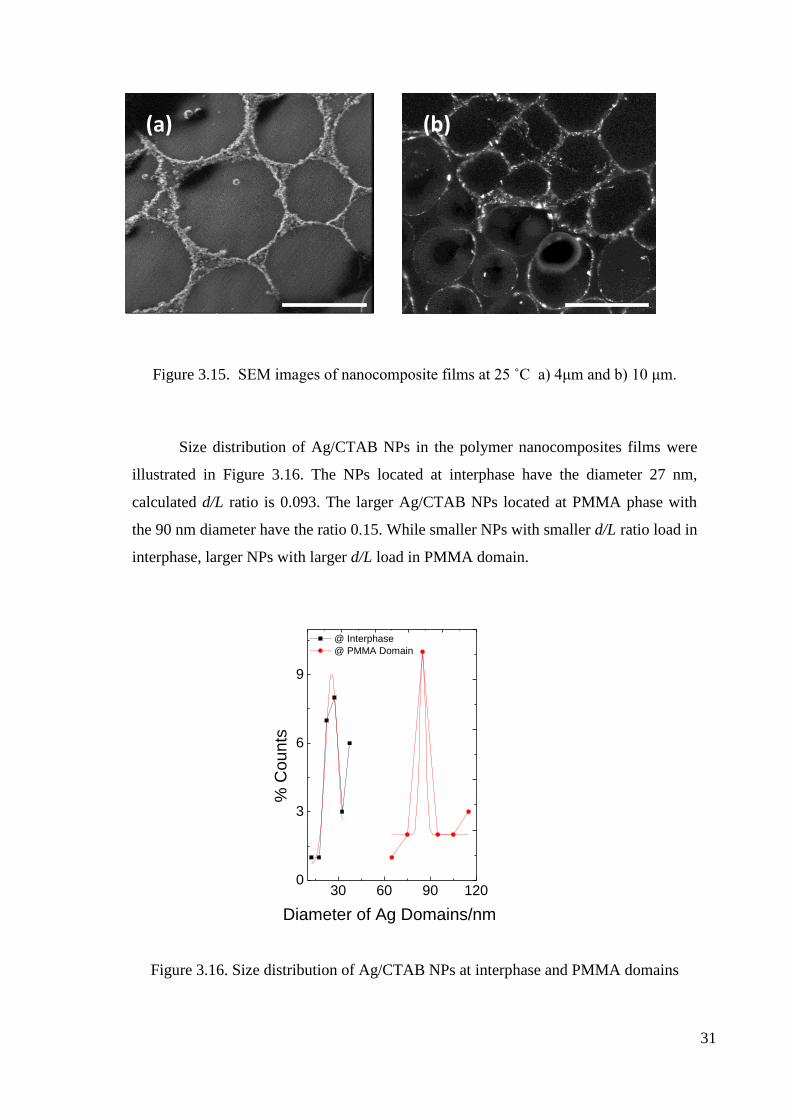
Figure 3.15. SEM images of nanocomposite films at 25 ˚C a) 4μm and b) 10 μm. ..... 31
Figure 3.16. Size distribution of Ag/CTAB NPs at interphase and PMMA domains .... 31
Figure 3.17. Tapping mode AFM images of Ag/CTAB-PS/ PMMA
nanocomposite films at 165 ˚C. ................................................................. 32
Figure 3.18. Size distribution of PS domains in polymer nanocomposite films. .......... 34
Figure 3.19. TGA result of the polymer nanocomposite films at 25 ˚C and 165 ˚C. .... 35

ix
LIST OF TABLES
Table Page
Table 3.1 The weight loss processes of pure CTAB and the Ag/CTAB NPs sample with
their assignments in TGA experiment............... ............................................. 25
Table 3.2. Surface tension of polymers and the surfactant at different temperature ...... 27
Table 3.3. Interfacial tension and wetting coefficient of polymer .................................. 33
1
1. CHAPTER 1
INTRODUCTION
Polymer nanocomposites are produced by the combination of at least two
dissimilar materials such that one of them has nanoscopic dimensions. They attract
significant attention due to their flexibility in fabrication of novel materials with novel
physical properties such as higher conductivity, better mechanical and scratch
properties, better absorption/emission properties (Demir & Wegner, 2012).
The distribution of inorganic nanoparticles in polymer matrix determines the
final properties of composites. Homogenous particle distribution is required for
maximum performance.
When nanosized particles are dispersed into a homopolymer, the particles are
randomly dispersed into the matrix volume. When polymer matrix is a block copolymer
or a polymer blend where a phase separation takes place, the particles have choice to be
present in any of the polymer phases. Since the fabrication of block copolymer is
demanding in large scale, the employment of a polymer blend can be readily used to
obtain different polymer phases and selective loading of the particles into the polymer
volume. In other words, the blends to meet market requirements; they are seen faster
and cheaper way rather than new polymer synthesis, and they offer the possibility to
increase the mechanical properties of the material, fracture and chemical resistance,
thermal properties. In this study, we employed two immiscible polymers. One of them
is polystyrene (PS), which is an amorphous polymer with high thermal and radiation
resistance. The other one is poly (methyl methacrylate) (PMMA) that has high
transparency, high chemical and corrosion resistance to abrasion, light transmittance
and insulation. By blending these two polymers, superior physical properties can be
obtained.

2
Phase separation of polymer blends depends on following physical effects:
Molecular weight of polymers longer chains are less mobile and metastable structure
may be more important during annealing.
Composition Ratio: The majority component has a tendency to form a continuous
matrix phase.
Substrate Surface Energy: PS prefers hydrophobic substrate such as H-terminated Si,
While PMMA prefers hydrophilic substrates such as the Si-O and Si-OH terminated
native oxide layer of a Si wafer (denoted SiOx ). When PS/PMMA thin films are casted
on a Si wafer with a native oxide surface, expected that the PMMA tends to segregate to
the substrate.
Choice of Solvent: This affects the evaporation characteristics and inhomogenity of
components in spun-cast polymer blend films
Annealing Procedure: Temperatures above the glass transition temperature (~110 ˚C
for PS and PMMA) are required for the polymer chains to become mobile. Increasing
Mw of polymers, annealing time is also increased to approach equilibrium.(Morin et al.,
2001)
Due to the larger interfacial energy with respect to surface energy difference
between them, two materials will have a strong tendency to extend phase segregation
right to the surface. The bulk and surface immiscibility are crucial in nanoscale
pattering. This material combination is important for industrial applications. For
instance, while PS-b-PMMA diblock copolymers are used in fabrication of high density
magnetic storage media, phase separated PS/PMMA blends have been proposed as
antireflection coatings.
Metallic nanoparticles show size and shape-dependent properties that are of
interest for applications ranging from catalyst and sensing to optics, antibacterial
activity and data storage(De Gryse et al., 2008). Silver nanoparticles have received
considerable attention in their different physical, chemical and physicochemical
characteristics such as increased optical, electromagnetic and catalytic properties from
the bulk materials (Choi et al., 2008).
In this work, we performed a proof of concept study for the selective loading of
as prepared Ag particles into the polymer blends
3
1.1. Phase Separation of Polymer Blends
Polymer blends exhibit phase separation due to the repulsive interaction between
the components such as the chemical incompatibility between the polymers. The most
relevant theory for representing the free energy of binary polymer mixtures is the Flory
Huggins Theory.
wAB = 2
1 (εAA + εBB ) – εAB and χAB =
kT
zwAB
where εij is energy of contacts between components, i and j, wAB is the exchange energy
of interacting segments. Flory-Huggins interaction parameter, χAB ; z is coordination
number assumed equal to 8, k and T are Boltzmann constant and temperature
respectively.
The basic relationship governing mixtures of polymers;
∆Gmix = ∆Hmix - T∆Smix
where ∆Gmix is the free energy of mixing, ∆Hmix is the enthalpy of mixing (heat of
mixing) and ∆Smix is the entropy of mixing. When ∆Gmix is greater than 0, phase
separation occurs.
The determination of the entropy of mixing begins with the Boltzmann relationship:
∆Smix = k lnΩ
Ω = !!
!
BA NN
N
where the N0 is number of atoms,
∆Smix = k [ln N0!– (ln NA! + ln NB! )]
Using Stirling’s approximation
∆Smix= k [(N0ln N0 – N0) – NAln NA – NBln NB )]
Recognizing that N0=NA+NB;
∆Smix= k [(NA+NB) ln N0 – NA ln NA – NB ln NB
= k [ - NA (ln NA - ln N0) – NB (ln NB - ln N0)]

4
= - k [NA ln 0N
N A + NB ln 0N
N B ]
∆Smix = - k N0 ( B
B
BA
A
A nv
nv
)
where and are volume fraction and molecular volume of segments of polymers
respectively.
∆ Smix = - R (B
B
BA
A
A nv
nv
)
∆Hmix= RTχAB BA
∆Gmix = RT B
B
BA
A
A nv
nv
χAB BA )
For polymers, the miscibility can only be achieved when χ < χcr. The χ parameter
at the critical point χcr can be obtained from the phase diagrams.
χcr = 2
1)
11(
21 rr
where ri is the number of polymer segments (which is proportional to the degree of
polymerization).
For instance, PE/EVA blends under investigations in this work are blends of a
homopolymer and a copolymer (PE/ExVA1-x). The effective interaction parameter χ
between the homopolymer and the copolymer is given by:
χ = xχEE + (1-x) χEV – x(1-x) χEV
where χij are the segmental interaction parameters and x is the copolymer composition
in mol.-%. χEE = 0 in the case of PE/EVA blends and therefore the effective interaction
parameter χ is equal to:
χ = (1-x) χEV – x(1-x) χEV
And as already mentioned, the polymers are miscible when χ < χcr.

5
Figure 1.1. Phase Diagram of PS/PMMA polymer blend.
(Source: Ha, Atallah, & Krishnamoorti, 2011)Source: (Ha, Atallah,
& Krishnamoorti, 2011)
A schematic phase diagram of PS and PMMA is shown in Figure 1.1, phase
separation occurs from 0 ˚C to 500 ˚C when volume fraction PS is 0.5. That is why the
volume fraction was 0.5 through our study.
In the following is enthalpic interaction between nanoparticles and polymers in
blends. Ginzburg et al. (He, Ginzburg,& Balazs, 2006) assumed that a particle interacts
with both polymers A and B. (χAP>0 and χBP>0) and introduced the variables x= χAP +
(1- ) χBP and y= (χAP – χBP)/2, where and (1- ) volume fraction of polymers and χ
is Flory and Huggins interaction parameter.
The variable x was explained that is a measure of the average enthalpic ‘field’
acting on the particles, due to the homopolymers and y is a measure of the relative
affinity between the particles and the different homopolymers; when y is negative, the
particles prefer the A phase, while a positive y indicates a preferential interaction
between the particles and the B phase.(He, Ginzburg, & Balazs, 2006)

6
For another estimation in order to explain the location of nanoparticle
consideration is Young’s equation by calculation of the wetting coefficient ωa ;
12
21
PP
a
where 1P and 2P are interfacial tension between polymer 1 and the nanoparticles,
polymer 2 and the nanoparticles respectively. 12 prefers to interfacial tension between
the polymers. If the wetting coefficient is higher than 1, the nanoparticles are located in
the Polymer 1, when having values lower than -1 they are located in polymer 2, and if
the wetting coefficient is between 1 and -1 the nanoparticles are preferentially located at
the interface between both polymers. (Pötschke, Pegel, Claes, & Bonduel, 2008)
Ginzburg and co-workers (He, Ginzburg, & Balazs, 2006) examined that when
χAB is greater than both χAP and χBP, the particles can act as compatibilizers, causing the
entire system to be miscible. For instance; studied on styrene-
acrylonitrile(SAN)/ethylene-propylene diene monomer rubber(EPDM) are immiscible
blend. It was found that the addition of surface treated calcium carbonate fillers allowed
them to control the filler polymer interactions and consequently, create a miscible
mixture. (He, Ginzburg, & Balazs, 2006)
1.2. Literature Review on BCP/Nanoparticle Composite Systems
There are few or no studies in literature for the examination of particle location in
polymer nanocomposites prepared by polymer blends. However, the literature is relatively
rich in terms of selective loading of nanoparticles in block copolymers. In the following,
literature of BCP composites is reviewed. For example, Ton. That et al. (Ton-That, Shard,
Teare, & Bradley, 2001) claimed that to reduce the interfacial tension, the coarsening of
the domains near to the surface to equilibrium will take place upon annealing. Figure 1.2 is
a schematic illustration of the phase behavior PS/PMMA blends upon annealing time.

7
Figure 1.2. Structural model of PS/PMMA blends as spin-cast a) and upon annealing above
the glass transition temperature in early stage b) and later stage c). Arrows
indicate the movements of the PS-rich and PMMA-rich domains at their
interface. (Source: Ton-That, Shard, Teare, & Bonduel, 2008).
In addition, they showed that different compositions and thickness of PS and
PMMA films releaved different phase morphology. As shown in Fig. 1.3(a) and (f)
belongs to the pure polymer films with 1% wt/v(polymer blend/chloroform). For the
polymer blends containing 75%PS:25% PMMA, the AFM topography shows a pitted
surface (Fig.1.3(b)). The pits have a broad, shallow structure with typical diameter
ranging from 300 to 600 nm and depths of between 15 and 25 nm. A pitted surface
morphology as shown in Fig. 1.3(c) was also observed for 50%PS:50%PMMA films,
the pits are larger than those in the 75%PS:25%PMMA films and their diameter being
between 1.2 and 1.6 μm with depths of 30±40 nm. When the polymer composition is
changed to 40% PS: 60% PMMA, the surface tends to show a granular morphology
(Fig. 1.3(d)). The granules have diameters of about 400 nm and protrude above the
surface material by 15±30 nm. With 25% PS:75% PMMA film, the topography also
shows a granular surface, but the granules are larger in size with diameters of about
1±1.3 μm. (Ton-That, Shard, Teare, & Bonduel, 2008).

8
Figure 1.3. AFM images of the surface topography of PS and PMMA in single
component and blended thin films cast from 1% (w/v) solution. (Source:
Ton-That, Shard, Teare, & Bonduel, 2008) (Ton-That et al., 2001)
Proscycevas et al. (Prosycevas, Tamulevicius, & Guobiene, 2004) investigated
that solvent cast thin films of blends PS and PMMA with nominal compositions ranging
from 25:75 (w/v) up to 75:25 w/v PS:PMMA with toluene as the mutual solvent on
crystalline Si (100) and silica substrates. In figure 1.4 solvent cast thin films of blends
PS and PMMA with nominal compositions are ranging from 25:75 wt.%:v% (w/v) up to
75:25 w/v PSyPMMA with toluene as the mutual solvent on crystalline Si (100) and
silica substrates. Additionally, they proposed that morphology of the nanostructured
thin film depends on the polymer concentration of the solution.(Prosycevas,
Tamulevicius, & Guobiene, 2004)

9
Figure 1.4. AFM images of a dip-coated a) PS film (with film thickness A=60 nm),
b)PS25%:PMMA75% film (with film thickness A=40 nm),
c)PS50%:PMMA50% film (film thickness A=40 nm), d)
PS75%:PMMA25% film (film thickness A=80 nm) on crystalline Si(100),
e) PS75%:PMMA25% film (film thickness A=20 nm) on silica.(Source:
Prosycevas, Tamulevicius, & Guobiene, 2004)
Chung et al reported the examination of silica particle location in dPMMA-
SAN.In figure 1.5, SEM images of polymer blends of deuterated poly(methyl
methacrylate)(dPMMA):poly(styrene-ran-acrylonitrile)(SAN) thin films with 10 wt%
methyl and hydroxyl coated silica, with 22 nm diameter (MST) (b, c) and 10 wt% silica
with a shell of grafted PMMA brushes, with 18 nm diameter (P2K) (d, e). Initially,
h, MST NPs partition into the dPMMA phase (c), whereas P2K NPs segregate at the
dPMMA/SAN interface (e). (Chung, Ohno, Fukuda, & Composto, 2005)
(
a
)
(
e
)
(
d
)
(
c
)
(
b
)

10
Figure 1.5. SEM images of dPMMA:SAN films with 10 wt% MST (b,c) and 10 wt%
P2K (d, e). (Source: Chung, Ohno, Fukuda, & Composto, 2005)
1.2.1. Thermodynamics of Polymer/Particle Composites
Enthalpy and entropy are two main thermodynamic functions. Although they are
first recognized for gaseous system, they are defined for different systems. For the
particular case of our particular system based on polymers associated with particle, they
are defined as follows:
Enthalpy can be roughly defined as chemical affinity between particle surface
and surrounding polymer. On the other hand, entropy is combination of two sub
functions:
i) the distortion of polymer chains in the presence of nanoparticles ii) the
arrangement of the particles in polymer volume.
Research studies about selective loading of nanoparticles in polymer domains
have heavily focused on the block copolymer nanocomposites with respect to polymer
blend nanocomposites. Size and surface chemistry of nanoparticles have important role
in determination of placement of NPs in polymer domains. Chui et al. (Chui et al.,
2007) controlled the nanoparticles by mixing homopolymer blends or random

11
copolymers and also they claimed that the surface coverage of the polymer ligands on
the nanoparticle is a critical parameter that determines the spatial organization of the
nanoparticles in polymer domains. (Chiu et al., 2007)
The earliest work by Balazs’ group has combined density functional theory and
self-consistent field theory to simulate the behavior of nanoparticles of diameter d in
polymer domains of period L. The ratio of diameter of nanoparticles d over domain
spacing L controls the location of particles in the composite structure. They claimed that
when the ratio of d/L is small, the particles are locate at the interface of the domains.
However, when the ratio greater than 0.3, nanoparticles become more localized toward
the center of the appropriate domains to minimize the conformational entropic penalty
as chain stretching becomes significant to accommodate the nanoparticles. (Kao,
Thorkelsson, Bai, Rancatore, & Xu, 2013)
Bockstaller et al. (Bockstaller, Mickiewicz, & Thomas, 2005) showed that the
effect of entropy on the spatial distribution of Au and SiO2 nanoparticles of different
sizes. Experimentalists resulted the ratio of d/L depends on nanoparticle size, ligand size
and molecular weight of polymers. While for smaller Au nanoparticles the d/L ratio is
0.06 which placed along the inter-material diving force, for larger SiO2 nanoparticles
the ratio is 0.26 which located the center of the domain shown in Figure 1.6. For large
particles, the decrease in conformational entropy of the respective polymer chains upon
particle sequestration is dominant, whereas for smaller particles, the decrease in entropy
is offset by the particle’s translational entropy.(Bockstaller, Mickiewicz, & Thomas,
2005)
12
Figure 1.6. TEM micrograph of a ternary blend of PS-b- PEP, ~3.5 nm Au
nanoparticles, and ~21.5 nm SiO2 nanoparticles with the volume fraction
of the nanoparticles around inorganic filling fraction φ = 0.02. (Source:
Bockstaller, Mickiewicz, & Thomas, 2005)
13
2. CHAPTER 2
EXPERIMENTAL STUDY
2.1. Chemical and Reagents
Sodium borohydride NaBH4 (Sigma-Aldrich, 99.99%) , silver nitrate AgNO3
(Alfa Aesar, 99+%) , Polystyrene (PS) (Aldrich Chemical Co. , Mw ~ 350,000) ,
Poly(metyl methacrylate) (PMMA) (Aldrich Chemical Co. , Mw ~ 15,000) ,
Tetrahydrofuran (THF) (VWR International bvba/sprl), Hexadecyltrimethylammonium
bromide (CTAB) (Sigma Aldrich) were used as they were without applying further
purification.
2.2. Synthesis of Organophilic Silver Nanoparticles
A two-step previous was applied for the synthesis of organophilic Ag NPs.
Figure 2.1 shows schematic view of the entire particle preparation Ag NPs. In the first
step, naked Ag NPs were obtained via a redox reaction taking place between NaBH4 and
AgNO3. A 10 mL of aliquiot of 0.01 M AgNO3 was added dropwise (about 1
drop/second ) to 30 mL of 0.02 M of NaBH4 solution that had been chilled in an ice
bath. The reaction mixture was stirred vigorously on a magnetic plate. (Mulfinger et al.,
2007)
The redox reaction can be represented by :
AgNO3(aq) + NaBH4(aq) Ag(s) + ½ H2(g) + ½ B2H6(g) + NaNO3(aq)
The dispersion mixture turned to light yellow after the addition of 2mL of
AgNO3 and when all of the AgNO3 was added, yellow dispersion in water was
obtained. The resulting particles are hydrophilic in nature.
In the second step, Ag surface functionalization was applied to make them
organophilic. Hexadecyltrimethyl ammonium bromide(CTAB) was used for the surface

14
modification. CTAB solution was prepared in water at two different concentrations:
0.02 M and 0.002 M. CTAB solution in water was added to dispersion of silver
nanoparticles as 1/20 ratio (1 mL CTAB for 40 mL of silver nanoparticle dispersion).
After addition of CTAB, the solution has been sonicated until CTAB was dissolved in
solution. Then, the final solution was centrifuged at 6000 rpm for 40 min.
The Ag/CTAB nanoparticles were isolated. After decanting the water solution,
the precipitation was dried and powder Ag/CTAB nanoparticles was obtained.
Figure 2.1. Schematic representation of reaction A) Synthesis of Ag Nanoparticles and
B) Coating surface of Ag NPs with CTAB.
2.3. Preparation of Ag/PS-PMMA Blends of The Composite Films
Polymer blend solutions were prepared by dissolving of PS and PMMA as 1:1
weight ratio in THF as 2.5% (w/v). After complete dissolution of the polymers, the
powder of Ag/CTAB nanoparticles was added into the polymer solution mixture.
Polymer nanocomposites films were prepared by casting the dispersion mixture
on glass surface using micropipette. Schematic illustration of the preparation of cast
film method is given in Figure 2.2. The films were cooled at 25 ˚C and annealed at 165
˚C.

15
Figure 2.2. Schematic representation of cast film process
2.4. Characterization of Samples
Characterization of Ag and Ag/CTAB nanoparticles and their composites with
PS/PMMA thin polymer nanocomposite films were performed using the techniques
given below.
Scanning Electron Microscopy (SEM) is used to investigate the surface
morphology of the polymer nanocomposites. In our study, Phillips XL-30S FEG and
ESEM Quanta 250 FEG were used to observe the morphology of the surfaces. Sample
surfaces are scanned with the electron beam and resulting image formed by secondary
electrons is determined. Therefore, this method provides information about the surface
chemistry and topography by the surface reflection. (Goldstein et. al.2003)
For Atomic Force Microscopy (AFM), Multi Mode SPM Nanoscope IV was
used to investigate the phase separation and location of NPs on the surface of the
samples. AFM images are obtained by measurement of the force on a sharp tip created
by the proximity to the surface of the sample. This force is kept small and at a constant
level with a feedback mechanism. When the tip is moved sideways it will follow the
surface contours.
Dynamic Light Scattering (DLS) is the most convenient method for
measurement of particle size in dispersion. Shining a monochromatic light beam, such
Micropipette
Glass Substrate
Polymer Solution

16
as a laser, onto a solution with spherical particles in Brownian motion causes a Doppler
Shift when the light hits the moving particle, changing the wavelength of the incoming
light. This change is related to the size of the particle. The surface charge is determined
by applying potential and measured the potential difference of the dispersion of the
particles. (Sartor 2003). Malvern Zeta Size was used to measure of size distribution and
surface charge of the nanoparticles and obtained data are plotted by using Origin Pro8.
Uv-Vis Spectrometer is based on absorption of photons that it is excited to upper
energy level, then returns back to its ground state and so energy appears in process.
Schimadzu UV 2550 was performed to measure absorbance of light of the samples and
the worked wavelength range was 200-700 nm.
Thermal Gravimetric Analysis (TGA) was used to examine grafting density of
surfactant and polymer, moisture and nanoparticle of polymer nanocomposites. TGA
analysis was applied from 0 ˚C to 600 ˚C with O2 gas. Perkin Elmer Diomand TG/DTA
was used and result data was plotted by Origin Pro8.
Differential Scattering Calorimetry, DSC Q10 V9.4 Build 287 was used to
measure glass transition temperature of the thin film samples. DSC analysis was applied
from 25 ˚C to 160 ˚C under N2 gas with 50.0 ml/min of flow rate and aluminum pan.
Nuclear Magnetic Resonance (NMR) Spectroscopy, NMR Varian 400 Mhz was
used to identify surfactant molecule on the surface of the nanoparticles. Deuterated
Dimethyl sulfoxide (DMSO) was used as the solvent.

17
3. CHAPTER 3
RESULTS AND DISCUSSION
2.5. Synthesis of Ag Nanoparticles
Ag nanoparticles were synthesized by reduction of AgNO3 via NaBH4 in
aqueous solution. The resulting dispersion is yellow. It is a quite stable dispersion.
Sedimentation of the particles was not observed for more than one month. The
concentration of starting material AgNO3 was 0.01 M. When the concentration
increases, the color of dispersion is turned out to be dark. The change in color is most
probably due to the aggregation of individual particles. The reaction mixture was cast
on a cupper grid and after solvent evaporation; the surface of the grid is scanned by
Transmission Electron Microscopy (TEM). Figure 3.1 presents an overview and higher
resolution images of the particles. The particles appear spherical with a diameter of 6
nm on average and separate as islands. They are most probably capped by BH4 (-) ions
and electrostatically stabilized such that the particles are no aggregated. The inset of
right panel shows electron diffraction pattern of the particles. There are discrete sharp
circles indicating that the particles have high crystallinity.

18
Figure 3.1. TEM image of Ag nanoparticles
0 10 200
10
20
% N
um
ber
of P
art
icle
s
Particle Diameter, nm
Ag
Ag/CTAB
Figure 3.2. DLS number Size distribution of Ag and CTAB capped Ag particles.
Figure 3.2. illustrates DLS number size distribution of the both naked and CTAB
capped particles. The mean diameter of naked Ag particles have 6 nm in diameter. This
result compatible with the particle size obtained from TEM. When the particles are
modified by CTAB the size increase to 9 nm. The length of the surfactant molecule
19
contributed for the increase of the diameter. The length of the molecule is around 1.5
nm on average.
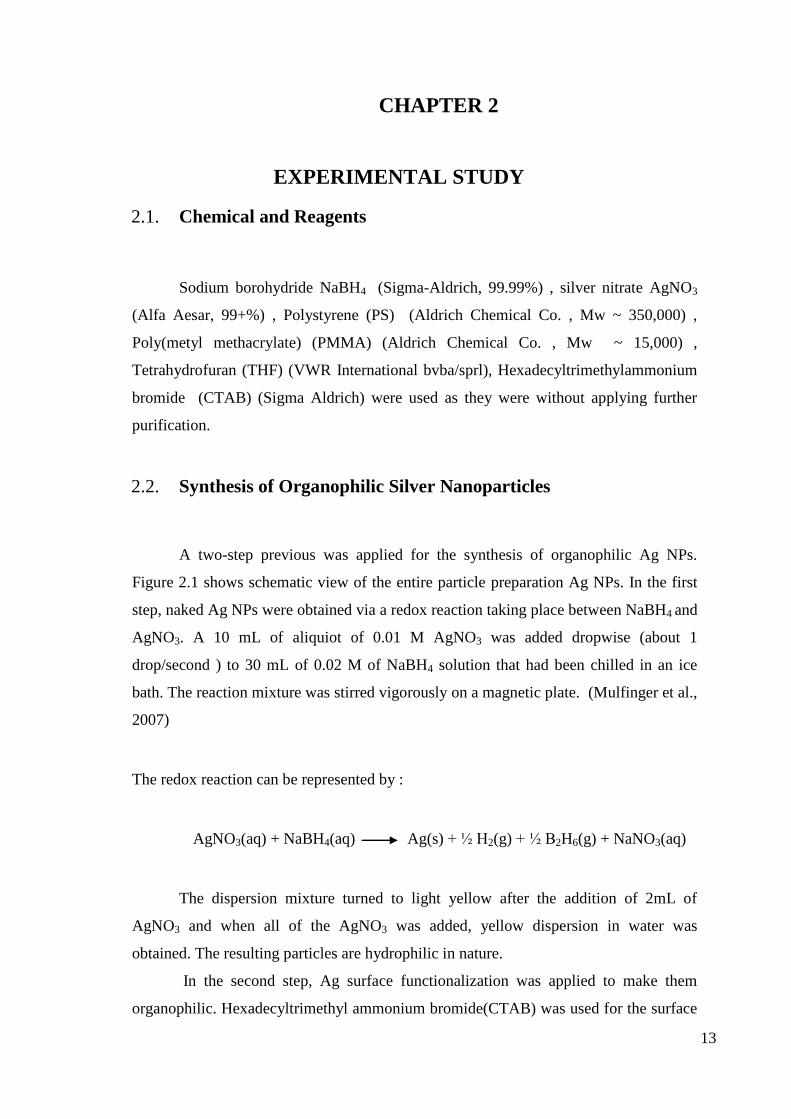
Figure 3.3. NMR spectra for Ag/CTAB NPs with different carbon atom.
CTAB molecules on the surface of the Ag NPs were identified by using NMR
spectroscopy and chemical shifts are presented in Figure 3.3. The signals of α-CH2
appears at chemical shift δ = 3.39 ppm for neat CTAB and at 3.23 ppm in Figure 3.3 for
Ag/CTAB. Its multiplet appearance had been attributed to H-H coupling to β-CH2. Due
to methyl protons of CTAB polar groups, there are narrow signals at 3.0 ppm, this value
is at 3.16 ppm for pure CTAB. The broad humps at 1.80 ppm for pure CTAB and at
1.75 for Ag/CTAB NPs are β-CH2. The peaks at 1.22 ppm and 0.86 ppm are combined
resonances of the other methylenes in the alkyl chains referred as main chain peaks. The
signals at 3.32 ppm and 2.5 ppm are d-DMSO (solvent) and H2O respectively. Sui et al.
(Sui et al., 2006) compared the neat CTAB and Ag NPs and suggested that the larger
changes of the protons on α-CH2 and β-CH2 than that on N-CH3, however, indicate that
the capping of CTAB molecules on Ag NPs is through their head groups with Ag NPs
located between β-CH2 and nitrogen atom. (Sui et al., 2006)
20
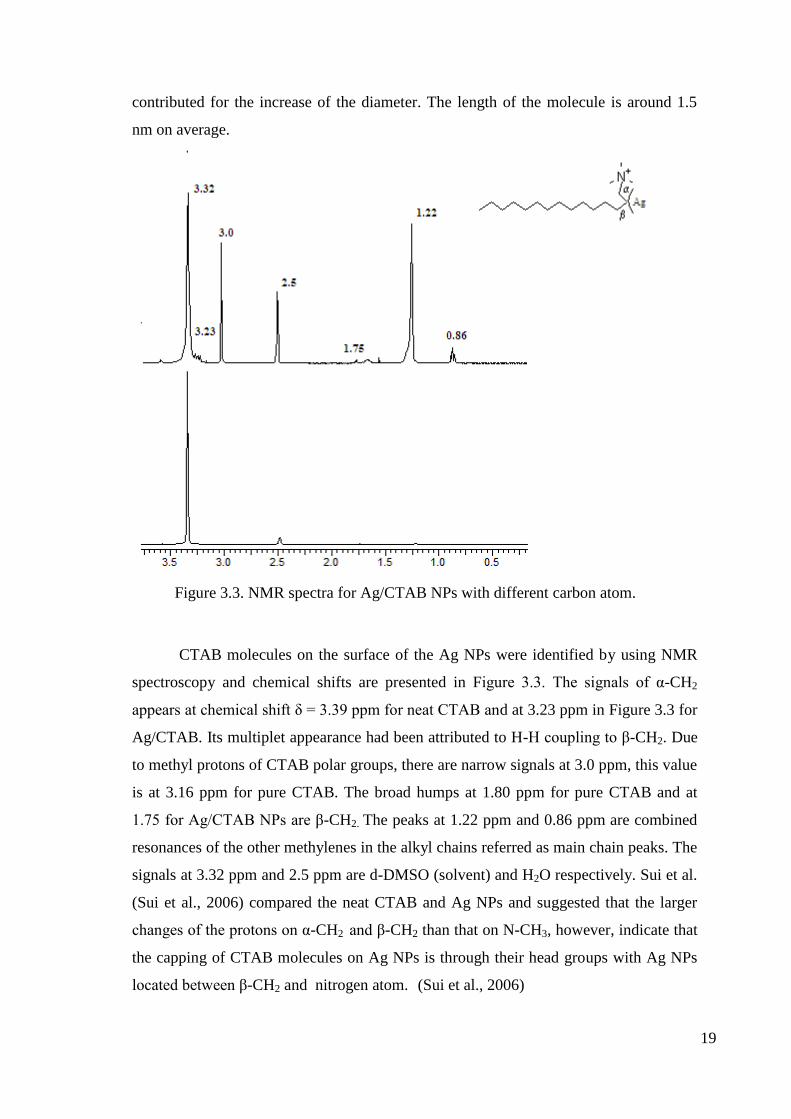
The pictures of Ag and Ag/CTAB dispersions and absorbance of light are shown
in Figure 3.4. Yellow dispersion refers to Ag NPs and the black one is for Ag/CTAB
NPs. The spectra of the particles show the difference between the particles before and
after capped with CTAB. Naked particles have sharp signal centered at 400 nm. Upon
capping the particles with CTAB, the main signal remains unchanged; however, a
shoulder around 450 nm appears. This new signal can be attributed to the presence of
agglomerated Ag/CTAB particles. In addition, the colour of particle dispersion changes
from yellow to black. Since agglomeration is observed in spectroscopy, steric
stabilization of the particles by CTAB is not as much effective as electrostatic
stabilization of the naked particle.
400 600 8000
2
4 Ag NPs
Ag/CTAB NPs
Ab
so
rba
nce
Wavelength, nm
Figure 3.4. Absorbance spectrum of before functionalization with CTAB and after
CTAB treatment. a) Ag nanoparticles dispersion in water, b) Ag/CTAB
NPs.
(a) (b)

21
The surface charge of the Ag and Ag/CTAB NPs were analyzed by the zeta sizer
as a proof of the surface modification. In Figure 3.5 shows zeta potential of the Ag NPs
before and after capped with CTAB. The surface charge of naked Ag particles is around
-47 mV. We postulated that the surface of Ag nanoparticles is covered by BH4- ions.
The particles repel each other so that the dispersion is electrostatically stabilized. After
the capping process with CTAB as the cationic surfactant, the surface charge of particle
was found to be +34mV. The absolute value of surface potentials is similar in terms of
absolute value. One can speculate that the majority of the negative center on the
particles surface is capped by quaternary ammonium salt molecules.
Figure 3.5. Surface potential values; black line: before functionalization with redline:
after CTAB treatment.
Figure 3.6 shows the zeta potential of CTAB capped Ag nanoparticles while
increasing the amount of CTAB solution treated with a known amount of reaction
mixture. In these experiments, we employed 2.5% volume of CTAB solution with Ag
nanoparticle dispersion. For testing, we employed higher volume of CTAB solution.
The result shows that increasing volume of solution does not change the potential of Ag
particles. In another words, there is no more negative BH4(-) centers to be occupied by
CTAB molecules.
-150 -100 -50 0 50 100
Inte
nsi
ty
Zeta Potential, mV
Ag NP
CTAB-Ag NP

22
0 2 4-50
-25
0
25
50
Zet
a P
oten
tial
, mV
% Volume of CTAB
Figure 3.6. Surface potential values by adding different volume of CTAB solution.
Colloidal Ag nanoparticles were isolated by centrifugation. The nanoparticles
were analyzed in powder form. Figure 3.7 presents SEM images of the Ag powder on
metallic stub. Since the particles are in dry state, imaging of the single particle cannot
be resolved, rather an agglomeration of the single nanoparticles. In addition, the Ag
nanoparticles are agglomerated when they are not synthesized in ice bath or storage in
refrigerator after synthesized.

23
Figure 3.7. a) SEM Image of Ag nanoparticles, 1μm b) SEM images of agglomerated
Ag nanoparticles, 1μm.
The surface capped particles were imaged by STEM detector. The representative
result is given in Figure 3.8. It shows STEM image of the nanoparticles before and after
modification. Before the modification, the NPs seem individual and after the process,
they located as large particle domain. The images show that surface capping process
does not cause a remarkable difference in morphology of the nanoparticles in terms of
shape and size.
Figure 3.8. a) STEM Image of Ag nanoparticles b) STEM images of Ag/CTAB
nanoparticles. The scale bars refer to 200 nm.
Surface capping of the nanoparticles was carried out by two different
concentrations of CTAB solution: 0.02 M and 2.0 mM. Atomic weight percentage of
(a) (b)

24
Nitrogen on Ag NPs was measured by EDX. The results are given in Fig. 3.9. While the
weight percentage of N is 4.22% in Ag NPs capped with 2.0 mM CTAB, the percentage
increases to 6.95% in Ag NPS capped with 0.02 M of CTAB. Not surprisingly,
increasing concentration of CTAB increases the nitrogen content on the particle surface.
Figure 3.9. EDX result of Spectrum 6) 2 mM of CTAB capped Ag nanoparticles b)
0.02 M of CTAB capped with Ag Nanoparticles.
The particles are capped with CTAB molecules such that inorganic core is
covered by organic molecules. The amount of organic residue covering the core can be
understood via thermogravimety.
Table 3.1 is produced based on the TGA measurements of Ag/CTAB NPs and
literature values based on decomposition temperature range of pure CTAB between
207-316 ˚C. The thermogravimetry results are agree with literature. The particles were
analyzed room temperature to 650 ˚C.

25
Table 3.1. The weight loss processes of pure CTAB and the Ag/CTAB NPs sample with
their assignments in TGA experiment.
*(Sui et al., 2006)
The thermogram is given in Figure 3.10. There are two important weight loss
values, fist one is between 100-120 ˚C which caused by moisture or solvent residuals.
The other is between 120-468 ˚C decomposition of CTAB molecules. There is no
remarkable mass remained after 468 ˚C , one can claim that metallic Ag particles are
capped by organic CTAB percentage weight of CTAB molecule on the surface of Ag is
8.35%.
0 200 400 60080
85
90
95
100
We
igh
t L
oss
%
Temperature oC
Figure 3.10. TGA results of Ag/CTAB NPs
26
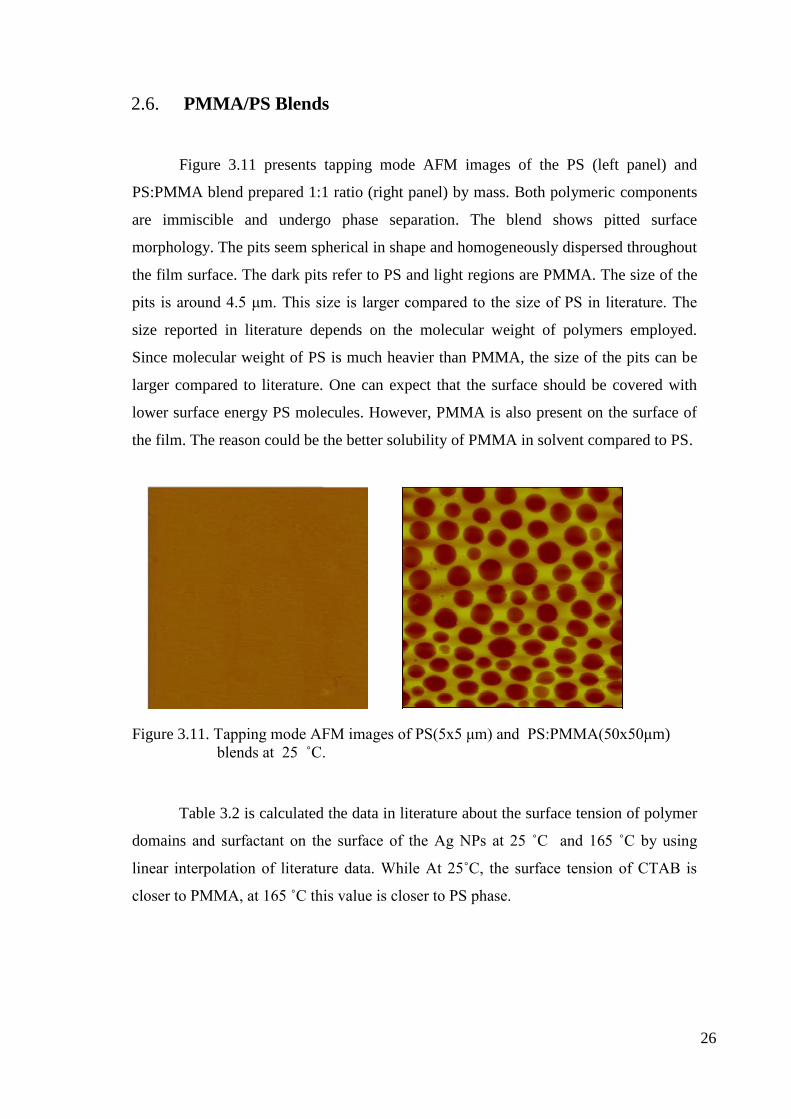
2.6. PMMA/PS Blends
Figure 3.11 presents tapping mode AFM images of the PS (left panel) and
PS:PMMA blend prepared 1:1 ratio (right panel) by mass. Both polymeric components
are immiscible and undergo phase separation. The blend shows pitted surface
morphology. The pits seem spherical in shape and homogeneously dispersed throughout
the film surface. The dark pits refer to PS and light regions are PMMA. The size of the
pits is around 4.5 μm. This size is larger compared to the size of PS in literature. The
size reported in literature depends on the molecular weight of polymers employed.
Since molecular weight of PS is much heavier than PMMA, the size of the pits can be
larger compared to literature. One can expect that the surface should be covered with
lower surface energy PS molecules. However, PMMA is also present on the surface of
the film. The reason could be the better solubility of PMMA in solvent compared to PS.
Figure 3.11. Tapping mode AFM images of PS(5x5 μm) and PS:PMMA(50x50μm)
blends at 25 ˚C.
Table 3.2 is calculated the data in literature about the surface tension of polymer
domains and surfactant on the surface of the Ag NPs at 25 ˚C and 165 ˚C by using
linear interpolation of literature data. While At 25˚C, the surface tension of CTAB is
closer to PMMA, at 165 ˚C this value is closer to PS phase.

27
Table 3.2. Surface tension of polymers and the surfactant at different temperature.
a;(Tang, Du,Yang, & Zhang, 2006), b and c; (Wu,1970)
2.7. Nanocomposites prepared by PS-PMMA blend and Ag
nanoparticles
In polymer/nanoparticle composites, glass transition temperature (Tg) hint about
the interaction of particle surface and surrounding polymer chains. Figure 3.12 presents
the thermogram of the polymer blend, polymer composite prepared by blend, and
polymer composite annealed at 165 ˚C. Tg values of PS and PMMA are 105 ˚C and 104
˚C in the literature. For the blends prepared in this thesis, a single appears. We can
claim that the values were measured close to each other and the signals overlap. The
incorporation of the Ag/CTAB particle into system, Tg value remains unchanged. This
result indicates that Ag particles are inert to both polymeric components and there is no
specific affinity between the particle surface and PS and PMMA chains.

28
50 100 150-3
-2
-1
0
1
He
at
Flo
w,
(W/g
)
Temperature, oC
PS/PMMMA @ 25 oC
Ag/CTAB-PS/PMMA @ 25oC
Ag/CTAB-PS/PMMA @165oC
Figure 3.12. Glass transition temperature of polymer nanocomposite films.
Figure 3.13 presents tapping mode AFM images of the composites. The bright
regions refer to Ag, and the large spherical regions refer to PS and the rest darker
regions are PMMA. It is shown that the particles are merely located at PMMA phase.
The size of particle domains is nearly 90 nm. The particles used in this sample were
prepared by reduction of AgNO3(aq). When the concentration of CTAB was increased,
the grafting density of CTAB is higher. The higher the density, the better stability and
smaller particle domains. As a result, the size of Ag particle domains is reduced to 20
nm. The location of particles is strongly depends on the size. When the size is small, the
particles are sequestered at the interface of PS and PMMA domains. (Fig. 3.14-3.15)
Theoretical studies support our results. Thompson et al. suggested that d/L ratio governs
the location of the particles (Thompson, Ginzburg, Matsen, & Balazs, 2001).
The ratio of diameter of nanoparticles d over domain spacing L governs the
location of particles in the composite structure. Theoretical studies suggest that smaller
particles with a ratio (d/L) is located at interface of the domains. Based on the AFM
images, the average size of the NPs located in PMMA (a and b in Figure 3.13) is
approximately 90 nm.

29
Figure 3.13. Tapping mode AFM images of AG/CTAB-PS/ PMMA nanocomposite
films at 25 ˚C, the particles in a) and b) in PMMA domain.
Additionally, in Figure 3.13, the ratio of particle diameter to PS phase diameter
(d/L) is 0.15. For Figure 3.14 a and b, this ratio is 0.093. As the nanoparticle diameter
(27 nm) and d/L is decreased, the NPs are located at the interface.

30
Figure 3.14. Tapping mode AFM images of Ag/CTAB-PS/ PMMA nanocomposite
films at 25 ˚C, the particles in a) and b) at interface.
In addition to AFM results, SEM results are represented in Figure 3.15 and the
location of the NPs is releaved difference in PMMA and interphase of the polymers.
31
Figure 3.15. SEM images of nanocomposite films at 25 ˚C a) 4μm and b) 10 μm.
Size distribution of Ag/CTAB NPs in the polymer nanocomposites films were
illustrated in Figure 3.16. The NPs located at interphase have the diameter 27 nm,
calculated d/L ratio is 0.093. The larger Ag/CTAB NPs located at PMMA phase with
the 90 nm diameter have the ratio 0.15. While smaller NPs with smaller d/L ratio load in
interphase, larger NPs with larger d/L load in PMMA domain.
30 60 90 1200
3
6
9
% C
ounts
Diameter of Ag Domains/nm
@ Interphase
@ PMMA Domain
Figure 3.16. Size distribution of Ag/CTAB NPs at interphase and PMMA domains
(a) (b)

32
As mentioned experimental part, Ag/CTAB-PS/PMMA nanocomposite films
were annealed at 165 ˚C for 3 days. After annealing, the location of Ag/CTAB NPs is
selectively loaded in PS domain as illustrated in Figure 3.17. The average diameter of
Ag/CTAB NPs is approximately 69 nm and d/L ratio is 0.0437.
Figure 3.17. Tapping mode AFM images of Ag/CTAB-PS/ PMMA nanocomposite
films at 165 ˚C.
(b)
(c)
(a)

33
The change in location of the NPs upon annealing can be explained with the
change in surface tension of the PS and PMMA domain. In addition, wetting
coefficients are calculated in table 3.3 for each case, the data was obtained by using the
linear interpolation of the literature data and interfacial tension of CTAB was assumed
as polyethylene due to same as aliphatic chain of CTAB molecule. As mentioned in
previous part, if the wetting coefficient is between the -1 and 1, the particles locate
interphase otherwise if it is greater than 1, the NPs place in the PS domain. (Syms,
Yeatman, Bright, & Whitesides, 2003).
a; (Tang, Du, Yang, & Zhang, 2006), b and c; (Wu, 1970)
Table 3.3. Interfacial tension and wetting coefficient of the polymers
a,b and c; (Wu, 1970)
To sum up the discussion on the size of PS domain in the case of composite
preparation, (Figure 3.18), size of PS domains shows differences due to annealing and
adding CTAB capped Ag NPs. The diameter of PS domains in polymer nanocomposite
films without Ag/CTAB NPs is around 4.5 μm. After adding NPs at room temperature,
the diameter is reduced to 400 nm. The reduction of PS domain size occurs most
probably due to the surfactant effect of CTAB immobilized to the surface of Ag
particles. Upon annealing the composite, the size of PS domains increases to 1.25 µm.
Increase in temperature, the diffraction of PS domain is highly possible. The domains
diffuse and coalescence forming larger PS domains compared to the domains develop in
the presence of CTAB capped particles.

34
1 2 3 4 5 60.0
0.2
0.4
0.6
Blend without particle
Composite @ RT
Composite @165 oC
Co
un
ts
Diameter of PS Domains / m
Figure 3.18. Size distribution of PS domains in polymer nanocomposite films.
TGA analysis result of the polymer nanocomposites at different temperatures is
represented in Figure 3.19. In the analysis, temperature increases and mass of the
sample as a function of temperature is recorded. First humidity and then organic part of
the sample usually disappears. At high temperature after the degradation of polymers,
inorganic content remains. The composite film prepared at room temperature provides
0.64 wt % at 600 ˚C. When this film is annealed at 165 ˚C, the remaining mass is 5.5
because humidity is already removed from the system and the fraction of Ag particles
increases.

35
0 200 400 6000
50
100
We
igh
t L
oss (
%)
Temperature, oC
25 oC
165 oC
Figure 3.19. TGA result of the polymer nanocomposite films at 25 ˚C and 165 ˚C.

36
4. CHAPTER 4
CONCLUSIONS
We demonstrated that the composites of PS/PMMA blend and CTAB capped Ag
nanoparticles were prepared. Ag nanoparticles were obtained by reduction of AgNO3
via NaBH4. The particles are electrostatically stabilized due to the presence of BH4(-)
on the particle surface. Capping the particles by a cationic surfactant, CTAB makes
them organophilic. The resulting particles were mixed with PS and PMMA in THF
solution. The surface feature of the composite film and the location of the nanoparticles
were figured put by AFM. The results state that both enthalpy and entropy are at play.
Larger particles prefer to be present in PMMA. Because the ratio of particle domain size
to the size of PS domain 0.15. This effect is purely entropic. Annealing of the composite
films at 165 ˚C direct the particles and particle domains into PS domains. At this
temperature, the surface tension of the Ag/CTAB particles gets close to the one of the
PS domains. This effect, on the other hand, is enthalpic. The main conclusion of the
results is that control over the location of the nanoparticles was successfully achieved.
However, the development of any physical feature upon change of the location of the
nanoparticles is not clarified in this study. There are two important parameters
employed. First, the amount of particles was 0.7 % by weight. Second, the composition
of the PS/PMMA blend was 1:1 in THF as 2.5% (w/v). The microstructure (phase
separation of the polymer constituents and the location of the nanoparticles) can be
studied in detail for future study. In consequence, controlling of the placement of the
NPs in polymer blends as in our study gives point of view and development of novel
nanomaterials.

37
REFERENCES
Chung, H.-j., Ohno, K., Fukuda, T., & Composto, R. J. (2005). Self-regulated structures
in nanocomposites by directed nanoparticle assembly. Nano letters, 5(10), 1878-
1882.
Morin, C., Ikeura-Sekiguchi, H., Tyliszczak, T., Cornelius, R., Brash, J., Hitchcock, A.,
. . . Winesett, D. (2001). X-ray spectromicroscopy of immiscible polymer
blends: polystyrene–poly (methyl methacrylate). Journal of Electron
Spectroscopy and Related Phenomena, 121(1), 203-224.
Mulfinger, L., Solomon, S. D., Bahadory, M., Jeyarajasingam, A. V., Rutkowsky, S. A.,
& Boritz, C. (2007). Synthesis and study of silver nanoparticles. Journal of
chemical education, 84(2), 322.
Pötschke, P., Pegel, S., Claes, M., & Bonduel, D. (2008). A novel strategy to
incorporate carbon nanotubes into thermoplastic matrices. Macromolecular
Rapid Communications, 29(3), 244-251.
Prosycevas, I., Tamulevicius, S., & Guobiene, A. (2004). The surface properties of
PS/PMMA blends nanostructured polymeric layers. Thin solid films, 453, 304-
311.
Syms, R. R., Yeatman, E. M., Bright, V. M., & Whitesides, G. M. (2003). Surface
tension-powered self-assembly of microstructures-the state-of-the-art.
Microelectromechanical Systems, Journal of, 12(4), 387-417.
Ton-That, C., Shard, A., Teare, D., & Bradley, R. (2001). XPS and AFM surface studies
of solvent-cast PS/PMMA blends. Polymer, 42(3), 1121-1129.
Bockstaller, M. R., Mickiewicz, R. A., & Thomas, E. L. (2005). Block copolymer
nanocomposites: perspectives for tailored functional materials. Advanced
Materials, 17(11), 1331-1349.
Chiu, J. J., Kim, B. J., Yi, G.-R., Bang, J., Kramer, E. J., & Pine, D. J. (2007).
Distribution of nanoparticles in lamellar domains of block copolymers.
Macromolecules, 40(9), 3361-3365.
Choi, O., Deng, K. K., Kim, N.-J., Ross Jr, L., Surampalli, R. Y., & Hu, Z. (2008). The
inhibitory effects of silver nanoparticles, silver ions, and silver chloride colloids
on microbial growth. Water research, 42(12), 3066-3074.

38
Chung, H.-j., Ohno, K., Fukuda, T., & Composto, R. J. (2005). Self-regulated structures
in nanocomposites by directed nanoparticle assembly. Nano letters, 5(10), 1878-
1882.
De Gryse, R., Depla, D., Poelman, D., Mahieu, S., Leroy, W., & Poelman, H. (2008).
Proceedings of ICTF 14 & RSD 2008.
Demir, M. M., & Wegner, G. (2012). Challenges in the preparation of optical polymer
composites with nanosized pigment particles: a review on recent efforts.
Macromolecular Materials and Engineering, 297(9), 838-863.
Ha, M., Atallah, A., & Krishnamoorti, R. (2011). Effect of organically modified layered
silicates on the morphology of symmetrical blends of polystyrene and poly
(methyl methacrylate). Polymer, 52(25), 5890-5896.
He, G., Ginzburg, V. V., & Balazs, A. C. (2006). Determining the phase behavior of
nanoparticle‐filled binary blends. Journal of Polymer Science Part B: Polymer
Physics, 44(17), 2389-2403.
Kao, J., Thorkelsson, K., Bai, P., Rancatore, B. J., & Xu, T. (2013). Toward functional
nanocomposites: taking the best of nanoparticles, polymers, and small
molecules. Chemical Society Reviews, 42(7), 2654-2678.
Morin, C., Ikeura-Sekiguchi, H., Tyliszczak, T., Cornelius, R., Brash, J., Hitchcock, A.,
. . . Winesett, D. (2001). X-ray spectromicroscopy of immiscible polymer
blends: polystyrene–poly (methyl methacrylate). Journal of Electron
Spectroscopy and Related Phenomena, 121(1), 203-224.
Mulfinger, L., Solomon, S. D., Bahadory, M., Jeyarajasingam, A. V., Rutkowsky, S. A.,
& Boritz, C. (2007). Synthesis and study of silver nanoparticles. Journal of
chemical education, 84(2), 322.
Pötschke, P., Pegel, S., Claes, M., & Bonduel, D. (2008). A novel strategy to
incorporate carbon nanotubes into thermoplastic matrices. Macromolecular
Rapid Communications, 29(3), 244-251.
Prosycevas, I., Tamulevicius, S., & Guobiene, A. (2004). The surface properties of
PS/PMMA blends nanostructured polymeric layers. Thin solid films, 453, 304-
311.
Sui, Z., Chen, X., Wang, L., Xu, L., Zhuang, W., Chai, Y., & Yang, C. (2006). Capping
effect of CTAB on positively charged Ag nanoparticles. Physica E: Low-
dimensional Systems and Nanostructures, 33(2), 308-314.

39
Syms, R. R., Yeatman, E. M., Bright, V. M., & Whitesides, G. M. (2003). Surface
tension-powered self-assembly of microstructures-the state-of-the-art.
Microelectromechanical Systems, Journal of, 12(4), 387-417.
Tang, Y., Du, B., Yang, J., & Zhang, Y. (2006). Temperature effects on surface activity
and application in oxidation of toluene derivatives of CTAB-SDS with KMnO4.
Journal of Chemical Sciences, 118(3), 281-285.
Thompson, R. B., Ginzburg, V. V., Matsen, M. W., & Balazs, A. C. (2001). Predicting
the mesophases of copolymer-nanoparticle composites. Science, 292(5526),
2469-2472.
Ton-That, C., Shard, A., Teare, D., & Bradley, R. (2001). XPS and AFM surface studies
of solvent-cast PS/PMMA blends. Polymer, 42(3), 1121-1129.
Wu, S. (1970). Surface and interfacial tensions of polymer melts. II. Poly (methyl
methacrylate), poly (n-butyl methacrylate), and polystyrene. The Journal of
Physical Chemistry, 74(3), 632-638.


![2.KOMPOZiT KESiT VE KESME BiRLEÅ Ä°MÄ°insaat.eskisehir.edu.tr/kivanct/İNŞ 569/icerik/2.KOMPOZiT KESiT VE KESME BiRLEŞİMİ....hvph %luohúlpl 2opdpdvÕ gqfholnoh $% lo \ ]h\l](https://img.dokumen.tips/doc/110x75/5e6375700d4ddb12d96f9501/2kompozit-kesit-ve-kesme-birle-m-n-569icerik2kompozit-kesit-ve.jpg)