Embed Size (px)
Citation preview
HAL Id: tel-01825025https://tel.archives-ouvertes.fr/tel-01825025
Submitted on 28 Jun 2018
HAL is a multi-disciplinary open accessarchive for the deposit and dissemination of sci-entific research documents, whether they are pub-lished or not. The documents may come fromteaching and research institutions in France orabroad, or from public or private research centers.
L’archive ouverte pluridisciplinaire HAL, estdestinée au dépôt et à la diffusion de documentsscientifiques de niveau recherche, publiés ou non,émanant des établissements d’enseignement et derecherche français ou étrangers, des laboratoirespublics ou privés.
Selective Hydrogenation of Butadiene over Non-nobleBimetallic Catalysts
Zhao Wang
To cite this version:Zhao Wang. Selective Hydrogenation of Butadiene over Non-noble Bimetallic Catalysts. Materialchemistry. Université Pierre et Marie Curie - Paris VI, 2017. English. �NNT : 2017PA066102�. �tel-01825025�

Université Pierre et Marie Curie
Ecole Doctorale de Physique et Chimie des Matériaux
Laboratoire de Réactivité de Surface
Selective Hydrogenation of Butadiene over Non-noble
Bimetallic Catalysts
Par : Zhao WANG
Thèse de doctorat de CHIMIE
Dirigée par Catherine LOUIS
Présentée et soutenue publiquement le 26 Juin 2017 devant un jury composé de :
Laurent PICCOLO Chargé de recherche HDR (IRCELyon) Rapporteur
Catherine ESPECEL Maitre de conférences HDR (IC2MP) Rapporteur
Petra de JONGH Professeur (Utrecht University) Examinatrice
Antoine HUGON Ingénieur (IFPEN) Examinateur
Isabelle LISIECKI Directrice de recherche (UPMC) Examinatrice
Laurent DELANNOY Maitre de conférences (UPMC) Examinateur
Catherine LOUIS Directrice de recherche (UPMC) Directrice de thèse

“Good good study, day day up.”
Chinese aphorism
Acknowledgements
This work was carried out at the Laboratoire de Réactivité de Surface (UMR 7197) of
Université Pierre et Marie Curie (UPMC). My first thank goes to the China Scholarship
Council (CSC) for the funding of this PhD research.
I would like to thank Dr. Claire-Marie Pradier and Prof. Hélène Pernot for offering
me access to the laboratory and research facilities. Without their support it would not be
possible to perform this research.
I would like to thank my thesis committee: Dr. Laurent Piccolo, Dr. Catherine
Especel, Prof. Petra de Jongh, Dr. Antoine Hugon and Dr. Isabelle Lisieki for their
willingness to read and judge this thesis.
I would like to express my gratitude to my two supervisors: Dr. Catherine Louis, who
provided me the opportunity to join her team as intern, for her patience, for her continuous
support, for her guidance that greatly helped me in all the time of research and writing of this
thesis; Dr. Laurent Delannoy, who introduced me into the field of catalytic selective
hydrogenation, for his brilliant propositions when we met scientific problems, for his well
organization throughout my PhD study. Thank you to my supervisors for your kind helps and
useful advises that make me have a wonderful PhD experience.
I would like to thank Guillaume Wang, Sandra Casale and Dalil Brouri for their
contribution to transmission electron microscopy (TEM) characterization, Christophe Calers
for the XPS analyses, Jean-Marc Krafft for the experiments of DRIFTS and Raman, Juliette
Blanchard for the DRX analyses, Cyril Thomas for the characterization by H2
chemisorption, Xavier Carrier for the experiment of Thermogravimetric Analysis (TGA),
Cyril Domingos for the temperature program reduction (TPR) experiments.
I would like to thank Sabine Même. Thank you for frequent visiting my office, for
teaching me French. I would like also thank Annie Mettendorff for her kind help when I met
some problems in the lab and for her encouragement.
I would like express my joyful and happiness for having friends with PhD students and
post-doctorates. Staying with you always make me fell recharged and keep pace with my

thesis: Gode, Jane, Cédric, Tesnim, Camella, Kim, Antoine, Antonio, Xiaojing, Sarah,
Longfei, Lu and Miao. I would also like to thank Tiago, Yuiry, Diaa, Mariame, Olfa,
Achraf for your kindness.
I would like also thank my friends: Tuo and Meilin, for helping me out of the hardest
time living in Paris; Association de Boursiers CSC en Ile de France (ABCF), for offering
me a colorful life in France; Guangfang, Long, Tian, Yi, Xinyue and Yang, for your
encouragement.
I would like thank my family: my parents, my sisters and brothers, specially, my wife
(Xiaoyue) and my son (Jiarui) for supporting me spiritually throughout writing this thesis
and my life in general.
Last but not least, I would like to thank everyone in the Laboratoire de Réactivité de
Surface (UMR 7197). It was great sharing laboratory with all of you during the last four
years.
Chapter 1: Introduction ........................................................................................................... 1
1. Background on selective unsaturated hydrocarbons hydrogenation .................................. 1
2. The goal of my thesis ......................................................................................................... 7
3. Selective hydrogenation of 1,3-butadiene .......................................................................... 8
3.1 The structure of 1,3-butadiene ..................................................................................... 9
3.2 Hydrogenation of 1,3-butadiene ................................................................................. 10
4.Review of the research experience on noble bimetallic catalysts for selective
hydrogenation in the Laboratoire de Réactivité de Surface (LRS) ...................................... 12
5. Review of few non-noble metal catalyst preparations and characterizations work in the
Laboratoire de Réactivité de Surface (LRS) ........................................................................ 12
6. The outline of this Thesis ................................................................................................. 14
7. Reference .......................................................................................................................... 15
Chapter 2: Techniques for catalysts preparation and characterization ........................... 23
1. Raw chemical materials for the study .............................................................................. 23
2. Methods of sample preparation ........................................................................................ 24
2.1 Deposition-precipitation with urea (DPu) .................................................................. 26
2.1.1 Low solubility metal precursor conversion .......................................................... 26
2.1.2 Surface charge of the support ............................................................................... 30
2.1.3 The steps of deposition-precipitation with urea ................................................... 31
2.2 Deposition-precipitation at fixed pH .......................................................................... 32
2.2.1 The steps of deposition-precipitation at fixed pH ................................................ 33
2.2.2 Theoretical calculation for the selection of preparation condition ....................... 33
3. Techniques for samples characterization ......................................................................... 35
4. The selective butadiene hydrogenation in the excess of propene .................................... 39
4.1 The catalytic test system and condition for the experiment ....................................... 39
4.2 The evaluation of the catalytic performance .............................................................. 42
5. Reference .......................................................................................................................... 44
Chapter 3: Preparation and Characterization of Monometallic Catalyst (Cu, Zn, Ni) .. 47
1. Introduction ...................................................................................................................... 47
2. Preparation of monometallic catalysts ............................................................................. 48
3. Monometallic Cu/TiO2 Catalysts ..................................................................................... 49

3.1 Cu deposition-precipitation process ........................................................................... 50
3.1.1. Cu loading at different final pHs ......................................................................... 52
3.1.2 pH evolution of the mixture solution during deposition-precipitation process .... 53
3.2 Characterization of the Cu/TiO2 samples prepared by DPu ....................................... 55
3.2.1 XRD ..................................................................................................................... 55
3.2.2 UV-Visible ........................................................................................................... 59
3.2.3 TPR ....................................................................................................................... 60
3.2.4 TEM study of the metal particle size in Cu/TiO2 samples ................................... 62
3.3 Selective hydrogenation of 1,3-butadiene .................................................................. 64
3.4 Discussion .................................................................................................................. 66
3.5 Conclusions ................................................................................................................ 72
4. Monometallic Zn/TiO2 Catalysts ..................................................................................... 73
4.1 Zn loading at different final pHs ................................................................................ 73
4.2 pH evolution of the Zn2+
/TiO2 mixture solution during DPu ..................................... 74
4.3 Reduction behavior of Zn/TiO2 .................................................................................. 75
4.4 Selective hydrogenation of 1,3-butadiene over Zn/TiO2 catalyst .............................. 75
5. Monometallic Ni-based catalysts ..................................................................................... 76
5.1 Monometallic Ni/TiO2 catalysts ................................................................................. 77
5.1.1 Catalytic performance of 2.5 wt% Ni/TiO2 sample ............................................. 79
5.1.2 Catalytic performance of 0.5wt% Ni/TiO2 sample .............................................. 80
5.2 Monometallic Ni/ZnO catalysts ................................................................................. 81
6. Conclusion ........................................................................................................................ 89
7. References ........................................................................................................................ 91
Chapter 4: Novel Non-Noble Bimetallic Cu-Zn/TiO2 Catalysts for Selective
Hydrogenation of Butadiene ................................................................................................. 98
1. Introduction ...................................................................................................................... 98
2. Catalysts preparation ...................................................................................................... 100
3. Results and discussion .................................................................................................... 101
3.1 XRF study of metals deposition-precipitation behavior .......................................... 101
3.2 UV-Visible study of calcined Cu-Zn/TiO2 catalysts ................................................ 102
3.3 Study of the thermal stability of Zn under H2 atmosphere ....................................... 103
3.4 Reduction behavior of calcined Cu-Zn/TiO2 catalysts ............................................. 104

3.5 XRD study of calcined and reduced Cu-Zn/TiO2 catalysts ...................................... 105
3.6 UV-Visible study of calcined then reduced Cu-Zn/TiO2 catalysts .......................... 106
3.7 STEM-HAADF study of calcined Cu-Zn/TiO2 catalysts ......................................... 107
3.8 EDS study of calcined Cu-Zn/TiO2 catalysts ........................................................... 108
3.9 XPS of ex-situ calcined then reduced mono Cu/TiO2 and bimetallic Cu-Zn/TiO2
catalysts .......................................................................................................................... 111
4. Catalytic results – Butadiene selective hydrogenation ................................................... 112
5. Conclusion ...................................................................................................................... 123
6. References ...................................................................................................................... 125
Chapter 5: Synthesis of TiO2 supported Ni-Zn bimetallic catalyst for selective
hydrogenation of 1,3-butadiene in the presence of an excess of propene ........................ 130
1. Introduction .................................................................................................................... 130
2. Catalysts preparation ...................................................................................................... 132
3. Results and discussion .................................................................................................... 133
3.1 Deposition behaviour of Ni2+
and Zn2+
onto TiO2 during sample preparation ........ 133
3.2 TPR of calcined 0.5wt% Ni-Zn/TiO2 samples ......................................................... 135
3.3 Thermal stability of Zn under H2 atmosphere .......................................................... 136
3.4 XRD of calcined then reduced 0.5wt% Ni-Zn/TiO2 samples .................................. 137
3.5 STEM-HAADF coupled with EDS .......................................................................... 138
3.6 Selective hydrogenation of Butadiene in an excess of propene ............................... 143
3.6.1 Activity and selectivity ....................................................................................... 143
3.6.2 Stability and regeneration ................................................................................... 146
4. Conclusion ...................................................................................................................... 153
5. Reference ........................................................................................................................ 155
Chapter 6: Preliminary explorations of the use of supported bimetallic Fe-based
catalysts for selective hydrogenation reaction ................................................................... 159
1. Introduction .................................................................................................................... 159
2. Preparation of Fe-based catalysts ................................................................................... 160
3. Monometallic Fe/ZnO catalyst ....................................................................................... 162
3.1 Reduction behaviour of Fe(II)/ZnO catalysts. .......................................................... 162
3.2 Structure evolution of Fe(II)/ZnO after different thermal treatments ...................... 163
3.3 catalytic performance ............................................................................................... 164
4. Bimetallic Fe-Zn/TiO2 catalysts ..................................................................................... 166

4.1 Fe, Zn loading at different final preparation time with Fe2+
/Fe3+
precursors ........... 167
4.3 XRD of the as-prepared and calcined Fe-Zn/TiO2 catalysts .................................... 168
4.4 TPR of Fe-Zn/TiO2 catalyst ..................................................................................... 169
4.5 XRD of reduced Fe-Zn/TiO2 catalyst ....................................................................... 170
4.6 Selective hydrogenation of butadiene in an excess of propene ................................ 171
5. Conclusion ...................................................................................................................... 174
6. Reference ........................................................................................................................ 175
Chapter 7: Conclusion and Outlook ................................................................................... 176

Chapter 1: Introduction

Chapter 1: Introduction........................................................................................................... 1
1. Background on selective unsaturated hydrocarbons hydrogenation .................................. 1
2. The goal of my thesis ......................................................................................................... 7
3. Selective hydrogenation of 1,3-butadiene .......................................................................... 8
3.1 The structure of 1,3-butadiene ..................................................................................... 9
3.2 Hydrogenation of 1,3-butadiene ................................................................................. 10
4. Review of the research experience on noble bimetallic catalysts for selective
hydrogenation in the Laboratoire de Réactivité de Surface (LRS) ...................................... 12
5. Review of few non-noble metal catalyst preparations and characterizations work in the
Laboratoire de Réactivité de Surface (LRS) ........................................................................ 12
6. The outline of this Thesis ................................................................................................. 14
7. Reference .......................................................................................................................... 15

1
Chapter 1: Introduction
1. Background on selective unsaturated hydrocarbons hydrogenation
In our modern life, we are surrounded by different kinds of polymers, such as plastic
containers, furniture, shell of most electronic products and synthetic fabric. These organic
products are mainly produced through catalytic polymerization reactions using unsaturated
hydrocarbons, especially alkenes, as the raw materials. For instance, ethylene is employed to
produce polyethylene, which could be the plastic-based materials; propylene is usually used
to produce polypropylene-based materials [1]; Moreover, but-1- and -2-enes, isobutenes and
isopentene are also very important hydrocarbons raw materials used in various fields of
organic industry e.g., 1-butene can be used as a co-monomer for sec-butyl alcohol, maleic
anhydride and polybutylene preparation; 2-butene is used as alkylating agent for the
production of high octane gasoline, ethyl methyl ketone and maleic anhydride; the isobutenes
and isopentene are mainly used in the field of tert-butyl and tert-pentyl synthesis [2]. The
requirement of these raw alkenes for industry can be demonstrated by the dynamic growth of
their world output. The demand in ethylene, which is the largest basic chemical building
blocks, was only 80.5 million tons in 1998, ~175 in 2015 and the output predicted for 2020 is
above 200 million tons [3]. Propylene is expanding at a rapid pace, which is 47 million tons in
1998, ~125 in 2015 and the values predicted for 2020 is ~160 million tons [3].
The unsaturated hydrocarbons are synthesized by cracking of petroleum hydrocarbons
including heavy liquid fractions i.e., crude oil, [4]. However, the petroleum hydrocarbons are
cracked at high temperature, which usually results in the formation of alkynes or dienes as
impurities. i.e., 0.5 to 3% of acetylene in ethylene, 2 to 8% of propyne and propadiene in
propene [5] and 0.3 to 6.0% of residual butadiene in butenes [6]. These impurities can poison
the catalysts used for the alkenes polymerization reactions [7]. For example, during the 2-
butenes polymerization, the 2-butyne impurity in the butenes feed reacts with the Cp*2ScCH3
[Cp*=(η5-C5Me5)] catalyst and forms Cp*2ScC(CH3)=C(CH3)2, no more further reaction can
be observed on the catalytic surface [8]. The reaction as follows:

2
As a result, the contents of alkyne and diene impurities in the feed raw alkenes materials must
be controlled and be less than 10, 5, 2 or even 1 ppm, depending on the final polymer
products [9-12]. For instance, the polymer-grade ethylene product should not contain more 5
ppm of acetylene [13].
Basically, there are three main paths to remove or transform the alkynes and dienes
impurities, (i), remove such impurities by fractional distillation. This method is uneconomic
with high energy consumption [14]; (ii), Extract them from alkene stream by solvent
extraction [13, 15] or metal-organic frameworks (MOF) adsorption [16] and recover them as a
product. However, these two methods are limited considering the safety problems as a high
alkyne/dienes partial pressure can be reached in the solvent extraction facility [13] and the
low efficiency of the MOF adsorption as the high requirement proposed by industry and
environment [16]; (iii), Convert the impurities into useful products by selective catalytic
hydrogenation, which is the most widely used method for reducing the concentration of
alkynes and dienes impurities. Supported metals catalysts are designed to semi-hydrogenate
alkynes and dienes into alkenes, perfectly without any alkanes and oligomers formation, such
that there is a net increase in the amount of alkenes (Figure 1-1). As a result, an ideal catalyst
for selective hydrogenation should satisfy the low activation barrier for alkynes/dienes
conversion (high activity), very limited alkanes formation (no overhydrogenation; high
selectivity) and should not favor the formation of oligomers, which are responsible for
catalysts deactivation by fouling, through C-C coupling (high stability) [17]. Besides that,
considering the industrial requirement for polymer synthesis, the catalysts for selective
hydrogenation of alkyne and dienes should also meet a particular set of requirements, such as:
low price and easy preparation and regeneration.
Figure 1-1: a net for increasing alkenes concentration by selective hydrogenation of alkynes
impurities
3
According to the industrial [18-20] and academic [21-26] literature, palladium based
catalysts are widely used for industrial selective hydrogenation. However, even though the
pure palladium catalysts have high catalytic activity, it has been found that their selectivity to
alkenes decreases sharply at high alkyne conversion, e.g., the selectivity to ethylene decreases
from ~90 to 10% when acetylene conversion increases from ~80 to 100% for selective
acetylene hydrogenation in excess of ethylene on 3wt% Pd/ boehmite catalyst [27] as may be
the concentration of alkynes become very low and alkenes start to adsorb and to hydrogenate
into alkanes [27-29]. Moreover, the bulk-dissolved hydrogen in the subsurface of palladium is
believed to enhance the overhydrogenation of alkynes/dienes to alkanes [21, 24, 30, 31].
Recent studies showed that incorporation of carbon atoms into Pd nanoparticles [32-34] and
alloying with a second metal, i.e., Pd-Ag [35-37], Pd-Au [38], Pd-Ni[39], Pd-Cu [40], could
highly increase the selectivity to alkenes as it could prevent the diffusion of hydrogen into
subsurface and modify the equilibrium of hydrogen between the surface and deeper layer on
palladium [30] and hinder the hydride formation [41]. Currently, the palladium based
catalysts mostly used in the market are Pd/Al2O3 with Pd=0.3 wt% (HDMax PA), Pd-
Ag/Al2O3 with Pd=0.047 wt% and Ag=0.28 wt% (G58E) and Pd-Ag/Al2O3 with Pd=0.018
wt% and Ag=0.08 wt% (G83S) synthesized by Süd-Chemie [9].
As mentioned above a suitable industrial catalyst for selective hydrogenation of
unsaturated hydrocarbons impurity does not only require high catalytic performances, but also
a low price. As a result, beyond noble metals, several non-noble metal catalysts have also
been explored, such as copper, nickel, cobalt and iron [42]. It has been found that supported
copper catalysts have relatively high catalytic activity and selectivity to alkenes in alkynes
hydrogenation [43]. However, copper catalysts are not stable as oligomerization reaction
(green oil formation) occurs on the Cu surface resulting in a rapid deactivation [44, 45]. Only
few studies focused on nickel based catalyst [42, 46-48] and almost no work concerned
supported iron catalysts for selective hydrogenation in the few recent decades [42], until Studt
et al [49] underlined the high potential of the non-noble bimetallic catalysts, such as Ni-Zn
alloy for selective acetylene hydrogenation in 2008.
Studt et al [49] proposed that selective hydrogenation reaction of unsaturated
hydrocarbons is controlled by desorption barriers as the activation barriers for the reaction
was considered to be metal-independent; this has been observed for a number of other
hydrogenation reactions by Liu et al [50]. Considering acetylene and ethylene heat of

4
adsorption as the parameter determining catalytic activity and selectivity to ethylene, Studt et
al introduced a scaled relation between the adsorption energies of acetylene and ethylene and
the methyl group adsorption energy (ΔECH3) (Figure 1-2A), based on the fact that the
adsorption energy of any hydrocarbon molecule on a metal scales approximately with the
adsorption energy of the central C atom, as established using density functional theory
calculation (DFT) by Abild-Pedersen et al [51]. Figure 1-2A shows that the higherΔECH3
value gives lower catalytic activity (turnover) and higher catalytic selectivity for acetylene
selective hydrogenation as the activation barrier for C2H2 is closer to the desorption activation
energy of C2H2 and the activation barrier for C2H4 will be greater than the desorption
activation energy of C2H4. The authors proposed some interesting non-noble bimetallic
catalysts for acetylene selective hydrogenation, underlining the fact that Ni-Zn alloy could
have catalytic activity and selectivity similar to palladium-based catalysts. Moreover, these
non-noble bimetallic catalysts are very cheap (~10 dollars per kg), which is 100 times lower
than that of palladium based catalysts (Figure 1-2B).
To verify their calculation about the non-noble bimetallic catalysts, Studt et al [49]
prepared a series of 10 wt% Ni-Zn samples supported on MgAl2O4 with different Ni/Zn ratios
(Ni, Ni0.45Zn0.55, Ni0.33Zn0.67 and Ni0.25Zn0.75) by impregnation method, and compared them
with 1 wt% Pd and Pd0.25Ag0.75 samples. The catalytic data for selective acetylene
hydrogenation showed that with increasing Zn loading, Ni-Zn catalysts show higher
selectivity to ethylene even at high acetylene conversion. However, the authors did not
present any direct evidence for the supported Ni-Zn alloy formation after thermal treatment
and for the catalytic stability of the Ni-Zn/MgAl2O4 samples, leaving the questions of
supported non-noble bimetallic compounds preparation and their catalytic stabilities for the
selective hydrogenation reaction unresolved.

5
Figure 1-2: (A) Heats of adsorption for acetylene (C2H2) and ethylene (C2H4) plotted against
the heat of adsorption for methyl (CH3). The solid lines show the predicted acetylene (red
line) and ethylene (blue line) adsorption energies from scaling. The dotted lines define the
region of interest, where the ethylene binding energy is less than the barrier for further
hydrogenation (blue) and where the reactivity of the acetylene hydrogenation step equals 1 s-1
per site (red). (B) Price (in 2006) of 70 binary intermetetallic compounds plotted against the
calculated methyl binding energies. [49]
In 2014, the questions were partially answered by Spanjers et al [52], who studied the
catalytic performances of Ni-Zn alloy using bulk intermetallic Ni-Zn compounds (Ni4Zn,
NiZn and Ni5Zn21 alloy), combined with isotopic labeling in batch reactor (13
C2H2, 12
C2H4), in
selective acetylene hydrogenation (acetylene: hydrogen: ethylene ratio 1: 10: 20). The authors
found that the oligomeric species (e.g., butadiene, propylene, 1-butene, cis-2-butene,
isobutylene, and trans-2-butene) are only produced from acetylene (13
C2H2) and not from
ethylene (12
C2H4), and zinc inclusion into nickel catalyst could reduce the formation of these
oligomeric species. Considering that bulk intermetallic Ni-Zn catalysts have low surface areas
(< 1 m2 g
-1) and low catalytic activity (< 2×10
-8 molC2H2 · s
-1 · gcat
-1) [52], the authors also
carried out a study on supported Ni/ZnO and Ni/SiO2 catalysts [53] in 2015 and found that the
ZnO supported NiO nanoparticles was directly transformed to α-NiZn at low reduction
temperature (<500 oC) and β-NiZn alloy was mainly formed when the reduction temperature
was higher than 500 oC. Moreover, NiZn alloy supported by ZnO catalysts displayed lower
selectivity to ethylene than the metallic Ni supported by SiO2, whatever the reduction

6
temperatures, which is in contrast to the results from bulk intermetallic Ni-Zn catalysts, which
showed that an increasing Zn content leads to an increase of selectivity to ethylene, and also
does not agree with the prediction of Studt et al [49]. Thus the authors concluded that the ZnO
support has a negative effect on ethylene selectivity. However, neither of their papers reports
any information on the catalytic stability of bulk intermetallic Ni-Zn and Ni/ZnO catalysts.
In addition, Liu et al [54] found that unsupported intermetallic NixMy (M=Ga, Sn) has
excellent selectivity to alkenes and good catalytic stability during long term acetylene
hydrogenation. Kang M et al [55] also showed that alloying Ni with Cu could increase the
selectivity but decrease the catalytic activity of metallic Ni, however, the catalytic stability of
Ni-Cu alloy was not mentioned.
Besides Ni-Zn alloy, Studt et al [49] also predicted using DFT calculation that Cu-Zn
alloy could have a higher selectivity than metallic Cu in selective acetylene hydrogenation.
However, the main problem of metallic Cu as a catalyst for selective hydrogenation reaction
is not the selectivity to alkenes but its low stability. Moreover, currently, the modification of
the catalytic performance of Cu was mainly studied by alloying with a noble metal as the
promoter, such as gold [56], palladium [57-59] and platinum [60], which showed a better
catalytic stability than monometallic copper. Regarding copper based non-noble bimetallic
catalyst, even though the promotional role of Zn on the activity and selectivity of supported
Cu catalysts has been studied in some reactions, e.g., the formation of Cu-Zn active sites for
methanol synthesis [61-63], the effect of alloying with Zn on the stability of Cu has not been
reported, especially for selective hydrogenation reaction.
Even though iron based catalyst have been used for different applications, such as in
Fischer-Tropsch synthesis [64], carbon nanotubes synthesis [65], hydrogenation of ketones
[66] and even in some biomedical applications [67-69], only little attention has been paid in
the field of selective hydrogenation of polyunsaturated hydrocarbons. Unsupported
monodispersed iron nanoparticles (~2 nm) were found to be active in the hydrogenation of
various alkenes and alkynes under mild conditions [70, 71]. Recently, the catalytic
performance of the bulk intermetallic Al13Fe4 compound has been compared with a
commercial 5 wt% Pd/Al2O3 catalyst and an industrial benchmark catalyst for selective
acetylene hydrogenation (C2H2 : H2 : C2H4 ratio 1 : 10 : 100) by Armbruster et al [72] (Figure.
1-3). Unsupported Al13Fe4 showed high catalytic stability (red dotted line in Figure 1-3) with
only 6% lower selectivity (red full line in Figure 1-3) to ethylene than the industrial

7
benchmark catalyst (blue dotted and full lines in Figure 1-3). Note that the industrial
benchmark catalyst has been highly optimized for selective hydrogenation of ethylene
reaction, whereas the Al13Fe4 could still be optimized.
Figure 1-3: Conversion (C, dotted line) and selectivity (S, full line) to ethylene of unsupported
Al13Fe4, 5wt% Pd/Al2O3 and an industrial benchmark catalyst in the semi-hydrogenation of
acetylene over 20 h time on stream (reaction condition: 0.5% C2H2, 5% H2, 50%C2H4 in He,
30 ml min-1
total flow, 200 oC) [72]
Al13Fe4 also showed high activity in butadiene partial hydrogenation with high
selectivity to butenes at room temperature [73]. Those studies revealed that iron based non-
noble bimetallic catalysts could be a low-cost alternative for palladium in heterogeneous
hydrogenation. Thus, it might be very interesting to explore the used of Fe-Zn alloy, which
has been already mentioned by Studt et al [49] (Figure 1-2B), as a promising catalyst for
selective alkynes hydrogenation.
2. The goal of my thesis
As it has been mentioned above, supported Cu-Zn, Ni-Zn and Fe-Zn catalysts have the
potential to replace commercial palladium-based catalysts in the area of unsaturated
hydrocarbon selective hydrogenation, and the small number of work related to these kinds of
catalysts leaves a large space for the further exploration on their utilizations. Thus, this thesis
mainly focuses on the preparation and characterization of supported non-noble mono/bi-
metallic catalysts, including Cu-Zn, Ni-Zn and Fe-Zn, and their catalytic properties for the

8
selective hydrogenation of polyunsaturated hydrocarbons in the presence of excess of alkenes
to mimic a catalytic operation of purification of an alkene cut. The goals of this thesis are:
- Catalyst preparation: Firstly, considering that the main method for sample
preparations in this thesis is deposition-precipitation with urea (introduced in chapter 2),
which is a method based on the gradual increase of the pH of the preparation solution during
urea decomposition at 80 oC in order to favor metal complex deposition on the support
surface, the deposition – precipitation behavior of the non-noble metal ions on support will be
studied during the pH increasing.
- Catalyst characterization: The conditions for Cu-Zn, Ni-Zn and Fe-Zn alloy
formation are explored. To verify the formation of bimetallic compounds in the bimetallic
catalysts, X-Ray Diffraction (XRD) is applied to determine the metallic phases existing in the
sample after thermal treatment. Moreover, scanning transmission electron microscopy
(STEM) allows not only studying the particle size and dispersion of the particles on the
support surface by high annular dark-field mode (HAADF), but also analyzing the
composition of the nanoparticles on the TiO2 surface by energy dispersive X-ray spectrometry
(EDS).
- Catalytic performances: Lastly, after in situ activation at a given temperature, the
catalytic properties of the mono and bimetallic catalyst will be studied and compared in the
selective hydrogenation of 1,3-butadiene in the presence of an excess of propene (introduced
in Chapter2). Meanwhile, the effect of alloying of copper, nickel and iron with zinc on the
catalytic activity, selectivity and stability will be studied.
3. Selective hydrogenation of 1,3-butadiene
In this part, the molecular structure of 1,3-butadiene is analyzed by valence-bond
theory [74] and molecular orbital theory [75]. After that, different routes of hydrogen addition
reactions in 1,3-butadiene molecule are described, including: 1,2-addition, 1,4-addition and
2,3-addition reactions. At last, the expected selective hydrogenation of 1,3-butadiene in
excess of propene route is introduced for this study.
9
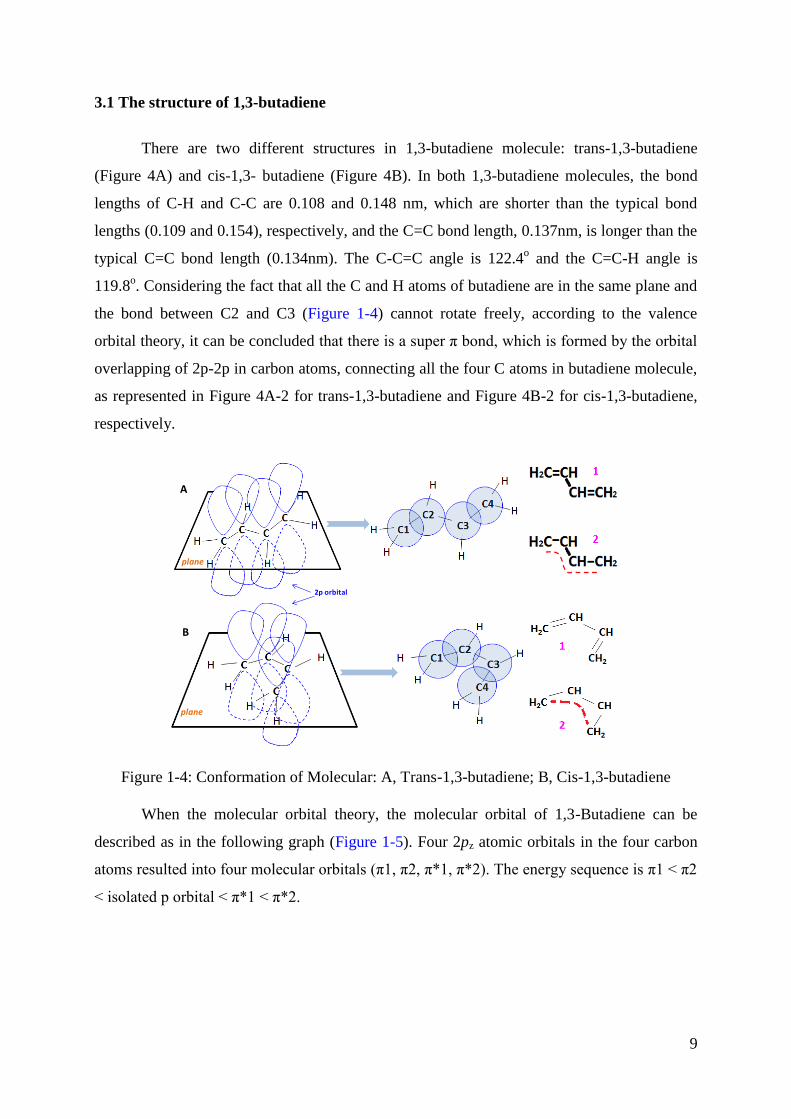
3.1 The structure of 1,3-butadiene
There are two different structures in 1,3-butadiene molecule: trans-1,3-butadiene
(Figure 4A) and cis-1,3- butadiene (Figure 4B). In both 1,3-butadiene molecules, the bond
lengths of C-H and C-C are 0.108 and 0.148 nm, which are shorter than the typical bond
lengths (0.109 and 0.154), respectively, and the C=C bond length, 0.137nm, is longer than the
typical C=C bond length (0.134nm). The C-C=C angle is 122.4o and the C=C-H angle is
119.8o. Considering the fact that all the C and H atoms of butadiene are in the same plane and
the bond between C2 and C3 (Figure 1-4) cannot rotate freely, according to the valence
orbital theory, it can be concluded that there is a super π bond, which is formed by the orbital
overlapping of 2p-2p in carbon atoms, connecting all the four C atoms in butadiene molecule,
as represented in Figure 4A-2 for trans-1,3-butadiene and Figure 4B-2 for cis-1,3-butadiene,
respectively.
plane
A
plane
B
2p orbital
Figure 1-4: Conformation of Molecular: A, Trans-1,3-butadiene; B, Cis-1,3-butadiene
When the molecular orbital theory, the molecular orbital of 1,3-Butadiene can be
described as in the following graph (Figure 1-5). Four 2pz atomic orbitals in the four carbon
atoms resulted into four molecular orbitals (π1, π2, π*1, π*2). The energy sequence is π1 < π2
< isolated p orbital < π*1 < π*2.

10
Figure 1-5: molecular orbital of 1,3-Butadiene
3.2 Hydrogenation of 1,3-butadiene
Since there is a super π bond in 1,3-butadiene molecular, normally, there are three
possible routes for the hydrogen addition in butadiene (Figure 1-6): 1,2-addition, 1,4-addition
and 2,3-addition. 1,2-addition means that two hydrogen atoms are added onto the C1 and C2
atom resulting in 1-butene formation. For 1, 4-addition, two hydrogen atoms are added onto
the C1 and C4 atom with 2-butenes (cis-2-butene and/or trans-2-butene) formation. With
hydrogenation going on, these three unsaturated butenes can transform to butane. Whereas for
2,3-addition, the butadiene will be fully hydrogenated to butane as the formation of the
intermediate product (*CH2CH2CH2CH2*) is unstable and can reacts with other two H atoms
quickly. Note that a transformation between trans-2-butene and cis-2-butene can happen
through isomerization reaction, which has been verified by Gómez et al [76] through DFT
calculation using Pd/Ni (111) bimetallic as the model.

11
Isomerization
Figure 1-6 three different hydrogen addition reactions on butadiene molecular: 1,2-addition,
1,4- addition and 2,3-addition
As it was described in the first part of this Chapter, 1,3-butadiene is considered as an
impurity in butenes stream produced from oil cracking, with concentration 0.3 to 6% [6], and
the purpose of using catalytic selective hydrogenation of 1,3-butadiene is to form butenes, and
to avoid butane formation, thus 1,2-addition and 1,4-addition reactions are expected on the
surface of the catalyst without any further hydrogenation reactions.
In this study, in order to simulate the process required for the purification of industrial
alkenes streams to prevent further poisoning of the polymerization catalysts used for
polyalkene production, a gas phase 1,3-butadiene in an excess of propene (0.3% butadiene,
30% propene and 20% hydrogen) is used for the investigation of catalytic performance. Here,
propene is selected as the main alkene instead of butenes for the ease of detection by gas
chromatography of the alkane (butane) arising from the reaction of hydrogenation of 1, 3-
butadiene from the alkane (propane) arising from the hydrogenation of alkene (propene) in
excess. As a result, during hydrogenation of the gas mixture, 1,3- butadiene is expected to be
semi-hydrogenated to butenes (1-butene, trans-2-butene or cis-2-butene) with no further
butane formation and no propane formation arising from propene hydrogenation (Figure 1-7).

12
Figure 1-7, selective hydrogenation in the gas mixture during catalytic reaction
4. Review of the research experience on noble bimetallic catalysts for
selective hydrogenation in the Laboratoire de Réactivité de Surface (LRS)
Since supported gold nanoparticles have been discovered to be highly catalytic active
in CO oxidation at room temperature in the late eighties [77, 78], the Laboratoire de
Réactivité de Surface carried out various studies focusing on the preparation of supported
gold based catalysts [79-81] i.e., deposition-precipitation (DP), ion adsorption (IA),
impregnation in excess of solution (IE), and on applications of these catalysts, such as for
catalytic oxidation reactions [82-85] and hydrogenation reactions [80, 86, 87]. In the selective
hydrogenation of 1,3-butadiene in excess of propene reaction, it was found that mono metallic
gold catalysts are highly selective to alkenes, but with a low activity [56, 80]. In addition,
different kinds of gold-based bimetallic catalysts were also explored in the recent years, such
as supported Au-Pd bimetallic catalysts with high Au/Pd atomic ratios that were found to be
more active than monometallic gold for butadiene selective hydrogenation and more selective
to butenes than palladium catalysts [88, 89]. Supported Au-Cu [56] and Au-Zn [90] bimetallic
catalysts were also studied for the same reaction.
5. Review of few non-noble metal catalyst preparations and
characterizations work in the Laboratoire de Réactivité de Surface (LRS)
In the past the Laboratoire de Réactivité de Surface also studied the preparation and
characterization of supported non-noble metal catalysts, i.e., Ni/SiO2, Cu/SiO2, Zn/SiO2 and
Cu/ZnO.

13
In the 90th
, the preparation of Ni/SiO2 catalysts was studied. They were prepared by
different methods, e.g., incipient wetness impregnation (IWI) [91, 92] and deposition-
precipitation with urea (DPu) [93-96], and the mechanism of deposition-precipitation of Ni
(II) phase on silica and the formation of nickel phyllosilicate (1:1) was deeply explored at the
molecular level [97].
The preparation of supported Cu catalysts was also explored. The influence of the
experimental conditions (i.e., sample preparation method, and thermal treatment) on the size
of the Cu particles supported on SiO2 was explored [98], and revealed that the drying step has
a drastic influence on the size of the metal particles after calcination and reduction for the
sample prepared by impregnation and the presence of chemical bonds between Cu2+
and the
SiO2 for the sample prepared by cationic exchange. Later, the interaction between Cu
complexes and SiO2 support was studied by EXAF spectroscopy [99] using Cu/SiO2 sample
prepared by cationic exchange, it has been found that the interaction between Cu complexes
and SiO2 surface is probably simple electrostatic adsorption when the sample is wet, and that
grafting occurs during the sample drying step. Moreover, as for Cu/SiO2 prepared by cationic
exchange, a kind of copper phyllosicate was also formed in the as-prepared Cu/SiO2 samples
[98, 100].
In 2003, supported Zn samples prepared by incipient wetness impregnation have been
studied. The evolution of zinc species on silica surface during sample drying and calcinations
was studied by Chouillet et al [101]. They showed that the zinc silicate (Zn4Si2O7(OH)2·H2O,
called hemimorphite) was the main phase and the ZnO formation strongly depends on the
drying temperature after impregnation.
Based on the works performed on supported mono-metallic samples mentioned above,
bimetallic Cu-Zn /SiO2 catalysts was prepared by Catillon-Mucherie et al [102] using co-
impregnation in 2007. However, instead of Cu-Zn alloy formation, Cu0 and Zn
II species with
good dispersion were observed in the Cu-Zn/SiO2 sample after calcination at 450 oC and
reduction at 350 oC. Then the catalytic behavior of the Cu
0-Zn
Ⅱ/SiO2 samples was studied in
selective hydrogenation of crotonaldehyde in collaboration with R. Touroude in Strasbourg
[103]. The results showed that Cu0-Zn
Ⅱ/SiO2 has 10~20% higher selectivity to crotyl alcohol
than Cu/SiO2 sample. Cu3Zn alloy formation was found by XRD in mono Cu/ZnO after
thermal treatment under H2 in 2012 by Derrouiche et al [104]. The authors observed that
metallic Cu was formed after sample reduction at 280 oC. However, zinc atom migrates into

14
the Cu crystal gradually with increasing reduction temperature and Cu3Zn alloy was formed
after reduction at 350 oC for 2 h (Figure 1-8).
Figure 1-8: XRD patterns (in the range 2θ=40-55°) of sample 10 wt% Cu/ZnO sample
calcined at 400oC followed by H2 reduction at different temperatures and for different times: 1
min at (a) 280oC, (b) 330
oC, (c) 340
oC, and (d) 350
oC, and TR=350
oC for (e)5 min, (f) 30 min,
and (g) 2 h.▲ and ●: the most intense peaks from the JCPDS files of Cu0(#04-0836) and
Cu3Zn (#65-6567), respectively [104].
These previous works focusing on supported non-noble metal catalyst preparation and
characterization in the LRS provides a suitable platform for the study of non noble bimetallic
catalysts study. Moreover, the discovery of Cu-Zn alloy formation in the mono Cu/ZnO
sample after calcination and reduction [104] makes the studies of supported non-noble
bimetallic catalyst preparation, characterization and catalytic properties particularly
promising.
6. The outline of this Thesis
This thesis mainly focuses on the preparation, characterization and evaluation of the
catalytic properties of supported non-noble bimetallic catalysts. The supported non-noble
bimetallic Cu-Zn, Ni-Zn and Fe-Zn are selected and studied. In this thesis, Chapter 2 mainly
introduces the methods for samples preparation and characterization. The preparation of
monometallic catalysts (i.e., Cu, Zn, Ni) for selective hydrogenation of butadiene is described
in Chapter 3. After that, one can find the studies of bimetallic Cu-Zn, Ni-Zn and Fe-Zn for
selective hydrogenation of butadiene in Chapter 4, 5 and 6. At the end of this thesis, a
conclusion is made in Chapter 7.

15
7. Reference
1. N.N. Lebedev, Chemistry and technology of basic organic and petrochemical
synthesis. Vol. 1. 1984: Imported Pubn.
2. P.W.N.M.v.L.J.A.M. R.A. van Santen and B.A. Averill, Editors. Chapter 2 Catalytic
processes in industry, in Studies in Surface Science and Catalysis, 1999, Elsevier. p.
29-80.
3. M. Eramo, Global Ethylene Market Outlook: Low Cost Feedstocks Fuel The Next
Wave Of Investments In North America and China.
4. C. Marcilly, Oil & gas science and technology, 56 (2001) 499.
5. M.L. Derrien, Chapter 18 Selective Hydrogenation Applied to the Refining of
Petrochemical Raw Materials Produced by Steam Cracking, in Studies in Surface
Science and Catalysis, L. Cerveny, Editor 1986, Elsevier. p. 613-666.
6. F.H. Puls and K.D. Ruhnke, Butene-1 containing feed purification process (CS-165),
1981, Google Patents.
7. M.D. Argyle; C.H. Bartholomew, Catalysts 5(2015) 145.
8. B.J. Burger; M.E. Thompson; W.D. Cotter; J.E. Bercaw, Journal of the American
Chemical Society, 112 (1990) 1566.
9. S.A. Nikolaev; I.N. Krotova, Petroleum Chemistry, 53 (2013) 394.
10. N.S. Schbib; M.A. Garcia; C.E. Gigola; A.F. Errazu, Industrial & Engineering
Chemistry Research, 35 (1996) 1496.
11. B.M. Collins, Selective hydrogenation of highly unsaturated hydrocarbons in the
presence of less unsaturated hydrocarbons, 1978, Google Patents.
12. E.L. Mohundro, Overview on C2 and C3 selective hydrogenation in ethylene plants. in
American Institute of Chemical Engineers 15th Ethylene Producers Conference, New
Orleans. 2003.
13. S.H. Lee, Chelical & Biomolecular Engineering, 2004,
14. C.N. Thanh; B.Didillon; P. Sarrazin; C. Cameron, Selective hydrogenation catalyst
and a process using that catalyst, 2000, Google Patents.
15. L. Kniel, O. Winter, K. Stork, Ethylene, keystone to the petrochemical industry1980,
New York: Marcel Dekker, Inc.
16. J.-R Li, R.J. Kuppler, H.-C. Zhou, Chemical Society Reviews, 38 (2009) 1477.

16
17. M. García-Mota, J. Gomez-Diaz, G. Novell-Leruth, C. Vargas-Fuentes, L. Bellarosa,
B. Bridier, J. Perez-Ramirez, N. Lopez, Theoretical Chemistry Accounts, 128 (2011)
663-673.
18. M.M. Johnson, D.W. Walker, G.P. Nowack, Selective hydrogenation catalyst, 1983,
Google Patents.
19. G.L. Debras, Process for the selective hydrogenation of alkynes, 1989, Google
Patents.
20. G.R. Gildert, H.M. Putman, D. Hearn, Process for concurrent selective hydrogenation
of acetylenes and 1, 2 butadine in hydrocarbon streams, 1999, Google Patents.
21. M. García-Mota, B. Bridier, J. Perez-Ramirez, N. Lopez, Journal of Catalysis, 273
(2010. 273) 92.
22. M.W. van Laren, C.J. Elsevier, Angewandte Chemie International Edition, 38 (1999)
3715.
23. T. Nijhuis, G. Van Koten, J. Moulijn, Applied Catalysis A: General, 238(2003) 259.
24. D.Teschner, E.Vass, M.Havecker, S.Zafeiratos, P. Schnorch, H.Sauer, A. Knop-
Gericke, R. Schlogl, M. Chamam, A.Wootsch, Journal of Catalysis, 242 (2006) 26.
25. J. Boitiaux, J. Cosyns, S. Vasudevan, Applied catalysis,15 (1985) 317.
26. J.Luo, R.Theron, J.S.Laura, N.H.Thomas, S.W.Weller, G.O.Allen, J.S.Mclndoe
Organometallics, 34(2015) 3021.
27. Q. Zhang, J. Li, X. Liu, Q. zhu, Applied Catalysis A: General, 197 (2000) 221.
28. A.Borodziński, G.C. Bond, Catalysis Reviews, 48 (2006) 91.
29. A.Borodziński, G.C. Bond, Catalysis Reviews, 50 (2008) 379.
30. D.Teschner, J.Borsodi, A. Wootsch, Z.Revay, M.Havecker, A.Knop-Gericke, S.D.
Jackson, R.Schlogl, Science, 320 (2008) 86.
31. D.Teschner, Z.Revay, J.Bborsodi, M.Havecher, A. Knop-Gericke, R. Schlogl, D.
Milroy, D. Jackson, D.Torres, P.Sautet, Angewandte Chemie International Edition, 47
(2008) 9274.
32. W.Ludwig, A.Savara, R.J.Madix, S.Schauermann, H.J.Freund, The Journal of
Physical Chemistry C, 116 (2012) 3539.
33. W.Ludwig, A.Savara, J.M. Jobert, S.Schauermann, H-J.Freund, Journal of Catalysis,
284 (2011) 148.
34. M. Wilde, K. Fukutani, W. Ludwig, B. Brandt, J.H. Fischer, Schauermann, H-
J.Freund Angewandte Chemie International Edition, 47 (2008) 9289.

17
35. B. Ngamsom, N. Bogdanchikova, M.A.Borja, P.Praserthdam, Catalysis
Communications, 5 (2004) 243.
36. A. Pachulski, R. Schödel, P. Claus, Applied Catalysis A: General, 400 (2011) 14.
37. Y.Jin, A.K.Datye, E.Rightor, R.Gulotty, W. Waterman, M.Smith, M. Holbrook, J.
Maj, J.Blackson, Journal of catalysis, 197 (2000) 221.
38. A.Sarkany, A. Horvath, A. Beck, Applied Catalysis A: General, 229 (2002) 117.
39. R. Hou,. Journal of Catalysis, 316 (2014) 1.
40. S. Leviness, V.Nair, A.H Weiss, Journal of Molecular Catalysis, 25 (1984) 131.
41. N.A.Khan, S. Shaikhutdinov, H.-J. Freund, Catalysis Letters, 108 (2006) 159.
42. J. Phillipson, P. Wells, G. Wilson, Journal of the Chemical Society A: Inorganic,
Physical, Theoretical, 1969, 1351.
43. R.A. Koeppel, J.T.Wehril, M.S.Wainwrigh, D.L.Trimma, N.W.Cant, Applied
Catalysis A: General, 120 (1994) 163.
44. M.R.,Stammbach,D.J. Thomas, D.L.Trimm, M.S.Wainwright, Applied catalysis, 58
(1990) 209.
45. N.J.Ossipoff, N. Cant, Journal of Catalysis, 148 (1994) 125.
46. J. Grant,R.B.Moyes, R.G.Oliver, P.B.Wells, Journal of Catalysis, 42 (1976) 213.
47. P.Wells, G. Wilson, Journal of the Chemical Society A: Inorganic, Physical,
Theoretical, 1970, 2442.
48. C.Park, R.T.K. Baker, The Journal of Physical Chemistry B, 102 (1998) 5168.
49. F.Studt,F. Abild-Pedersen, T. Bligaard, R.Z. Sorensen, C.H.Christensen, J.K.Norskov,
Science, 320 (2008) 1320.
50. Z.-P. Liu, P. Hu, Journal of the American Chemical Society, 125 (2003) 1958.
51. F.Abild-Pedersen, J.Greeley, F.Studt, J.Rossmeisl, T.R.Munter,P.G.Moses,
E.Skulason, T.Bligaard, J.K.Norskov, Physical review letters, 99(2007) 016105.
52. C.S.Spanjers,J.T.Held, M.J.Jones, D.D.Stanley, R.S.Sim, M.J.Janik, R.M.Rioux,
Journal of Catalysis, 316 (2014) 164.
53. C.S.Spanjers, R.S.Sim, N.P.Sturgis, B.Kabius, R.M.Rioux, ACS Catalysis, 5 (2015)
3304.
54. Y.Liu, X. Liu, Q.Feng, D.He, L.Zhang, L.Chao, R.Shen, Y.Ji, D.Wang, G.Zhou,Y.Li,
Advanced Materials, 28 (2016) 4747.
55. M.Kang, M.W.Song, T.W.Kim, K.L.Kim, The Canadian Journal of Chemical
Engineering, 80 (2002) 63.
18
56. L.Delannoy, G.Thrimurthulu, P.S.Reddy, C.Methivier, J.Nelayah, B.m.Reddy,
C.Ricolleau, C.Louis, Physical Chemistry Chemical Physics, 16 (2014) 26514.
57. A.J.McCue,C.J.McRitchie, A.M.Shepherd, J.A.Anderson, Journal of Catalysis, 319
(2014) 127.
58. M.B.Boucher, B.Zugic, G.Cladras, J.Kammert, M.D.Marcinknowsk, T.J.Lawton,
E.C.H.Sykes, M. Flytzani-Stephanopoulos, Physical Chemistry Chemical Physics, 15
(2013) 12187.
59. A.J.McCue, A.M. Shepherd, J.A. Anderson, Catalysis Science & Technology, 5
(2015) 2880.
60. F.R. Lucci, J. Liu, M.D. Marcinkowski, M. Yang, L.F. Allard, M. Flytzani-
Stephanopoulos, E. C. H. Sykes, Nature communications, 6(2015) 8550.
61. M.Behrens, F.Studt, I.Kasatkin, S.Kühl, M. Hävecker, F.Abild-Pedersen, S. Zander,
F.Girgsdies, P.Kurr, B.L.Kniep, M.Tovar, R.W. Fischer, J.K.Nørskov, R.Schlögl,
Science, 336 (2012) 893.
62. Y.Choia, K.Futagamia, T.Fujitanib, J. Nakamuraa, Applied Catalysis A: General, 208
(2001) 163.
63. J. Nakamura, T.Uchijima, Y.Kanai, T.Fujitani, Catalysis Today, 28 (1996) 223.
64. H.M.Torres Galvis, J.H.Bitter, C.B. Khare, M.Ruitenbeek, A. Iulian Dugulan, K.P. de
Jong, Science, 335 (2012) 835.
65. Y.Li , W. Kim, Y.Zhang, M.Rolandi, D.Wang, H.Dai, The Journal of Physical
Chemistry B, 105 (2001) 11424.
66. C.P.Casey, H.Guan, Journal of the American Chemical Society, 129 (2007) 5816.
67. A.Meffre, B.Mehdaoui, V.Kelsen, P.F.Fazzini, J.Carrey, S.Lachaize, M.Respaud,
B.Chaudret, Nano Letters, 12 (2012) 4722.
68. B.Mehdaoui, A.Meffre, J.Carrey, S.Lachaize, L.M.Lacroix, M.Gougeon, B.Chaudret,
M.Respaud, Advanced Functional Materials, 21 (2011) 4573.
69. C.G.Hadjipanayis, M.J. Bonder, S.Balakrishnan, XWang, H.Mao, G.C.Hadjipanayis,
Small, 4 (2008) 1925.
70. V.Kelsena, B.Wendtb, S.Werkmeisterb, K.Jungeb, M.Bellerb, B.Chaudret, Chemical
Communications, 49 (2013) 3416.
71. P.H.Phua, L.Lefort, J.A.F.Boogers, M.Tristany, J.G.de Vries, Chemical
Communications, 25 (2009) 3747.
19
72. M. Armbrüster, K. Kovnir, M. Friedrich, D. Teschner, G. Wowsnick, M. Hahne, P.
Gille, L.Szentmiklósi, M.Feuerbacher, M.Heggen, F.Girgsdies,D.Rosenthal,R.Schlögl,
Y. Grin, Nature Materials, 11 (2012) 690.
73. L.Piccolo, Chemical Communications,49 (2013) 9149.
74. D. Cooper, Valence bond theory. Vol. 10. 2002: Elsevier.
75. F.E. Harris, Molecular orbital theory. Advances in quantum chemistry, 3 (1967) 61.
76. G.Gómez, P.G. Belelli, G.F. Cabeza, N.J. Castellani, Applied surface science, 353
(2015) 820.
77. M.Haruta, T.Kobayashi, H.Sano, N.Yamada, Chemistry Letters, 16 (1987) 405.
78. M.Haruta, N.Yamada, T.Kobayashi, S.Iijima, Journal of Catalysis, 115 (1989) 301.
79. R.Zanella, S.Giorgio, C.R. Henry, C.Louis, The Journal of Physical Chemistry B, 106
(2002) 7634.
80. A.Hugon, L. Delannoy, C. Louis, Gold Bulletin, 41 (2008) 127.
81. L.Delannoy, N.E.Hassan, A.Musi, N.N.L.To, J.M.Krafft, C.Louis, The Journal of
Physical Chemistry B, 110 (2006) 22471.
82. M.Bessona, A.Kallela, P.Gallezota, R.Zanellab, C.Louis, Catalysis Communications,
4 (2003) 471.
83. R.Zanellaa, S.Giorgiob, C.H.Shinc, C.R.Henryb, C.Louis, Journal of Catalysis, 222
(2004) 357.
84. P. Lakshmanan, L. Delannoy, V. Richard, C. Méthivier, C. Potvin, C. Louis, Applied
Catalysis B: Environmental, 96 (2010) 117.
85. L.Delannoy, K.Fajerwerg, P.Lakshmanan, C.Potvin, C.Méthivier, C.Louis, Applied
Catalysis B: Environmental, 94 (2010) 117.
86. R.Zanella, C.Louis, S.Giorgio, R. Touroude, Journal of Catalysis, 223 (2004) 328.
87. T.Chaieb, L.Delannoy, S.Casale, C.Louis, C.Thomas, Chemical Communications, 51
(2015) 796.
88. A.Hugon, L.Delannoy, J.M. Krafft, C.Louis, The Journal of Physical Chemistry C,
114 (2010) 10823.
89. N.E.Kolli, L.Delannoy, C.Louis, Journal of Catalysis, 297 (2013) 79.
90. S.Derrouiche, C.L.Fontaine, G.Thrimurtulu, S.Casale, L.Delannoy, H.Lauron-Pernot,
C.Louis, Catalysis Science & Technology, 6 (2016) 6794.
91. C.Louis, Z.X. Cheng, M. Che, The Journal of Physical Chemistry, 97 (1993) 5703.
92. M.Che, Z.X. Cheng, C. Louis, Journal of the American Chemical Society, 117 (1995)
2008.
20
93. P.Burattin, M. Che, C.Louis, The Journal of Physical Chemistry B, 101 (1997) 7060.
94. P.Burattin, M.Che, C.Louis, The Journal of Physical Chemistry B, 103 (1999) 6171.
95. P.Burattin, M.Che, C.Louis, The Journal of Physical Chemistry B, 104 (2000) 10482.
96. R.Nares, J.Ramírez, A.Gutiérrez-Alejandre, C.Louis, T.Klimovan, The Journal of
Physical Chemistry B, 106 (2002) 13287.
97. P.Burattin, M.Che, C.Louis, The Journal of Physical Chemistry B, 102 (1998) 2722.
98. T.Toupance, M. Kermarec, C.Louis, The Journal of Physical Chemistry B, 104 (2000)
965.
99. L.Trouillet, T.Toupance, F.Villain, C.Louis, Physical Chemistry Chemical Physics, 2
(2000) 2005.
100. T.Toupance, M.Kermarec, J.F.Lambert, C.Louis, The Journal of Physical Chemistry
B, 106 (2002) 2277.
101. C.Chouillet, F.Villain, M.Kermarec, H.Lauron-Pernot, C.Louis,The Journal of
Physical Chemistry B, 107 (2003).
102. S.Catillon-Mucherie, F.Ammari, J.M.Krafft, H.Lauron-Pernot, R.Touroude, C.Louis,
The Journal of Physical Chemistry C, 111 (2007) 11619.
103. S.Catillon-Mucherie, H. Lauron-Pernot, C. Louis, Journal of Physical Chemistry C,
114 (2010) 11140.
104. S.Derrouiche, H. Lauron-Pernot, C. Louis, Chemistry of Materials, 24 (2012) 2282.

Chapter 2: Techniques for catalysts preparation and
characterization
Chapter 2: Techniques for catalysts preparation and characterization ........................... 23
1. Raw chemical materials for the study .............................................................................. 23
2. Methods of sample preparation ........................................................................................ 24
2.1 Deposition-precipitation with urea (DPu) .................................................................. 26
2.1.1 Low solubility metal precursor conversion .......................................................... 26
2.1.2 Surface charge of the support ............................................................................... 30
2.1.3 The steps of deposition-precipitation with urea ................................................... 31
2.2 Deposition-precipitation at fixed pH .......................................................................... 32
2.2.1 The steps of deposition-precipitation at fixed pH ................................................ 33
2.2.2 Theoretical calculation for the selection of preparation condition ....................... 33
3. Techniques for samples characterization ......................................................................... 35
4. The selective butadiene hydrogenation in the excess of propene .................................... 39
4.1 The catalytic test system and condition for the experiment ....................................... 39
4.2 The evaluation of the catalytic performance .............................................................. 41
5. Reference .......................................................................................................................... 43

23
Chapter 2: Techniques for catalysts preparation and
characterization
The methods for catalysts preparation and the characterization techniques used during
the thesis are summarized in this chapter, which is divided into four parts: the raw chemical
materials used are first presented, followed by the methods selected for samples preparation,
i.e., deposition-precipitation with urea (at increasing pH) and deposition-precipitation at fixed
pH, then the techniques chosen for samples characterization, and finally the equipment and
procedures used for the reaction of selective hydrogenation of butadiene. The mechanism and
principle of the preparation methods are also introduced and discussed in the “methods for
samples preparation” part. In this part, some calculations have also been done on the
evolution of the solubility of metal hydroxide with pH in the deposition-precipitation with
urea, and on the critical metal precursor concentration that guarantees that there will be no
precipitation in solution during the deposition-precipitation at fixed pH.
1. Raw chemical materials for the study
To study the morphology, structure and catalytic property of the bimetallic
nanoparticles, the support must be carefully selected. The requirements for the support are: 1,
the support must be stable during the sample preparation and the following thermal
treatments; 2, it must have no catalytic activity for selective hydrogenation of unsaturated
hydrocarbon. Compared with SiO2 and Al2O3 supports, which easily form silicates species
(e.g., nickel phyllosilicate in Ni/SiO2 samples [1]) or aluminates (e.g., copper aluminates in
Cu/Al2O3 samples [2]) during sample preparation, TiO2 support is stable in solution, and there
are no reports about titanates formation during sample preparation at low temperature [3].
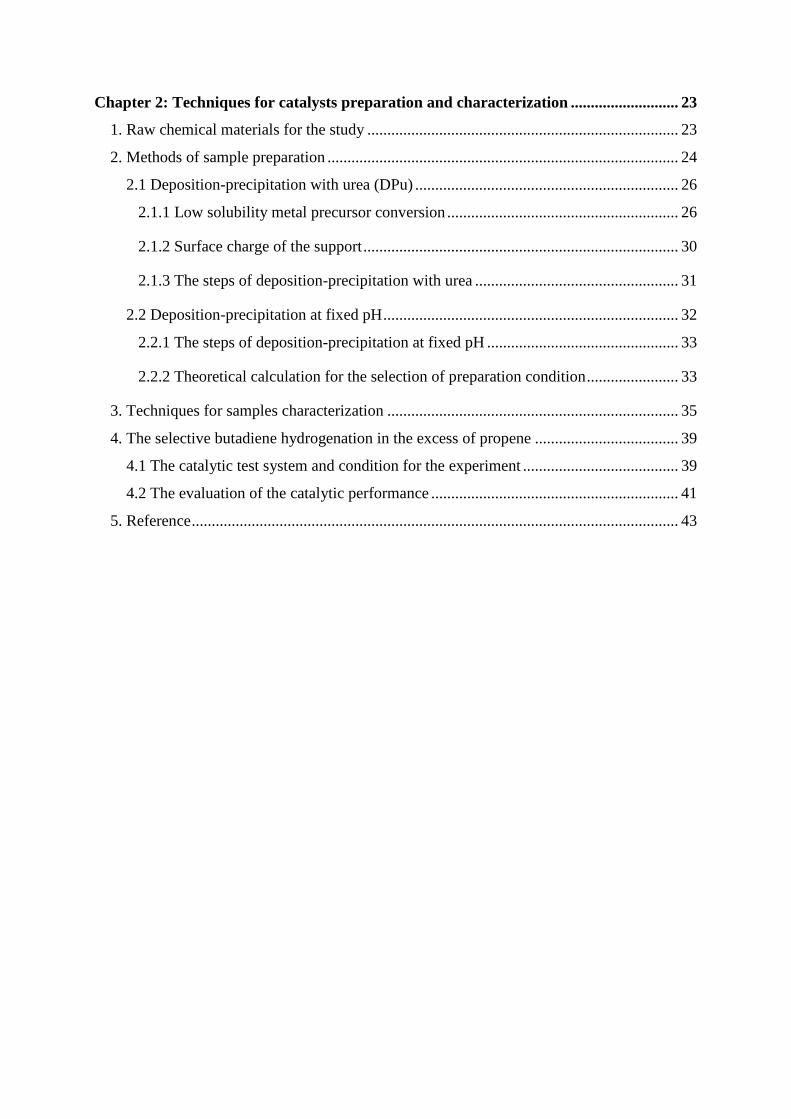
Herein, TiO2 (50 m2 g
-1, P25 from Evonik) was selected as support, it is known to contain
anatase and rutile phases in a ratio of about 3:1 (see Figure 2-1). ZnO (8 m2 g
-1, KADOX 911)
was also used to explore the formation bimetallic alloy in the study of Ni-Zn and Fe-Zn
samples.
Solid CO(NH2)2 (Sigma-Aldrich, purity: >98% ) and aqueous 0.5 M NaOH solution
were used as the precipitation agent for sample preparation.
24
Cu(NO3)2•3H2O (Sigma-Aldrich, purity: >99%), Zn(NO3)2•6H2O (Sigma-Aldrich,
purity: >99%), Ni(NO3)2•6H2O (Sigma-Aldrich, purity: >98.5%) were used as precursors for
copper, zinc and nickel containing samples. Fe(NO3)3•9H2O (Sigma-Aldrich, purity: >99%)
and FeCl2•4H2O (Sigma-Aldrich, purity: >99%) were used for the iron-zinc study.
20 25 30 35 40 45 50 55 60 65 70 75 80
Rutile - TiO2, JCPDS: #86 - 0147
Anatase. syn - TiO2, JCPDS: #84 - 1286
TiO2
2 thate2 theta
Figure 2-1: XRD of TiO2 P25 support
2. Methods of sample preparation
In this study, two methods were selected for sample preparation: deposition-
precipitation with urea (DPu) and deposition-precipitation at fixed pH. Note that these two
methods were performed in isothermal condition, i.e., at 80 oC for DPu and room temperature
for DP at fixed pH, and were based on the gradual change of reactants concentration, i.e., OH-
concentration for DPu, while metal ions concentration for DP at fixed pH.
Deposition-precipitation by a gradual and continuous increase of the pH of the
suspension as a method for supported metal catalysts preparation was first proposed by Geus
et al [4-6] in 1977 for the preparation of Ni/SiO2 catalyst and consisted in the precipitation of
nickel onto the silica surface (and not in solution) by basification of a nickel salt solution. In

25
this method, the basification of the preparation solution is achieved thanks to the controlled
addition of a base (e.g., sodium hydroxide, ammonia and urea). According to Geus et al [4-6],
one must consider the phase diagram of the precipitated solid in equilibrium with a solution
containing its metal precursors as a function of temperature and concentration of a reactant
(Figure 2-2). The solubility curve (S) corresponds to the equilibrium curve separating the
monophasic domain (the solution containing the metal precursor) from the biphasic one (the
precipitating solid and the solution), which is in fact reached when above the supersolubility
(SS) curves. The intermediate domain between the S and SS curves corresponds to the
nucleation. When in addition, the solution contains a finely dispersed support in suspension
(usually an oxide one), both the solubility (Ssupport) and supersolubility curves (SSsupport) are
shifted to lower concentrations provided that interaction between ionic metal species and the
surface of the support can occur, and favors nucleation at the surface of the support, and
therefore decreases the nucleation barrier. Thus, to favor the metal precipitation on the
support and avoid the precipitation of the metal in solution, the concentration of the metal
complexes or the pH must be controlled between the concentration of the two supersolubility
curves (SSsupport and SS). Note that, according to Geus et al [7], the gap in the concentration
between the two supersolubility curves, SS and SSsupport, is related to the bond strength
between the ion species and the support surface.
Figure 2-2: Phase diagram of precipitation and dissolution equilibrium of metal species in
solution as a function of temperature and concentration of a reactant: in a pure solution (solid
lines) and in the presence of a support in solution (bold lines) [7]

26
2.1 Deposition-precipitation with urea (DPu)
Deposition-precipitation with urea (DPu) is a deposition-precipitation method using
urea as the precipitating agent. Compared to NaOH and ammonia, which can locally strongly
increase the pH in the solution from their rapid hydrolysis and induce uncontrolled metal
precipitation in the solution, the advantage of using urea is that it is a delay-base, i.e., its
dissolution and decomposition to basify the solution can occur into two separated steps, which
are controlled by the solution temperature. In other words, urea can dissolve into solution at
room temperature and then decompose to CO2, NH4+ and OH
- (eq.1) when the temperature of
the suspension is raised above 60 oC [8].
eq. 1
It allows homogeneous basification all over the solution, and favors the precipitation onto the
support. It is possible to obtain high metal loadings (i.e., >20 wt% for Ni/SiO2 [1]) depending
on the precursor concentration and the time of deposition-precipitation. Moreover, after
catalyst reduction, small metal particles can be obtained with rather narrow particle size
distribution [9, 10].
Normally, the method of deposition-precipitation consists of 1, the transformation of a
highly soluble metal precursor into another compound of lower solubility; 2, the deposition-
precipitation of the lowly soluble compound onto a support after creation of an interaction
between them by adjusting the initial pH. These two steps are usually achieved by raising the
pH of the preparation solution.
2.1.1 Low solubility metal precursor conversion
Considering the fact that deposition-precipitation is an isothermal preparation method
(i.e., 80 oC for DPu; red line in Figure 2-2), the concentration of soluble ions in the
preparation solution gradually decreases as a result of deposition-precipitation onto the
support surface during the pH increasing process of DPu. Moreover, since the relationship
between the soluble ions concentration and the pH of the preparation solution is not reflected
from Figure 2-2, a phase diagram showing the evolution of a solubility curve of a metal ion as
a function of pH was introduced as follows and shown in Figure 2-3.
27
Before introducing the whole system, the definition of ionic product (J) should be first
introduced. Based on the “Solubility Product Rule” [11], the precipitation and dissolution
equilibrium of AnBm compound could be written as:
)()()( aqmBaqnAsBA n
mnm eq. 2
The ionic product (J) is:
mnnm BcAcJ )()(
Note that when the solution is saturated and solid formation (precipitation) occurs, the ionic
product (J) is equal to the solubility products,
spK .
In the case of supported metal catalyst preparation, the precipitation and dissolution
equilibrium of the metal species can be written as follows:
)()(n
)(M)(M aqaqsn nOHOH eq. 3
Once the equilibrium between dissolution and precipitation shows up during pH
increasing, the concentrations of each part have a correlation like:
nOHCOH
nMnsp C)(MK
Here, nsp )(MK OHis the solubility product constant of M(OH)n. The solubility of M(OH)n
(SM) can be calculated as follows:
nOH
nsp
C
OHMK
)(
CS n
MM mol/ L Formula 2-1
Moreover,
-OHH2W CCOHK
H
HC -p10
Thus Formula 2-1 can be written as:

28
)(10
K
)(CS npH-
2W
MMn
n
nsp
OH
OHMK
mol/ L Formula 2-2
Considering that nsp OHMK )(and OHK 2W
are constant at a given temperature and for a
given metal compound, the relationship between solubility of M(OH)n and pH was deduced
from Formula 2-2 and shaped in Figure 2-3 (black solid line). Similarly to Figure 2-2, the
supersolubility curve of M(OH)n species is also represented in Figure 2-3, at higher pH than
that of solubility curve with the assumption that it has the same shape as that of solubility.
Finally, the effect of the presence of a support in solution on the precipitation and dissolution
equilibrium of metal compounds is also represented in Figure 2-3, shifted to lower pH as
discussed for Figure 2-1.
Hig
h
4
3
2
liquid
+
precipitation
S SSSSsupport
Ion
co
ncen
trati
on
Ssupport
liquid
pH increasing
Temperature is a constant
1
Lo
w
Figure 2-3: Phase diagram of the precipitation and dissolution equilibrium of metal species in
solution as a function of pH and ion concentration: a pure solution (solid lines) and in the
presence of a support (dotted lines)
From Figure 2-3, it can be seen that the initial concentration of soluble ions set to
prepare a catalyst with a given metal loading decreases as the pH of solution increases (black
solid line). The gradual increase in the concentration of precipitating agent (OH-) promotes
the deposition-precipitation procedure by hydrolysis of the metal complexes on the surface of
the support, which brings a fluctuation in OH- concentrations. In other words, the deposition

29
behavior of metal complexes can be roughly reflected by the pH evolution during DPu
preparation, e.g., the pH of the preparation solution increases fast when it is lower than the
solubility line (12 in Figure 2-3), then the rate of pH increasing gradually decreases when it
reaches the nucleation-precipitation area (234 in Figure 2-3). Detailed information about
pH evolution during sample preparation will be reported in the part devoted to the preparation
of monometallic Cu/TiO2 catalysts in Chapter 3. Besides that, a high pH has to be achieved
for the deposition process when the concentration of an ion becomes very low.
Apart from the DPu preparation of mono-metallic catalyst system that was discussed
above, the deposition-precipitation of two metal ions on a single oxide support must be also
discussed as it is one of the purposes of this thesis. According to Figure 2-2, if one wants that
the two different metal ions are co-deposited on the support surface in a single step, the
solubility products of the two metal compounds must be closed to each other. The solubility
products of Cu(II), Zn(II), Ni(II), Fe(II) and Fe(III) hydroxide compounds at room
temperature are summarized in Table 2-1. Moreover, the precipitation and dissolution
equilibrium of these metal compounds were calculated from Formula 2-2 and shown in Figure
2-4. The presence of the oxide support is not taken into consideration.
Table 2-1: the solubility products of non-noble metal hydroxide under 298 K [12]
M(OH)n nOHM )(K sp
Zn(OH)2 4.1×10⁻¹⁷
Cu(OH)2 2.0×10⁻¹⁹
Ni(OH)2 5.5×10⁻¹⁶
Fe(OH)2 4.9×10⁻¹⁷
Fe(OH)3 6.0×10-38
Although Figure 2-4 only considers the precipitation and dissolution equilibrium
behavior of metal ions as a function of pH in water (i.e., in the absence of oxide support) at
room temperature, the large differences in solubilities between Cu2+
and Zn2+
or between Ni2+
and Zn2+
ions certainly also indicate that the two cations cannot be simultaneously deposited
onto a support during increasing pH. This may be different for Fe2+
and Zn2+
since they have
similar solubility.

30
1 2 3 4 5 6 7 8 9
0.0
2.0x10⁻³
4.0x10⁻³
6.0x10⁻³
8.0x10⁻³
Fe(OH)3=Fe
3++3OH
-
Ni(OH)2= Ni
2++2OH
-
Cu(OH)2=Cu
2++2OH
-
So
lub
ilit
y /
(m
ol
L-1)
pH of the water solution
Fe(OH)2= Fe
2++2OH
-
Zn(OH)2= Zn
2++2OH
-
Figure 2-4: Solubility of metal hydroxides in pure water solution at T=298 K
2.1.2 Surface charge of the support
Although the transformation of highly soluble metal precursor into another compound
with low solubility, e.g., a hydroxide, is a necessary step for DPu process, the interaction
between metal complexes and support surface is considered as the initial step for the
deposition-precipitation preparation. Currently, this kind of interaction can be generated
through electrostatic interaction, resulting from opposite surface charges between the metal
complexes and the support, which has been testified by some quartz crystal microbalance
(QCM) experiments [13, 14]. The surface charge of an oxide can be defined by its point of
zero charge (PZC) [15, 16]. When the pH of the preparation solution is lower than the PZC of
support, the support surface is positively charged and suitable for anion adsorption; when the
pH of the solution is higher than the PZC of support, it is negatively charged and suitable for
cation adsorption, and a neutral surface can be found on oxide surface at the pH equal to the
PZC of support. (Figure 2-5). Practically, the adsorption of [Pt(NH3)4]2+
on silica occurred at
high pH when silica surface is negatively charged while the adsorption of [PtCl6]2-
appeared
on alumina at low pH, which generates a positively charged alumina surface [13].

31
For cationsFor anions
Figure 2-5: Surface charge at pH above, below the PZC of oxide
The PZC of some oxides, measured by potentiometric titration [17-20] and/or mass
titration [21-23], are summarized in Table 2-2.
Table 2-2: the point of zero charge of common oxides
Oxide PZC
SiO2 ~2
CeO2 ~7.5
ZnO 8.7-10.3
NiO 10-11
Al2O3 ~8
TiO2 ~6
However, a specific adsorption behavior has been found for TiO2, it is able to adsorb
cations even at pH lower than its PZC, and detailed information about the reason for such an
adsorption behavior will be discussed in the “mono metallic Cu/TiO2 preparation” part in
chapter 3.
In summary, in the process of deposition-precipitation with urea (DPu), the interaction
between the metal precursor and the surface of the support generates nuclei that allow specific
precipitation of the hydroxide onto the support surface, and promotes the formation of highly
dispersed particles after thermal treatment.
2.1.3 The steps of deposition-precipitation with urea
In practice, 3 g of support is weighted and dispersed into an 300 mL aqueous solution
(msupport(g) : Vwater(ml) = 1:100) containing a given amount of dissolved metal precursor(s).
Initially, the pH of the precursor solution needs to be set at a value below the solubility curve
of metal compounds and below the PZC of the support to favor first electrostatic interaction

32
between the metal ion complex and the support surface. Then the precipitating agent (urea) is
added into the mixture, with a concentration ratio [urea]/ [metal] ≥ 100 at room temperature.
The mixture is heated at 80 oC and stirred for 20 h. After that, the solid is separated from the
liquid phase by centrifugation and subsequently repeatedly washed with distilled water and
centrifuged (three times). Then, the sample is dried under vacuum at room temperature for 24
h then activated through thermal treatment (Figure 2-6).
Metal precursor
Support
Urea
H2O/80oCWater washings
Thermal treatment:
Calcination and Reduction
Drying under vacuum (RT)
Stirring for 20h
(As-prepared sample)
Figure 2-6: Steps of preparation of supported metal catalyst by DPu
2.2 Deposition-precipitation at fixed pH
As presented above, when there is a gap between the two solubility curves (Figure 2-
4), the two metal compounds cannot be simultaneously deposited on the surface of the
support during a preparation performed by gradual increase of pH (i.e., DPu). In order to
achieve a co-deposition of two metal compounds on the support, another method, called
deposition-precipitation at fixed pH, is proposed here.
In this method, the pH, and thus the concentration of the precipitating agent, of the
preparation solution is kept constant by gradual addition of precipitating agent during the
whole deposition-precipitation process, while, the metal precursors are also slowly injected
into the solution. Note that the precipitating agent and the metal precursor solution are
directly injected inside the solution (enlarged graph in Figure 2-7). Electrostatic interaction
between the metal complex and the surface of the support can be controlled by selecting the
pH. In addition, a suitable flow rate for aqueous metal precursor injection must be chosen to
keep the concentration of dissolved metal ion slightly lower than that of the supersolubility
curves (SS), to avoid the precipitation in solution, as it was shown in Figures 2-2 and 2-3. The
preparation process can be carried out at RT.

33
2.2.1 The steps of deposition-precipitation at fixed pH
The general procedure of sample preparation by deposition-precipitation at fixed pH is
summarized in Figure 2-7. In practice, 3 g of support is dispersed into 250 mL water in a
beaker at room temperature and the metal precursors are dissolved into 50 mL water, here,
msupport(g): Vwater(mL) =1:100. Then, the pH of the support suspension is adjusted to a chosen pH
by addition of an aqueous NaOH solution (0.5 M). After stirring for 30 min, the aqueous
solution of the metal precursor is injected into the support suspension with a controlled rate
that will be discussed below, and vigorous stirring. After that, the mixture is stirred for 1 h.
The pH of the support suspension is kept constant by regular addition of NaOH solution
during the whole preparation procedure. The solid sample is collected by centrifugation and
subsequently washed with distilled water and centrifuged again (three times) in the same way
as for the DPu samples.
OH-
Metalprecusor
Thermal treatment:
Calcination and Reduction
Metal precursorNaOH aq
pH
Support suspension
Stirring for 1h Water washings
Drying under vacuum (RT)
Figure 2-7: Steps of preparation of supported catalyst by deposition-precipitation at fixed pH
2.2.2 Theoretical calculation for the selection of preparation condition
To clearly present this method, one example is given to explain how to select the rate
for injecting metal precursors in the support suspension at a constant pH. The example is
based on the preparation of 3 g of a CuZn 1:1/TiO2 sample with 2.5 wt% Cu and 2.5 wt% Zn
performed at RT and pH~8 (i.e., at a pH where the TiO2 surface is negatively charged, and the
metal complexes are positively charged). 3 g of TiO2 are dispersed in 250 mL of water, and
the pH is adjusted to 8 by injecting a solution NaOH (0.5 M). The metal precursors
(Cu(NO3)2•3H2O and Zn(NO3)2•6H2O) are dissolved in 50 mL of water. The concentration of
Cu2+
and Zn2+
ions are 2.46×10⁻²
mol L-1
and 2.4×10⁻²
mol L-1
, respectively. Considering the

34
fact that the catalyst preparation is performed under air at room temperature in a basic
solution, the metal complexes that might form during metal hydrolysis are metal hydroxides
or metal carbonates, thus the solubility at room temperature of all these metal compounds are
summarized in Table 2-3.
Table 2-3: the solubility product of the metal compounds at room temperature [12]
Metal species Zn(OH)2 ZnCO3 Cu(OH)2 CuCO3
Ksp 4.1 × 10⁻¹⁷
1.2 × 10 -10
2 × 10 -19
1.3 × 10 -10
It can be seen that Zn(OH)2 and Cu(OH)2 have a much lower solubility than their
carbonate compounds, thus these two compounds will be precipitated first during the gradual
increase of Cu2+
and Zn2+
concentrations in the solution. Besides that, since Zn(OH)2 has a
higher solubility than Cu(OH)2, the rate of injection must be controlled in such a way that the
concentration of soluble Zn2+
ion in the preparation solution remains slightly below or at the
solubility value of Zn(OH)2 if one wants to co-deposit(precipitate) Cu2+
and Zn2+
through one
single injection of aqueous Cu2+
/Zn2+
mixtures containing similar ion concentration. As a
result, based on the solubility of Zn(OH)2, the limitation of the concentration of Zn2+
in the
solution that could both avoid the precipitation of Zn(OH)2 in solution and achieve the goal of
co-deposition-precipitation of Cu and Zn could be calculated as follows:
The hydrolysis of Zn2+
is:
OHZnOH 2)(Zn 2
2
The solubility parameter of Zn(OH)2 is:
22sp 2ZnC )(K
OHCOHZn
Formula 2-3
When the pH of the suspension is 8 at RT, the OHC can be calculated as follows:
6-
8-
-14
H
2W 101101
101
C
OHKC -OH
mol L-1
As a result, the limitation of the concentration of Zn2+
in the support suspension can be
calculated by Formula 2-3:

35
5
26
17
2
2sp101.4
10*1
10*1.4)(KC 2Zn
OHC
OHZn mol L
-1
Since the total volume of the suspension is 250 mL, the limitation of the molar amount
of Zn2+
that can avoid Zn(OH)2 precipitation appears in solution is
55
total 10025.125.0101.4VCn 2Zn2Zn
mol
The average concentration of Zn precursor in the 50 ml Cu
2+ and Zn
2+ aqueous
solution is 2.4×10⁻²
mol L-1
, thus the volume of the Cu2+
and Zn2+
aqueous solution injected
into the support suspension should be below the Vmix:
mLLmol
mol
Caverage
42.0/10*4.2
10*025.1n
V2
5
mix
2Zn
Previous Quartz Crystal Microbalance (QCM) study [13] about the transition metal
complex adsorption on oxide surface, such as [Pt(NH3)4]2+
adsorption on SiO2 at pH=10
showed that electrostatic adsorption occurs very fast. Based on these results, one can assume
that 5 s is needed for the interaction between the metal ions (2.42×10⁻²
mol L-1
) in the added
0.42 mL solution and TiO2 surface, thus the injection rate of the aqueous metal solution must
be slower than 0.084 mL s-1
. The gradual addition of the metal precursors at the injection rate
that has been calculated and the interaction between the metal complexes and the support
surface would allow the nucleation of metal hydroxides to mainly happen on the surface of
the support.
3. Techniques for samples characterization
The pH evolution of the mixture suspension was recorded using a pH probe (PHM201
Portable pH Meter). In the DPu preparation procedure, both the decomposition of urea and the
consumption of the OH- ions by the formation and deposition of the metal hydroxide induce
pH evolution. As a result, it was interesting to monitor the pH evolution during DPu
preparation. The pH of the suspension during deposition-precipitation at fixed pH also
requires to be controlled. Before the pH probe was applied to any measurement, it has to be

36
calibrated by the pH=4 and pH=7 buffer solutions and the electrode sensitivity of the pH
probe needed to be in the range 97-100%.
The metal loadings were measured by X-ray fluorescence (XRF) with a spectrometer
XEPOS HE (AMETEK). XRF is based on the emission of the characteristic fluorescence X-
ray from a material that has been excited by bombarding with high-energy X-rays or gamma
rays, the application of which was first proposed by Glocker and Schreiber et al [24]. The
method used for the XRF analyses was based on calibration curves obtained from standard
samples for each element.
X-ray Diffraction (XRD) was performed on a diffractometer (D8 Bruker Company)
operating with Cu Kα radiation (1.5418 Å; 40 kV and 30 mA) with a Ni filter. It is an
analytical technique primarily used for crystal structure identification of crystalline materials,
and also can provide an average bulk composition of the crystalline material through
matching the XRD peaks detected with the JCPDS cards. The X-rays generated by a cathodic
tube, interact with the sample to produce constructive interferences when conditions satisfy
the Bragg’s Law ( sin2dn , in which d is the d-spacing in crystal lattice). The crystallite
size of the mineral can be calculated by Scherrer’s equation [25] as follows:
cosd
k
In which d is the average particle size; k is a dimensionless shape factor with a value close to
0.89; λ is the X-ray wavelength (0.15406 nm); is the Bragg angle (unit: °); specifically, is
the full width at half maximum (FWHM) with a unit rad (1° = π/180 rad), and it can be
calculated by using the Gaussian formula to “nonlinear fitting” the XRD curve in the “Origin”
software. The Gaussian formula is
2ln4
Aey
2
2cx-x2-4ln
0
w
yw
In which, w = FWHM (Figure 2-8).

37
Figure 2-8: FWHM simulation from nonlinear fitting XRD peak by the Gaussian formula
Ultraviolet–visible spectroscopy (UV-Vis) in liquid (transmission mode) and solid
phase (diffuse reflectance mode) are recorded on a Cary 5000 spectrometer in the range
1200–350 nm at room temperature. Prior to measurement in solid phase, all the dried powders
are finely crushed and lightly pressed into the sample holder of the diffuse reflectance cell. In
this study, titanium oxide and pure water are used as references for the analysis of solid and
liquid phases, respectively.
The reduction behavior of the supported metal compound was studied by temperature
programmed reduction (TPR) in a Micromeritics Autochem Π. In this measurement, a purge
under Ar (25 mL min-1
) was performed for 30 min to remove the air contained in the reactor
at room temperature (RT) before increasing temperature at a linear rate of 7.5 oC min
-1 in a
5% H2/Ar gas mixture flow (25 mL min-1
). The reduction behavior of metal compounds can
be determined according to the temperature at which the H2 consumption peaks appear.
The acidic property of the support surface was measured by ammonia temperature
program desorption (NH3-TPD), which was performed in a Micromeritics Autochem II
Automated Catalyst Characterization System. After thermal treatment, ammonia was
adsorbed on the surface of the support by inletting 5 %NH3/Ar for few hours, and then the cell
was flushed with Ar gas to remove the physically adsorbed ammonia for 30 min. After that,
the temperature of the sample was increased and the amount of ammonia desorption was
recorded. The strength of acidic sites is related to the temperature at which ammonia
desorption occurs, ammonia desorbing from the stronger acidic sites at a higher temperature.
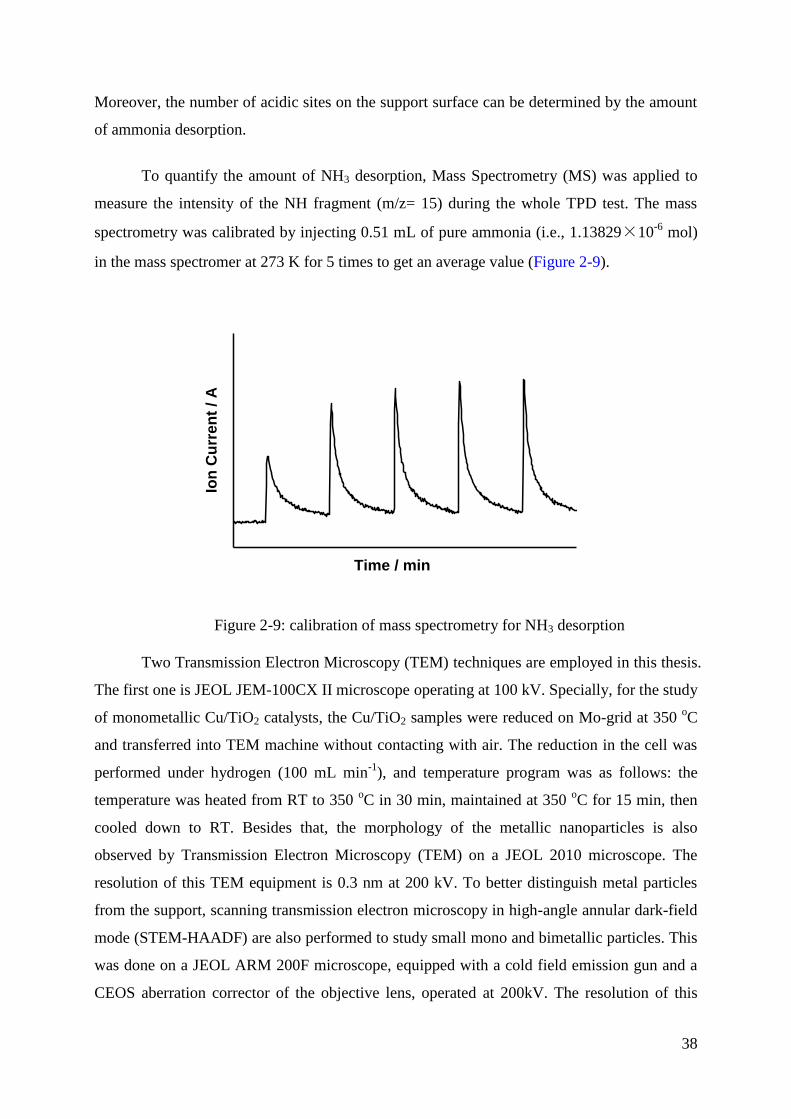
38
Moreover, the number of acidic sites on the support surface can be determined by the amount
of ammonia desorption.
To quantify the amount of NH3 desorption, Mass Spectrometry (MS) was applied to
measure the intensity of the NH fragment (m/z= 15) during the whole TPD test. The mass
spectrometry was calibrated by injecting 0.51 mL of pure ammonia (i.e., 1.13829×10⁻⁶
mol)
in the mass spectromer at 273 K for 5 times to get an average value (Figure 2-9).
Ion
Cu
rren
t / A
Time / min
Figure 2-9: calibration of mass spectrometry for NH3 desorption
Two Transmission Electron Microscopy (TEM) techniques are employed in this thesis.
The first one is JEOL JEM-100CX II microscope operating at 100 kV. Specially, for the study
of monometallic Cu/TiO2 catalysts, the Cu/TiO2 samples were reduced on Mo-grid at 350 oC
and transferred into TEM machine without contacting with air. The reduction in the cell was
performed under hydrogen (100 mL min-1
), and temperature program was as follows: the
temperature was heated from RT to 350 oC in 30 min, maintained at 350
oC for 15 min, then
cooled down to RT. Besides that, the morphology of the metallic nanoparticles is also
observed by Transmission Electron Microscopy (TEM) on a JEOL 2010 microscope. The
resolution of this TEM equipment is 0.3 nm at 200 kV. To better distinguish metal particles
from the support, scanning transmission electron microscopy in high-angle annular dark-field
mode (STEM-HAADF) are also performed to study small mono and bimetallic particles. This
was done on a JEOL ARM 200F microscope, equipped with a cold field emission gun and a
CEOS aberration corrector of the objective lens, operated at 200kV. The resolution of this

39
STEM machine is 0.046 nm at 200 kV. Energy-dispersive X-ray spectroscopy (EDS)
characterization with different modes (i.e., point, linear and area testing mode) was performed
to evaluate the composition of metal particles in bimetallic samples. The powder sample was
directly deposited onto the grid without the use of a solvent. Note that Mo-grid was used for
Cu-Zn/TiO2 sample and Cu-grid was used for the other samples observation. Statistical
analysis of the metal particle size distributions (PSD) in reduced samples is obtained by
counting more than 200 particles, using the free software Image J. The average particle
diameter was deduced from the equation or where ni
is the number of the particles of diameter di.
Thermogravimetric analysis (TG) was performed on the samples (15 mg) after
reaction using a Seiko 320 thermobalance, under air with a total flow rate of 100 ml min-1
,
from room temperature to 900 oC with a heating rate of 7.5
oC min
-1. The composition of
outlet gas was analyzed by Mass Spectrometry (MS) during the temperature ramp for some
catalysts, such as bimetallic Ni-Zn/TiO2. The temperature of the TG/MS interface was held at
160 °C, and the mass spectra were obtained from m/z 10 to 120 with the scan rate of 40
amu/s.
XPS spectra were collected on a SPECS (Pholibos 100-5MCD) X-ray photoelectron
spectrometer, using a monochromated Al Kα (hν = 1486.6 eV) X-ray source. The samples
were ex situ calcined then reduced at specific temperature and transferred in air to the XPS
chamber. After collection, the binding energies were calibrated with respect to the C-C/C-H
components of the C 1s peak (binding energy = 284.6 eV). All spectra processing was carried
out using the Casa XPS software package.
4. The selective butadiene hydrogenation in the excess of propene
4.1 The catalytic test system and condition for the experiment
The catalytic equipment is presented in Figure 2-10. In this system, calcination,
reduction and catalytic reaction can be performed. As a result, catalytic performance was
measured after in-situ thermal treatment. For the catalytic test, 100 mg of powder, with
particle size between 125 and 200 μm, is filled into a U shape tube reactor (4 mm of internal
diameter). Note that the weight of active compounds (i.e., Cu, Ni and Fe) was kept constant
for the catalytic tests (e.g., 2.5 mg Cu for bimetallic Cu-Zn/TiO2 study and 0.05 mg Ni for

40
bimetallic Ni-Zn/TiO2 study, 2.5 mg Fe for bimetallic Fe-Zn/TiO2 study) and pure support
was added to reach 100 mg of catalytic bed.
In the procedure of sample pretreatment, air (for sample calcination) then H2 (for
sample reduction) was introduced into the reactor, with a flow rate of 100 mL min-1
. The
increase in temperature of the reactor in an oven was controlled via a temperature program.
When activation was finished, the sample was cooled down to room temperature in H2
atmosphere with a flow rate of 100 mL min-1
, and the gas mixture containing 0.3% Butadiene/
20% H2/ 30% Propene (Table 2-4) was first analyzed by gas chromatograph (GC) before
introduction in the reactor, as a reference. After that, the reaction gas mixture was allowed to
flow through the reactor, and the outlet gas (reactants and products) was analyzed by a gas
chromatograph (Perichrom PR 2100, FID detector) with a 7.5 m column (1/8 inch) filled with
sebaconitrile 25% Chromosorb PAW (80/100 Mesh). The data were collected as a function of
time/temperature for a temperature programmed catalytic test and as a function of time for an
isothermal catalytic test. Software Winilab 4.0 was used for data acquisition and extraction of
the concentration of each gas composition. As mentioned in [26], preliminary tests were made
to attest that, under the reaction conditions, internal and external diffusion limitations could
be neglected. The flow rate of the reaction gas mixture is 50 mL min-1
, which corresponded to
a space velocity of 30 L g-1
h-1
(GHSV=20000 h-1
).

41
Figure 2-10: schematic diagram of catalytic test system
In this study, the composition of the gas mixture was controlled by mass flow
controllers with a concentration ratio between butadiene and propene of 1:100, Table 2-4.
Table 2-4: the composition of the original gas mixture
Composition Concentration
Butadiene 0.3% (3000 ppm)
Propene 30%
H2 20%
He Balance
In the study of monometallic Cu and Cu-Zn/TiO2 bimetallic catalysts, activation of the
ex situ calcined samples was performed in H2 from RT to 350 oC at a heating rate of 2
oC min
-
1, and then for 2 h at 350
oC. After catalyst activation, the catalyst was cooled down to RT
under H2 with a flow rate of 100 mL min-1
. the activity was measured every 15 min with a
temperature increasing from 30 to 300 oC at 1
oC min
-1, and the stability test was carried out
at the temperature of 100% butadiene conversion and/or at 105 oC for 20 h under the reaction
gas mixture with flow rate of 50 mL min-1
In the study of monometallic Ni and Ni-Zn/TiO2 bimetallic catalysts, the temperature
program for the ex situ calcined samples activation was reduction in H2 from RT to 450 oC, 3
oC min
-1, and then staying at 450
oC for 2 h with a flow rate of 100 mL min
-1. After catalytic
activation, the activity measurement was performed every 5 oC from 10
oC to 80 °C under the
reaction gas mixture with flow rate of 50 mL min-1
, with stabilizing at each testing
temperature for 15 min in water bath. Similar initial butadiene conversion (~85%) was
selected for the comparison of catalytic stability of bimetallic Ni-Zn samples with testing time
as long as 60 h.
In the study of monometallic Fe and Fe-Zn bimetallic catalyst, the calcined catalyst
was activated in H2 at plateau of 500 oC for 2 h, with a heating rate 3
oC min
-1. After that, the
butadiene conversion mensurement was performed every 5 oC with an initial temperature at
10 oC under the reaction gas mixture with flow rate of 50 mL min
-1, with stabilizing at each
testing temperature for 15 min in water bath. Once the butadiene conversion reached 100%,
the temperature was kept as a constant for other 20 h of isothermal reaction.

42
4.2 The evaluation of the catalytic performance
Once the data of catalytic reaction were collected by the Winilab software, the
catalytic properties were analyzed as follows:
1. The butadiene and propene conversion are expressed as:
𝐶𝑜𝑛𝑣𝑒𝑟𝑠𝑖𝑜𝑛𝑏𝑢𝑡𝑎𝑑𝑖𝑒𝑛𝑒 (%) = 100 × 1 −𝐵𝑢𝑡𝑎𝑑𝑖𝑒𝑛𝑒𝑜𝑢𝑡𝑙𝑒𝑡𝐵𝑢𝑡𝑎𝑑𝑖𝑒𝑛𝑒𝑖𝑛𝑙𝑒𝑡
𝐶𝑜𝑛𝑣𝑒𝑟𝑠𝑖𝑜𝑛𝑝𝑟𝑜𝑝𝑒𝑛𝑒 (%) = 100 ×𝑝𝑟𝑜𝑝𝑎𝑛𝑒𝑜𝑢𝑡𝑙𝑒𝑡𝑝𝑟𝑜𝑝𝑒𝑛𝑒𝑖𝑛𝑙𝑒𝑡
2. The activity and turn over frequency (TOF) are expressed as:
𝐴𝑐𝑡𝑖𝑣𝑖𝑡𝑦 𝑚𝑜𝑙 ∙ 𝑠−1 ∙ 𝑔𝑚𝑒𝑡𝑎𝑙−1 =
𝐵𝑢𝑡𝑎𝑑𝑖𝑒𝑛𝑒𝑐𝑜𝑛𝑠𝑢𝑚𝑒𝑑 𝑝𝑝𝑚 ∙ 𝑄
𝑚𝑐𝑎𝑡𝑎𝑙 × 𝑤𝑡%𝑚𝑒𝑡𝑎𝑙∙
𝑃
𝑅 ∙ 𝑇
Butadieneconsumed ppm is the concentration of the butadiene that is converted to alkenes and
alkane; Q is the flow rate of the gas mixture; P/RT = 1/V (24 L mol-1
);
𝑇𝑂𝐹(𝑠−1) =𝐴𝑐𝑡𝑖𝑣𝑖𝑡𝑦 ∙ 𝑀𝑚𝑒𝑡𝑎𝑙
𝐷
𝐷 % = 1021 ×6 × 𝑀 × 𝜌𝑠𝑖𝑡𝑒
𝑑𝑚𝑒𝑡𝑎𝑙 × 𝜌𝑚𝑒𝑡𝑎𝑙 × 𝑁
in which D(%) is the metal dispersion, using the formula described by Scholten et al [27],
which assumes the metal nanoparticles are spherical shape, thus the number 6 in the D(%)
formula is received from the volume (V) – surface area relationship (S):
(detailed information can be found in Scholten et al); M is the metal molar mass (g mol-1
); ρsite
43
is the metal surface site density (e.g., 14.7, 15.4, 16.3 atom nm-2
for copper, nickel and iron,
respectively [27]); d is average particle; ρmetal is the metal density (8.96, 8.908 and 7.874 g
cm-3
for copper, nickel and iron, respectively); N is the Avogadro constant (6.02×10²³
mol-1
).
For the bimetallic catalysts, the copper and nickel surface site densities were estimated using
the average Cu/Zn and Ni/Zn atomic ratios that were determined from EDS analyses.
3. The catalytic selectivity to butenes and to butane was evaluated as follows:
𝑆𝑒𝑙𝑒𝑐𝑡𝑖𝑣𝑖𝑡𝑦 𝑡𝑜 𝑏𝑢𝑡𝑒𝑛𝑒𝑠 % = 𝐵𝑢𝑡𝑒𝑛𝑒𝑠𝑜𝑢𝑡𝑙𝑒𝑡
𝐵𝑢𝑡𝑒𝑛𝑒𝑠𝑜𝑢𝑡𝑙𝑒𝑡 + 𝐵𝑢𝑡𝑎𝑛𝑒𝑜𝑢𝑡𝑙𝑒𝑡× 100
𝑆𝑒𝑙𝑒𝑐𝑡𝑖𝑣𝑖𝑡𝑦 𝑡𝑜 𝑏𝑢𝑡𝑎𝑛𝑒 % =𝐵𝑢𝑡𝑎𝑛𝑒𝑜𝑢𝑡𝑙𝑒𝑡
𝐵𝑢𝑡𝑒𝑛𝑒𝑠𝑜𝑢𝑡𝑙𝑒𝑡 + 𝐵𝑢𝑡𝑎𝑛𝑒𝑜𝑢𝑡𝑙𝑒𝑡× 100

44
5. Reference
1. P.Burattin, M.Che, C. Louis, The Journal of Physical Chemistry B, 101 (1997) 7060.
2. V.Kaushik, C. Sivaraj, P.K. Rao, Applied surface science, 51 (1991) 27.
3. K.Bourikas, C. Kordulis, A. Lycourghiotis, Chemical reviews, 114 (2014) 9754.
4. J.A. van Dillen, J.W.G., L.A Hermans, J. van der Meijden, In "Proceedings of the 6th
International Congress on Catalysis" London, 1976.
5. G. C. Bond, P.B.W., F.C. Tompkins, Ed., The Chemical Society: London, 1977, P
677.
6. J.W.E.Coenen, Reduction of Silica Supported Nickel Catalysts, in Studies in Surface
Science and Catalysis, P.G.P.J. B. Delmon and G. Poncelet, Editors. 1979, Elsevier. p.
89-111.
7. J.W.Geus, A.J. Dillen, Preparation of supported catalysts by deposition–precipitation.
Handbook of heterogeneous catalysis, 1997.
8. W.H.R.Shaw, J.J. Bordeaux, Journal of the American Chemical Society, 77 (1955)
4729.
9. J.T.Richardson, R.J. Dubus, Journal of Catalysis, 54 (1978) 207.
10. M.A.Keane, Canadian Journal of Chemistry, 72 (1994) 372.
11. J.Kragten, , Atlas of metal—ligand equilibria in aqueous solution, 1979, Pergamon.
12. J.Bjerrum, , Stability constants of metal-ion complexes. 1964: The Chemical Society.
13. J.Blancharda, A.Hervier, G.Costentin, J.Regalbuto, C.Louis, S.Boujday, Catalysis
Today, 235 (2014).
14. A.L. J. Olsson, I.R. Quevedo, D.He, M.Basnet, N.Tufenkji, ACS nano, 7 (2013) 7833.
15. G.A.Parks, Chemical Reviews, 65 (1965) 177.
16. R.M.Cornell, A.M.Posner, J.P. Quirk, Journal of Colloid and Interface Science, 53
(1975) 6.
17. S.Mustafa, B.Dilara, Z.Neelofer, A.Naeem, S.Tasleem, Journal of Colloid and
Interface Science, 204 (1998) 284.
18. A.L.Valdivieso, J.L.Reyes Bahena, S.Song, R.Herrer Urbina, interface. Journal of
Colloid and Interface Science, 298 (2006) 1.
19. K.C.Akratopulu, L. Vordonis, A. Lycourghiotis, Journal of the Chemical Society,
Faraday Transactions 1: Physical Chemistry in Condensed Phases, 82 (1986) 3697.
20. K.C.Akratopulu, C. Kordulis, A. Lycourghiotis, Journal of the Chemical Society,
Faraday Transactions, 86 (1990) 3437.

45
21. S.Subramanian, J.S.Noh, J.A. Schwarz, Journal of Catalysis,114 (1988) 433.
22. S.Ẑalac, N.Kallay, Journal of Colloid and Interface Science, 149 (1992) 233.
23. K.Bourikas, J.Vakros, C.Kordulis, A.Lycourghiotis, The Journal of Physical
Chemistry B, 107 (2003) 9441.
24. R.Glocker, H.Schreiber, Annalen der Physik, 390 (1928) 1089.
25. D.M. Fernandes, R.Silva, A.A.Winkler Hechenleitner, E. Radovanovic, M.A.
Custódio Melo, E.A. Gómez Pined, Materials Chemistry and Physics, 115 (2009) 110.
26. A.Hugon, L.Delannoy, J.M.Krafft, C.Louis, The Journal of Physical Chemistry C, 114
(2010) 10823.
27. J.Scholten, A.Pijpers, A. Hustings, Catalysis Reviews, 27 (1985) 151.
Chapter 3: Preparation and Characterization of Monometallic
Catalyst (Cu,Zn, Ni)

Chapter 3: Preparation and Characterization of Monometallic Catalyst (Cu, Zn, Ni) .. 47
1. Introduction ...................................................................................................................... 47
2. Preparation of monometallic catalysts ............................................................................. 48
3. Monometallic Cu/TiO2 Catalysts ..................................................................................... 49
3.1 Cu deposition-precipitation process ........................................................................... 50
3.1.1. Cu loading at different final pHs ......................................................................... 52
3.1.2 pH evolution of the mixture solution during deposition-precipitation process .... 53
3.2 Characterization of the Cu/TiO2 samples prepared by DPu ....................................... 55
3.2.1 XRD ..................................................................................................................... 55
3.2.2 UV-Visible ........................................................................................................... 59
3.2.3 TPR ....................................................................................................................... 60
3.2.4 TEM study of the metal particle size in Cu/TiO2 samples ................................... 62
3.3 Selective hydrogenation of 1,3-butadiene .................................................................. 64
3.4 Discussion .................................................................................................................. 66
3.5 Conclusions ................................................................................................................ 72
4. Monometallic Zn/TiO2 Catalysts ..................................................................................... 73
4.1 Zn loading at different final pHs ................................................................................ 73
4.2 pH evolution of the Zn2+
/TiO2 mixture solution during DPu ..................................... 74
4.3 Reduction behavior of Zn/TiO2 .................................................................................. 75
4.4 Selective hydrogenation of 1,3-butadiene over Zn/TiO2 catalyst .............................. 75
5. Monometallic Ni-based catalysts ..................................................................................... 76
5.1 Monometallic Ni/TiO2 catalysts ................................................................................. 77
5.1.1 Catalytic performance of 2.5 wt% Ni/TiO2 sample ............................................. 79
5.1.2 Catalytic performance of 0.5wt% Ni/TiO2 sample .............................................. 80
5.2 Monometallic Ni/ZnO catalysts ................................................................................. 81
6. Conclusion ........................................................................................................................ 88
7. References ........................................................................................................................ 91

47
Chapter 3: Preparation and Characterization of Monometallic
Catalyst (Cu, Zn, Ni)
1. Introduction
As mentioned in Chapter 2, Deposition-Precipitation with urea (DPu), which is based
on gradual pH increasing of the solution containing the metal precursor, due to urea
decomposition at 80 oC, is the main method used for catalyst preparation in this thesis. The
theoretical calculations reported in Figure 2-3 in Chapter 2 indicate that copper, zinc and
nickel ions have different “deposition behaviors”. As a consequence, the deposition-
precipitation of these different transition metals ions onto TiO2 support surface was
experimentally studied, separately, and presented in this chapter. Monometallic Cu/TiO2 was
selected as an example to deeply explore the deposition-precipitation behavior of transition
metals ions in the presence of TiO2 support during the DPu preparation.
Besides the study of deposition-precipitation of transition metals ions, the crystallite
structure and the catalytic performances of TiO2-supported monometallic samples are also
explored in this chapter. This will help us to better distinguish the function of each metal in
the bimetallic Cu-Zn/TiO2 and Ni-Zn/TiO2 catalysts for selective hydrogenation reaction, i.e.
which one could be the main active metal and which one would be the promoter or the
modifier. The catalytic results over the monometallic Cu/TiO2 and Ni/TiO2 and Zn/TiO2
catalysts will also help at selecting the appropriate catalytic conditions (e.g., metal loading)
for the further study of the TiO2-supported bimetallic catalysts. Besides that, in a previous
study, Derrouiche et al [1] of Cu/ZnO catalysts showed that metallic Cu particles were formed
after sample reduction at 280 oC, and that they transformed to intermetallic Cu-Zn particles at
higher reduction temperature to form Cu3Zn1 alloy at 350 oC. Thus in this chapter, we also
study the Ni/ZnO system to determine whether Ni-Zn alloy can be also evidenced.
In this chapter, the DPu preparation of monometallic catalysts i.e., Cu, Zn and Ni
supported on TiO2 or ZnO, and their catalytic performances for selective hydrogenation of
butadiene are studied.
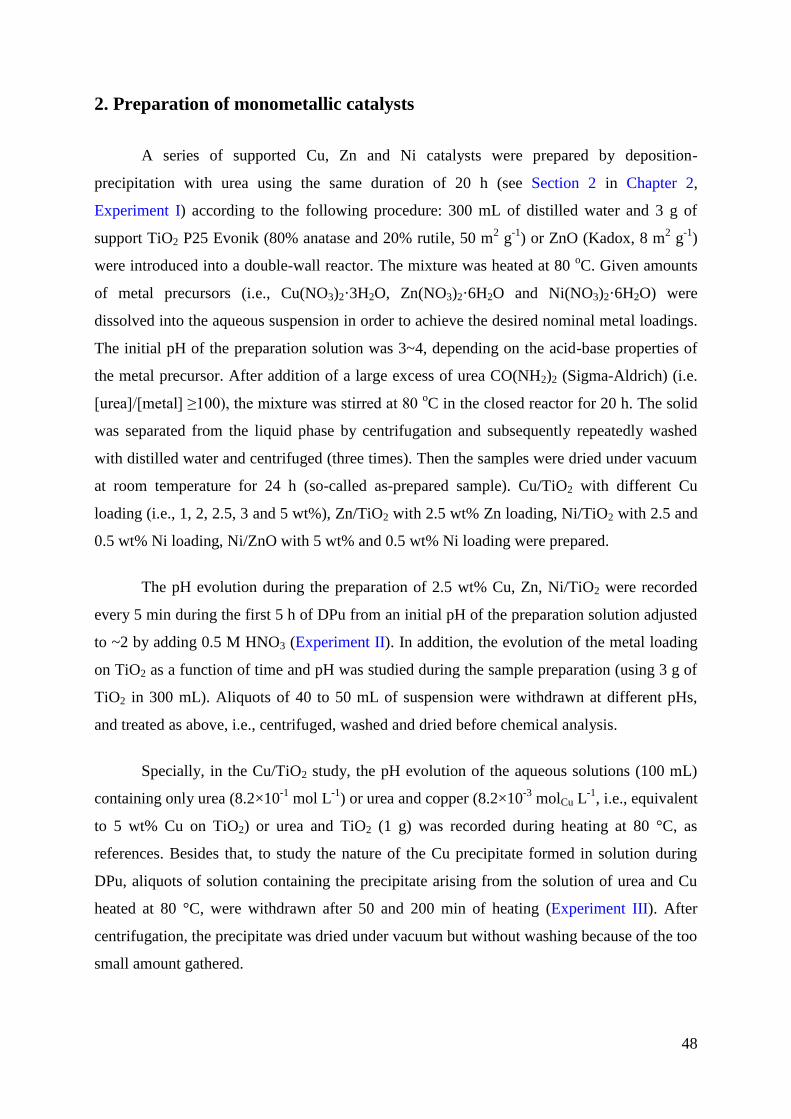
48
2. Preparation of monometallic catalysts
A series of supported Cu, Zn and Ni catalysts were prepared by deposition-
precipitation with urea using the same duration of 20 h (see Section 2 in Chapter 2,
Experiment I) according to the following procedure: 300 mL of distilled water and 3 g of
support TiO2 P25 Evonik (80% anatase and 20% rutile, 50 m2 g
-1) or ZnO (Kadox, 8 m
2 g
-1)
were introduced into a double-wall reactor. The mixture was heated at 80 oC. Given amounts
of metal precursors (i.e., Cu(NO3)2·3H2O, Zn(NO3)2·6H2O and Ni(NO3)2·6H2O) were
dissolved into the aqueous suspension in order to achieve the desired nominal metal loadings.
The initial pH of the preparation solution was 3~4, depending on the acid-base properties of
the metal precursor. After addition of a large excess of urea CO(NH2)2 (Sigma-Aldrich) (i.e.
[urea]/[metal] ≥100), the mixture was stirred at 80 oC in the closed reactor for 20 h. The solid
was separated from the liquid phase by centrifugation and subsequently repeatedly washed
with distilled water and centrifuged (three times). Then the samples were dried under vacuum
at room temperature for 24 h (so-called as-prepared sample). Cu/TiO2 with different Cu
loading (i.e., 1, 2, 2.5, 3 and 5 wt%), Zn/TiO2 with 2.5 wt% Zn loading, Ni/TiO2 with 2.5 and
0.5 wt% Ni loading, Ni/ZnO with 5 wt% and 0.5 wt% Ni loading were prepared.
The pH evolution during the preparation of 2.5 wt% Cu, Zn, Ni/TiO2 were recorded
every 5 min during the first 5 h of DPu from an initial pH of the preparation solution adjusted
to ~2 by adding 0.5 M HNO3 (Experiment II). In addition, the evolution of the metal loading
on TiO2 as a function of time and pH was studied during the sample preparation (using 3 g of
TiO2 in 300 mL). Aliquots of 40 to 50 mL of suspension were withdrawn at different pHs,
and treated as above, i.e., centrifuged, washed and dried before chemical analysis.
Specially, in the Cu/TiO2 study, the pH evolution of the aqueous solutions (100 mL)
containing only urea (8.2×10⁻¹
mol L-1
) or urea and copper (8.2×10⁻³
molCu L-1
, i.e., equivalent
to 5 wt% Cu on TiO2) or urea and TiO2 (1 g) was recorded during heating at 80 °C, as
references. Besides that, to study the nature of the Cu precipitate formed in solution during
DPu, aliquots of solution containing the precipitate arising from the solution of urea and Cu
heated at 80 °C, were withdrawn after 50 and 200 min of heating (Experiment III). After
centrifugation, the precipitate was dried under vacuum but without washing because of the too
small amount gathered.

49
To complement Experiment II on Cu loading evolution as a function of pH, a second
series of Cu/TiO2 samples was prepared with the same nominal Cu loading (2.5 wt%) but
with different DPu durations, 3, 5, 6, 7 and 20 h (Experiment IV). The procedure of sample
preparation was the same as above, except the DPu time. Here, aliquots of 40 to 50 mL of
suspension were withdrawn after the different DPu durations, followed by centrifugation,
washing and drying under vacuum at room temperature.
3. Monometallic Cu/TiO2 Catalysts
Studies on the deposition of Cu(II) on titanium oxide are not abundant in the literature
[2-13]. The deposition of Cu(II) on titanium oxide has been studied by Bleam and McBride
[2] using electron spin resonance (ESR) spectroscopy. They found that adsorption of Cu (II)
on the surface of titanium dioxide begins at pH ~2, the surface coverage of Cu(II) starts to
increase sharply in the pH range of 4.4~4.6, and the Cu(II) adsorption is complete at pH~6.1
with a low Cu concentration, e.g., 9.04×10⁻⁵
M, whereas precipitation occurs at pH~6.2 when
the initial Cu concentration is high, e.g., 3.61×10⁻⁴
M. Meanwhile, Ottaviani et al [3] also
showed that Cu(II) is specifically adsorbed, with one or two of its water ligands substituted by
the surface hydroxyls of TiO2, by using ESR spectroscopy to study the adsorption of Cu(II)
on titanium oxide at low pH. The adsorption of Cu(II) onto TiO2 was explored by Poznyak et
al [8] using electrochemical methods, ESR, XPS and electroreflection spectroscopy, and they
found that there are at least four types of copper species formed on TiO2 surface after
adsorption of aqueous Cu2+
ions, i.e., (i) individual Cu2+
ions coupled to the surface Ti(IV)
ions via oxygen; (ii) isolated monovalent copper ions; (iii) cluster of Cu2+
ions; (iv) copper
hydroxide particles. It also has been found by Kim et al [9], who focused on the removal of
Cu(II) from aqueous solution, that the amount of Cu adsorbed on the TiO2 surface increases
with increasing temperature from 15 to 40 oC. Moreover, the behavior of adsorption of Cu(II)
on TiO2 surface has also be explained by different models i.e., bidentate innersphere [4, 11]
(Eq. 3-1) and monodentate inner-sphere [5-7] (Eq. 3-2).
……. Eq. 3-1
……. Eq. 3-2

50
Besides that, DPu of Cu has also been recently performed on titania in association
with gold to prepare bimetallic Au-Cu particles [14, 15]. It was found that Cu (around 1 wt
%) could be easily and quantitatively deposited on titania. However, no detailed study was
performed to investigate the mechanism of DPu of copper on TiO2.
From a catalytic point of view, copper is an interesting metal for various types of
reactions such as water-gas-shift reaction [16, 17], methanol synthesis [18-20], propene
epoxidation [21-23], alcohol oxidation [24, 25] and selective hydrogenation of CO2 [26] and
of furfural [27]. Only few explorations have been performed on the catalytic property of
supported Cu-based catalysts for selective hydrogenation of unsaturated hydrocarbons [28-
31].
Thus, the genesis of Cu/TiO2 samples with different Cu loadings prepared by
deposition-precipitation with urea, i.e., the evolution of both the pH, the Cu loading and the
nature of supported species was investigated, then the consequence on the metal particle size
after reduction and on the catalytic properties in selective hydrogenation of butadiene
performed in excess of propene. This reaction can be considered as a model reaction that
mimics the challenging industrial process of catalytic purification of alkene cuts from diene
impurities, a reaction already studied in our laboratory over other catalytic systems.
3.1 Cu deposition-precipitation process
The XRF analyses of the as-prepared Cu/TiO2 samples after 20 h DPu with different
Cu loadings show that around 80% of Cu was deposited on the TiO2 support during the DPu
process (Table 3-1). The Cu2+
ions left in the very light blue supernatants of the 2.5 and 5
wt% Cu/TiO2 preparation were characterized by UV-Visible (Figure 3-1). The spectra show a
Cu2+
d-d band around 650 nm (Figure 3-1a, b), strongly shifted with respect to the one of the
Cu(H2O)62+
complex of a Cu(NO3)2 solution around 800 nm (Figure 3-1c). The band can be
attributed to the d-d transition of a [Cu(NH3)4]2+
species according to [32]. The formation of
this complex results from the decomposition of urea into ammonia (Eq. 3-3) and from the fact
that NH3 is a stronger ligand than H2O. Figure 3-2 shows that the as-prepared samples exhibit
different colorations depending on the Cu loadings: the solid samples with Cu loading lower
than 1.6 wt% are green whereas those containing more Cu are gray.
Eq. 3-3

51
Table 3-1: Final Cu loadings in the Cu/TiO2 samples after 20 h DPu and pH at which the
color of the suspension changed with in the first 5 h of DPu
Nominal Cu
loading (wt %)
Concentration of
Cu2+
10-3
mol L-1
Actual Cu
Loading after
DPu 20 h (wt %)
pH at which the color change
white to green green to gray
2 3.2 ~1.6 4.1 -
2.5 4.0 2.1 3.9 -
3 4.9 2.5 3.8 -
5 8.2 4.2 3.7 5.5
5 (B2) 8.2 - 5.2 (green-dirty) 7.2 (green black)
450 500 550 600 650 700 750 800 850
0.00
0.01
0.02
0.03
0.04
800
c
b
Ab
so
rban
ce
Wavelength / nm
a
650
Figure 3-1: UV-visible spectra of the supernatant collected after the DPu preparation for 20 h
of 2.5 wt% Cu/TiO2 (a), 5 wt% Cu/TiO2 (b), of a Cu(NO3)2 aqueous solution (c).
Figure 3-2: Color of as-prepared Cu/TiO2 with different Cu loadings after 20 h of DPu.

52
3.1.1. Cu loading at different final pHs
To determine the evolution of the Cu loading during the DPu preparation of the 2.5
wt% Cu/TiO2 sample, aliquots of the suspension were withdrawn at different pHs and times
(see Experimental Section), and the Cu loadings on TiO2 surface were measured by XRF after
sample washing and drying (Figure 3-3). From Figure 3-3, it appears that most of the Cu is
deposited on TiO2 below pH 6, which is the PZC of TiO2, i.e., before 2.2 h of DPu. This was
a surprising result since at pH below the PZC, both the Cu complexes and the titania surface
are supposed to be positively charged and not supposed to interact, and it is known at least for
the Ni/SiO2 system also prepared by DPu [33, 34] that cationic Ni complex deposition starts
at pH above the PZC of silica when silica surface is negatively charged. It may be also noted
that the color of the suspension changed during DPu; it was initially bluish at pH=3.0, green
from pH~4.0 to 6, i.e., between 1 and 2.2 h of DPu and finally gray-green at pH ~7 after 7 h
of DPu (Table 3-2). Figure 3-3 and Table 3-2 also show that all the copper is already
deposited within 3 h since the loading does not vary any more for longer time, but that the
sample color change from green to gray after 7 h of DPu occurs while the Cu loading had
already reached a maximum.
3.5 4.0 4.5 5.0 5.5 6.0 6.5 7.0 7.50.0
0.5
1.0
1.5
2.0
2.57653
DPu Time (h)
202.21.6 1.81.31.1
Meta
l L
oad
ing
/ w
t%
pH of DPu
0.9
Figure 3-3: Evolution of the Cu loadings in the 2.5 wt % Cu/TiO2 sample as a function of pH
and DPu time. Full stars: experiment I, empty stars: experiment II.

53
Table 3-2: Evolution of the Cu loading and sample color as a function of the duration of DPu
preparation of a Cu/TiO2 sample with a nominal Cu content of 2.5 wt%. This table gathers
two sets of experiments (Experiments I and II; see experimental)
DPu time / h Cu loading
(wt%) Sample color Experiment
0.9 0.1 bluish Experiment Ⅰ: color changes from bluish to green
Cu Loading versus time / pH
1.6 1.4 green
2.2 2.0 green
3 2.1 green
Experiment Ⅱ: no Cu loading change
Sample color versus time
5 2.2 green
6 2.1 green
7 2.1 gray
20 2.1 gray
3.1.2 pH evolution of the mixture solution during deposition-precipitation process
Since the key point in the DPu process is to gradually increase the concentration of
precipitating agent in the solution [35], the pH evolution of the suspension was monitored as a
function of DPu time. Figure 3-4 displays the pH evolution at 80 oC during the first 5 h of
DPu for four different Cu concentrations corresponding to final samples containing 2, 2.5, 3
and 5 wt% Cu.
Before analyzing the pH evolution during DPu, three blank experiments also reported
in Figure 3-4 must be commented: the pH evolution of a solution of urea/ water (gray line,
named B1), of a solution of Cu2+
/ urea/ water (violet line, named B2) and of a suspension of
urea/ TiO2/ water (black line, named B3). The concentrations of Cu2+
and TiO2 are the same
as those used for the preparation of 5 wt% Cu/TiO2. Urea decomposition at 80 oC (eq. 1) is
attested by the increase of pH of the solution of urea in water (curve B1) up to a final value
close to 7.2. The delay in the increase of pH between curves B3 and B1 results from the
buffering effect due to the presence of TiO2 [36]. The delay in the increase of pH between
curves B2 and B1 in the 4.5-6.0 pH range attests that OH- ions resulting from urea
decomposition are consumed and involved in a change of copper speciation. This is also
attested by the fact that in experiment B2, the solution initially clear blue turned opaque
muddy green above pH=5.2 (at the inflexion point around 50 min), indicating copper
precipitation, then black-green at pH=7.2, indicating a change in the composition of the
precipitate. The UV-Visible spectrum of the supernatant gathered after precipitate

54
centrifugation is completely flat (not shown), which indicates that all the Cu ions initially
present in the solution have precipitated.
If one examines the pH evolution during DPu of the four different Cu/ urea/ TiO2/
water mixtures (i.e., 2, 2.5, 3 and 5 wt% Cu), one can see in Figure 3-4 that the pH curves
initially behave the same way as curve B3 (urea/ TiO2/ water), then exhibit differences in the
pH range 3.5-6. The differences of shape and time shift of the pH curves increase as the
copper concentration increases. During these experiments, a change in the color of the
suspension from whitish to green was observed at pH close to 4 as reported in Table 3-1.
These pHs slightly vary with the Cu concentration, and coincide with the pH values of the
inflexion points of the pH curves. For the suspension corresponding to 5 wt% Cu DPu
(8.2×10⁻³
mol L-1
) (pink curve), the inflexion point is much more visible, and induces a
marked delay in the further increase of pH. To some extent, it compares with the shape of
curve B2 (5 wt% Cu2+
/ urea), but the presence of TiO2 induces a time delay before pH starts
increasing, and lowers the pH of the inflexion point from ~5.2 to ~4.5; this will be discussed
in the part 3.4. In addition, the color of the 5 wt% Cu DPu suspension which was deep green
from pH 3.7, turned gray when pH reached 5.5; this later color change was not observed with
the other three samples, as they remained green in the first 5 h of the DPu process. Note
however that for longer DP time (20 h), they also tend to turn grayish except for the lower Cu
loadings (Figure 3-2).
0.0 0.5 1.0 1.5 2.0 2.5 3.0 3.5 4.0 4.5 5.0
2
3
4
5
6
7
8
1.0 1.1 1.2
3.0
3.5
4.0
4.5
pH
Time / h
80oC
pH
Time / h
B1 2 wt% DPu
B2 2.5wt% DPu
B3 3 wt% DPu
5 wt% DPu
80oC
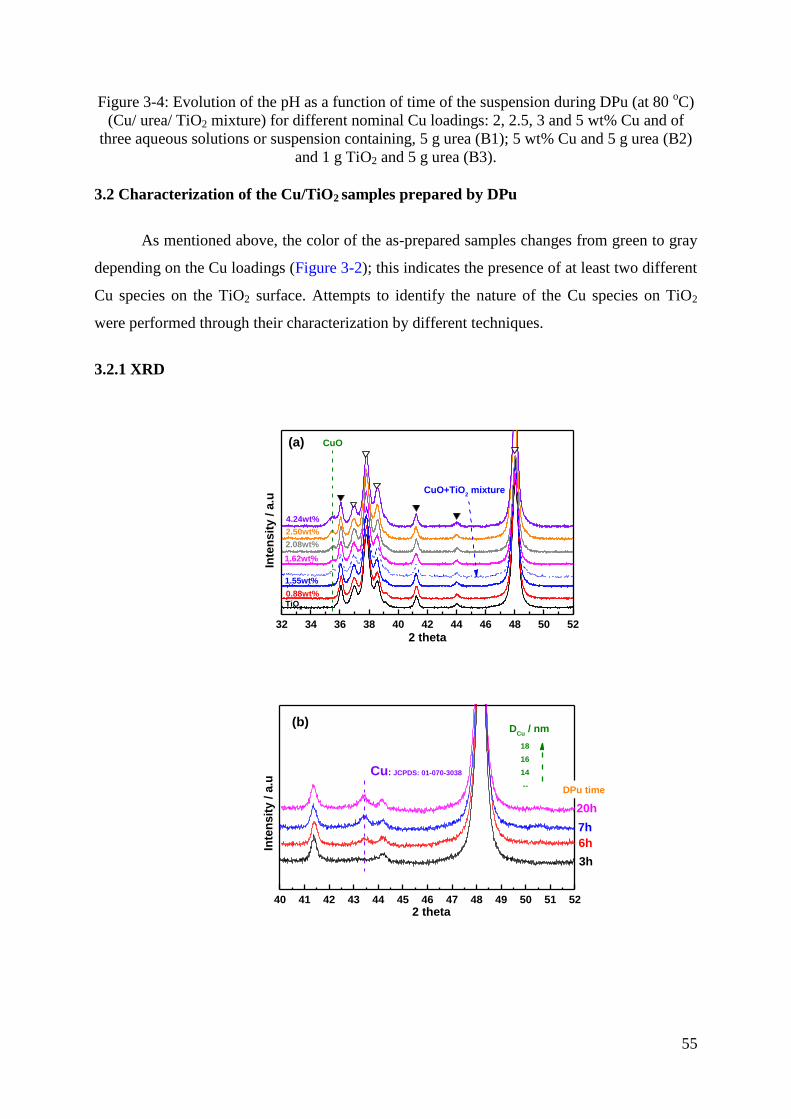
55
Figure 3-4: Evolution of the pH as a function of time of the suspension during DPu (at 80 oC)
(Cu/ urea/ TiO2 mixture) for different nominal Cu loadings: 2, 2.5, 3 and 5 wt% Cu and of
three aqueous solutions or suspension containing, 5 g urea (B1); 5 wt% Cu and 5 g urea (B2)
and 1 g TiO2 and 5 g urea (B3).
3.2 Characterization of the Cu/TiO2 samples prepared by DPu
As mentioned above, the color of the as-prepared samples changes from green to gray
depending on the Cu loadings (Figure 3-2); this indicates the presence of at least two different
Cu species on the TiO2 surface. Attempts to identify the nature of the Cu species on TiO2
were performed through their characterization by different techniques.
3.2.1 XRD
32 34 36 38 40 42 44 46 48 50 52
CuO+TiO2 mixture
4.24wt%
2.50wt%
2.08wt%
1.62wt%
1.55wt%
0.88wt%
Inte
nsit
y / a
.u
2 theta
TiO2
CuO(a)
40 41 42 43 44 45 46 47 48 49 50 51 52
20h
7h
6hInte
nsit
y / a
.u
2 theta
3h
DPu time
Cu: JCPDS: 01-070-3038
(b)D
Cu / nm
18
16
14
--

56
10 15 20 25 30 35 40 45 50 55 60 65 70 75 80
In
ten
sit
y / a
.u
DPu 200min
2 theta
DPu 50min(c)
Figure 3-5: XRD patterns of (a) as-prepared Cu/TiO2 with different Cu loadings after 20 h of
DPu. The blue dot line corresponds to the XRD pattern of a physical mixture of CuO and TiO2
with ~1.5 wt% Cu; ▼stands for rutile TiO2 (JCPDS: 01-084-1286); ▽ stands for anatase TiO2
(JCPDS: 01-086-0147); CuO peak position from JCPDS: 03-065-2309; (b) XRD of the
reduced samples with the same Cu loading (2.1wt%) but different DPu preparation times; (c)
unwashed precipitate collected from a solution containing urea and 5 wt% Cu after 50 min and
200 min at 80 °C; ×: urea (JCPDS# 01-089-2835); ★: Cu2(OH)3NO3 (JCPDS# 01-075-0127);
☆: Cu2(OH)3NO3 (JCPDS# 00-014-0687); ◆: Cu2(CO3)(OH)3 (JCPDS# 00-004-0309); □:
CuO (JCPDS# 00-048-1545).
XRD was performed first on the as-prepared samples (Figure 3-5a) prepared for 20 h
and containing different Cu loadings. In addition to the peaks of anatase-TiO2 (JCPDS #: 01-
084-1286) and rutile-TiO2 (JCPDS #: 01-086-0147), a weak peak at 2θ= 35.6o is visible for
the Cu loadings higher than 1.62 wt%, i.e., for the gray samples, and its intensity increases
with the Cu loading. This XRD peak was also observed at the same angle (35.6o) with the
mechanical mixture of CuO in TiO2 (1.5 wt% Cu, gray color) (Figure 3-5a). This indicates
that the gray color of the Cu/TiO2 samples containing more than 1.6 wt% Cu results from the
presence of CuO (confirmed by comparison with the JCPDS file of CuO, 03-065-2309),
which is known to be black. These results also indicate that the Cu species responsible for the
green color of the sample in the low loaded samples is not detected by XRD because it is
either present in too low amount or is amorphous. The average CuO particle sizes deduced
from the Scherrer equation in the samples containing 1.6, 2.1, 2.4 and 4.2 wt% Cu are 10, 12,
13 and 15 nm, respectively.
The series of Cu/TiO2 samples prepared with a Cu loading of 2.1 wt% also showed
color changes as a function of the DPu duration (Table 3-2). After sample reduction at 350 °C,
the particle size of metallic Cu in these samples was determined by XRD (Figure 3-5b). They
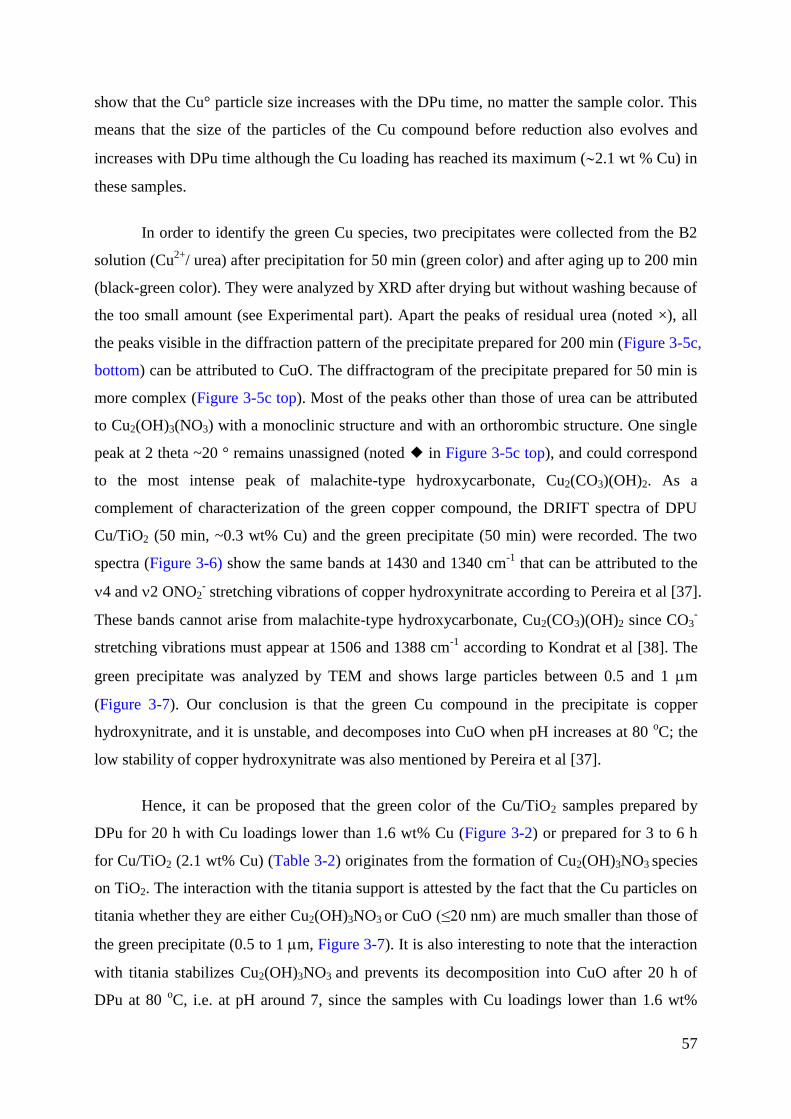
57
show that the Cu° particle size increases with the DPu time, no matter the sample color. This
means that the size of the particles of the Cu compound before reduction also evolves and
increases with DPu time although the Cu loading has reached its maximum (2.1 wt % Cu) in
these samples.
In order to identify the green Cu species, two precipitates were collected from the B2
solution (Cu2+
/ urea) after precipitation for 50 min (green color) and after aging up to 200 min
(black-green color). They were analyzed by XRD after drying but without washing because of
the too small amount (see Experimental part). Apart the peaks of residual urea (noted ×), all
the peaks visible in the diffraction pattern of the precipitate prepared for 200 min (Figure 3-5c,
bottom) can be attributed to CuO. The diffractogram of the precipitate prepared for 50 min is
more complex (Figure 3-5c top). Most of the peaks other than those of urea can be attributed
to Cu2(OH)3(NO3) with a monoclinic structure and with an orthorombic structure. One single
peak at 2 theta ~20 ° remains unassigned (noted in Figure 3-5c top), and could correspond
to the most intense peak of malachite-type hydroxycarbonate, Cu2(CO3)(OH)2. As a
complement of characterization of the green copper compound, the DRIFT spectra of DPU
Cu/TiO2 (50 min, ~0.3 wt% Cu) and the green precipitate (50 min) were recorded. The two
spectra (Figure 3-6) show the same bands at 1430 and 1340 cm-1
that can be attributed to the
4 and 2 ONO2- stretching vibrations of copper hydroxynitrate according to Pereira et al [37].
These bands cannot arise from malachite-type hydroxycarbonate, Cu2(CO3)(OH)2 since CO3-
stretching vibrations must appear at 1506 and 1388 cm-1
according to Kondrat et al [38]. The
green precipitate was analyzed by TEM and shows large particles between 0.5 and 1 m
(Figure 3-7). Our conclusion is that the green Cu compound in the precipitate is copper
hydroxynitrate, and it is unstable, and decomposes into CuO when pH increases at 80 oC; the
low stability of copper hydroxynitrate was also mentioned by Pereira et al [37].
Hence, it can be proposed that the green color of the Cu/TiO2 samples prepared by
DPu for 20 h with Cu loadings lower than 1.6 wt% Cu (Figure 3-2) or prepared for 3 to 6 h
for Cu/TiO2 (2.1 wt% Cu) (Table 3-2) originates from the formation of Cu2(OH)3NO3 species
on TiO2. The interaction with the titania support is attested by the fact that the Cu particles on
titania whether they are either Cu2(OH)3NO3 or CuO (≤20 nm) are much smaller than those of
the green precipitate (0.5 to 1 m, Figure 3-7). It is also interesting to note that the interaction
with titania stabilizes Cu2(OH)3NO3 and prevents its decomposition into CuO after 20 h of
DPu at 80 oC, i.e. at pH around 7, since the samples with Cu loadings lower than 1.6 wt%

58
remain green. In contrast, the gray color of the samples with Cu loadings higher than 1.6 wt%
results from the presence of CuO arising from the partial or total decomposition of supported
Cu2(OH)3NO3.
1800 1500 1200
Urea
Cu+ urea 50min
1340
Wavenumber / cm-1
Cu/TiO2 50min
1430
1385
NO3
-
Cu2(OH)
3NO
3
Urea
1662 From TiO2
Figure 3-6: DRIFT spectra of DPU Cu/TiO2 (DPu 50 min, ~0.3 wt% Cu) and the
green Cu/urea precipitate (DPu 50 min).
Figure 3-7: TEM of the green precipitate prepared by precipitation Cu2+
with urea in the
absence of TiO2 support at 80 °C for 50 min.
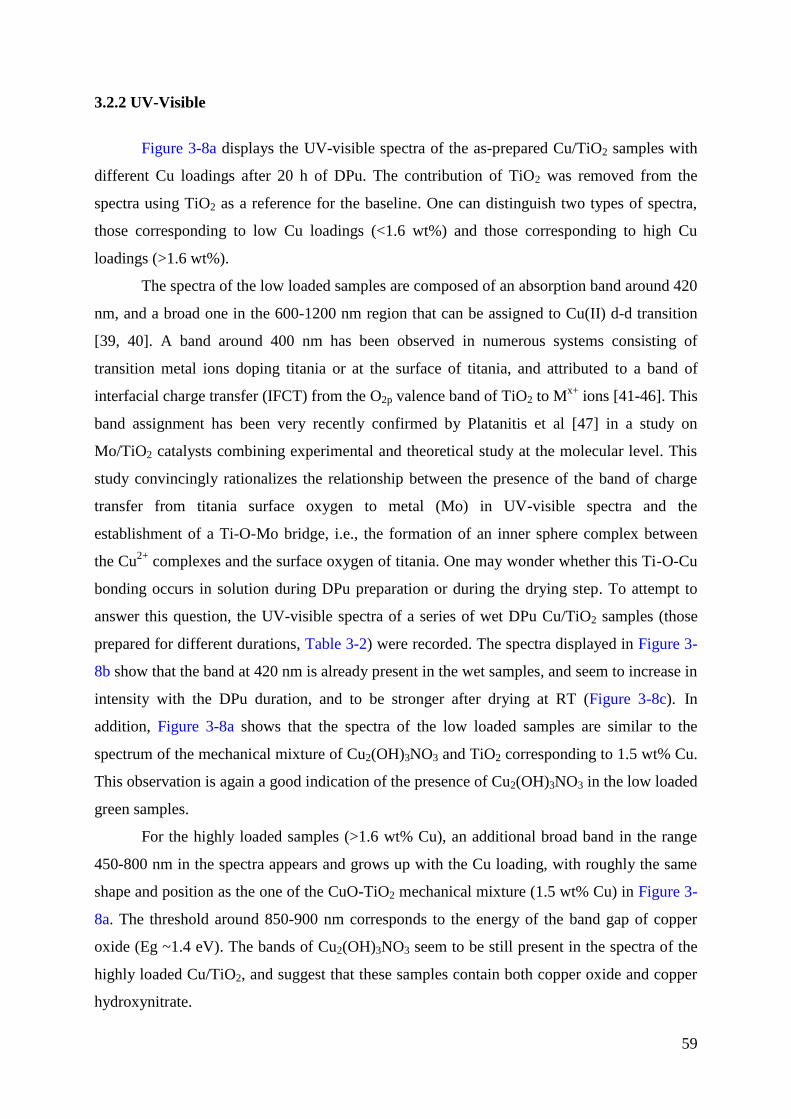
59
3.2.2 UV-Visible
Figure 3-8a displays the UV-visible spectra of the as-prepared Cu/TiO2 samples with
different Cu loadings after 20 h of DPu. The contribution of TiO2 was removed from the
spectra using TiO2 as a reference for the baseline. One can distinguish two types of spectra,
those corresponding to low Cu loadings (<1.6 wt%) and those corresponding to high Cu
loadings (>1.6 wt%).
The spectra of the low loaded samples are composed of an absorption band around 420
nm, and a broad one in the 600-1200 nm region that can be assigned to Cu(II) d-d transition
[39, 40]. A band around 400 nm has been observed in numerous systems consisting of
transition metal ions doping titania or at the surface of titania, and attributed to a band of
interfacial charge transfer (IFCT) from the O2p valence band of TiO2 to Mx+
ions [41-46]. This
band assignment has been very recently confirmed by Platanitis et al [47] in a study on
Mo/TiO2 catalysts combining experimental and theoretical study at the molecular level. This
study convincingly rationalizes the relationship between the presence of the band of charge
transfer from titania surface oxygen to metal (Mo) in UV-visible spectra and the
establishment of a Ti-O-Mo bridge, i.e., the formation of an inner sphere complex between
the Cu2+
complexes and the surface oxygen of titania. One may wonder whether this Ti-O-Cu
bonding occurs in solution during DPu preparation or during the drying step. To attempt to
answer this question, the UV-visible spectra of a series of wet DPu Cu/TiO2 samples (those
prepared for different durations, Table 3-2) were recorded. The spectra displayed in Figure 3-
8b show that the band at 420 nm is already present in the wet samples, and seem to increase in
intensity with the DPu duration, and to be stronger after drying at RT (Figure 3-8c). In
addition, Figure 3-8a shows that the spectra of the low loaded samples are similar to the
spectrum of the mechanical mixture of Cu2(OH)3NO3 and TiO2 corresponding to 1.5 wt% Cu.
This observation is again a good indication of the presence of Cu2(OH)3NO3 in the low loaded
green samples.
For the highly loaded samples (>1.6 wt% Cu), an additional broad band in the range
450-800 nm in the spectra appears and grows up with the Cu loading, with roughly the same
shape and position as the one of the CuO-TiO2 mechanical mixture (1.5 wt% Cu) in Figure 3-
8a. The threshold around 850-900 nm corresponds to the energy of the band gap of copper
oxide (Eg ~1.4 eV). The bands of Cu2(OH)3NO3 seem to be still present in the spectra of the
highly loaded Cu/TiO2, and suggest that these samples contain both copper oxide and copper
hydroxynitrate.

60
400 500 600 700 800 900 1000 1100 1200
0.0
0.2
0.4
0.6
0.8
1.0
Cu2(OH)
3NO
3 + TiO
2 CuO + TiO
2
Ab
so
rban
ce
Wavelength / nm
0.60wt%
0.88wt%
1.55wt%
1.62wt%
2.08wt%
2.50wt%
4.24wt%
(a)
400 500 600 700 800 900 1000 1100 1200
0.0
0.1
0.2
0.3
0.4
0.5
0.6
DPu 7h
DPu 6h
Inte
nsit
y / a
.u
Wavelength / nm
DPu 3hwet TiO
2 reference
(b)
400 500 600 700 800 900 1000 1100 1200
0.0
0.1
0.2
0.3
0.4
0.5
0.6
Wavelength / nm
DPu 7h
DPu 6h
DPu 3h
dry TiO2 reference
Inte
nsit
y / a
.u
(c)
Figure 3-8: UV-visible spectra of (a) the as-prepared Cu/TiO2 samples with different Cu
loadings after 20 h of DPu and physical mixtures of CuO and TiO2 and of Cu2(OH)3NO3 and
TiO2, both containing ~1.5 wt% Cu; (b) the wet Cu/TiO2 samples containing (2.1 wt% Cu)
but prepared during different durations; (c) the same samples after drying at RT.
3.2.3 TPR
The reduction behavior of the as-prepared Cu/TiO2 samples (20 h of DPu) was studied
by TPR (Figure 3-9). TiO2 does not show any reduction peaks in the temperature range from
room temperature to 550 oC, thus the two reduction peaks at ~150 and ~175
oC correspond to
the reduction of Cu species on TiO2. The intensity of the first reduction peak (~150 oC) seems
to be independent on the Cu loading whereas the second one, initially around 175 oC, shifts to
higher temperature and increases in intensity with the Cu loading. It becomes higher than the
first peak when the Cu loading exceeds 1.6 wt%. Bulk CuO is known to reduce directly from
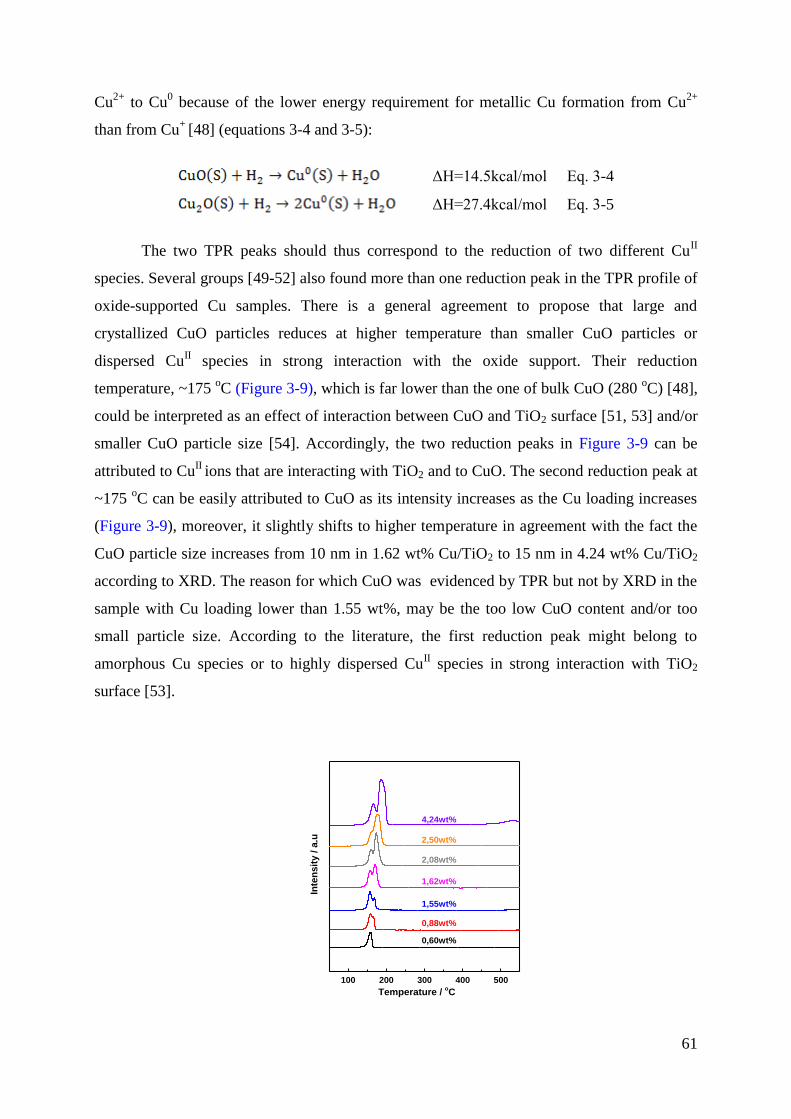
61
Cu2+
to Cu0 because of the lower energy requirement for metallic Cu formation from Cu
2+
than from Cu+
[48] (equations 3-4 and 3-5):
ΔH=14.5kcal/mol Eq. 3-4
ΔH=27.4kcal/mol Eq. 3-5
The two TPR peaks should thus correspond to the reduction of two different CuII
species. Several groups [49-52] also found more than one reduction peak in the TPR profile of
oxide-supported Cu samples. There is a general agreement to propose that large and
crystallized CuO particles reduces at higher temperature than smaller CuO particles or
dispersed CuII species in strong interaction with the oxide support. Their reduction
temperature, ~175 oC (Figure 3-9), which is far lower than the one of bulk CuO (280
oC) [48],
could be interpreted as an effect of interaction between CuO and TiO2 surface [51, 53] and/or
smaller CuO particle size [54]. Accordingly, the two reduction peaks in Figure 3-9 can be
attributed to CuII
ions that are interacting with TiO2 and to CuO. The second reduction peak at
~175 oC can be easily attributed to CuO as its intensity increases as the Cu loading increases
(Figure 3-9), moreover, it slightly shifts to higher temperature in agreement with the fact the
CuO particle size increases from 10 nm in 1.62 wt% Cu/TiO2 to 15 nm in 4.24 wt% Cu/TiO2
according to XRD. The reason for which CuO was evidenced by TPR but not by XRD in the
sample with Cu loading lower than 1.55 wt%, may be the too low CuO content and/or too
small particle size. According to the literature, the first reduction peak might belong to
amorphous Cu species or to highly dispersed CuII species in strong interaction with TiO2
surface [53].
100 200 300 400 500
Inte
nsit
y /
a.u
4,24wt%
2,50wt%
2,08wt%
1,62wt%
1,55wt%
0,88wt%
0,60wt%
Temperature / oC

62
Figure 3-9: TPR of as-prepared Cu/TiO2 prepared with different Cu loadings after 20 h of
DPu.
3.2.4 TEM study of the metal particle size in Cu/TiO2 samples
The sizes of metallic Cu particles in the Cu/TiO2 samples prepared for 20 h were
estimated by TEM (Figure 3-10) after reduction under H2 at 350 oC, and transfer into the
microscope without air contact (See Experimental). It must be mentioned that TiO2 support
has wide particle size distribution with largest size around 50 nm and smallest ones around 10
nm (not shown). The average particle size was deduced from the particle size distributions,
also shown in Figure 10. In the 0.88 wt% Cu/TiO2 sample, only very small metallic Cu
particles (< 1 nm) are present (Figure 3-10a); they are visible on the edges of the TiO2
particles in the TEM images. In the 1.55 wt% Cu/TiO2 sample, in addition to small particles,
particles with larger size (around 3 nm) are also observed on the TEM images (Figure 3-10b).
For the 4.24 wt% Cu/TiO2 sample (Figure 3-10c), the Cu particle size distribution is more
complex. Firstly, only few particles with size ~6 nm can be found, which is surprising for a
sample with such high Cu loading (~4.24 wt%). To deepen the analysis, dark field imaging
(HAADF) was performed to observe more easily the metallic Cu particles (white dots) in the
images (Figure 3-10d). Few large (~15 nm) and very small particles (<1 nm) were observed in
the sample. Moreover, EDS carried out on these two types of particles confirmed that the
large (Figure 3-10e) and the small particles (Figure 3-10f) are metallic Cu. The HAADF
results are therefore consistent with the XRD results obtained with the as-prepared samples
(Figure 3-5a) since both show that the 4.24wt% Cu/TiO2 sample contain large particles, Cuo
and CuO, respectively. To summarize, the sample with high Cu loading contains particles
smaller than 1 nm, particles around 4 nm and large particles around 15 nm, resulting in a wide
particle size distribution.

63
Figure 3-10: TEM bright field micrographs of Cu/TiO2 (20 h of DPu) after reduction at 350
°C with (a) 0.88; (b) 1.55; (c) 4.24 wt% Cu; (d), STEM-HAADF micrographs of 4.24 wt%
Cu/TiO2; (e) and (f), EDS analysis of two different zones of image (d), and the corresponding
particle size distributions: (g), (h), (i).

64
3.3 Selective hydrogenation of 1,3-butadiene
The evolution of the 1,3-butadiene conversion with temperature over the series of
Cu/TiO2 samples prepared for 20 h is presented in Figure 3-11a. One can see in Figure 3-11b
that butadiene is transformed only into butenes up to T100% (minimum temperature
corresponding to 100% butadiene conversion; note that this is an approximate temperature,
and that it is possible that the real one is at a temperature between it and the one of the former
measurement). A low amount of butane starts to be formed above these temperatures while
propene also starts hydrogenating with a very low conversion (<2%, Figure 3-11c).
Intuitively, one could have expected that the conversion curve and T100% will gradually shift
to lower temperature as the Cu loading increases (Figure 3-11a). Although the sample
containing the lowest Cu loading (0.88 wt%) is the least active and the one containing the
highest loading (4.24 wt%) is the most active, the evolution of T100% of the samples with
intermediate Cu loadings seems erratic. However, the calculation of the activity of the
catalysts at 60 °C expressed per mass unit of copper shows a decrease as the Cu loading
increases (Figure 3-12). This is consistent with the fact that the Cu particle size also increases
when the Cu loading increases.
Finally, an experiment was performed in isotherm at 105 °C to test the stability of
three Cu/TiO2 catalysts (0.88, 1.55 and 2.5 wt%), using the same mass of Cu (13.9 ±1 μmol)
in 100 mg of catalytic bed thanks to physical mixing of Cu/TiO2 and TiO2, to operate with the
same contact time. Figure 3-13 shows that the butadiene conversion of the 0.88 wt% Cu/TiO2
catalyst was 100% during the first 1 h of reaction, then decreased to around 10% in the
following 3 h with a rate of 19 ppm min-1
. For the 1.55 wt% Cu/TiO2 sample, butadiene
conversion was also 100% at the beginning of the reaction, but it quickly decreased to around
5% after 2.5 h with a rate of 28 ppm min-1
. Initial butadiene conversion of the 2.5 wt%
Cu/TiO2 sample was slightly lower than 100% and declined still more sharply to around 2%
during the first 1.5 h with a rate of 44 ppm min-1
.
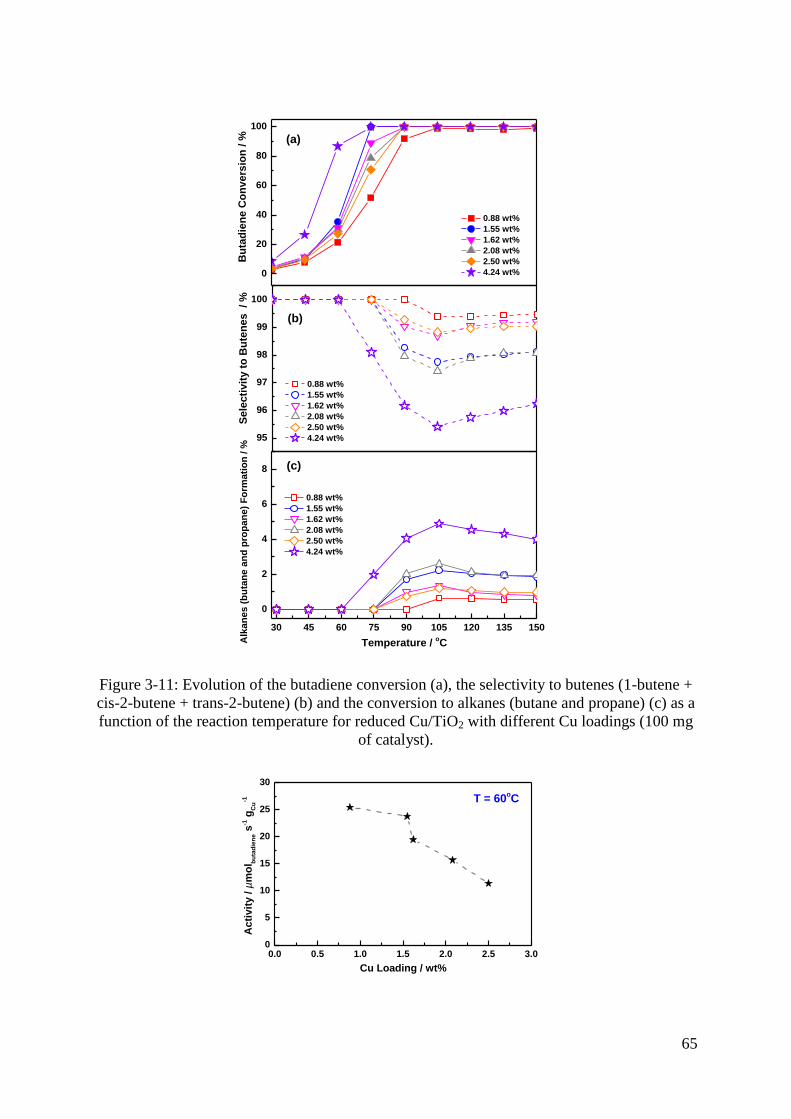
65
Figure 3-11: Evolution of the butadiene conversion (a), the selectivity to butenes (1-butene +
cis-2-butene + trans-2-butene) (b) and the conversion to alkanes (butane and propane) (c) as a
function of the reaction temperature for reduced Cu/TiO2 with different Cu loadings (100 mg
of catalyst).
0.0 0.5 1.0 1.5 2.0 2.5 3.00
5
10
15
20
25
30
T = 60oC
Ac
tivit
y / µ
mo
l bu
tad
ien
e s
-1 g
Cu
-1
Cu Loading / wt%
0
20
40
60
80
100
0.88 wt%
1.55 wt%
1.62 wt%
2.08 wt%
2.50 wt%
4.24 wt%
Bu
tad
ien
e C
on
vers
ion
/ % (a)
95
96
97
98
99
100
Se
lecti
vit
y t
o B
ute
ne
s
/ %
0.88 wt%
1.55 wt%
1.62 wt%
2.08 wt%
2.50 wt%
4.24 wt%
(b)
30 45 60 75 90 105 120 135 150
0
2
4
6
8
Alk
an
es
(b
uta
ne a
nd
pro
pan
e)
Fo
rmati
on
/ %
Temperature / oC
0.88 wt%
1.55 wt%
1.62 wt%
2.08 wt%
2.50 wt%
4.24 wt%
(c)
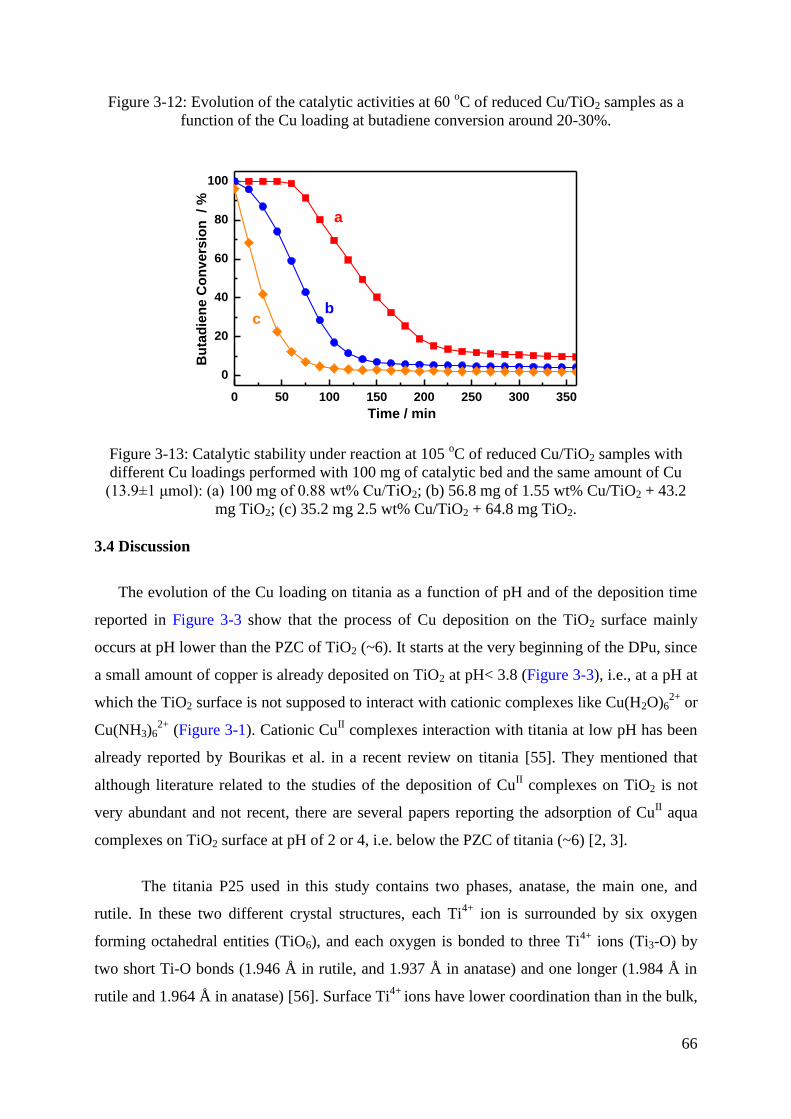
66
Figure 3-12: Evolution of the catalytic activities at 60 oC of reduced Cu/TiO2 samples as a
function of the Cu loading at butadiene conversion around 20-30%.
0 50 100 150 200 250 300 350
0
20
40
60
80
100
a
b
Bu
tad
ien
e C
on
vers
ion
/ %
Time / min
c
Figure 3-13: Catalytic stability under reaction at 105 oC of reduced Cu/TiO2 samples with
different Cu loadings performed with 100 mg of catalytic bed and the same amount of Cu
(13.9±1 μmol): (a) 100 mg of 0.88 wt% Cu/TiO2; (b) 56.8 mg of 1.55 wt% Cu/TiO2 + 43.2
mg TiO2; (c) 35.2 mg 2.5 wt% Cu/TiO2 + 64.8 mg TiO2.
3.4 Discussion
The evolution of the Cu loading on titania as a function of pH and of the deposition time
reported in Figure 3-3 show that the process of Cu deposition on the TiO2 surface mainly
occurs at pH lower than the PZC of TiO2 (~6). It starts at the very beginning of the DPu, since
a small amount of copper is already deposited on TiO2 at pH< 3.8 (Figure 3-3), i.e., at a pH at
which the TiO2 surface is not supposed to interact with cationic complexes like Cu(H2O)62+
or
Cu(NH3)62+
(Figure 3-1). Cationic CuII complexes interaction with titania at low pH has been
already reported by Bourikas et al. in a recent review on titania [55]. They mentioned that
although literature related to the studies of the deposition of CuII complexes on TiO2 is not
very abundant and not recent, there are several papers reporting the adsorption of CuII aqua
complexes on TiO2 surface at pH of 2 or 4, i.e. below the PZC of titania (~6) [2, 3].
The titania P25 used in this study contains two phases, anatase, the main one, and
rutile. In these two different crystal structures, each Ti4+
ion is surrounded by six oxygen
forming octahedral entities (TiO6), and each oxygen is bonded to three Ti4+
ions (Ti3-O) by
two short Ti-O bonds (1.946 Å in rutile, and 1.937 Å in anatase) and one longer (1.984 Å in
rutile and 1.964 Å in anatase) [56]. Surface Ti4+
ions have lower coordination than in the bulk,

67
and the surface of TiO2 possesses in principle three types of surface oxygens, namely singly
coordinated surface oxygen (TiO), doubly coordinated one (Ti2O) and triply coordinated one
(Ti3O). On the basis of different surface ionization models for these surface sites, Bourikas et
al [57] proposed a derived model of protonation reactions for TiO and Ti2O that they consider
more realistic than those in the former models:
logK1 = 7.8 Eq. 3-6
logK2 = 4.6 Eq. 3-7
Note that the oxygen of Ti3O is not protonated (logK3 = -3.96) [58] and that the TiO
sites are negatively charged (TiO-0.35
, Eq.3-6) even at pH lower than 3, based on experimental
results of Bourikas et al [57].
We can therefore propose that at the very beginning of the DPu preparation, i.e. at
pH<4 before precipitation starts (Figure 3-3), part of the Cu2+
complexes in solution can
interact electrostatically with the TiO-0.35
sites of TiO2 surface and then could form Ti-O-Cu
species according to [3]. The formation of inner sphere complexes is attested by the presence
of the band at 420 nm in the UV-visible spectra of the wet Cu/TiO2 samples (Figure 3-8b). At
the stage of the present study, it is not possible to discard another hypothesis as the one
proposed by Petala et al [46], which is a direct surface reaction between Cu2+
complexes and
surface OHs of titania that would also lead to the formation of inner sphere complexes. It is
interesting to mention that titania behaves differently from silica support. In a former study of
one of us [32], dealing with adsorption of [Cu(NH3)4(H2O)2]2+
complexes on silica, the
formation of Si-O-Cu bonding was observed only after the sample has been dried at RT and
not when it was still wet. In any case, one can propose that once CuII complexes have
interacted with the negatively charged sites of TiO2 or some surface OHs or when pH has
reached 4, the remaining of the Cu complexes in solution start precipitating on titania. The
nature of the Cu precipitate is probably the same as the one obtained in the absence of support
(Experiment B2 in Section 3.1.2), i.e. copper hydroxynitrate (Cu2(OH)3NO3) and not copper
hydroxide. In spite of the fact that the diffractogram of as-prepared Cu/TiO2 (Figure 3-5a)
does not show the corresponding diffraction peaks, this hypothesis is consistent with the fact
that the samples have the same green color in the presence or in the absence of TiO2, that their
UV-visible and IR spectra are similar (Figures 3-8 and 3-6) and that Cu2(OH)3NO3 has been
identified previously in Cu/SiO2 samples prepared by DPu [59]. Moreover, the pH ~4 of Cu

68
precipitation in the presence of TiO2, associated to the color change of the suspension is lower
than the pH of precipitation in solution (pH 5.2 in the absence of TiO2), and it corresponds to
the inflection point of the pH curves in Figure 3-4. This result is consistent with the principle
of the method of deposition-precipitation [33, 60-63], in particular, the precipitation of
Cu2(OH)3NO3 onto the titania support, also attested by the fact that the particles of the copper
hydroxynitrate precipitate are much larger than those formed in the presence of titania. One
can therefore propose that the Cu2+
species already adsorbed on TiO2 at low pH act as
nucleation sites for the growth of the precipitate onto the support rather than into solution,
lowering the pH of precipitation, i.e., lowering the pH of the supersolubility of
[Cu2(OH)3NO3]aq, and preventing its precipitation into solution.
As the pH of the solution increases during DPu at 80 oC, instead of reacting with the
dissolved support as for silica and forming copper silicate [59] since TiO2 is not known to
dissolve in the 3-8 pH range, Cu2(OH)3NO3 gradually transforms into CuO; this is
accompanied by a change of the suspension color from green to gray. The evolution of the
nature of the Cu compound on TiO2 is also attested by the different colors taken by the as-
prepared samples as a function of the Cu loading (Figure 3-2) and the DPu duration (Table 3-
2). The green color of the samples with less than 1.6 wt% Cu is due to the presence of stable
Cu2(OH)3NO3 and the more grayish color observed for the higher Cu loadings is related to the
additional presence of CuO. The formation of CuO is attested by XRD (Figure 3-5) and by
the presence of the broad band at 450-800 nm in the UV-Visible spectra (Figure 3-8a).
However, Cu2(OH)3NO3 is more stable on titania than in the absence of support since the
Cu/TiO2 suspension (<3 wt% Cu) remains green after 5 h of DPu whereas it turns blackish
without support (Table 3-1). The grayish color taken by the sample during DPu when more
Cu is deposited (4.24 wt% Cu) (Table 3-1) or when DPu duration increases (Figure 3-2 and
Table 3-2), which is due to the presence of large particles of CuO can be explained as follows.
It probably initially results from a phenomenon of Ostwald ripening of the Cu2(OH)3NO3
particles during DPu as the particle size of metallic Cu increase with DPu time (Figure 3-5b).
In addition, very small Cu° particles were also observed by TEM (Figure 3-10). These results
may therefore indicate that Ostwald ripening has occurred during sample preparation by DPu,
producing a bimodal size distribution. Moreover, as the Cu2(OH)3NO3 particles increases in
size, they become instable and transform into CuO that continue to grow. It is interesting to
note that at variance with the silica and alumina supports (see Introduction), no mixed
compound, i.e., no copper titanate formation was detected. Sanker et al [64] showed that in
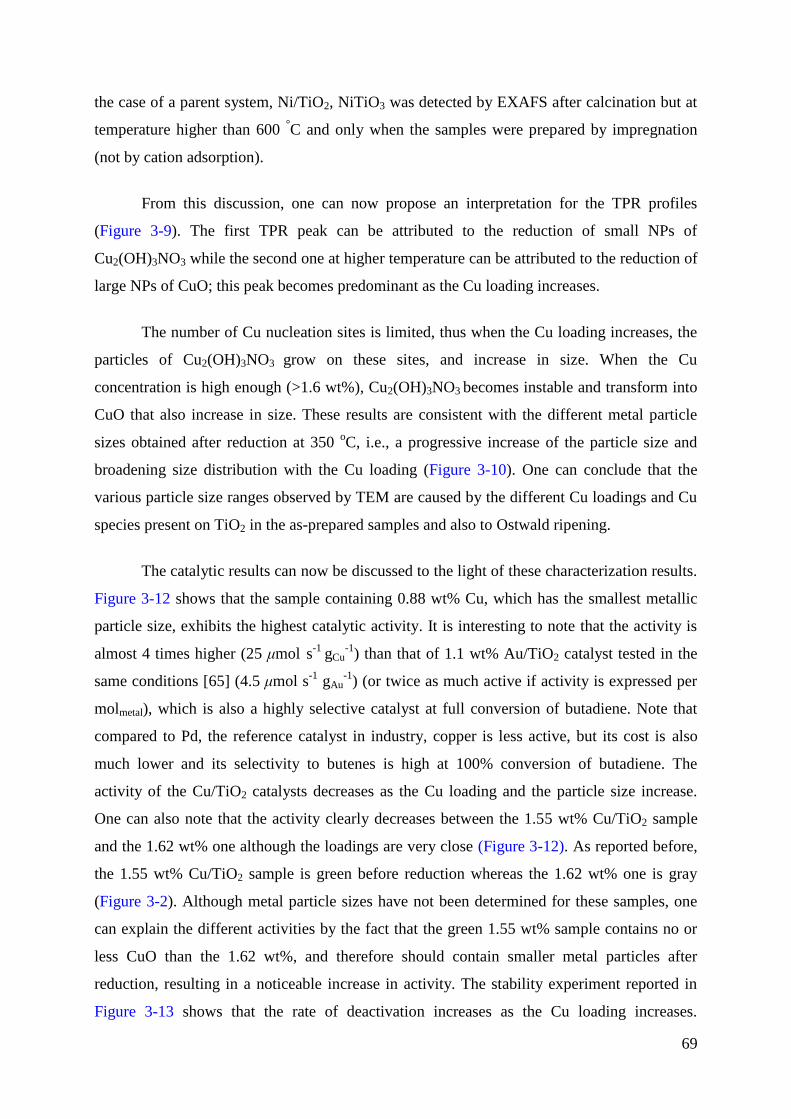
69
the case of a parent system, Ni/TiO2, NiTiO3 was detected by EXAFS after calcination but at
temperature higher than 600 °C and only when the samples were prepared by impregnation
(not by cation adsorption).
From this discussion, one can now propose an interpretation for the TPR profiles
(Figure 3-9). The first TPR peak can be attributed to the reduction of small NPs of
Cu2(OH)3NO3 while the second one at higher temperature can be attributed to the reduction of
large NPs of CuO; this peak becomes predominant as the Cu loading increases.
The number of Cu nucleation sites is limited, thus when the Cu loading increases, the
particles of Cu2(OH)3NO3 grow on these sites, and increase in size. When the Cu
concentration is high enough (>1.6 wt%), Cu2(OH)3NO3 becomes instable and transform into
CuO that also increase in size. These results are consistent with the different metal particle
sizes obtained after reduction at 350 oC, i.e., a progressive increase of the particle size and
broadening size distribution with the Cu loading (Figure 3-10). One can conclude that the
various particle size ranges observed by TEM are caused by the different Cu loadings and Cu
species present on TiO2 in the as-prepared samples and also to Ostwald ripening.
The catalytic results can now be discussed to the light of these characterization results.
Figure 3-12 shows that the sample containing 0.88 wt% Cu, which has the smallest metallic
particle size, exhibits the highest catalytic activity. It is interesting to note that the activity is
almost 4 times higher (25 μmol s-1
gCu-1
) than that of 1.1 wt% Au/TiO2 catalyst tested in the
same conditions [65] (4.5 μmol s-1
gAu-1
) (or twice as much active if activity is expressed per
molmetal), which is also a highly selective catalyst at full conversion of butadiene. Note that
compared to Pd, the reference catalyst in industry, copper is less active, but its cost is also
much lower and its selectivity to butenes is high at 100% conversion of butadiene. The
activity of the Cu/TiO2 catalysts decreases as the Cu loading and the particle size increase.
One can also note that the activity clearly decreases between the 1.55 wt% Cu/TiO2 sample
and the 1.62 wt% one although the loadings are very close (Figure 3-12). As reported before,
the 1.55 wt% Cu/TiO2 sample is green before reduction whereas the 1.62 wt% one is gray
(Figure 3-2). Although metal particle sizes have not been determined for these samples, one
can explain the different activities by the fact that the green 1.55 wt% sample contains no or
less CuO than the 1.62 wt%, and therefore should contain smaller metal particles after
reduction, resulting in a noticeable increase in activity. The stability experiment reported in
Figure 3-13 shows that the rate of deactivation increases as the Cu loading increases.
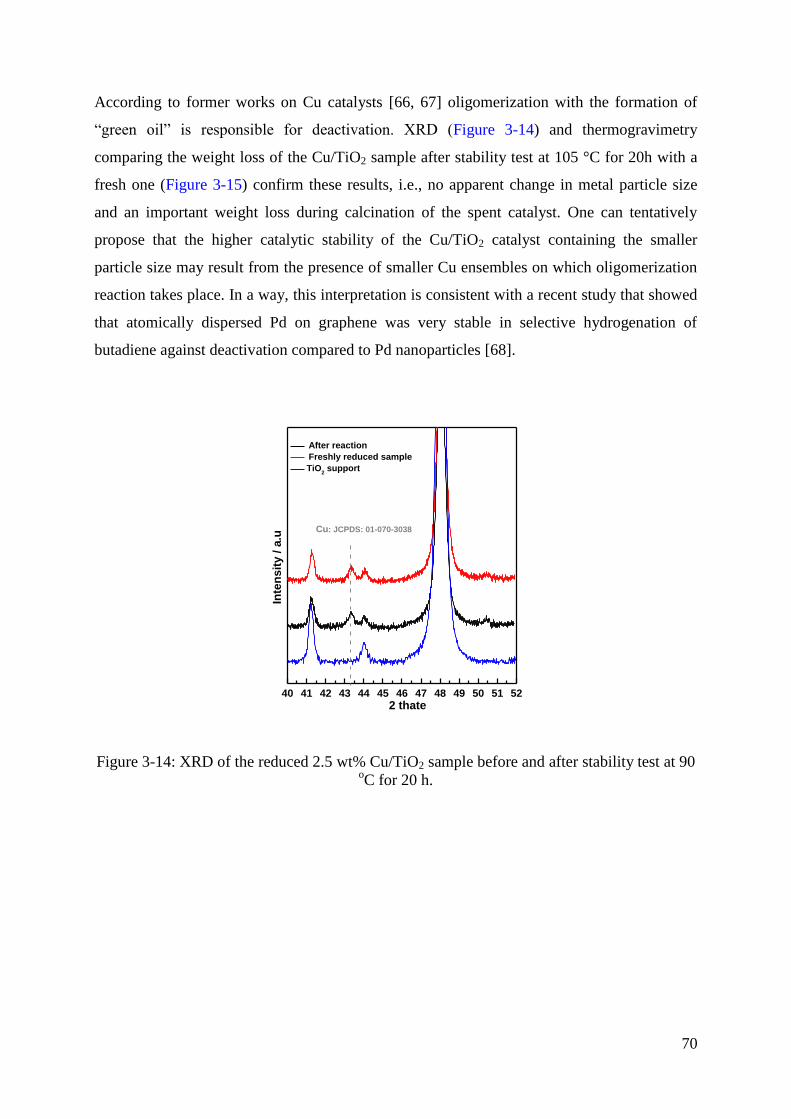
70
According to former works on Cu catalysts [66, 67] oligomerization with the formation of
“green oil” is responsible for deactivation. XRD (Figure 3-14) and thermogravimetry
comparing the weight loss of the Cu/TiO2 sample after stability test at 105 °C for 20h with a
fresh one (Figure 3-15) confirm these results, i.e., no apparent change in metal particle size
and an important weight loss during calcination of the spent catalyst. One can tentatively
propose that the higher catalytic stability of the Cu/TiO2 catalyst containing the smaller
particle size may result from the presence of smaller Cu ensembles on which oligomerization
reaction takes place. In a way, this interpretation is consistent with a recent study that showed
that atomically dispersed Pd on graphene was very stable in selective hydrogenation of
butadiene against deactivation compared to Pd nanoparticles [68].
40 41 42 43 44 45 46 47 48 49 50 51 52
Inte
nsit
y /
a.u
2 thate
After reaction
Freshly reduced sample
TiO2 support
Cu: JCPDS: 01-070-3038
Figure 3-14: XRD of the reduced 2.5 wt% Cu/TiO2 sample before and after stability test at 90 oC for 20 h.
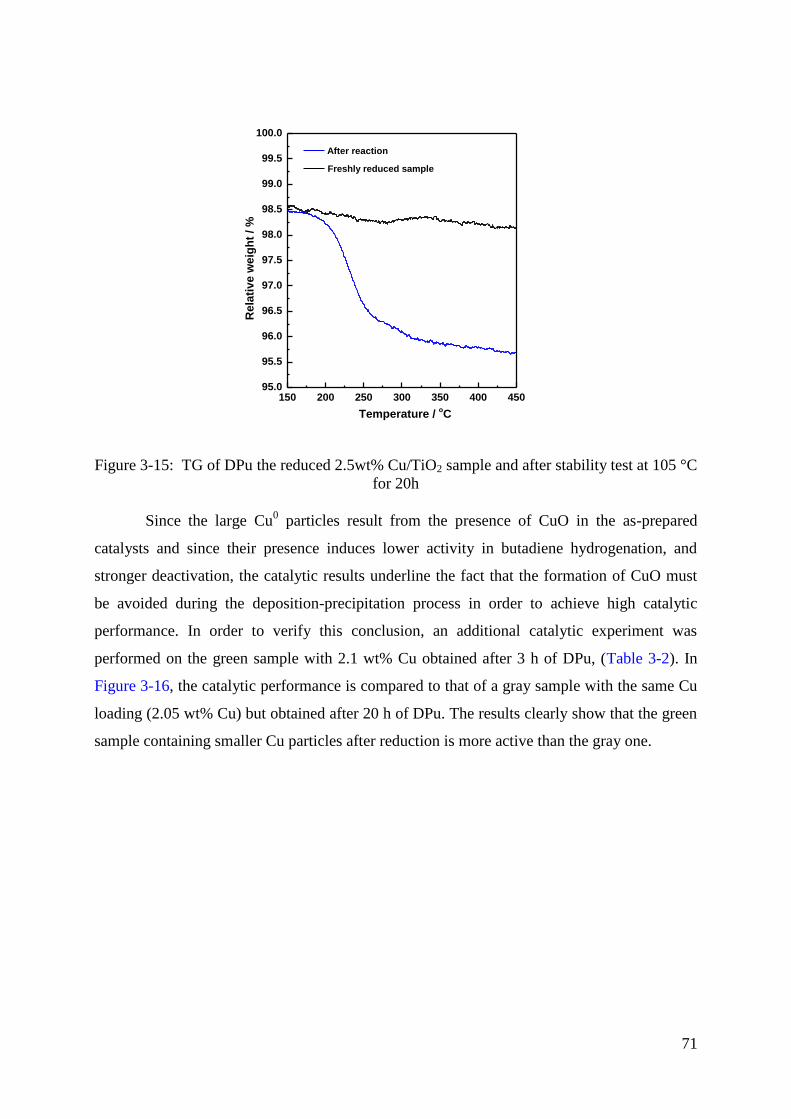
71
150 200 250 300 350 400 45095.0
95.5
96.0
96.5
97.0
97.5
98.0
98.5
99.0
99.5
100.0
Freshly reduced sample
Rela
tive w
eig
ht
/ %
Temperature / oC
After reaction
Figure 3-15: TG of DPu the reduced 2.5wt% Cu/TiO2 sample and after stability test at 105 °C
for 20h
Since the large Cu0 particles result from the presence of CuO in the as-prepared
catalysts and since their presence induces lower activity in butadiene hydrogenation, and
stronger deactivation, the catalytic results underline the fact that the formation of CuO must
be avoided during the deposition-precipitation process in order to achieve high catalytic
performance. In order to verify this conclusion, an additional catalytic experiment was
performed on the green sample with 2.1 wt% Cu obtained after 3 h of DPu, (Table 3-2). In
Figure 3-16, the catalytic performance is compared to that of a gray sample with the same Cu
loading (2.05 wt% Cu) but obtained after 20 h of DPu. The results clearly show that the green
sample containing smaller Cu particles after reduction is more active than the gray one.

72
30 45 60 75 90 105 120 135 150
0
20
40
60
80
100
Bu
tad
ien
e C
on
ve
rsio
n / %
Temperature / oC
2.10 wt% (DPu 3h green color)
2.05 wt% (DPu 20h gray color)
Figure 3-16: Comparison of the evolution of the butadiene conversion between two Cu/TiO2
samples containing the same Cu loading (2 wt% Cu) but prepared for different durations, 3 h
leading to a green sample after DPu and 20 h leading to a gray sample.
3.5 Conclusions
In this contribution, the preparation of Cu/TiO2 samples (up to 5 wt% Cu) by the
method of deposition-precipitation with urea was explored as a function of the Cu loading,
DPu time and pH. We observed that the Cu2+
complexes in solution start to adsorb on TiO2 at
pH lower than PZC of TiO2 (< 6) probably because of the presence of some negatively
charged Ti – O sites, forming Ti-O-Cu bridges, then most of Cu2+
ions are deposited as
Cu2(OH)3NO3 on TiO2 surface in the first 2 h of the DPu process. The characterization study
led us to propose that the adsorbed Cu2+
species act as nucleation sites for the growth of
particles of Cu2(OH)3NO3 (green samples). As DPu duration proceeds or Cu loading
increases, these particles increase in size through a mechanism of Ostwald ripening, then the
large Cu2(OH)3NO3 transforms into CuO (gray samples) depending on the DPu duration and
the final Cu loading, e.g. 2 h for 4.2 wt% Cu/TiO2 and more than 5 h for 1.6 wt% Cu/TiO2.
The presence of CuO in the as-prepared sample has a great effect on the particle size of
metallic Cu after reduction at 350 oC: small particles (<3-5 nm) were obtained in the green
samples, which mainly contained Cu2(OH)3NO3, whereas large ones (>10 nm) were also
present in the gray samples initially containing CuO. Moreover, the study of the Cu/TiO2
catalytic performance in selective hydrogenation of butadiene in excess of propene revealed
that the supported Cu catalysts are able to fully convert butadiene with almost 100%
selectivity to butenes at rather mild temperature, and that the catalytic activity and stability are
clearly enhanced by decreasing the Cu particle size. It can be concluded that DPu is an

73
efficient preparation method to produce active Cu catalysts in hydrogenation reaction
provided that the formation of CuO is avoided.
4. Monometallic Zn/TiO2 Catalysts
4.1 Zn loading at different final pHs
During the preparation of 2.5 wt% Zn/TiO2 sample by DPu, the deposition-
precipitation behavior of Zn2+
was studied by monitoring the evolution of the Zn loading
deposited on TiO2 as a function of the DPu time and pH (Figure 3-17). It can be seen that as
for Cu on titania (Figure 3-3), around 25% of Zn was deposited on TiO2 surface at pH ~4.5
and that the Zn loading gradually increased with increasing pH or reaction time, with most of
Zn2+
finally deposited at pH ≤7.0, and a quick increase from 60% to 90% at pH between 5.5
and 6.5. By analogy with Figure 2-3 in Chapter 2 and above in Section 3 with the preparation
of Cu/TiO2 sample by DPu, the deposition of metal complexes mainly happens when the
concentration of hydrolysed metal ions reaches the area between its supersolubility (SS) and
the supersolubility with support existed in solution (SSsupport) during pH increase. Thus, the
sharp increase of Zn loading might correspond to the occurrence of this phenomenon. By
comparison with Cu2+
(Figure 3-3), Zn2+
deposition occurs at higher pH that is in agreement
with the theoretical prediction (Figure 2-4) in Chapter 2, that showed that the solubility of
Zn(OH)2 (4.1×10⁻¹⁷
mol L-1
) was higher than that of Cu(OH)2 (2.0×10⁻¹⁹
mol L-1
) at room
temperature [69]. As in the case of the deposition of Cu2+
, a large amount of Zn2+
is deposited
on TiO2 surface at pH lower than the PZC of TiO2 (~6), as discussed above for Cu/TiO2
samples.

74
4.5 5.0 5.5 6.0 6.5 7.00
20
40
60
80
100201.61.11.00.8
DPu time / h
Meta
l lo
ad
ing
perc
en
tag
e /
%
pH
2.5wt% Zn/TiO2
0.5
Figure 3-17: Zn loading as a function of pH during DPu preparation
4.2 pH evolution of the Zn2+
/TiO2 mixture solution during DPu
Considering that the pH (OH- concentration) of the preparation mixture is directly
related to the hydrolysis and deposition-precipitation of Zn2+
, the pH evolution during the
DPu 2.5 wt% Zn/TiO2 preparation was monitored (Figure 3-18). In Figure 3-18, the pH
increased fast in the first 30 min of preparation, i.e., from the initial pH 2 to pH 4.5, because
the OH- ions formed by the urea decomposition neutralized fast the excess of H
+ in the
preparation mixture solution. After that, the pH increase slowed down, and it indicates that
the consumption of OH- ions becomes fast. Since the TiO2 surface is stable in solution (no
dissolution), the slower increase of pH could be attributed to the OH- consumed by the
deposition of Zn2+
on the TiO2 surface as it was observed for Cu/TiO2 preparation (Figure 3-
4) in the above section. With extending DPu time, a pH plateau at ~6 was even observed
(Figure 3-17), combined to the result of the evolution of the Zn loading versus the pH of
preparation solution, it can be proposed that the pH plateaus corresponds to the fast deposition
of the Zn2+
on the TiO2 surface.
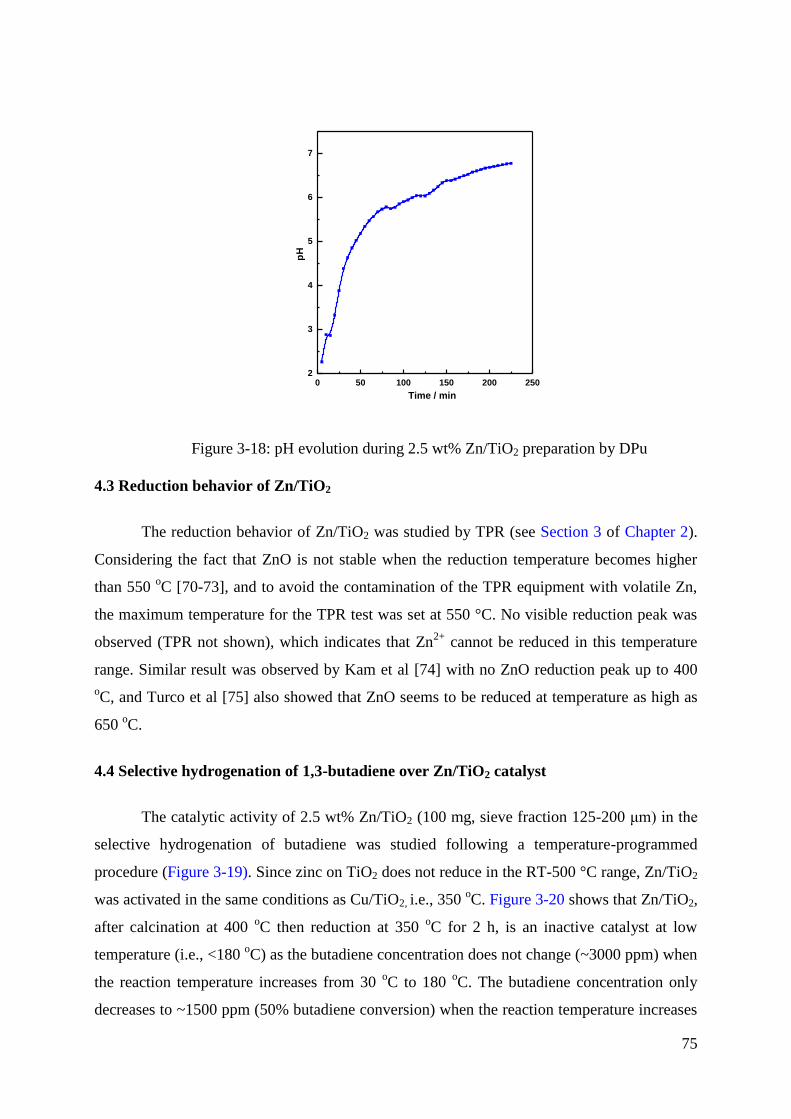
75
0 50 100 150 200 2502
3
4
5
6
7
pH
Time / min
Figure 3-18: pH evolution during 2.5 wt% Zn/TiO2 preparation by DPu
4.3 Reduction behavior of Zn/TiO2
The reduction behavior of Zn/TiO2 was studied by TPR (see Section 3 of Chapter 2).
Considering the fact that ZnO is not stable when the reduction temperature becomes higher
than 550 oC [70-73], and to avoid the contamination of the TPR equipment with volatile Zn,
the maximum temperature for the TPR test was set at 550 °C. No visible reduction peak was
observed (TPR not shown), which indicates that Zn2+
cannot be reduced in this temperature
range. Similar result was observed by Kam et al [74] with no ZnO reduction peak up to 400
oC, and Turco et al [75] also showed that ZnO seems to be reduced at temperature as high as
650 oC.
4.4 Selective hydrogenation of 1,3-butadiene over Zn/TiO2 catalyst
The catalytic activity of 2.5 wt% Zn/TiO2 (100 mg, sieve fraction 125-200 μm) in the
selective hydrogenation of butadiene was studied following a temperature-programmed
procedure (Figure 3-19). Since zinc on TiO2 does not reduce in the RT-500 °C range, Zn/TiO2
was activated in the same conditions as Cu/TiO2, i.e., 350 oC. Figure 3-20 shows that Zn/TiO2,
after calcination at 400 oC then reduction at 350
oC for 2 h, is an inactive catalyst at low
temperature (i.e., <180 oC) as the butadiene concentration does not change (~3000 ppm) when
the reaction temperature increases from 30 oC to 180
oC. The butadiene concentration only
decreases to ~1500 ppm (50% butadiene conversion) when the reaction temperature increases

76
to 300 oC, meanwhile, there is no butane formed (100% selectivity to butenes) and the
conversion of propene to propane is lower than 0.5% (~1500 ppm propane formation).
Compared with the 2.5 wt% Cu/TiO2 catalyst (Figure 3-11), which shows a much higher
activity with T100% at around 75 oC and a high selectivity to butenes after activation at 350
oC,
it will be interesting to investigate how the addition of Zn with the preparation of the
bimetallic catalyst will modify the catalytic properties of copper (see Chapter 4).
30 60 90 120 150 180 210 240 270 300
0
500
1000
1500
2000
2500
3000
Butadiene
1-Butene
Trans-2-Butene
Cis-2-Butene
Propane
Temperature / oC
Co
ncen
trati
on
/ p
pm
0
500
1000
1500
2000
2500
3000
Pro
pan
e / p
pm
Figure 3-19: Catalytic performances of 2.5 wt% Zn/TiO2 after calcination at 400 oC
then reduction at 350 oC for 2 h
5. Monometallic Ni-based catalysts
Now, we examine the case of supported monometallic nickel catalysts. The possible
formation of Ni-Zn alloy was investigated first with a Ni/ZnO sample, which was reduced in a
similar way as a former study performed by Derrouiche et al [1], which revealed the
formation of Cu-Zn alloy (Cu3Zn1 alloy) in Cu/ZnO. As a result, monometallic Ni catalysts
supported on TiO2 and on ZnO are explored in this section. Special attention was paid to
select suitable Ni loadings for the study of the catalytic performances and for optimizing the
conditions of detection of NiZn alloy in Ni/ZnO sample after reduction at different
temperatures. Thus, samples were prepared by DPu with different Ni loadings (5, 2.5, and 0.5
wt%) on TiO2 and ZnO.
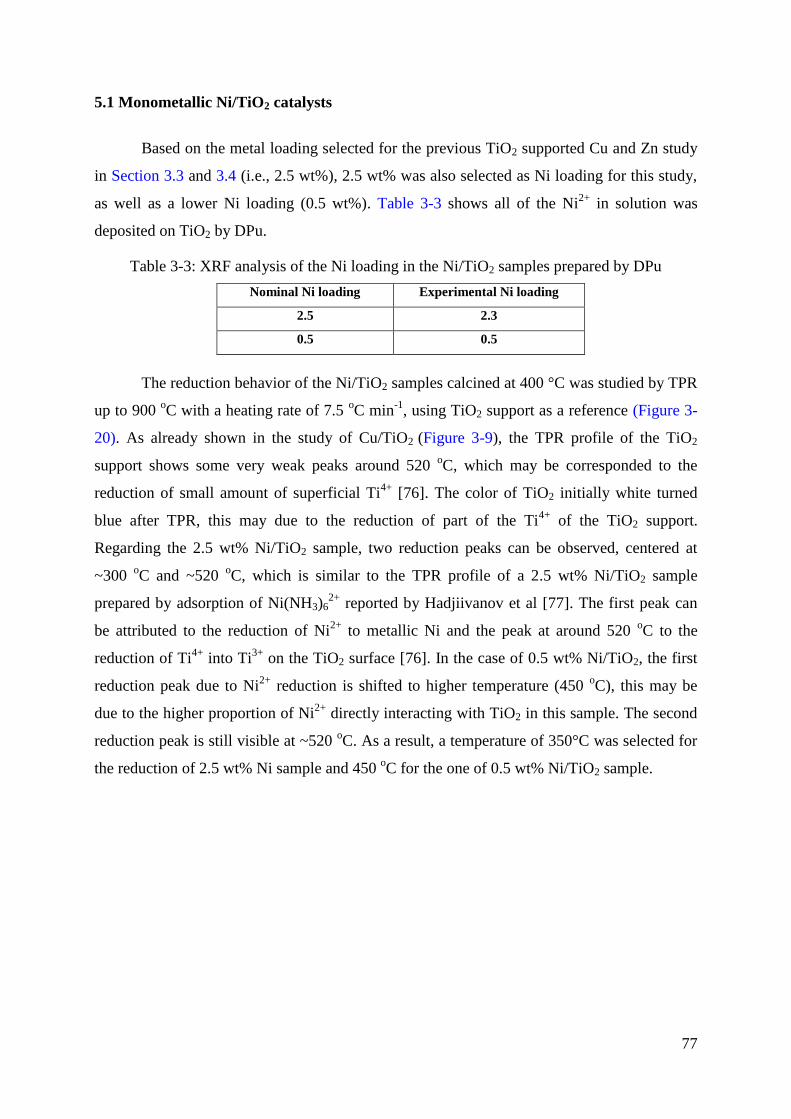
77
5.1 Monometallic Ni/TiO2 catalysts
Based on the metal loading selected for the previous TiO2 supported Cu and Zn study
in Section 3.3 and 3.4 (i.e., 2.5 wt%), 2.5 wt% was also selected as Ni loading for this study,
as well as a lower Ni loading (0.5 wt%). Table 3-3 shows all of the Ni2+
in solution was
deposited on TiO2 by DPu.
Table 3-3: XRF analysis of the Ni loading in the Ni/TiO2 samples prepared by DPu
Nominal Ni loading Experimental Ni loading
2.5 2.3
0.5 0.5
The reduction behavior of the Ni/TiO2 samples calcined at 400 °C was studied by TPR
up to 900 oC with a heating rate of 7.5
oC min
-1, using TiO2 support as a reference (Figure 3-
20). As already shown in the study of Cu/TiO2 (Figure 3-9), the TPR profile of the TiO2
support shows some very weak peaks around 520 oC, which may be corresponded to the
reduction of small amount of superficial Ti4+
[76]. The color of TiO2 initially white turned
blue after TPR, this may due to the reduction of part of the Ti4+
of the TiO2 support.
Regarding the 2.5 wt% Ni/TiO2 sample, two reduction peaks can be observed, centered at
~300 oC and ~520
oC, which is similar to the TPR profile of a 2.5 wt% Ni/TiO2 sample
prepared by adsorption of Ni(NH3)62+
reported by Hadjiivanov et al [77]. The first peak can
be attributed to the reduction of Ni2+
to metallic Ni and the peak at around 520 oC to the
reduction of Ti4+
into Ti3+
on the TiO2 surface [76]. In the case of 0.5 wt% Ni/TiO2, the first
reduction peak due to Ni2+
reduction is shifted to higher temperature (450 oC), this may be
due to the higher proportion of Ni2+
directly interacting with TiO2 in this sample. The second
reduction peak is still visible at ~520 oC. As a result, a temperature of 350°C was selected for
the reduction of 2.5 wt% Ni sample and 450 oC for the one of 0.5 wt% Ni/TiO2 sample.
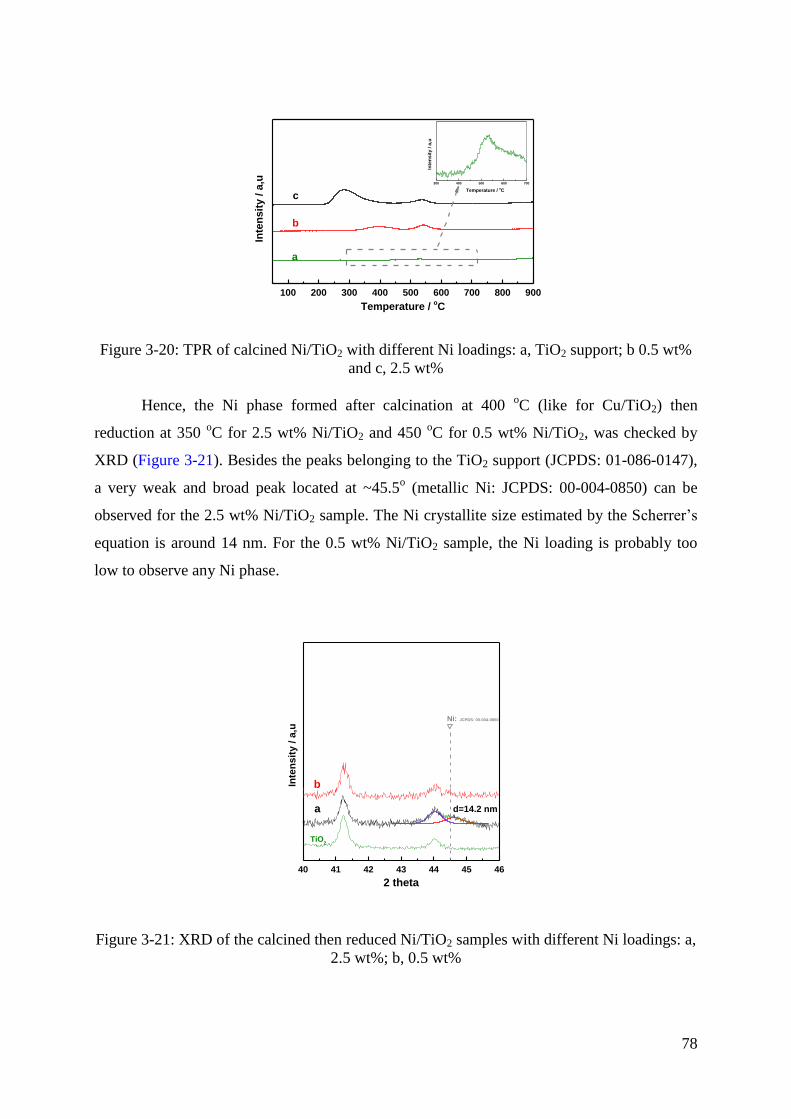
78
100 200 300 400 500 600 700 800 900
300 400 500 600 700
Inte
ns
ity / a
,u
Temperature / oC
Inte
nsit
y /
a,u
Temperature / oC
c
b
a
Figure 3-20: TPR of calcined Ni/TiO2 with different Ni loadings: a, TiO2 support; b 0.5 wt%
and c, 2.5 wt%
Hence, the Ni phase formed after calcination at 400 oC (like for Cu/TiO2) then
reduction at 350 oC for 2.5 wt% Ni/TiO2 and 450
oC for 0.5 wt% Ni/TiO2, was checked by
XRD (Figure 3-21). Besides the peaks belonging to the TiO2 support (JCPDS: 01-086-0147),
a very weak and broad peak located at ~45.5o (metallic Ni: JCPDS: 00-004-0850) can be
observed for the 2.5 wt% Ni/TiO2 sample. The Ni crystallite size estimated by the Scherrer’s
equation is around 14 nm. For the 0.5 wt% Ni/TiO2 sample, the Ni loading is probably too
low to observe any Ni phase.
40 41 42 43 44 45 46
b
d=14.2 nm
Inte
nsit
y /
a,u
2 theta
TiO2
Ni: JCPDS: 00-004-0850
a
Figure 3-21: XRD of the calcined then reduced Ni/TiO2 samples with different Ni loadings: a,
2.5 wt%; b, 0.5 wt%

79
5.1.1 Catalytic performance of 2.5 wt% Ni/TiO2 sample
The catalytic performance of 2.5 wt% Ni/TiO2 (sieve fraction 125-200 μm) was
evaluated in butadiene/ H2/ propene mixture at room temperature after sample calcination at
400 oC and reduction at 350
oC for 2 h (C400R350). Firstly, a mixture of 50 mg of catalyst
and 50 mg of TiO2 support (sieve fraction 125-200 μm) was tested at room temperature
(Figure 3-22a). As soon as the reactant gas mixture flowed in at RT, the temperature of the
reactor increased rapidly from 23 oC to ~ 100
oC as a result of the strong exothermicity of the
butadiene/propene hydrogenation reaction, and indicating that the 2.5 wt% Ni/TiO2 is very
active even at room temperature. Note that this phenomenon was not observed with the 2.5
wt% Cu/TiO2 catalyst. The catalytic data (Figure 3-22a) show that butadiene has been fully
converted to butenes and butane, with butane as the main hydrogenation product. Moreover,
28% of the propene was also hydrogenated to propane. This result indicates that the amount
of Ni in the catalytic bed must be reduced.
0.0 0.2 0.4 0.6 0.8 1.0
0
500
1000
1500
2000
2500
3000
Butadiene
1-Butene
Trans-2-Butene
Cis-2-Butene
Butane
Propane
Time / h
Co
ncen
trati
on
/ p
pm
0
15000
30000
45000
60000
75000
90000
Pro
pan
e / p
pm
50mg 2.5wt% Ni/TiO2 +50mg TiO
2 C400R350
Room Temperature
0.0 0.2 0.4 0.6 0.8 1.0 1.2 1.4
0
500
1000
1500
2000
2500
3000
Time / h
Co
ncen
trati
on
/ p
pm
0
15000
30000
45000
60000
75000
90000
Room Temperature
5mg 2.5wt% Ni/TiO2 +95mg TiO
2 C400R350
Pro
pan
e / p
pm
Figure 3-22: Catalytic performance of 2.5 wt% Ni/TiO2 - TiO2 mixtures at RT: a, 50 mg
catalyst in 50 mg TiO2; b, 5 mg catalyst in 95 mg TiO2
The second catalytic test was performed with 100 mg of a mixture containing 5 mg of
2.5 wt% Ni/TiO2 and 95 mg of TiO2 (Figure 3-22b). As for the first test, the temperature
increased quickly from 26 oC to ~90
oC when the gas mixture was introduced into the reactor
at room temperature, and similar catalytic results were obtained.

80
5.1.2 Catalytic performance of 0.5wt% Ni/TiO2 sample
The nickel loading was therefore reduced to 0.5 wt%, and the catalytic performances
were first tested at RT with a mixture of 10 mg of 0.5 wt% Ni/TiO2 diluted with 90 mg of
TiO2 after calcination at 400 oC and activation at 450
oC for 2 h. The temperature of the
reactor only slightly increased from 25 to around 30 oC when the gas reactants were
introduced. Figure 3-23a shows that at this temperature, the sample showed high activity with
an initial butadiene conversion close to 100% (butadiene concentration ~100 ppm) and a
rather low selectivity to butenes (~80%). However, in the first 6 h of reaction, the butadiene
conversion dropped down to ~33% (butadiene concentration ~2000 ppm), then it stabilized to
reach a conversion of ~26% (butadiene concentration ~2200 ppm) after 9 other hours of
reaction. After 15 h of reaction at room temperature, the temperature of the reactor was
increased from room temperature to 115 oC with a rate of 1
oC min
-1. Figure 3-23b shows that
the butadiene concentration decreased as temperature increased and a full butadiene
conversion (T100%) was achieved around 60 oC. At temperature lower than T100% (Figure 3-
24), butadiene was hydrogenated to butenes (~90%) with small amount of alkane formed
(~10%) indicating that Ni catalysts are able to provide rather good selectivity to alkenes.
Figure 3-23: catalytic performance of the mixture of 10 mg 0.5 wt% Ni/TiO2 and 90 mg TiO2

81
30 45 60 75 90 105
0
20
40
60
80
100
Alkane formation
Butenes selectivity
Temperature / oC
Perc
en
tag
e / %
Butadiene conversion
0.0
20.0k
40.0k
60.0k
80.0k
100.0k
Alk
an
e f
orm
ati
on
/ p
pm
Figure 3-24: Butadiene conversion, butenes selectivity and alkanes formation as a function of
temperature for the mixture of 10 mg 0.5 wt% Ni/TiO2 and 90 mg TiO2 (extracted from
Figure3-23b)
Based on these preliminary results, it can be concluded that monometallic Ni/TiO2 is
very active in hydrogenation of butadiene at low temperature, but it deactivates fast. Once it is
partially deactivated, it can provide rather good selectivity to alkenes. The catalyst with 0.5
wt% Ni loading will be more suitable for the evaluation of the catalytic performances of
bimetallic Ni-Zn/TiO2 samples than the one with 2.5 wt% loading. Nevertheless, a Ni-
Zn/TiO2 catalyst containing a higher Ni loading could be used for easier characterization
during sample preparation.
5.2 Monometallic Ni/ZnO catalysts
The exploration of the possible formation of Ni-Zn alloy after Ni/ZnO sample
reduction was examined with a sample containing ~5 wt % Ni, prepared by DPu, as in the
previous study on Cu/ZnO by Derrouiche et al [1]. A 0.5 wt % Ni/ZnO sample was also
prepared by DPu, and its catalytic performances (activity, selectivity and stability) were
evaluated after reduction at different temperatures.
The metal loadings in these two as-prepared Ni/ZnO samples were measured by XRF
(see Section 3 in Chapter 2) (Table 3-4). As in the case of Ni/TiO2, most of Ni2+
has been
deposited on the ZnO surface after 20 h of DPu .

82
Table 3-4: Ni loadings measured by XRF in the as-prepared Ni/ZnO samples
Normal Ni loading Experimental Ni loading
5.0 4.8
0.5 0.5
The reduction behavior of Ni2+
in the as-prepared and calcined 5 wt % Ni/ZnO
samples were studied by temperature programmed reduction with a heating rate of 7.5 oC min
-
1 (see Section 3 in Chapter 2). In Figure 3-25, a broad peak centered at ~350
oC can be
observed in the temperature range of 50 to 500 oC for the as-prepared sample, which is
attributed to the reduction of Ni2+
. It becomes weaker and broader with a maximum at 450 oC
after sample calcination at 400 oC for 2 h.
50 100 150 200 250 300 350 400 450 500
C400 sample
TC
D (
a.u
.)
Temperature (oC)
As-prepared sample
Figure 3-25: TPR of 5 wt% Ni/ZnO: reduction of the calcined and as-prepared samples;
Three reduction temperatures (i.e., 280, 350 and 450 oC, corresponding to different
stage of sample reduction) were first selected to analyze the extent of Ni reduction after a
heating rate similar to that used for catalyst activation (i.e., 2 oC min
-1, see Section 4, Chapter
2), and a temperature plateau of 2 h (Figure 3-26). Since the area of the reduction peak is
proportional to the amount of H2 consumed for Ni2+
reduction, Figure 3-26 shows that ~90%
Ni2+
was reduced after reduction at 280 oC for 2 h and that the rest of Ni
2+ was fully reduced
at around 300 oC. Indeed, additional H2 treatments at 350 and 450
oC did not show substantial
H2 consumption.
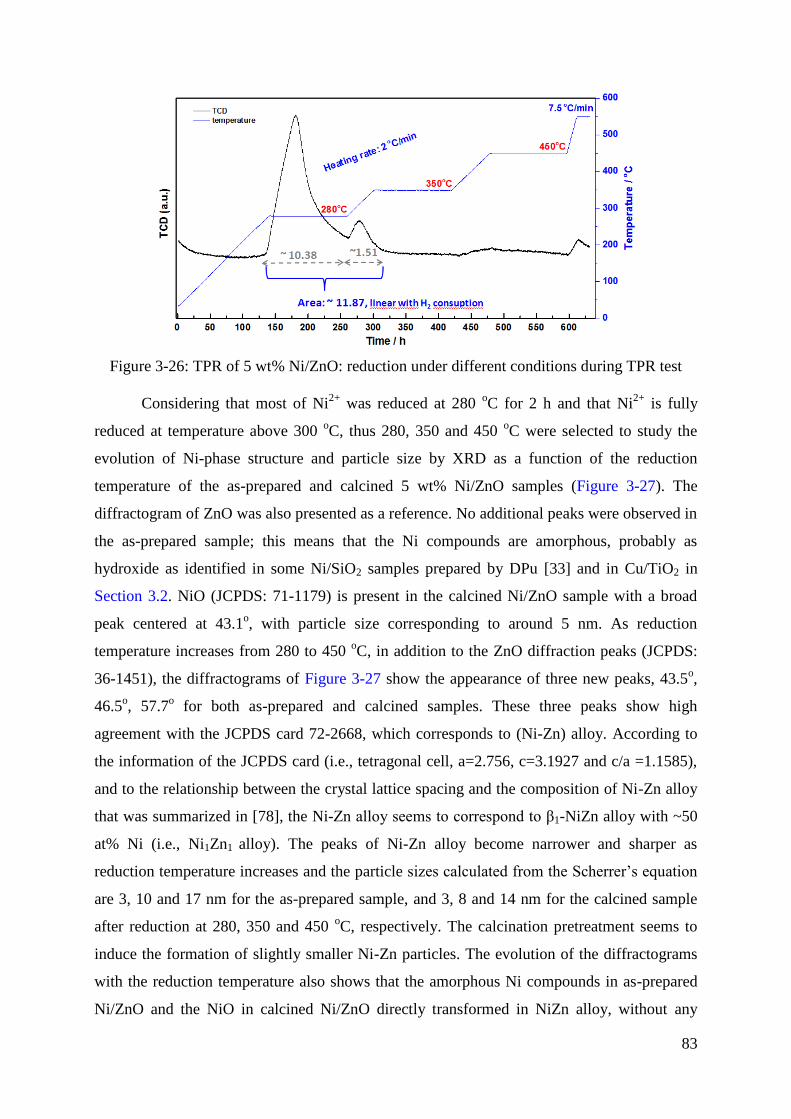
83
Figure 3-26: TPR of 5 wt% Ni/ZnO: reduction under different conditions during TPR test
Considering that most of Ni2+
was reduced at 280 oC for 2 h and that Ni
2+ is fully
reduced at temperature above 300 oC, thus 280, 350 and 450
oC were selected to study the
evolution of Ni-phase structure and particle size by XRD as a function of the reduction
temperature of the as-prepared and calcined 5 wt% Ni/ZnO samples (Figure 3-27). The
diffractogram of ZnO was also presented as a reference. No additional peaks were observed in
the as-prepared sample; this means that the Ni compounds are amorphous, probably as
hydroxide as identified in some Ni/SiO2 samples prepared by DPu [33] and in Cu/TiO2 in
Section 3.2. NiO (JCPDS: 71-1179) is present in the calcined Ni/ZnO sample with a broad
peak centered at 43.1o, with particle size corresponding to around 5 nm. As reduction
temperature increases from 280 to 450 oC, in addition to the ZnO diffraction peaks (JCPDS:
36-1451), the diffractograms of Figure 3-27 show the appearance of three new peaks, 43.5o,
46.5o, 57.7
o for both as-prepared and calcined samples. These three peaks show high
agreement with the JCPDS card 72-2668, which corresponds to (Ni-Zn) alloy. According to
the information of the JCPDS card (i.e., tetragonal cell, a=2.756, c=3.1927 and c/a =1.1585),
and to the relationship between the crystal lattice spacing and the composition of Ni-Zn alloy
that was summarized in [78], the Ni-Zn alloy seems to correspond to β1-NiZn alloy with ~50
at% Ni (i.e., Ni1Zn1 alloy). The peaks of Ni-Zn alloy become narrower and sharper as
reduction temperature increases and the particle sizes calculated from the Scherrer’s equation
are 3, 10 and 17 nm for the as-prepared sample, and 3, 8 and 14 nm for the calcined sample
after reduction at 280, 350 and 450 oC, respectively. The calcination pretreatment seems to
induce the formation of slightly smaller Ni-Zn particles. The evolution of the diffractograms
with the reduction temperature also shows that the amorphous Ni compounds in as-prepared
Ni/ZnO and the NiO in calcined Ni/ZnO directly transformed in NiZn alloy, without any

84
intermediate formation of metallic Ni. Similar results were found by Spanjers et al [79] who
studied the phase composition of 2 wt% Ni/ZnO, prepared by impregnation, by X-ray
absorption near-edge spectroscopy (XANES) during in situ temperature-programmed
reduction with a heating rate of 1.3 oC min
-1. They observed that the proportion of Zn in the
Ni-Zn nanoparticles increased with increasing reduction temperature: α-NiZn alloy (Ni4Zn1)
formed at temperature between 400 and 500 oC, while it transformed to β1-NiZn alloy
(Ni1Zn1) when temperature was higher than 500 oC. Our results are slightly different since in
Figure 3-27, no α-NiZn alloy (Ni4Zn1) is observed. It seems that β1-NiZn alloy (Ni1Zn1) phase
directly formed, no matter the reduction temperature, and the reduction temperature seems to
have no effect on the alloy composition. It is interesting to note that even though the TPR of
Zn/TiO2 sample did not exhibit any reduction peaks below 550 oC (Figure 3-19), the
formation of Ni-Zn alloy indicates that the presence of Ni promote the reduction of some Zn2+
at temperature as low as 280 oC.
Figure 3-27: XRD of as-prepared (a) and calcined (b) 5 wt% Ni/ZnO sample after reduction at
280 oC, 350
oC and 450
oC for 2 h
The evolution of the nickel phase in the Ni/ZnO with 0.5 wt % Ni loading was also
analyzed by XRD after calcination at 400 oC then reduction at 280, 300, 325, 350 and 450
oC
(Figure 3-28). The results are very different from those obtained with Ni/TiO2 (Figure 3-21).
Even though the Ni loading is low (i.e., 0.5 wt %), NiO (2θ ~43.0o), with crystallite size
around 3 nm, can be identified in the calcined sample (Figure 3-28), and the formation of Ni-
Zn alloy phase can be observed with a peak at ~43.5o that appears after reduction above 300
oC. It can also correspond to the Ni-Zn alloy (JCPDS: 72-2668) with Ni:Zn atomic ratio 1:1.
According to the Scherrer’s equation, the average particle sizes of Ni-Zn alloy in the sample
reduced at 300, 325, 350 and 450 oC are 3, 8, 10 and 11 nm, respectively. No peak was
a b

85
observed after reduction at 280 oC because either Ni
2+ is not fully reduced or the particles are
too small to be detected by XRD.
40 41 42 43 44 45 46 47 48 49 50 51 52
NiZn alloy: 01-072-2668
g
f
e
d
c
b
11 nm
10 nm
7.5 nm
3.2 nm
Inte
nsit
y /
a,u
2 Theta
2.7 nm
a
ZnO:00-036-1451
NiO: 01-071-1179
Figure 3-28: XRD of calcined 0.5 wt% Ni/ZnO sample after reduction at different
temperature for 2 h: a, ZnO; b, calcined sample; c, reduction at 280 oC; d, reduction at 300
oC;
e, reduction at 320 oC; f, reduction at 350
oC; g, reduction at 450
oC;
For the study of the catalytic performances of the Ni/ZnO catalyst, the 0.5 wt%
Ni/ZnO sample was employed. Both the as-prepared and the calcined 0.5 wt% Ni/ZnO
samples were tested as a mixture of 10 mg of 0.5 wt% Ni/ZnO diluted with 90 mg of ZnO
(sieve fraction, 125-200 μm), and the influence of the reduction temperature (i.e., 280, 300,
450 oC) on the catalytic performance was investigated.
Except for the samples reduced at 280 oC, the results in Figure 3-29A show that the
calcined catalysts have a lower butadiene 100% conversion temperature (T100%), thus a higher
catalytic activity, than the corresponding as-prepared ones. Figure 3-29A also shows that the
reduction temperature has a significant effect on T100%, with T100% close to 70 oC for the
samples reduced at 280 oC, and higher than 120
oC for the samples reduced at 450
oC,
whatever the starting material. This phenomenon might be explained by the difference of Ni-
Zn bimetallic nanoparticle sizes, as smaller particle sizes were obtained in the sample after
reduction at lower temperatures (Figure 3-28) and the calcined samples displayed smaller
NiZn alloy particle formation after reduction (Figure 3-27). By comparison with the
monometallic 0.5 wt% Ni/TiO2 catalyst reduced at 450 °C, which showed butadiene
conversion close to 100% at RT (Figure 3-24), it can be seen that the Ni/TiO2 catalyst (i.e.,

86
metallic Ni) has a lower T100% than Ni/ZnO (i.e., Ni1Zn1 alloy), however, the TOFs (turn over
frequency) cannot be compared because the Ni particle size in the Ni/TiO2 catalyst is
unknown (and probably much smaller than the NiZn ones in Ni/ZnO since they are not
detected by XRD (Figure 3-21)).
0
20
40
60
80
100
As-prepared
Bu
tad
ien
e c
on
vers
ion
/ %
R280
R300
R450
Calcined
A
30 40 50 60 70 80 90 100 110 120 130 1400
20
40
60
80
100
As-preparedSele
cti
vit
y t
o b
ute
nes / %
Temperature / oC
R280
R300
R450
Calcined
B
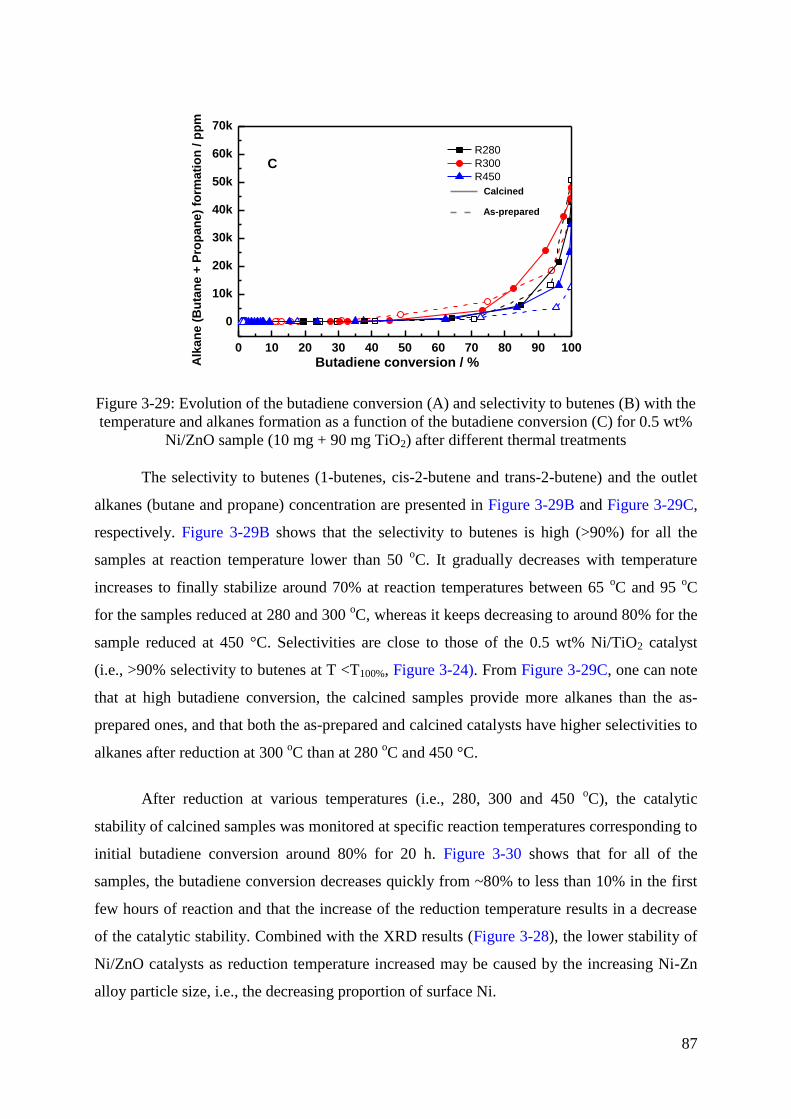
87
0 10 20 30 40 50 60 70 80 90 100
0
10k
20k
30k
40k
50k
60k
70k
Alk
an
e (
Bu
tan
e +
Pro
pa
ne
) fo
rma
tio
n /
pp
m
Butadiene conversion / %
R280
R300
R450
Calcined
As-prepared
C
Figure 3-29: Evolution of the butadiene conversion (A) and selectivity to butenes (B) with the
temperature and alkanes formation as a function of the butadiene conversion (C) for 0.5 wt%
Ni/ZnO sample (10 mg + 90 mg TiO2) after different thermal treatments
The selectivity to butenes (1-butenes, cis-2-butene and trans-2-butene) and the outlet
alkanes (butane and propane) concentration are presented in Figure 3-29B and Figure 3-29C,
respectively. Figure 3-29B shows that the selectivity to butenes is high (>90%) for all the
samples at reaction temperature lower than 50 oC. It gradually decreases with temperature
increases to finally stabilize around 70% at reaction temperatures between 65 oC and 95
oC
for the samples reduced at 280 and 300 oC, whereas it keeps decreasing to around 80% for the
sample reduced at 450 °C. Selectivities are close to those of the 0.5 wt% Ni/TiO2 catalyst
(i.e., >90% selectivity to butenes at T <T100%, Figure 3-24). From Figure 3-29C, one can note
that at high butadiene conversion, the calcined samples provide more alkanes than the as-
prepared ones, and that both the as-prepared and calcined catalysts have higher selectivities to
alkanes after reduction at 300 oC than at 280
oC and 450 °C.
After reduction at various temperatures (i.e., 280, 300 and 450 oC), the catalytic
stability of calcined samples was monitored at specific reaction temperatures corresponding to
initial butadiene conversion around 80% for 20 h. Figure 3-30 shows that for all of the
samples, the butadiene conversion decreases quickly from ~80% to less than 10% in the first
few hours of reaction and that the increase of the reduction temperature results in a decrease
of the catalytic stability. Combined with the XRD results (Figure 3-28), the lower stability of
Ni/ZnO catalysts as reduction temperature increased may be caused by the increasing Ni-Zn
alloy particle size, i.e., the decreasing proportion of surface Ni.

88
The comparison with the 0.5 wt% Ni/TiO2 catalyst activated at 450 oC for 2 h (Figure
3-24), which showed that butadiene conversion decreased from 100% to ~26% after 8 h of
reaction at room temperature, shows that the Ni/ZnO catalyst reduced at the same temperature
is less stable as the butadiene conversion decreased sharply from 73% to ~6% in less than 4 h
of reaction at 65 oC (Figure 3-30). This may indicate that Ni-Zn alloy-based catalysts have
lower stability than monometallic Ni catalysts. Spanjers et al [79] also found that by
comparison with Ni/SiO2, the presence of ZnO in Ni/ZnO catalyst hinders the dissociation of
H2 on the β1-NiZn alloy (Ni1Zn1) surface , thereby favors acetylene oligomerization and over
hydrogenation, but they concluded that this is due to the presence of ZnO since they reported
that the adsorption energies of H on Ni (111) and β1-NiZn (101) are identical, 0.46 and 0.47
eV, respectively. Even though the authors did not carry stability tests, the possibility of
oligomers formation (i.e., green oil or foulant) from the acetylene oligomerization could lead
to the catalyst deactivation as oligomer formation is considered as an important cause of
deactivation in the case of selective hydrogenation of polyunsaturated compounds [67], thus
the oligomerization occurring on the ZnO support may provide an explanation of the lower
stability observed for the Ni-Zn alloy in Ni/ZnO catalyst than the monometallic Ni in Ni/TiO2
sample. Considering the possible negative effect of ZnO on the catalytic performance of
supported Ni-Zn alloy, thus it will be better to prepare Ni-Zn supported on another support
than ZnO if one would like to study the catalytic stability of supported Ni-Zn alloy
0 2 4 6 8 10 12 14 16 18 200
500
1000
1500
2000
2500
3000
Bu
tad
ien
e C
on
ce
ntr
ati
on
/ p
pm
Time / h
C400R280 at 45oC for 20h
C400R300 at 45oC for 20h
C400R450 at 65oC for 20h
Figure 3-30: Evolution of the butadiene concentration with time on stream for the calcined 0.5
wt% Ni/ZnO sample (10 mg + 90 mg TiO2) after reduction at various temperatures

89
6. Conclusion
In this chapter, the deposition-precipitation behavior of transition metal ions (i.e., Cu,
Zn and Ni) on TiO2 support was studied during deposition-precipitation with urea (DPu)
preparation, and the catalytic performances of the resulting supported monometallic catalysts
were explored in the selective hydrogenation of butadiene reaction in the presence of an
excess of propene. According to the experimental results, it was found that the pH required
for completing deposition-precipitation of transition metal ions is 5.7 for Cu(II), which is
lower than that for Zn(II) (i.e., 6.3), which is in agreement with the theoretical calculation
presented in Chapter 2. The deposition-precipitation behavior of Ni will be introduced in
Chapter 5. The TPR results revealed that the temperature of reduction of Cu2+
and Ni2+
on
TiO2 surface is around 350 oC and 450
oC, respectively and that Zn
2+ on TiO2 does not reduce
in the 25-550 °C range.
Zn/TiO2 sample, after activation at 350 oC, is inactive at temperature lower than 180
oC and very poorly active at temperature higher than 180
oC for selective hydrogenation of
butadiene.
For the Cu/TiO2 catalysts, most of Cu was deposited on TiO2 surface in the first 3 h of
DPu preparation, i.e. at pH lower than the PZC of TiO2 support (~6.0). The formation of a
metallic Cu phase was clearly observed after reduction at 350 oC, and the size of the Cu
nanoparticles strongly depended on the Cu loading and the preparation time, i.e. on the nature
of supported Cu phase, Cu2(OH)3NO3 or CuO, which arose from the decomposition of
Cu2(OH)3NO3 during DPu procedure. The formation of the CuO phase was also favored by
high Cu loading. As a result, larger Cu0 particles (8.5 nm) were obtained after reduction of ~5
wt% Cu/TiO2 than after reduction of 1.55 wt% Cu/TiO2 (4.5 nm). The evolution of butadiene
conversion during reaction from 30 oC to 150
oC indicates that metallic Cu has a moderate
activity (i.e., T100% around 75 oC for 2.5 wt% Cu/TiO2) in our reaction conditions, a high
selectivity to alkenes, but a very low stability during time on stream at temperature close to
T100%.
In the case of Ni-based catalysts, metallic Ni particles were only detected by XRD in
Ni/TiO2 samples with high Ni loading (i.e., 2.5 wt%) after reduction at temperature higher
than 350 oC, however, Ni-Zn alloy (Ni1Zn1 alloy) was detected in the monometallic Ni/ZnO
sample after reduction at temperature higher than 280 oC, without any metallic Ni formation,

90
no matter the Ni loading (i.e., 2.5 or 0.5 wt%). Strong exothermicity (i.e., the temperature in
the reactor sharply increased from RT to >90 oC) was observed once the reactant gas flowed
through the 2.5wt% Ni/TiO2 catalyst at RT, and butadiene was fully converted with butane as
the main product, which indicated that metallic Ni was very active in butadiene selective
hydrogenation reaction (and much more active than Cu-based catalysts). Thus, a low Ni
loading (i.e., 0.5 wt%) will be selected for the further bimetallic Ni-Zn catalytic study in
Chapter 5. The diluted 0.5 wt% Ni/TiO2 catalyst (50 mg in 50mg TiO2 support) still showed
100% conversion at RT, but no exothermicity with high selectivity to butenes (>95% at
temperature close to T100%). However, the catalysts were not stable, and deactivated fast. The
comparison of the catalytic performances of Ni/TiO2 (i.e., metallic Ni) and Ni/ZnO (i.e.,
Ni1Zn1 alloy) catalysts with 0.5 wt% Ni loading after reduction at 450 oC showed that the
catalyst containing metallic Ni had higher activity (un-compared TOF as the particle size of
metallic Ni in Ni/TiO2 is unknown) and selectivity to butenes than catalyst containing Ni1Zn1
alloy, which is not in agreement with the results of theoretical calculation by Studt’s et al
(Figure 1-4 in Chapter 1). Indeed, they predicted that Ni1Zn1 alloy should have higher
selectivity to alkenes, but lower activity than metallic Ni. Our results also indicate that
catalyst containing Ni1Zn1 alloy deactivates faster than metallic Ni, possibly for reasons
developed in Section 5.2 which question the role of the ZnO support. To make a fair
comparison, it will be better to prepare bimetallic Ni-Zn supported on another support than
ZnO that has an inert surface. As a result, the study of supported Ni-Zn/TiO2 will be
developed in Chapter 5.
Since Zn/TiO2 is much less active than Cu/TiO2 and Ni/TiO2 catalysts (Table 3-5), one
can anticipate that the main active metals in the bimetallic Cu-Zn/TiO2 and Ni-Zn/TiO2
catalysts that will be studied in Chapters 4 and 5, respectively, are Cu and Ni, and that Zn will
behave as a promoter or a modifier as already shown in this chapter in the study of Ni/ZnO.
Table 3-5: Summary of the reaction conditions and activity for the TiO2 supported Zn, Cu and
Ni
Sample Metal loading
/ wt%
Mass for catalytic
evaluation / mg
Activation
temperature / oC
Full Butadiene conversion
temperature
Zn/TiO2 2.5 100 350 50% conversion at 300 oC
Cu/TiO2 2.5 100 350 ~75 oC
Ni/TiO2 0.5 10 (diluted in 90 mg TiO2) 450 RT
91
7. References
1. S.Derrouiche, H. Lauron-Pernot, C. Louis, Chemistry of Materials, 24 (2012) 2282.
2. W.F.Bleam, M.B. McBride, Journal of Colloid and Interface Science, 110 (1986) 335.
3. M.F.Ottaviani, E.M. Ceresa, M. Visca, Journal of Colloid and Interface Science, 108
(1985) 114.
4. C. Ludwig, P.W. Schindler, Journal of Colloid and Interface Science, 169 (1995) 284.
5. J.K.Yang, A.P. Davis, Journal of Colloid and Interface Science, 216 (1999) 77.
6. J.K.Yang, S. M. Lee, Journal of Colloid and Interface Science, 282 (2005) 5.
7. J.K.Yang, S. M. Lee, A.P. Davis, Journal of Colloid and Interface Science, 295 (2006)
14.
8. S.K.Poznyak, V.I.Pergushov, A.I.Kokorin, A.I.Kulak, C.W. Schläpfer, The Journal of
Physical Chemistry B, 103 (1999) 1308.
9. M.S.Kim, K. M.Hong, J.G. Chung, Water Research, 37 (2003) 3524.
10. M.A.Barakat, Journal of Colloid and Interface Science, 291 (2005) 345.
11. M.Konstantinou, I. Pashalidis, Colloids and Surfaces A: Physicochemical and
Engineering Aspects, 324 (2008) 217.
12. A.Georgaka, N. Spanos, Global Nest J, 12 (2010) 239.
13. Z.Wang, D.Brouri, S.Casale, L.Delannoy, C.Louis, Journal of catalysis, 340 (2016)
95.
14. A.Sandoval, C. Louis, R. Zanella, Applied Catalysis B: Environmental, 140 (2013)
363.
15. L.Delannoy, G.Thrimurthulu, P.S. Reddy, C.Méthivier, J.Nelayah, B.M.Reddy,
C.Ricolleau, C.Louis, Phys. Chem. Chem. Phys., 16 (2014) 26514.
16. R.Si, J.Raitano, N.Yi, L.Zhang, S.W. Chan, Maria Flytzani-Stephanopoulos, Catalysis
Today, 180 (2012) 68.
17. S.F.Peng, J. J. Ho, Physical Chemistry Chemical Physics, 13 (2011) 20393.
18. V.G.Deshmane, R.Y. Abrokwah, D. Kuila, Journal of Molecular Catalysis A:
Chemical, 408 (2015) 202.
19. H.C.Yang, H.Y.Lin, Y.S.Chien,J.C.Sheng Wu, H.H.Wu, Catalysis letters, 131 (2009)
381.

92
20. M.Behrens, F.Studt, I.Kasatkin, S.Kühl, M.Hävecker, F.Abild-Pedersen, S.Zander,
F.Girgsdies, P.Kurr, B.L.Kniep, M.Tovar, R.W.Fischer, J.K.Nørskov, R.Schlögl,
Science, 336 (2012) 893.
21. J.Llorca, M.Domínguez, C.Ledesma, R.J. Chimentão, F.Medina, J.Sueiras, I.Angurell,
M.Seco, O.Rossell, Journal of catalysis, 258 (2008) 187.
22. O.P.H. Vaughan, G.Kyriakou, N.Macleod, Mi.Tikhov, R.M. Lambert, Journal of
catalysis, 236 (2005) 401.
23. R.J. Chimentão, F. Medina, J.L.G. Fierro, J. Llorca, J.E. Sueiras, Y. Cesteros, P.
Salagre, Journal of Molecular Catalysis A: Chemical, 274 (2007) 159.
24. S.Pande, A.Saha, S.Jana, S.Sarkar, M.Basu, M.Pradhan, A.K.Sinha, S.Saha, A.Pal,
T.Pal, Organic letters, 10 (2008) 5179.
25. Q.Jia, D.Zhao, B.Tang, N.Zhao, H.Li, Y.Sang, N.Bao, X.Zhang, X.Xu, H.Liu, Journal
of Materials Chemistry A, 2 (2014) 16292.
26. F.Liao, Y.Huang, J.Ge, W.Zheng, K.Tedsree, P.Collier, X.Hong, S.C.Tsang,
Angewandte Chemie International Edition, 50 (2011) 2162.
27. B.M. Nagaraja, A.H. Padmasri, B. David Raju, K.S. Rama Rao, Journal of Molecular
Catalysis A: Chemical, 265 (2007) 90.
28. J.Phillipson, P. Wells, G. Wilson, Journal of the Chemical Society A: Inorganic,
Physical, Theoretical, 1969, 1351.
29. E.Nishimura, Y. Inoue, I. Yasumori, Bulletin of the Chemical Society of Japan, 48
(1975) 803.
30. R.Koeppel, J.T.Wehrli, M.S.Wainwright, D.L.Trimma, N.W.Cant, Applied Catalysis
A: General, 120 (1994) 163.
31. N.J.Ossipoff, N.W. Cant, Journal of catalysis, 148 (1994) 125.
32. L.Trouillet, T.Toupance, F.Villain, C.Louis, Physical Chemistry Chemical Physics, 2
(2000) 2005.
33. P.Burattin, M. Che, C. Louis, The Journal of Physical Chemistry B, 102 (1998) 2722.
34. M.K. van der Lee, A. Jos van Dillen, J.H. Bitter, K.P. de Jong, Journal of the
American Chemical Society, 127 (2005) 13573.
35. C.Louis, Deposition-precipitation synthesis of supported metal catalysts. CATALYST
PREPARATION, Science and Engineering, 2007.
36. J. Park, J.R. Regalbuto, Journal of colloid and interface science, 175 (1995) 239.
37. D.C.Pereira, D.L.A.d. Faria, V.R. Constantino, Journal of the Brazilian Chemical
Society, 17 (2006) 1651.

93
38. S.A.Kondrat, P.J.Smith, P.P.Wells, P.A.Chater, J.H.Carter, D.J.Morgan,
E.M.Fiordaliso, J.B.Wagner, T.E. Davies, L.Lu, J.K.Bartley, S.H.Taylor,
M.S.Spencer, C.J.Kiely, G.J.Kelly, C.W.Park, M.J.Rosseinsky, G.J.Hutchings, Nature,
531 (2016) 83.
39. N.L.Dias Filho, Microchimica Acta, 130 (1999) 233.
40. T.Toupance, M. Kermarec, C. Louis, The Journal of Physical Chemistry B, 104
(2000) 965.
41. M.Liu, X.Qiu, M.Miyauchi, K.Hashimoto, Chemistry of Materials, 23 (2011) 5282.
42. H.Irie, S.Miura, K.Kamiya, K.Hashimoto, Chemical Physics Letters, 457 (2008) 202.
43. H.Irie, K.Kamiya, T.Shibanuma, S.Miura, D.A. Tryk, T.Yokoyama,K.Hashimoto, The
Journal of Physical Chemistry C, 113 (2009) 10761.
44. I. Georgiadou, Ch. Papadopoulou, H. K. Matralis, G. A. Voyiatzis, A. Lycourghiotis,
Ch. Kordulis, The Journal of Physical Chemistry B, 102 (1998) 8459.
45. B.Choudhury, M. Dey, A. Choudhury, International Nano Letters, 3 (2013) 1.
46. A.Petalaa, E.Ioannidoua, A.Georgakab, K.Bourikasb, D.I. Kondarides, Applied
Catalysis B: Environmental, 178 (2015).
47. P.Platanitis, G.D. Panagiotou, K.Bourikas, C.Kordulis, J.L.G. Fierro, A.Lycourghiotis,
Journal of Molecular Catalysis A: Chemical, 412 (2016) 1.
48. J.Y. Kim, J.A. Rodriguez, J.C. Hanson, A.I. Frenkel, P.L. Lee, Journal of the
American Chemical Society, 125 (2003) 10684.
49. W.P.Dow, Y. P. Wang, T. J. Huang, Journal of catalysis, 160 (1996) 155.
50. G.Fierro, M.L.Jacono, M.Inversi, P.Porta, F.Cioci, R.Lavecchia, Applied Catalysis A:
General, 137 (1996) 327.
51. J.N.Nian, S.A.Chen, C.C.Tsai, H.Teng, The Journal of Physical Chemistry B, 110
(2006) 25817.
52. F.S.Delk II, A. Vāvere, Journal of catalysis, 85 (1984) 380.
53. X.F.Yu, N.Z.Wu, Y.C.Xie, Y.Q. Tang, Journal of Materials Chemistry, 10 (2000)
1629.
54. G.Fierro, L.Lojacono, M.Inversi, P.Porta, R.Lavecchia, F.Cioci, Journal of catalysis,
148 (1994) 709.
55. K.Bourikas, C. Kordulis, A. Lycourghiotis, Chemical reviews, 114 (2014) 9754.
56. D.T.Cromer, K. Herrington, Journal of the American Chemical Society, 77 (1955)
4708.
94
57. G.D.Panagiotou, T.Petsi, K.Bourikas, C.S.Garoufalis, A.Tsevis, N.Spanos,
C.Kordulis, A.Lycourghiotis, Advances in colloid and interface science, 142 (2008)
20.
58. L.Pauling, Journal of the American Chemical Society, 51 (1929) 1010.
59. C.J.G. Van Der Grift, P.A. Elberse, A. Mulder, J.W. Geus, Applied Catalysis, 59
(1990) 275.
60. J.A. van Dillen, J.W.G., L.A Hermans, J. van der Meijden, In "Proceedings of the 6th
International Congress on Catalysis" London, 1976.
61. G. C. Bond, P.B.W., F.C. Tompkins, Ed., The Chemical Society: London, 1977: p. P
677.
62. J.W.E. Coenen, , Reduction of Silica Supported Nickel Catalysts, in Studies in Surface
Science and Catalysis, P.G.P.J. B. Delmon and G. Poncelet, Editors. 1979, Elsevier. p.
89-111.
63. P.Burattin, M. Che, C. Louis, The Journal of Physical Chemistry B, 101 (1997) 7060.
64. C. RamachandraáRao, Journal of Materials Chemistry, 1 (1991) 299.
65. A.Hugon, L. Delannoy, C. Louis, Gold Bulletin, 41 (2008) 127.
66. N.J.Ossipoff, N. Cant, Journal of Catalysis, 148 (1994) 125.
67. M.R. Stammbach, D.J. Thomas, D.L. Trimm, M.S. Wainwright, Applied Catalysis, 58
(1990) 209.
68. H.Yan, H.Cheng, H.Yi, Y.Lin, T.Yao, C.Wang, J.Li, S.Wei,J.Lu, Journal of the
American Chemical Society, 137 (2015) 10484.
69. J.Bjerrum, Stability constants of metal-ion complexes. 1964: The Chemical Society.
70. T.Imoto, Y.Harano, Y.Nishi, S.Masuda, Bulletin of the Chemical Society of Japan, 37
(1964) 441.
71. S.Lew, A.F. Sarofim, M. Flytzani-Stephanopoulos, Chemical Engineering Science, 47
(1992) 1421.
72. M.Liang, W. Kang, K. Xie, Journal of Natural Gas Chemistry, 18 (2009) 110.
73. M.A. Valenzuela, P. Bosch, J. Jiménez-Becerrill, O. Quiroz, A.I. Páez, Journal of
Photochemistry and Photobiology A: Chemistry, 148 (2002) 177.
74. R.Kama, C.Selomulyaa, R.Amalb, J.Scott, Journal of Catalysis, 273 (2010) 73.
75. M.Turco, G.Bagnasco, U.Costantino, F.Marmottini, T.Montanari, G.Ramis, G.Busca,
Journal of Catalysis, 28 (2004) 43.
76. J.van de Loosdrecht, A.M.van der Kraan, A.J.van Dillen, J.W.Geus, Journal of
Catalysis, 170 (1997) 217.

95
77. K.Hadjiivanov, M.Mihaylov, N.Abadjieva, D.Klissurski, J. Chem. Soc., Faraday
Trans., 94 (1998) 3711.
78. W.Pearson, W. Pearson, An Alphabetical Index of Work on Metals and Alloys. A
Handbook of Lattice Spacings and Structures of Metals and Alloys, 1958: p. 634.
79. C.S.Spanjers, R.S.Sim, N.P.Sturgis, B.Kabius, R.M.Rioux, ACS Catalysis, 5 (2015)
3304.
Chapter 4: Novel Non-Noble Bimetallic Cu-Zn/TiO2 Catalysts for
Selective Hydrogenation of Butadiene
Chapter 4: Novel Non-Noble Bimetallic Cu-Zn/TiO2 Catalysts for Selective
Hydrogenation of Butadiene ................................................................................................. 98
1. Introduction ...................................................................................................................... 98
2. Catalysts preparation ...................................................................................................... 100
3. Results and discussion .................................................................................................... 101
3.1 XRF study of metals deposition-precipitation behavior .......................................... 101
3.2 UV-Visible study of calcined Cu-Zn/TiO2 catalysts ................................................ 102
3.3 Study of the thermal stability of Zn under H2 atmosphere ....................................... 103
3.4 Reduction behavior of calcined Cu-Zn/TiO2 catalysts ............................................. 104
3.5 XRD study of calcined and reduced Cu-Zn/TiO2 catalysts ...................................... 105
3.6 UV-Visible study of calcined then reduced Cu-Zn/TiO2 catalysts .......................... 106
3.7 STEM-HAADF study of calcined Cu-Zn/TiO2 catalysts ......................................... 107
3.8 EDS study of calcined Cu-Zn/TiO2 catalysts ........................................................... 108
3.9 XPS of ex-situ calcined then reduced mono Cu/TiO2 and bimetallic Cu-Zn/TiO2
catalysts .......................................................................................................................... 111
4. Catalytic results – Butadiene selective hydrogenation ................................................... 112
5. Conclusion ...................................................................................................................... 122
6. References ...................................................................................................................... 124

98
Chapter 4: Novel Non-Noble Bimetallic Cu-Zn/TiO2 Catalysts for
Selective Hydrogenation of Butadiene
1. Introduction
According to the study of monometallic Cu/TiO2 catalysts for the selective
hydrogenation of butadiene in Chapter 3, metallic Cu shows high selectivity to alkenes (i.e.,
~100% to alkenes at T~T100%), moderate activity (compared to Pd-based catalysts), but low
catalytic stability. Thus, in order to make Cu-based catalysts become suitable alternatives to
noble metal catalysts (e.g., Pd-based catalysts) in the selective hydrogenation of unsaturated
hydrocarbons, the catalytic stability of metallic Cu has to be improved. Based on previous
studies on palladium-based bimetallic catalysts, bimetallic Pd-Ag catalysts show higher
catalytic activity, selectivity to alkenes and stability than monometallic Pd catalyst [1-7], the
introduction of a second metal to metallic Cu could be an attractive path to promote the
catalyst stability in selective hydrogenation. It has also been found that alloying copper with
gold (in bimetallic Au1Cu3 catalyst) resulted in a more stable catalyst than monometallic Cu
and a more active catalyst than monometallic gold [8].
On the other hand, using density functional theory (DFT) calculation, Studt et al [9]
predicted that Cu-Zn alloy could have a higher selectivity than metallic Cu in acetylene
hydrogenation. Moreover, although the promotional role of Zn on the catalytic activity and
selectivity of supported Cu catalyst has been studied in catalytic reactions such as methanol
synthesis [10-13], water-gas shift reaction [14] and methanol steam reforming [15], the effect
of alloying Cu with Zn on the catalytic stability of Cu has not been experimentally verified up
to now, especially, in the reaction of selective hydrogenation of alkynes and alkadienes. As a
result, it is worth to investigate whether adding Zn to Cu will improve the catalytic stability
during reaction. Thus, the aim of this chapter is to prepare supported bimetallic Cu-Zn
catalysts with the goal of trying to obtain well dispersed Cu-Zn nanoalloy particles, to
characterize the metal particles and to evaluate their catalytic performance in the selective
hydrogenation of butadiene.
Regarding the synthesis of Cu-Zn nanoalloy, the alloy phase diagram of bulk Cu-Zn
system (Figure 4-1) has to be first examined. Figure 4-1 shows that the phase of the CuZn
alloy changes from α to η (7 types of alloy phases) according to the amount of Zn in the

99
bimetallic Cu-Zn system, e.g., α-CuZn phase when the Zn content is lower than 38.95 wt%,
while η-CuZn phase when the Zn content is higher than 97.25 wt%. Since the Zn content in
the bimetallic Cu-Zn system plays a key role on the nature of Cu-Zn alloy phase, it will be
interesting to vary the Zn loading in the supported bimetallic Cu-Zn catalysts and study its
influence on their catalytic performances. Besides that, the low melting temperature of
metallic Zn (~420 oC; boiling point: ~907
oC) also reminds us to be aware of the selection of
the temperature for sample reduction, to avoid the risk of Zn evaporation, which may cause a
change in the Zn content, and finally affects the CuZn alloy phase formation.
Figure 4-1: Alloy phase diagram of Cu-Zn system (left), Cu-Zn crystallographic data (right)
[16]
In this chapter, bimetallic Cu-Zn catalysts are for the first time studied in a reaction of
hydrogenation, here in that of selective hydrogenation of butadiene in the presence of
propene. The Cu-Zn/TiO2 catalysts with CuZn ratios of 3:1 and 1:1 were prepared by the
same method of deposition-precipitation with urea (DPu) as Cu/TiO2 (Chapter 3), i.e., by co-
DPu and by another method of deposition-precipitation at fixed pH (DP8) for reasons that will
be explained later. Note that specific attention is paid to the characterization of the
composition of Cu-Zn particles, which is an important aspect for the study of bimetallic
catalysts. This chapter will describe:
- The deposition behavior of Cu and Zn on titania as a function of pH and time;

100
- The characterization of Cu-Zn nanoalloy after sample calcination and reduction by
different techniques, such as XRF, XRD, XPS, and STEM-HAADF coupled with EDS.
- The effect of the addition of Zn to Cu/TiO2 catalyst on the catalytic performance,
including activity, selectivity to alkenes and stability.
- The influence of the catalyst preparation method (i.e., DPu and DP8) on the
nanoparticle size, dispersion and catalytic performance.
2. Catalysts preparation
Monometallic Cu/TiO2 and Zn/TiO2 and bimetallic Cu-Zn/TiO2 catalysts were
prepared using the method of DPu procedure described elsewhere [17] and deposition-
precipitation at fixed pH (i.e. 8). Briefly, for the DPu procedure, 3 g of support (TiO2 P25
Evonik) dispersed into 300 ml distilled water were mixed with the appropriate amount of
Cu(NO3)2•3H2O and/or Zn(NO3)2•6H2O precursors in order to achieve the desired nominal
copper and/or zinc loading with Cu:Zn atomic ratios of 3:1 and 1:1. Urea was added to
achieve a urea to metal molar ratio of ca. 100. The mixture was kept at 80 °C in a closed
reactor for 20 h under continuous stirring. The solid was separated from the liquid by
centrifugation and subsequently washed with distilled water and centrifuged again (three
times) (sample called DPu).
DP8 preparation was performed as follows. A suspension of 3 g TiO2 support in 250
ml distilled water with pH adjusted to 8 using NaOH (0.5 M) was introduced into a glass
reactor at room temperature. A 50 ml distilled water containing Cu(NO3)2⋅3H2O and/or
Zn(NO3)2⋅6H2O was injected into the TiO2 suspension slowly (~2 ml min-1
), then the mixture
was stirred for 2 h. The pH of the solution was kept constant at pH around 8 by gradually
injecting 0.5 M NaOH solution throughout the whole preparation procedure. The solid was
then collected by centrifugation and subsequently washed with distilled water and centrifuged
again (three times) (sample called DP8).
All of the samples were further dried under vacuum at room temperature for 24 h (as-
prepared sample).

101
Monometallic Cu/TiO2 and Zn/TiO2 samples were prepared with a 2.5 wt% nominal
metal loading by both methods. Bimetallic CuZn 3:1 and 1:1/TiO2 catalysts were prepared to
achieve 2.5 wt% Cu and 0.8 wt% Zn and 2.5 wt% Cu and 2.5 wt% Zn, respectively. Before
characterization or reaction, the catalysts were calcined at 400 °C for 2 h with a temperature
ramp of 5 °C min−1
, under flowing air (100 mL min−1
), and reduced at 350 °C for 2 h
(temperature ramp of 2 °C min−1
) under flowing H2 (100 mL min−1
) .
3. Results and discussion
3.1 XRF study of metals deposition-precipitation behavior
The evolution of the metal loadings as a function of pH/time for a representative DPu
and DP8 sample (nominal 2.5 wt% Cu and Zn loadings, Cu/Zn=1) was studied by extracting
the Cu-Zn/TiO2 solids from the suspensions at different pHs/time. The metal loadings in the
as-prepared samples were determined by XRF and presented in Figure 4-2.
It appears that the deposition-precipitation of copper and zinc is not coincident in the
case of the DPu process (Figure 4-2A) as copper is deposited first on TiO2 surface and almost
completely at pH around 5, whereas zinc starts to deposit at pH above 5 to finally reach
complete deposition at pH around 7.5. This was also previously observed in the case of
homogeneous precipitation of ternary Cu/ZnO/Al2O3 using urea as the precipitating agent
[18], showing that the precipitation of Cu(II) and Zn(II) proceeded stepwise, with Cu(II)
hydrolysed first then Zn(II) during the pH increase, and the final compound in the as-prepared
samples consisted mainly of aurichalcite, (Cu,Zn)5(CO3)2(OH)6. The formation of the latter
compound resulted from the dissolution-reprecipitation of amorphous Cu(OH)2 assisted by
Zn(II) [18]. Considering the principle of DPu method described in the literature [19-22], the
solubility difference between copper (log*Ks0
= 8.85) [23-25] and zinc hydroxide (log*Ks0
=
12.0) [23, 24] could be responsible for the sequential deposition-precipitation behaviour of
Cu2+
and Zn2+
. However, because of the low metal loadings employed in this work, and
maybe also because the compound was amorphous, it was not possible to identify the phase(s)
present at the end of the preparation process by XRD.
Consequently, a pH above 7.5 is required to simultaneously precipitate/deposit copper
and zinc. This is confirmed by the results obtained for the sample prepared at pH ~8 (DP8)

102
(Figure 4-2B), which show that the major part of both metals is deposited concurrently within
the first hour of the process.
3.5 4.0 4.5 5.0 5.5 6.0 6.5 7.0 7.5 8.00.0
0.5
1.0
1.5
2.0
2.5
Zn
Meta
llic
Lo
ad
ing
/ w
t%
Final pH of DPu
Cu
A
0 2 4 6 8 10 12 14 16 18 20 220.0
0.5
1.0
1.5
2.0
2.5
Meta
l lo
ad
ing
/ w
t%
Time / h
Room tempertaure
Cu
Zn
B
Figure 4-2: Evolution of the Cu and Zn loadings on titania versus pH during the DPu (A) and
versus time during the DP8 (B) preparation procedure. Nominal loadings: 2.5 wt% Cu and 2.5
wt% Zn
The final metal loadings in the catalysts prepared by DPu and DP8 are presented in
Table 4-1. The experimental Cu and Zn loadings are closed to the nominal ones, indicating
that the deposition yields reached values above 80%. Moreover, the Cu/Zn atomic ratios are
also closed to the ones expected for all the samples.
Table 4-1: Final metal loading in the Cu-Zn/TiO2 sample prepared by DPu and DP8
Theoretical values Experimental values
Cu : Zn
ratios
Loading (wt%) DPu DP8 DPu
Cu : Zn
ratios
DP8
Cu : Zn
Ratios Cu Zn Cu Zn Cu Zn
1 : - 2.5 - 2.2 - 2.2 - 1 : - 1 : -
3 :1 2.5 0.8 2.0 0.7 2.3 0.8 2.9 :1 2.9 :1
1 :1 2.5 2.5 2.0 1.9 2.1 2.0 1.1 :1 1.1 :1
- : 1 - 2.5 - 2.1 - 2.1 - : 1 - : 1
3.2 UV-Visible study of calcined Cu-Zn/TiO2 catalysts
The UV-Visible spectra obtained for the calcined DPu and DP8 samples are presented
in Figure 4-3A, B. The contribution of the support was removed by using TiO2 as the baseline

103
for the UV-visible spectra. The Zn/TiO2 spectrum shows an absorption band with a maximum
at 370 nm (spectrum 5 in Figures 4-3A), which is characteristic of ZnO whose band gap is at
3.35 eV [26]. However, this band cannot be observed in the DPu or DP8 CuZn 3:1 and
1:1/TiO2 samples (spectra 2 and 3 in Figures 4-3A, B) which may mean that these samples do
not contain bulk ZnO. The spectra of the DPu and DP8 Cu/TiO2 (spectrum 1 in Figures 4-3A
and B) show two bands: one is at ~430 nm, previously observed for Cu/TiO2 samples [27] and
attributed to the interfacial charge transfer (IFCT) from the O2p valence band of TiO2 to Mx+
ions, such as Cu2+
[28-30], V5+
[31], Mo2+
[32], Fe3+
[33]. Another broad band is visible in the
600-1000 nm region and could be assigned to the Cu(II) d-d transition band [34-36]. These
two bands are visible in all the Cu/TiO2 and Cu-Zn/TiO2 samples, whatever the preparation
method. Moreover, in the DPu samples, there is an additional band in the range 450-800 nm
that can be assigned to the presence of CuO [17, 27, 37].
400 500 600 700 800 900 1000 1100 1200
4
2
1
Ab
so
rba
nc
e (
a.u
.)
A
3
400 500 600 700 800 900 1000 1100 1200
3
2
Ab
so
rba
nc
e (
a.u
.)
Wavelength / nm
B
1
Figure 4-3: UV-visible spectra of the calcined DPu (A) and DP8 (B) samples: 1, Cu/TiO2; 2,
CuZn 3:1/TiO2; 3, CuZn 1:1/TiO2; 4, DPu Zn/TiO2 in (A)
3.3 Study of the thermal stability of Zn under H2 atmosphere
Considering that the Zn content in the bimetallic Cu-Zn system strongly affects the
final Cu-Zn alloy phase formation, and combined to the low melting temperature for metallic
Zn (420 °C, Figure 4-1, left), it is necessary to study the thermal stability of metallic Zn in H2
atmosphere, using XRF technique, before the selection of reduction temperature for the
bimetallic Cu-Zn/TiO2 samples. Here, the DPu and DP8 2.5wt% CuZn 1:1/TiO2 were used as
examples. After reduction at 280, 350 and 550 oC for 2 h, the Zn loadings in the samples were
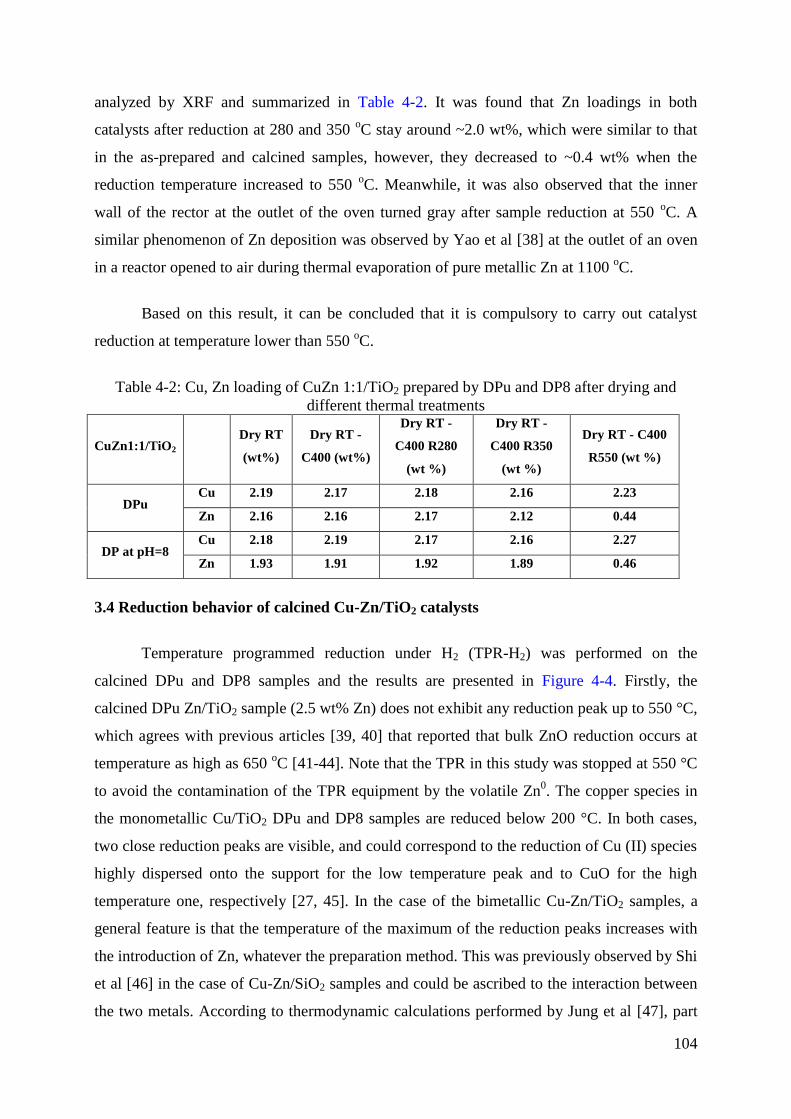
104
analyzed by XRF and summarized in Table 4-2. It was found that Zn loadings in both
catalysts after reduction at 280 and 350 oC stay around ~2.0 wt%, which were similar to that
in the as-prepared and calcined samples, however, they decreased to ~0.4 wt% when the
reduction temperature increased to 550 oC. Meanwhile, it was also observed that the inner
wall of the rector at the outlet of the oven turned gray after sample reduction at 550 oC. A
similar phenomenon of Zn deposition was observed by Yao et al [38] at the outlet of an oven
in a reactor opened to air during thermal evaporation of pure metallic Zn at 1100 oC.
Based on this result, it can be concluded that it is compulsory to carry out catalyst
reduction at temperature lower than 550 oC.
Table 4-2: Cu, Zn loading of CuZn 1:1/TiO2 prepared by DPu and DP8 after drying and
different thermal treatments
CuZn1:1/TiO2
Dry RT
(wt%)
Dry RT -
C400 (wt%)
Dry RT -
C400 R280
(wt %)
Dry RT -
C400 R350
(wt %)
Dry RT - C400
R550 (wt %)
DPu Cu 2.19 2.17 2.18 2.16 2.23
Zn 2.16 2.16 2.17 2.12 0.44
DP at pH=8 Cu 2.18 2.19 2.17 2.16 2.27
Zn 1.93 1.91 1.92 1.89 0.46
3.4 Reduction behavior of calcined Cu-Zn/TiO2 catalysts
Temperature programmed reduction under H2 (TPR-H2) was performed on the
calcined DPu and DP8 samples and the results are presented in Figure 4-4. Firstly, the
calcined DPu Zn/TiO2 sample (2.5 wt% Zn) does not exhibit any reduction peak up to 550 °C,
which agrees with previous articles [39, 40] that reported that bulk ZnO reduction occurs at
temperature as high as 650 oC [41-44]. Note that the TPR in this study was stopped at 550 °C
to avoid the contamination of the TPR equipment by the volatile Zn0. The copper species in
the monometallic Cu/TiO2 DPu and DP8 samples are reduced below 200 °C. In both cases,
two close reduction peaks are visible, and could correspond to the reduction of Cu (II) species
highly dispersed onto the support for the low temperature peak and to CuO for the high
temperature one, respectively [27, 45]. In the case of the bimetallic Cu-Zn/TiO2 samples, a
general feature is that the temperature of the maximum of the reduction peaks increases with
the introduction of Zn, whatever the preparation method. This was previously observed by Shi
et al [46] in the case of Cu-Zn/SiO2 samples and could be ascribed to the interaction between
the two metals. According to thermodynamic calculations performed by Jung et al [47], part

105
of ZnO could be reduced by forming alloy with Cu in the temperature range 250-350 oC in
CO or methanol environment. A schematic model of the Cu-Zn alloy formation in the
temperature range 120-600 oC in CO/H2 gas mixture was proposed by Grunwaldt et al [48].
But in none of these papers, the structure of Cu-Zn alloy was identified. Derrouiche et al [17]
showed that Cu3Zn alloy was obtained after reduction of Cu/ZnO at 350 oC. Based on the
TPR data and the study of Derrouiche et al [17], the temperature of 350 °C was selected for
the sample reduction in this study to favor alloy formation.
50 100 150 200 250 300 350 400 450 500 550
CuZn 1:1
CuZn 3:1
Cu
Zn
H2 c
om
su
mp
tio
n / a
.u.
A
Temperature / oC
DPU
50 100 150 200 250 300 350 400 450 500 550
CuZn 1:1
CuZn 3:1
H2 C
on
su
mp
tio
n / a
.u.
Temperature / oC
Cu
B DP8
Figure 4-4: TPR of calcined copper, zinc and copper-zinc catalysts supported on TiO2: A,
DPu samples; B, DP8 samples; TPR of calcined DPu Zn/TiO2 is also presented.
3.5 XRD study of calcined and reduced Cu-Zn/TiO2 catalysts
The X-ray diffraction patterns of the DPu and DP8 samples calcined then reduced at
350 oC are presented in Figure 4-5. Metallic copper (JCPDS# 70-3038) is detected in the
monometallic DPu Cu/TiO2 sample, indicating that Cu0 was not fully reoxidized in air. The
formation of a Cu3Zn alloy (JCPDS# 65-6567) is revealed in the DPu CuZn 1:1/TiO2 sample
(Figure 4-5A). For the DPu CuZn 3:1/TiO2 sample, a peak located between metallic Cu and
Cu3Zn alloy (Figure 4-5A) is clearly observed. From the crystal lattice (i.e. 3.6403 Å)
calculated using the Bragg’s law, the composition of this “intermediate” Cu-Zn alloy (i.e.
Cu0.9Zn0.1) could be estimated according to the Vegard’s law. Moreover, Pearson et al. [49]
confirmed that the crystal lattice distance varies linearly with the Cu-Zn alloy composition
when the Zn content is lower than 40% in the alloy particle. The crystallite sizes evaluated
using Scherrer’s equation are 20, 25 and 18 nm for the DPu Cu, CuZn 3:1/TiO2 and CuZn

106
1:1/TiO2, respectively. In the case of the DP8 catalysts (Figure 4-5B), no diffraction peak of
metallic Cu or Cu-Zn alloy was observed, whatever the sample, which indicates the presence
of small crystallites.
Figure 4-5: XRD diagrams of the calcined-reduced DPu (A) and DP8 (B) samples: 1,
Cu/TiO2; 2, CuZn 3:1/TiO2; 3, CuZn 1:1/TiO2 and 4, bare TiO2 support. ► Anatase TiO2
(JCPDS: 01-084-1286); ◄ Rutile TiO2 (JCPDS: 01-086-0147); Cu3Zn alloy peak position
from JCPDS: 03-065-6567; metallic Cu peak position from JCPDS: 01-070-3038.
3.6 UV-Visible study of calcined then reduced Cu-Zn/TiO2 catalysts
The UV-Visible spectra of the DPu and DP8 samples after calcination at 400 oC then
reduction at 350 oC are shown in Figures 4-6A,B. A broad band centred at 710 nm is observed
in the Cu/TiO2 sample (spectra 1), whatever the preparation method. It belongs to the Cu(II)
d-d transition. Moreover, combined with the XRD of reduced DPu Cu/TiO2 that indicated the
presence of Cu0 in the sample, it can be concluded that part of metallic Cu has been
reoxidized in air, which is in agreement with a former study [8]. After adding Zn in DPu and
DP8 Cu-Zn samples, the absorption band appears at lower wavelength (spectra 2 and 3 in
Figures 4-6A,B). The band at 590 nm for the CuZn 1:1 sample may correspond to the
4
3
2
Cu
Inte
ns
ity
/ a
.u
Cu3Zn
1
A
40 41 42 43 44 45 46 47 48 49 50 51 52
4
3
2
Inte
ns
ity
/ a
.u
2 theta
B
1

107
plasmon band of metallic Cu modified by the presence of Zn since Cu0 plasmon band is
expected around 570 nm [50-52] (spectra 2 and 3 in Figures 4-6A,B). This result suggests that
the addition of Zn to Cu prevents metallic Cu from deep oxidation in air owing to the
probable formation of Cu-Zn alloys.
400 500 600 700 800 900 1000 1100 1200
3
2
Ab
so
rban
ce
(a
.u.)
A
1
590
610
710
400 500 600 700 800 900 1000 1100 1200
3
2
Ab
so
rban
ce
(a.u
.)
Wavelength / nm
B
1
590
640
710
Figure 4-6: UV-visible spectra of the calcined-reduced DPu (A) and DP8 (B) samples: 1,
Cu/TiO2; 2, CuZn 3:1/TiO2; 3, CuZn 1:1/TiO2;
3.7 STEM-HAADF study of calcined Cu-Zn/TiO2 catalysts
STEM-HAADF was performed on the different samples after calcination at 400 oC
then reduction at 350 oC, and the resulting images and the particle size distribution are
presented in Figure 4-7. Small particles are visible in the Cu and Cu-Zn DPu samples (Figure
4-7a-c). The estimated average particle sizes are 3, 2.1 and 1.8 nm for DPu Cu/TiO2, CuZn
3:1/TiO2 and CuZn 1:1 /TiO2 samples (Table 4-3), respectively. These results are in
contradiction with the much larger sizes previously estimated from the XRD diagrams of
Cu/TiO2, CuZn 3:1/TiO2 and CuZn 1:1/TiO2 (Figure 4-5A). This would mean that the DPu
samples contain heterogeneous particle size distribution with the presence of small and large
particles. The images obtained for the DP8 Cu and CuZn 1:1/TiO2 samples are shown in
Figure 4-7d, e. The visible particles are well dispersed with narrow particle size dispersion
and average size of 1.9 and 2.1 nm for Cu and CuZn 1:1/TiO2, respectively. Only few large
particles (~5 nm) were observed in the STEM-HAADF images. As no diffraction peak of
metallic Cu and Cu-Zn alloy was visible in the XRD data (Figure 4-5B), it can be deduced

108
that the metallic Cu or Cu-Zn alloy particles in the DP8 samples have rather small and
uniform size.
3.8 EDS study of calcined Cu-Zn/TiO2 catalysts
The EDS measurements were performed on particles with size range below 5 nm, and
the results presented in Figure 4-8a-c show that the small particles visible in the TEM images
of DPu samples are Cu in Cu/TiO2, and Cu-Zn alloys in the CuZn 3:1 and CuZn 1:1/TiO2
samples. Interestingly, the EDS analysis of DPu CuZn 3:1/TiO2 (Figure 4-8b) shows that
there is a clear localization of the Cu element in the nanoparticles, while, the Zn element
seems to be present both in the nanoparticle and around it. Moreover, the EDS spectra shows
that the concentration ratios (CCu/CZn) for a dozen particles in this sample are in the range
from 4 to 16 with an average value close to 9, which agrees with the Cu-Zn alloy composition
estimated by XRD (Cu0.9Zn0.1). The CCu/CZn ratios are in the range from 2 to 4 in a dozen
particles of the DPu CuZn 1:1/TiO2 sample (Figure 4-8c), resulting in an average ratio around
3 in accordance with the Cu3Zn alloy evidenced by XRD. At this point, we can conclude that
the small particles observed by STEM-HAADF in the bimetallic DPu samples possess on
average the same composition as the one evidenced by XRD (Cu0.9Zn0.1 for CuZn 3:1/TiO2
and Cu3Zn alloy for CuZn 1:1/TiO2). For DP8 samples, the Zn element cannot be detected in
the very small particles (~2 nm) of DP8 CuZn 1:1/TiO2 sample (Figure 4-8e). However, one
larger particle (~5 nm) in DP8 CuZn 1:1/TiO2 sample was examined by EDS (Figure 4-8f)
resulting in a CCu/CZn ratio around 5. At this stage, we can only assume that the small particles
in DP8 Cu-Zn/TiO2 samples are bimetallic Cu-Zn particles although their composition, which
can be variable, could not be determined.
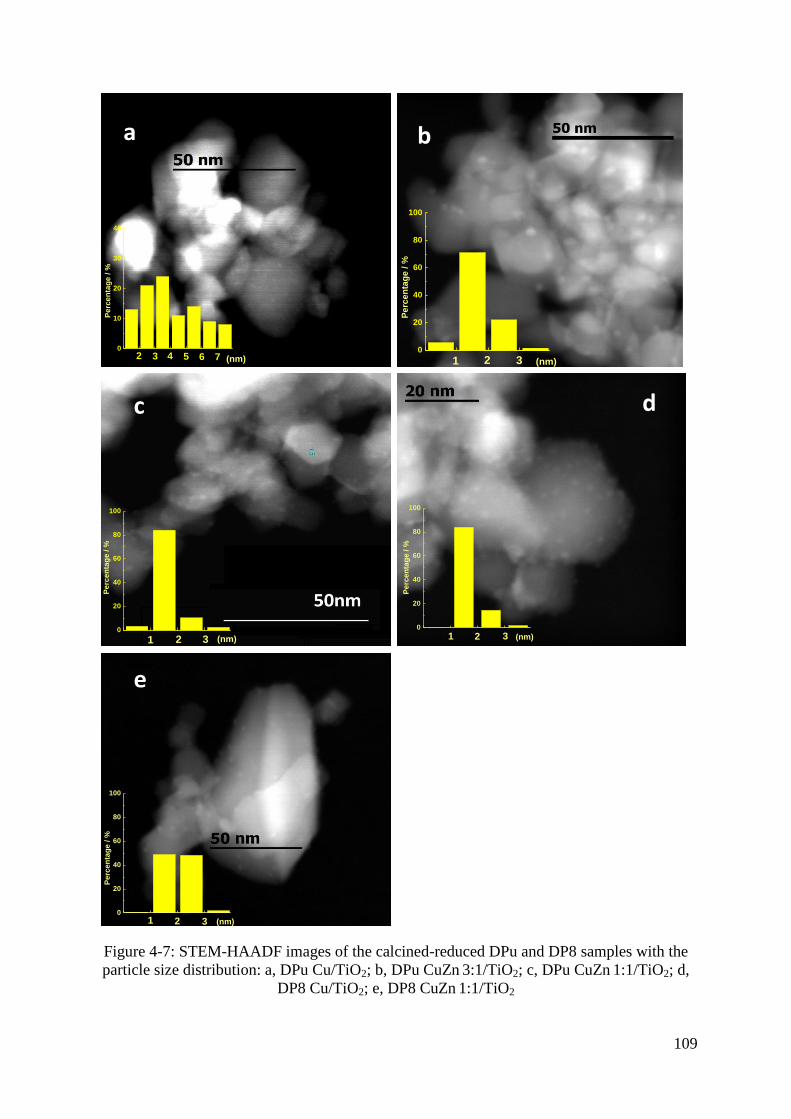
109
0
20
40
60
80
100
(nm)
Perc
en
tag
e / %
1 2 3
e
0
20
40
60
80
100
(nm)32
Perc
en
tag
e / %
1
c
0
20
40
60
80
100
(nm)32
Perc
en
tag
e / %
1
d
a
0
10
20
30
40
76543
Pe
rce
nta
ge
/ %
(nm)2
b
0
20
40
60
80
100
32
Pe
rce
nta
ge
/ %
1 (nm)
Figure 4-7: STEM-HAADF images of the calcined-reduced DPu and DP8 samples with the
particle size distribution: a, DPu Cu/TiO2; b, DPu CuZn 3:1/TiO2; c, DPu CuZn 1:1/TiO2; d,
DP8 Cu/TiO2; e, DP8 CuZn 1:1/TiO2

110
a b
c d
e f
Cu
Cu Zn
Cu
Cu CuZn
25nm
50nm30nm
25nm
30nm
CuZn
20nm
CCu:CZn≈2:1
CCu:CZn≈5:1
CCu:CZn≈9:1
CCu:CZn≈1:-
Figure 4-8: EDS analysis of some particles in the calcined-reduced DPu and DP8 samples: a,
DPu Cu/TiO2; b, DPu CuZn 3:1/TiO2; c, DPu CuZn 1:1/TiO2; d, DP8 Cu/TiO2; e, DP8 CuZn
1:1/TiO2; f, large particle analysis in DP8 CuZn 1:1/TiO2

111
3.9 XPS of ex-situ calcined then reduced mono Cu/TiO2 and bimetallic Cu-Zn/TiO2
catalysts
After reduction under H2 at 350 oC for 2 h, the oxidation state of supported Cu and
Zn were studied by XPS after that the samples were transferred in air into the XPS equipment.
The XPS spectra shown in Figure 4-9A indeed show the partial re-oxidation of copper during
air exposure, since peaks of Cu2+
(BE~934.0 ± 0.2 eV) and of Cu0 (BE~932.0 ± 0.2 eV) are
present for DPu Cu/TiO2 and CuZn 1:1/TiO2 samples. Moreover, it is found that the XPS
intensity ratio of Cu2+
to Cu0 (ICu2+/ICu0) in CuZn 1:1/TiO2 sample is higher than that in the
Cu/TiO2 sample, this could mean that metallic Cu in the CuZn 1:1/TiO2 sample (Cu3Zn alloy
phase) is less stable upon air exposure than that in the Cu/TiO2 sample (Cu phase), which is
not consistent with the UV-visible results (Figure 4-3C, D). However, these differences can
also result from different time of exposure to air for the CuZn 1:1/TiO2 and Cu/TiO2 samples
before XPS characterization, as they were reduced in H2 sequentially with a gap of time
longer than 24 h. Regarding the oxidation state of Zn, the Auger spectrum of Zn LMM
(Figure 4-9B) indicates that both Zn2+
(~498.1 ± 0.2 eV) and metallic Zn0 (~495.0 ± 0.5 eV)
are present in DPu bimetallic CuZn 1:1/TiO2 sample with IZn2+ >> IZn0. It is known that Zn2+
is
the main oxidation state for Zn in the reduced bimetallic CuZn 1:1/TiO2 as only 1/3 of Zn
present in the sample is involved in the Cu3Zn alloy phase formed in this sample, thus 2/3 of
Zn remains on TiO2, and TPR showed that Zn on TiO2 does not reduce at 350 °C (TPR of
Zn/TiO2 in Figure 4-4A). In addition, it is possible that at least part of the metallic Zn alloyed
with Cu was re-oxidized after air exposure. The fact that contributions of metallic Cu and
metallic Zn could be observed in spite of the air contact is in accord with the XRD and EDS
analyses that revealed the presence of bimetallic particles after reduction under H2 at 350 °C.
Moreover, the effect of the addition of Zn to Cu on the electronic property of
metallic Cu can be studied by the analysis of the binding energies (BE) of XPS Cu2p and
Auger of Zn LMM peaks in the monometallic Cu/TiO2 and bimetallic CuZn 1:1/TiO2 samples
(Figure 4-9). The binding energy of metallic Cu in DPu mono Cu/TiO2 (~932.0 ± 0.2 eV) is
similar to the BE (~931.9 ± 0.2 eV) in the CuZn 1:1/TiO2 sample. The binding energy of
metallic Zn0 in the DPu CuZn 1:1/TiO2 shows a weak peak located at ~495.0 ± 0.5 eV, which
does not show big difference from the standard value (494.6 eV). As a result, even though
DFT calculation performed by Wiame et al [53] proposed the existence of a charge transfer
between the Cu and Zn atoms in Cu0.7Zn0.3 brass with a calculated charge of - 0.07 e on Cu

112
atoms and of + 0.19 e on Zn atoms, the difference observed for the XPS Cu2p peak and the
Auger Zn LMM peak are too small to allow us to conclude that a charge transfer exists
between Cu and Zn in DPu CuZn 1:1/TiO2 sample.
955 950 945 940 935 930
931.90933.51
Cu/TiO2
933.99
Inte
nsit
y /
a.u
.
Binding Energy / eV
931.96Cu 2p:CPS
DPU, 2.5wt% Cu loading
CuZn 1:1/TiO2
A
510 505 500 495 490 485
495.02
Inte
nsit
y /
a.u
.
Binding Energy / eV
498.12
CuZn 1:1/TiO2
Zn LMM: CPS
DPU 2.5wt% Cu loading
B
Figure 4-9: A, XPS of Cu 2p level for ex-situ calcined then reduced DPu 2.5wt% Cu, Cu/TiO2
and CuZn 1:1/TiO2; B, Auger spectrum of Zn LMM in CuZn 1:1/TiO2.
4. Catalytic results – Butadiene selective hydrogenation
The catalytic performances of the DPu and DP8 samples are depicted in Figure 4-10
for the temperature programmed reaction (TP-Reaction).

113
Table 4-3: Catalytic properties of DPu and DP8 samples
The monometallic Cu/TiO2 catalysts are the most active, with a temperature of full
conversion of butadiene (T100%) of 75 °C, whatever the preparation method, whereas the
Zn/TiO2 catalyst does not present any activity in the temperature range 30-150 oC (Figure 4-
10A). The introduction of zinc induces a decrease in the activity with respect to the Cu
catalysts, i.e., a higher T100% (up to 120 °C for DPu CuZn 1:1/TiO2), which increases with the
Zn loading. The DP8 Cu-Zn/TiO2 samples present higher activity than the corresponding DPu
catalysts. This can be explained by the smaller particle sizes observed by XRD and STEM-
HAADF for the DP8 catalysts compared to the bimodal size distribution in DPu ones. The
activity (μmolbutadiene s-1
gCu-1
) and TOF (s-1
) of DPu and DP8 samples at 60 oC reported in
Table 4-3 confirm the trends previously described. Note that the TOF values were calculated
from the average particle sizes estimated from STEM-HAADF, which does not take into
account the bimodal size distribution existing for DPu samples. This results in an
underestimation of the TOF for the latter catalysts. Nevertheless, the difference in catalytic
performances between the DPu and DP8 samples shows that the catalysts with smaller and
more homogeneous particle sizes result in higher activity, which clearly reflects a size effect.
This may be assigned to the presence of higher proportion of low coordination sites (corners
and edges) for lower particles sizes which are considered as the active sites for H2
dissociation for Au, Ag or Cu metal particles as underlined in a recent review [54].
Method Catalyst
Average
metal
particle size
(nm, based
on TEM)
Dispersion
(based on
TEM)
Activity at
60 oC
(μmolbutadiene
s-1
gCu)
TOF at
60oC
( ×10-4
s-1
based on
TEM)
1-butene : Trans-
2-butene : Cis-2-
butene at 20-30%
butadiene
conversion (%)
DPu
Cu 3 0.35 27.1 49.8 83 : 7 : 10
CuZn 3:1 2.1 0.5 4.2 6 88 : 6 : 6
CuZn 1:1 1.8 0.58 1 1.5 76 : 5 : 18
DP8
Cu 1.9 0.55 27.8 32.4 87 : 5 : 8
CuZn 3:1 - - 9.2 - 89 : 3 : 8
CuZn 1:1 2.1 0.5 2.9 4.9 80 : 8 : 12
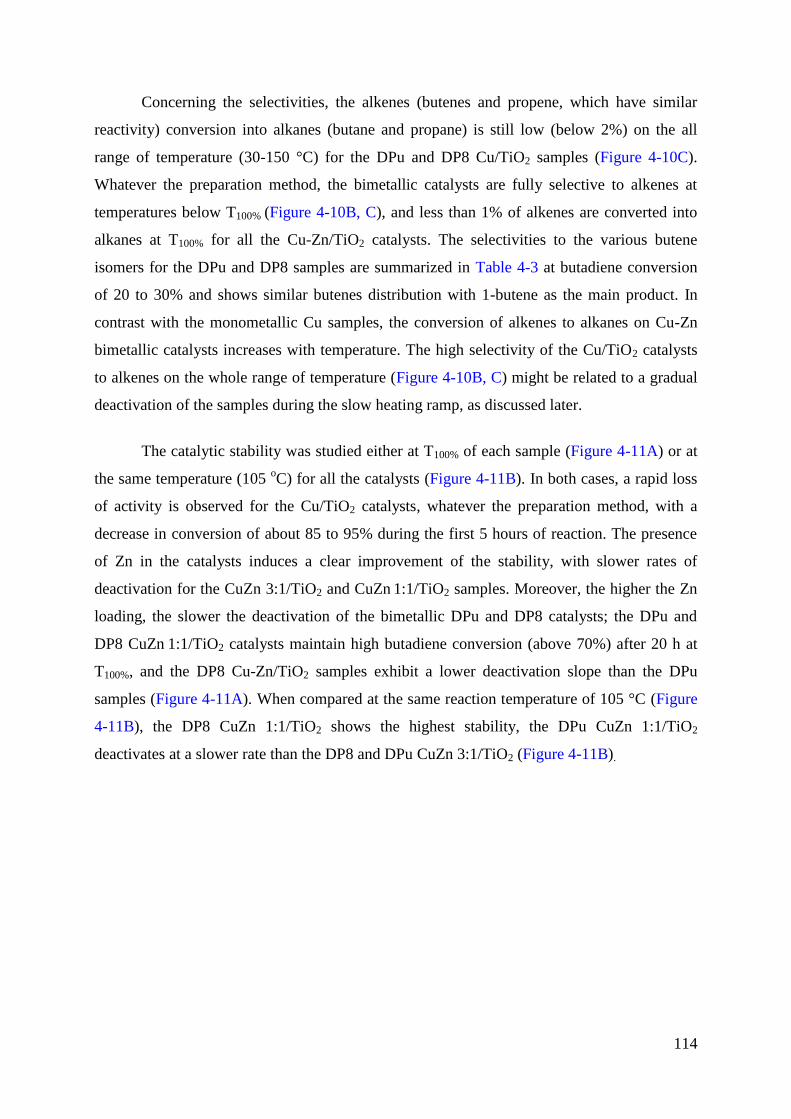
114
Concerning the selectivities, the alkenes (butenes and propene, which have similar
reactivity) conversion into alkanes (butane and propane) is still low (below 2%) on the all
range of temperature (30-150 °C) for the DPu and DP8 Cu/TiO2 samples (Figure 4-10C).
Whatever the preparation method, the bimetallic catalysts are fully selective to alkenes at
temperatures below T100% (Figure 4-10B, C), and less than 1% of alkenes are converted into
alkanes at T100% for all the Cu-Zn/TiO2 catalysts. The selectivities to the various butene
isomers for the DPu and DP8 samples are summarized in Table 4-3 at butadiene conversion
of 20 to 30% and shows similar butenes distribution with 1-butene as the main product. In
contrast with the monometallic Cu samples, the conversion of alkenes to alkanes on Cu-Zn
bimetallic catalysts increases with temperature. The high selectivity of the Cu/TiO2 catalysts
to alkenes on the whole range of temperature (Figure 4-10B, C) might be related to a gradual
deactivation of the samples during the slow heating ramp, as discussed later.
The catalytic stability was studied either at T100% of each sample (Figure 4-11A) or at
the same temperature (105 oC) for all the catalysts (Figure 4-11B). In both cases, a rapid loss
of activity is observed for the Cu/TiO2 catalysts, whatever the preparation method, with a
decrease in conversion of about 85 to 95% during the first 5 hours of reaction. The presence
of Zn in the catalysts induces a clear improvement of the stability, with slower rates of
deactivation for the CuZn 3:1/TiO2 and CuZn 1:1/TiO2 samples. Moreover, the higher the Zn
loading, the slower the deactivation of the bimetallic DPu and DP8 catalysts; the DPu and
DP8 CuZn 1:1/TiO2 catalysts maintain high butadiene conversion (above 70%) after 20 h at
T100%, and the DP8 Cu-Zn/TiO2 samples exhibit a lower deactivation slope than the DPu
samples (Figure 4-11A). When compared at the same reaction temperature of 105 °C (Figure
4-11B), the DP8 CuZn 1:1/TiO2 shows the highest stability, the DPu CuZn 1:1/TiO2
deactivates at a slower rate than the DP8 and DPu CuZn 3:1/TiO2 (Figure 4-11B).

115
Figure 4-10: Evolution of the butadiene conversion (A), the selectivity to butenes (1-butene +
cis-2-butene + trans-2-butene) (B) and the alkenes conversion to alkanes (butane and propane)
(C) as a function of the reaction temperature for reduced monometallic Cu/TiO2, Zn/TiO2 and
bimetallic Cu-Zn/TiO2 samples prepared by different methods (100 mg of catalyst). (Full
symbols for DPu samples, open symbols for DP8 samples)
92
94
96
98
100
Bu
ten
e s
ele
cti
vit
y /
%
Cu
CuZn 3:1
CuZn 1:1
B
0
20
40
60
80
100
Bu
tad
ien
e C
on
ve
rsio
n /
% Zn
Cu
CuZn 3:1
CuZn 1:1
A
DPU: full symbols
DP8: open symbols
30 45 60 75 90 105 120 135 150
0
2
4
6
8
10
Alk
en
es (
bu
ten
es o
r p
rop
en
e)
co
nvers
ion
to a
lkan
es (
bu
tan
e o
r p
rop
an
e)
/ %
Temperature / oC
Cu
CuZn 3:1
CuZn 1 :1
C

116
Figure 4-11: Evolution of the conversion of butadiene with time on stream (A) at T100% (75 °C
for DPu and DP8 Cu/TiO2, 90 °C for DP8 CuZn 3:1/TiO2, 105 °C for DPu CuZn 3:1/TiO2 and
DP8 CuZn 1:1/TiO2 and 120 °C for DPu CuZn 1:1/TiO2) and (B) at 105 °C for the various
DPu and DP8 catalysts. (Full symbols for DPu samples, open symbols for DP8 samples)
It has been previously reported that copper catalysts suffer from strong deactivation
during reactions of alkyne and alkadiene hydrogenation because of the formation of
oligomeric compounds (green oil) [8, 55-58] at moderate reaction temperature. For instance,
the formation of large amount of coke and oligomeric compounds was observed in Cu/Al2O3
catalyst exposed to acetylene/H2 mixture at 250 °C [59]. In our reaction conditions, the
deactivation of the Cu/TiO2 catalyst occurs either in the presence or in the absence of propene
(30%) in the reaction feed, although with a slightly slower rate in the absence of propene (not
shown). This seems to indicate that both reactants, butadiene and propene, are involved in the
deactivation process. It was found above that the addition of zinc strongly improves the
stability of the copper based catalysts in butadiene hydrogenation. Enhanced activity for
supported composite Cu-ZnO catalysts has been widely reported for methanol synthesis,

117
methanol steam reforming and water-gas shift reactions by comparison with Cu supported on
Al2O3 [13, 14, 60, 61]. Among several explanations, the formation of a Cu-Zn alloy was
frequently claimed as a possible cause for the enhancement of activity [11, 13, 61, 62].
Moreover, in the case of Al2O3-supported Pd catalysts, the introduction of Zn was reported to
limit carbonaceous formation during selective hydrogenation of acetylene [63]. However, the
beneficial effect of Zn was ascribed to the reduction of the number of acidic sites on the
alumina surface by the presence of ZnO rather than to the formation of a Pd-Zn alloy. It is
worth to mention that the composition of the Cu-Zn alloys determined by XRD and EDS
reveals that only a fraction of zinc was alloyed with copper, implying that an another fraction
was still present on the support surface under an unidentified form, as the presence of ZnO
was not evidenced.
The thermogravimetric (TG) analysis of the samples after stability test at 105 oC for 20
h was performed under air up to 450°C. Figure 4-12 shows a weight loss in all of the samples,
but it is weaker on the Cu-Zn/TiO2 samples than on monometallic Cu/TiO2. Around 2.5%,
1.25% and 0.47% mass was lost for the DPu Cu/TiO2, CuZn 3:1/TiO2 and CuZn 1:1/TiO2
samples and 2.6%, 1.75% and 0.5% mass for the DP8 Cu/TiO2, CuZn 3:1/TiO2 and CuZn
1:1/TiO2 samples, respectively. The loss weight mainly occurs between 200 and 350 °C, in
the same temperature range as the one observed after selective hydrogenation of acetylene
over Cu/SiO2 [64]. In the latter study, the weight loss was mainly attributed to the oxidation
or decomposition of the foulant or green oil i.e., C6 to C10 olefinic and aromatic compounds
that accumulated on the catalytic surface during hydrogenation run, while the weight change
from the oxidation of copper becomes negligible. Even though the bimetallic catalysts have
relative smaller (DPu samples) or similar particle size (DP8 samples) to the corresponding
metallic Cu based samples (bimodal size distribution in the DPu sample, and uniform small
particle size in DP8 sample), the formation of Cu-Zn alloy particles seem to limit the
formation of the oligomers resulting in higher catalytic stability than metallic Cu.

118
150 200 250 300 350 400 45095
96
97
98
99
100
DPu CuZn 1:1 /TiO2 C400R350
Re
lati
ve
we
igh
t / %
Temperature / oC
Cu
Cu Zn 3:1
Cu Zn 1:1
DP8
DPU
Figure 4-12: TG analysis of the DPu and DP8 samples after 20 h stability test at 105
oC. The
freshly reduced DPu CuZn 1:1/TiO2 was taken as a reference.
In the case of the supported Cu-Zn catalysts, with Cu atoms replaced by Zn ones, the
formation of Cu-Zn alloy might change the surface geometry of Cu crystal resulting in a
decrease of the Cu surface ensemble. Jung et al [47] observed that the copper surface area
decreased after alloying with zinc. Since the Zn/TiO2 catalyst has no activity in the reaction
condition, it is reasonable that the introduction of Zn leads to a decrease in the catalytic
activity. Besides that, the change in the surface composition could also induce changes in the
adsorption mode or strength of the reactants and/or products of the reaction and thus in the
formation of the oligomers species responsible for the deactivation. Indeed, it was recently
shown that the incorporation of Zn into Ni catalysts to form Ni-Zn alloy resulted in a
reduction in carbon-carbon bond formation (oligomerization reaction) during the
hydrogenation of acetylene [65]. This was assigned to a decrease in the adsorption energy and
resultant coverage of acetylene on Ni-Zn catalysts [65]. The positive role of Zn was also
ascribed, in modeling studies [9], to changes in adsorption properties of the reactants resulting
from changes in the electronic properties of Ni in the surface by alloying with Zn. The same
effect might apply to the case of the Cu-Zn system, although the XPS results for the ex-situ
reduced Cu-Zn/TiO2 sample (Figure 4-9) did not clearly evidence any electronic modification

119
of Cu by the existing Zn in the sample, contrary to what was proposed in a recent article
based on DFT calculations, referring to the existence of a charge transfer between the Cu and
Zn atoms in Cu0.7Zn0.3 alloy [53].
In the case of bimetallic Cu-Ni systems, DFT calculations showed that the isolated Cu-
Ni sites showed larger coupling barriers for C-C bond formation than for pure Ni or Cu,
which allowed improving the resistance to oligomers formation during propyne
hydrogenation [66]. The isolation of the active sites was also proposed to play an important
role for avoiding undesired side reactions for other intermetallic compounds, such as
oligomerization, which requires a sufficiently short distance between the coadsorbed
hydrocarbon molecules [67]. A similar geometric effect might take place in the case of our
bimetallic Cu-Zn catalysts.
Apart from the fraction of zinc that is alloyed with copper may inhibit green oil
formation and deactivation, the residual zinc on the TiO2 surface may also modify the acidic
properties of the support surface. The acidic surface site concentrations on the DPu samples
were evaluated by NH3-TPD experiments. The amount of NH3 that desorbed from TiO2
surface was monitored by mass spectrometry with the results shown in Figure 4-13A. The
acidic site concentration on the bare TiO2 support surface is 0.36 mmolNH3 gsample -1
(Figure 4-
13B). It decreased to 0.26 mmolNH3 gsample-1
, when 2.5 wt% Cu was deposited on its surface,
and it is still decreasing when Zn was present into the samples, 0.22 and 0.18 mmolNH3 gsample-
1 for the CuZn 3:1/TiO2 and CuZn 1:1/TiO2 samples, respectively. As the acidic sites on the
support surface could adsorb hydrocarbons and provoke not only isomerisation but also
transformation into coke or C2-C6 hydrocarbons from cracking and disproportionation
reactions [68, 69], the decrease in the number of acidic sites on TiO2 surface could also
account for the more stable catalytic performances of Cu-Zn/TiO2 samples.

120
0 10 20 30 40 50 60 70 80 90 100 110 1200
2
4
6
8
10
TiO2
Cu
Cu Zn 3:1
Cu Zn 1:1
Time / min
NH
In
ten
sit
y *
10
13 /
a,u A
150
200
250
300
350
Tem
pera
ture
/ o
C
0.0
0.1
0.2
0.3
0.4
mm
ol N
H3
/ g
sa
mp
le
TiO2
Cu CuZn 3:1 CuZn 1:1
B
Figure 4-13: NH3 temperature programmed desorption (TPD) profiles for the bare TiO2
support and the DPu Cu, CuZn 3:1 and CuZn 1:1/TiO2 samples after calcination at 400 oC and
reduction at 350 oC: (A) mass spectrometer signal intensity of NH fragment (m/z=15) and (B)
amount of NH3 desorbed calculated from the mass spectrometer results.
During the stability test at 105°C, a peculiar behaviour was noticed for the DPu and
DP8 CuZn 1:1/TiO2 catalysts. While a continuous decrease was observed for the butadiene
conversion with time on stream, the propene conversion after a progressive decrease during
the first hours of reaction increased again between 8 and 15 hours of reaction for DPu and
DP8 CuZn 1:1/TiO2, respectively (Figure 4-14). Then, the propene conversion passed through
a maximum before starting to decrease again. Such a behaviour was not observed for the
Cu/TiO2 and CuZn 3:1/TiO2 catalysts up to 20 h of reaction, whatever the preparation
method. In order to interpret such a behaviour, the DPu CuZn 1:1/TiO2 was characterized
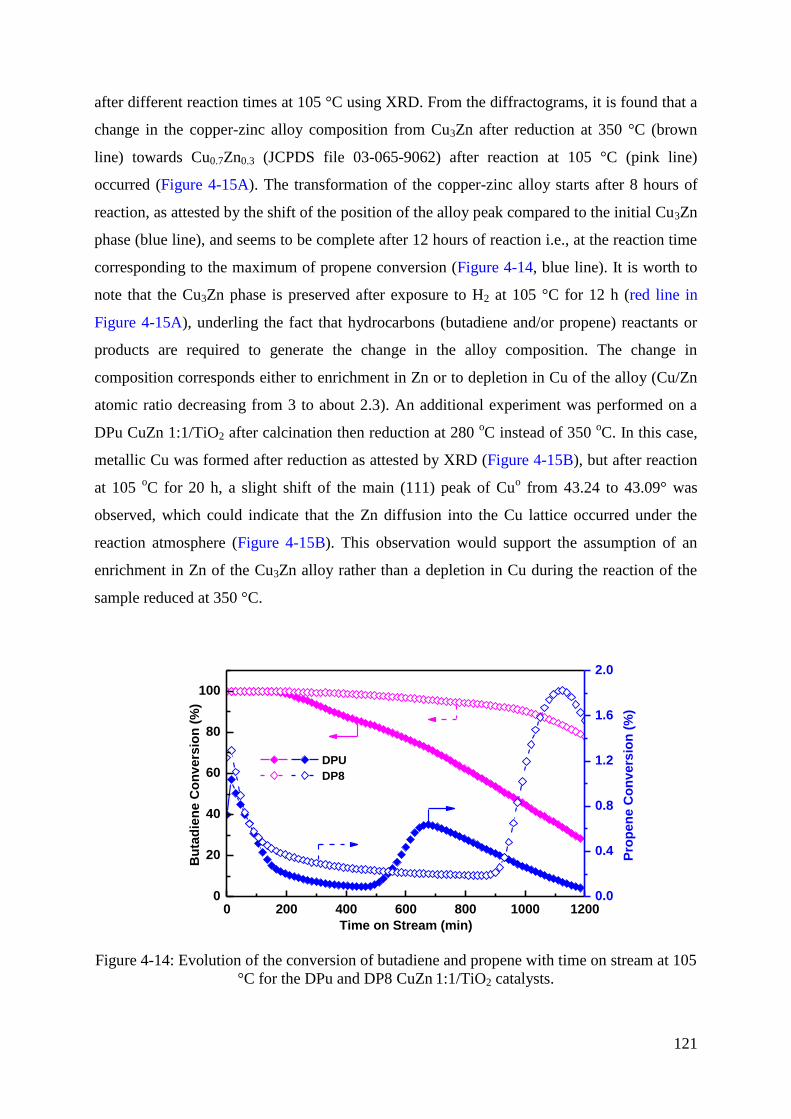
121
after different reaction times at 105 °C using XRD. From the diffractograms, it is found that a
change in the copper-zinc alloy composition from Cu3Zn after reduction at 350 °C (brown
line) towards Cu0.7Zn0.3 (JCPDS file 03-065-9062) after reaction at 105 °C (pink line)
occurred (Figure 4-15A). The transformation of the copper-zinc alloy starts after 8 hours of
reaction, as attested by the shift of the position of the alloy peak compared to the initial Cu3Zn
phase (blue line), and seems to be complete after 12 hours of reaction i.e., at the reaction time
corresponding to the maximum of propene conversion (Figure 4-14, blue line). It is worth to
note that the Cu3Zn phase is preserved after exposure to H2 at 105 °C for 12 h (red line in
Figure 4-15A), underling the fact that hydrocarbons (butadiene and/or propene) reactants or
products are required to generate the change in the alloy composition. The change in
composition corresponds either to enrichment in Zn or to depletion in Cu of the alloy (Cu/Zn
atomic ratio decreasing from 3 to about 2.3). An additional experiment was performed on a
DPu CuZn 1:1/TiO2 after calcination then reduction at 280 oC instead of 350
oC. In this case,
metallic Cu was formed after reduction as attested by XRD (Figure 4-15B), but after reaction
at 105 oC for 20 h, a slight shift of the main (111) peak of Cu
o from 43.24 to 43.09° was
observed, which could indicate that the Zn diffusion into the Cu lattice occurred under the
reaction atmosphere (Figure 4-15B). This observation would support the assumption of an
enrichment in Zn of the Cu3Zn alloy rather than a depletion in Cu during the reaction of the
sample reduced at 350 °C.
0 200 400 600 800 1000 12000
20
40
60
80
100
DPU
DP8
Time on Stream (min)
Bu
tad
ien
e C
on
ve
rsio
n (
%)
0.0
0.4
0.8
1.2
1.6
2.0
Pro
pe
ne
Co
nv
ers
ion
(%
)
Figure 4-14: Evolution of the conversion of butadiene and propene with time on stream at 105
°C for the DPu and DP8 CuZn 1:1/TiO2 catalysts.

122
Figure 4-15: XRD diagrams of (A) the DPu CuZn 1:1/TiO2 catalyst after calcination then
reduction at 350 °C (labeled fresh sample) and after various stages of the reaction at 105 °C;
Cu0.7Zn0.3 alloy peak position from JCPDS: 03-065-9062; (B) the DPu CuZn 1:1/TiO2 catalyst
after calcination then reduction at 280 °C and stability test at 105 °C for 20h.
Besides that, an additional regeneration experiment was also proposed for the
bimetallic Cu-Zn/TiO2 samples, with using a used DP8 CuZn 1:1/TiO2 sample as an example.
The regeneration procedural as follows: after catalytic stability test at 105 oC for 20 h, the
catalysts are regenerated by in situ calcination at 400 oC for 2 h with heating rate 5
oC min
-1
then in situ reduction at 350 oC for 2 h with heating rate 2
oC min
-1. After this thermal
treatment, the catalytic stability at 105 oC was performed on the used DP8 CuZn 1:1 catalyst.
In Figure 4-16, the initial butadiene conversion is around 90%. The catalyst deactivates in the
first 8 h of reaction (butadiene conversion decreased to ~68%), then re-activates in the
following 27 h (butadiene conversion went back to ~90%). After that, the catalytic activity
decreases again to 72% at the end of this experiment (65 h).
stability test for 20h
stability test for 12h
stability test for 8h
fesh sample in H2 at 105
oC for 12h
fesh sample
TiO2
Cu0.7
Zn0.3
Inte
nsit
y / a
.u Cu3Zn
A
40 41 42 43 44 45 46 47 48 49 50 51 52
TiO2
Cu Zn 1:1/TiO
2C400R280
stability at 105 for 20h
Inte
ns
ity
/ a
.u
2 theta
BCu

123
Compare with the catalytic performance of fresh DP8 CuZn 1:1/TiO2 (Figure 4-14),
the regenerated catalyst shows slightly lower initial catalytic activity (butadiene conversion
~90%, instead of 100%). Besides that, similar to the fresh DP8 CuZn 1:1/TiO2, the
concentration of each product (e.g., propane) evolves during the stability test, which
underlines again the dynamic character of the bimetallic CuZn system. These results might
not indicate that the CuZn bimetallic catalysts are suitable for direct application in
purification of alkene streams but the aim of this work is first and foremost fundamental and
explorative and is only intended to demonstrate the potential for using base metals for such
applications. Besides that, the dynamic of bimetallic Cu-Zn system during catalytic reaction
also indicates that such Cu-Zn bimetallic systems are complex, with several possible phases
and compositions existing or co-existing, thus, extensive additional studies are clearly
required to foresee any possible long-term catalytic implementation.
0 2 4 6 8 10 20 25 30 35 40 45 50 55 60 650
20
40
60
80
100
Time / h
Bu
tad
ien
e C
on
vers
ion
/ %
0
1
2
3
4
5
Pro
pen
e c
on
vers
ion
/ %
Figure 4-16: catalytic stability test of the regenerated DP8 CuZn 1:1/TiO2C400R350 at
105 oC for 65 h.
5. Conclusion
In this contribution, TiO2-supported bimetallic Cu-Zn catalysts prepared by deposition
precipitation with urea and deposition-precipitation at pH≈8, were studied in selective
hydrogenation of butadiene. The formation of monometallic copper and copper-zinc alloy
nanoparticles was evaluated by XRD and STEM-HAADF coupled with EDS analysis, two
different particle size ranges (~3 nm and >15 nm) were found in the DPu samples, while

124
smaller particles with uniform particle size (~2 nm) were obtained using the deposition-
precipitation at fixed pH method. Cu3Zn alloy and a Cu-rich alloy (Cu0.9Zn0.1) were formed in
DPu CuZn 1:1/TiO2 and CuZn 3:1/TiO2 samples, respectively, indicating also that part of the
Zn present in the samples was not involved in the formation of alloys. The performances of
the bimetallic Cu-Zn/TiO2 catalysts in the selectivity hydrogenation of butadiene
demonstrated that such non-noble systems have high potential for this type of reaction as they
present only slightly lower activity at moderate temperature, similar selectivity to alkenes and
enhanced stability compared to monometallic Cu/TiO2. Besides that, the DP8 Cu-Zn samples
show similar selectivities to alkenes but higher activity and more stable catalytic
performances than the DPu Cu-Zn ones, which could result from the presence of smaller Cu-
Zn bimetallic particles with uniformed particle sizes in DP8 samples. A decrease of the size of
the Cu ensemble at the surface of the nanoparticles due to alloying with zinc and of the acidic
properties of the TiO2 surface by the residual zinc seems to result in the lowering of the
fouling by carbonaceous species, leading to higher stability of the bimetallic catalysts.
Interestingly, the dynamic behavior of the Cu-Zn alloy structure was evidenced by a
change in the composition of the alloyed phase during the selective butadiene hydrogenation
reaction, from Cu3Zn to Cu0.7Zn0.3 alloy for the DPu CuZn 1:1/TiO2 sample.
This explorative study is intended to demonstrate the potential for using base metals
for application in selective hydrogenation reaction. The various results presented in this work
show that such systems composed of bimetallic nanoparticles are complex, with several
possible phases and compositions co-existing and evolving under reaction conditions. Thus,
extensive additional studies are clearly required to foresee any possible long-term catalytic
implementation.
125
6. References
1. J.W.Hightower, B.Furlong, A.Sarkany, L.Guczi, Studies in Surface Science and
Catalysis, 75 (1993) 2305.
2. A.Sarkany, Applied Catalysis A: General, 165 (1997) 87.
3. I.Y.Ahn, J.H.Lee, S.K.Kim, S.H.Moon, Applied Catalysis A: General, 360 (2009) 38.
4. W. J.Kim, S.H. Moon, Catalysis Today, 185 (2012) 2.
5. Q.Zhanga, J.Li, X.Liu, Q.Zhu, Applied Catalysis A: General, 197 (2000) 221.
6. A.Pachulski, R. Schödel, P. Claus, Applied Catalysis A: General, 400 (2011) 14.
7. Y.Han, D.Peng, Z.Xu, H.Wan, S.Zheng, D.Zhu, Chemical Communications, 49
(2013) 8350.
8. L.Delannoy, G.Thrimurthulu, P.S. Reddy, C.Méthivier, J.Nelayah, B.M.Reddy,
C.Ricolleau, C.Louis, Phys. Chem. Chem. Phys., 16 (2014) 26514.
9. F.Studt, F.Abild-Pedersen, T.Bligaard, R.Z. Sørensen, C.H. Christensen, J.K.
Nørskov, Science, 320 (2008) 1320.
10. Y.Choi, K.Futagami, T.Fujitani, J.Nakamura, Applied Catalysis A: General, 208
(2001) 163.
11. J.Nakamura, T.Uchijima, Y.Kanai, T. Fujitani, Catalysis Today, 28 (1996) 223.
12. Y. Kanai, T. Watanabe, T. Fujitani, T. Uchijima, J. Nakamura, Catalysis letters, 38
(1996) 157.
13. M.Behrens, F.Studt, I.Kasatkin, S.Kühl, M.Hävecker, F.Abild-Pedersen, S.Zande,
F.Girgsdies, P.Kurr, B.L.Kniep, M.Tovar, R.W. Fischer, J.K. Nørskov, R.Schlögl,
Science, 336 (2012) 893.
14. T.Shishido, M.Yamamoto, D.Li, Y.Tian, H.Morioka, M.Honda, T.Sano, K.Takehir
Applied Catalysis A: General, 303 (2006) 62.
15. M. Turcoa, G. Bagnascoa, U. Costantinob, F. Marmottinib, T. Montanaric, G. Ramisc,
G. Buscac, Journal of catalysis, 228 (2004) 43.
16. Handbook, A., Volume 3: Alloy phase diagrams. ASM international, 1992: p. p.780.
17. S.Derrouiche, H. Lauron-Pernot, C. Louis, Chemistry of Materials, 24 (2012) 2282.
18. I.Atake, K.Nishida, D.Li, T.Shishido, Y.Oumi, T.Sano, K.Takehir, Journal of
Molecular Catalysis A: Chemical, 275 (2007) 130.
19. J.A. van Dillen, J.W.G., L.A Hermans, J. van der Meijden, In "Proceedings of the 6th
International Congress on Catalysis" London, 1976.
126
20. G. C. Bond, P.B.W., F.C. Tompkins, Ed., The Chemical Society: London, 1977: p. P
677.
21. J.W.E.Coenen, Reduction of Silica Supported Nickel Catalysts, in Studies in Surface
Science and Catalysis, P.G.P.J. B. Delmon and G. Poncelet, Editors. 1979, Elsevier. p.
89-111.
22. C.Louis, Deposition‐Precipitation Synthesis of Supported Metal Catalysts.
ChemInform, 38 (2007).
23. J.Kragten, Atlas of metal—ligand equilibria in aqueous solution, 1979, Pergamon.
24. C.F. Baes, R.E. Mesmer, The Hydrolysis of cations. 1976: Wiley.
25. Y.I.Sal’nikov, Y.V. Sidorov, K.A. Burkov, Russian Journal of Applied Chemistry, 81
(2008) 1296.
26. C.Chouillet, F.Villain, M.Kermarec, H.Lauron-Pernot, C.Louis, The Journal of
Physical Chemistry B, 107 (2003) 3565.
27. Z.Wang, D.Brouri, S.Casale, L.Delannoy, C.Louis. Journal of catalysis, 340 (2016)
95.
28. H.Iriea, S.Miura, K.Kamiya, K.Hashimoto, Chemical Physics Letters, 457 (2008) 202.
29. H.Irie, K.Kamiya, T.Shibanuma, S.Miura, D.A.Tryk, T.Yokoyama, K.Hashimoto, The
Journal of Physical Chemistry C,113 (2009) 10761.
30. M.Liu, X.Qiu, M.Miyauchi, K.Hashimoto, Chemistry of Materials, 23 (2011) 5282.
31. I. Georgiadou, Ch. Papadopoulou, H. K. Matralis, G. A. Voyiatzis, A. Lycourghiotis,
Ch. Kordulis, The Journal of Physical Chemistry B, 102 (1998) 8459.
32. P.Platanitis, G.D.Panagiotou, K.Bourikas, C.Kordulis, J.L.G. Fierro, A.Lycourghiotis,
Journal of Molecular Catalysis A: Chemical, 412 (2016) 1.
33. H.Yu, H.Irie, Y.Shimodaira, Y.Hosogi, Y.Kuroda, M.Miyauchi, K.Hashimoto, The
Journal of Physical Chemistry C, 114 (2010) 16481.
34. N.L.Dias Filho, Microchimica Acta, 130 (1999) 233.
35. T.Toupance, M. Kermarec, C. Louis, The Journal of Physical Chemistry B, 104
(2000) 965.
36. H.Praliaud, S.Mikhailenko, Z.Chajar, M.Primet, Applied Catalysis B: Environmental,
16 (1998) 359.
37. S.Derrouiche, H. Lauron-Pernot, C. Louis, Chemistry of Materials,24 (2012) 2282.
38. B.Yao, Y. Chan, N. Wang, Applied Physics Letters, 81 (2002) 757.
39. R.Kam, C.Selomulya, R.Amal, J.Scott, Journal of catalysis, 273 (2010) 73.

127
40. F.Arena, K.Barbera, G.Italiano, G.Bonura, L.Spadaro, F.Frusteri, Journal of catalysis,
249 (2007) 185.
41. T.Imoto, Y.Harano, Y.Nishi, S.Masuda, Bulletin of the Chemical Society of Japan, 37
(1964) 441.
42. S.Lew, A.F. Sarofim, M. Flytzani-Stephanopoulos, Chemical Engineering Science, 47
(1992) 1421.
43. M.Liang, W. Kang, K. Xie, Journal of Natural Gas Chemistry, 18 (2009) 110.
44. M.A. Valenzuelaa, P. Boschb, J. Jiménez-Becerrillc, O. Quiroza, A.I. Páez, Journal of
Photochemistry and Photobiology A: Chemistry, 148 (2002) 177.
45. C.S.Chen, J.H.You, J.H.Lin, Y.Y.Chen, Catalysis Communications, 9 (2008) 2381.
46. X.Shi, Bull Korean Chem Soc, 35 (2014) 141.
47. K.D.Jung, O. S. Joo, S. H. Han, Catalysis letters, 68 (2000) 49.
48. J.-D.Grunwaldt, A.M.Molenbroek, N.-Y.Topsoe, H.Tposoe, B.S.Clausen, Journal of
catalysis, 194 (2000) 452.
49. Pearson, W.B., A handbook of lattice spacings and structures of metals and alloys.
1967. p.601.
50. H.H.Huang, F.Q.Yan, Y.M.Kek, C.H.Chew, G.Q.Xu, W.Ji, P.S.Oh, S.H.Tang,
Langmuir, 13 (1997) 172.
51. G.G.Condorelli, L.L.Costanzo, I.L.Fragalà, S.Giuffrida, G.Ventimiglia, Journal of
Materials Chemistry, 13 (2003) 2409.
52. K.L. Kelly, K. Yamashita, The Journal of Physical Chemistry B, 110 (2006) 7743.
53. F.Wiame, M.M.Islam, B.Salgın, J.Światowska, D.Costa, B.Diawara, V.Maurice,
P.Marcus, Surface Science, 644 (2016) 148.
54. G.Vilé, D.Albani, N.Almora-Barrios, N.Lopez, J.Perez-Ramirez, ChemCatChem, 8
(2016) 21.
55. R.A.Koeppel, J.T.Wehrli, M.S.Wainwright, D.L.Trimma, N.W.Cant, Applied
Catalysis A: General, 120 (1994) 163.
56. J.T. Wehrli, D.J. Thomas, M.S. Wainwright, D.L. Trimm, Applied Catalysis, 66(1990)
199.
57. N.J.Ossipoff, N.W. Cant, Journal of catalysis, 148 (1994) 125.
58. B.Bridier,D.Karhanek, J.Perez-Ramirez, N.lopez, ChemCatChem, 4 (2012) 1420.
59. G.Kyriakou, J.Kim, M.S.Tikhov, N.Macleod, R.M. Lambert, The Journal of Physical
Chemistry B, 109 (2005) 10952.

128
60. D.Jingfa, S.Qi, Z. Yulong, C. Songying, W.Dong, Applied Catalysis A: General, 139
(1996) 75.
61. K.V.Bussche, G. Froment, Journal of catalysis, 161 (1996) 1.
62. T. Fujitani, J. Nakamura, Applied Catalysis A: General, 191 (2000) 111.
63. S.Chinayon, O.Mekasuwandumrong, P.Praserthdam, J.Panpranot, Catalysis
Communications, 9 (2008) 2297.
64. M.R. Stammbach, D.J. Thomas, D.L. Trimm, M.S. Wainwright, Applied Catalysis, 58
(1990) 209.
65. C.S. Spanjers, J.T.Held, M.J.Jones, D.D.Stanley, R.S. Sim, M.J.Janik, R. M.Rioux,
Journal of catalysis, 316 (2014) 164.
66. B.Bridier, N. López, J. Pérez-Ramírez, Dalton Transactions, 39 (2010) 8412.
67. M.Krajčí, J. Hafner, ChemCatChem, 8 (2016) 34.
68. P.Berteau, S. Ceckiewicz, B. Delmon, Applied Catalysis, 31 (1987) 361.
69. M.D.Argyle, C.H. Bartholomew, Catalysts, 5 (2015) 145.

Chapter 5: Synthesis of TiO2 supported Ni-Zn bimetallic catalyst
for selective hydrogenation of 1,3-butadiene in the presence of an
excess of propene

Chapter 5: Synthesis of TiO2 supported Ni-Zn bimetallic catalyst for selective
hydrogenation of 1,3-butadiene in the presence of an excess of propene ........................ 130
1. Introduction .................................................................................................................... 130
2. Catalysts preparation ...................................................................................................... 132
3. Results and discussion .................................................................................................... 133
3.1 Deposition behaviour of Ni2+
and Zn2+
onto TiO2 during sample preparation ........ 133
3.2 TPR of calcined 0.5wt% Ni-Zn/TiO2 samples ......................................................... 135
3.3 Thermal stability of Zn under H2 atmosphere .......................................................... 136
3.4 XRD of calcined then reduced 0.5wt% Ni-Zn/TiO2 samples .................................. 137
3.5 STEM-HAADF coupled with EDS .......................................................................... 138
3.6 Selective hydrogenation of Butadiene in an excess of propene ............................... 143
3.6.1 Activity and selectivity....................................................................................... 143
3.6.2 Stability and regeneration ................................................................................... 146
4. Conclusion ...................................................................................................................... 153
5. Reference ........................................................................................................................ 155

130
Chapter 5: Synthesis of TiO2 supported Ni-Zn bimetallic catalyst
for selective hydrogenation of 1,3-butadiene in the presence of an
excess of propene
1. Introduction
Through density functional theory calculations (DFT), Studt et al [1] predicted that Ni-
Zn systems could be an interesting alternative to palladium ones. In addition, they also
showed experimentally that the addition of Zn to Ni/MgAl2O4 resulted in a lower ethane
formation than in monometallic Ni/MgAl2O4 during selective hydrogenation of acetylene, but
the paper does not contain any information about the possible Ni-Zn alloy formation and the
Ni-Zn catalysts stability. On the other hand, Spanjers et al [2] studied bulk intermetallic Ni-Zn
compounds (Ni4Zn, Ni1Zn1 and Ni5Zn21 alloys) for selective acetylene hydrogenation in
excess of ethylene, and also found that zinc inclusion into nickel catalysts could reduce the
oligomerization reaction that resulted in a higher ethylene selectivity, but no catalytic activity
and stability were reported in the paper. Thus, the type of supported Ni-Zn nanoalloy formed
after reduction and the catalytic properties of supported Ni-Zn nanoalloy for alkyne or
alkadiene selective hydrogenation need to be further studied.
The study of the catalytic properties of the 0.5 wt% Ni/TiO2 catalysts in Section 5 of
Chapter 3 indicated that metallic Ni is very active with 100% butadiene conversion at RT
even after catalyst dilution, rather highly selective to butenes (Figure 3-23, in Chapter 3), but
low catalytic stability for butadiene selective hydrogenation. In comparison with Ni/TiO2 (i.e.,
metallic Ni), 0.5 wt% Ni/ZnO catalysts, which formed Ni1Zn1 alloy particles after reduction at
temperature higher than 280 oC, showed lower activity (higher T100%, but the particle size
were also clearly much larger), similar selectivity to butenes and still lower stability.
Similarly, another work on ZnO and SiO2 supported Ni catalysts performed by Spanjers et al
[3] for selective acetylene hydrogenation in excess of ethylene reaction also showed that
Ni/ZnO catalysts containing supported Ni4Zn1 alloy and Ni1Zn1 alloy after sample reduction
displayed a lower activity and selectivity to ethylene than Ni/SiO2 (metallic Ni). These results
are in disagreement with the results of the calculations performed by Studt et al. [1]
mentioned above. Moreover, in the study about ZnO and SiO2 supported Ni catalysts,
Spanjers et al attributed the low activity and selectivity to ethylene of ZnO supported Ni-Zn
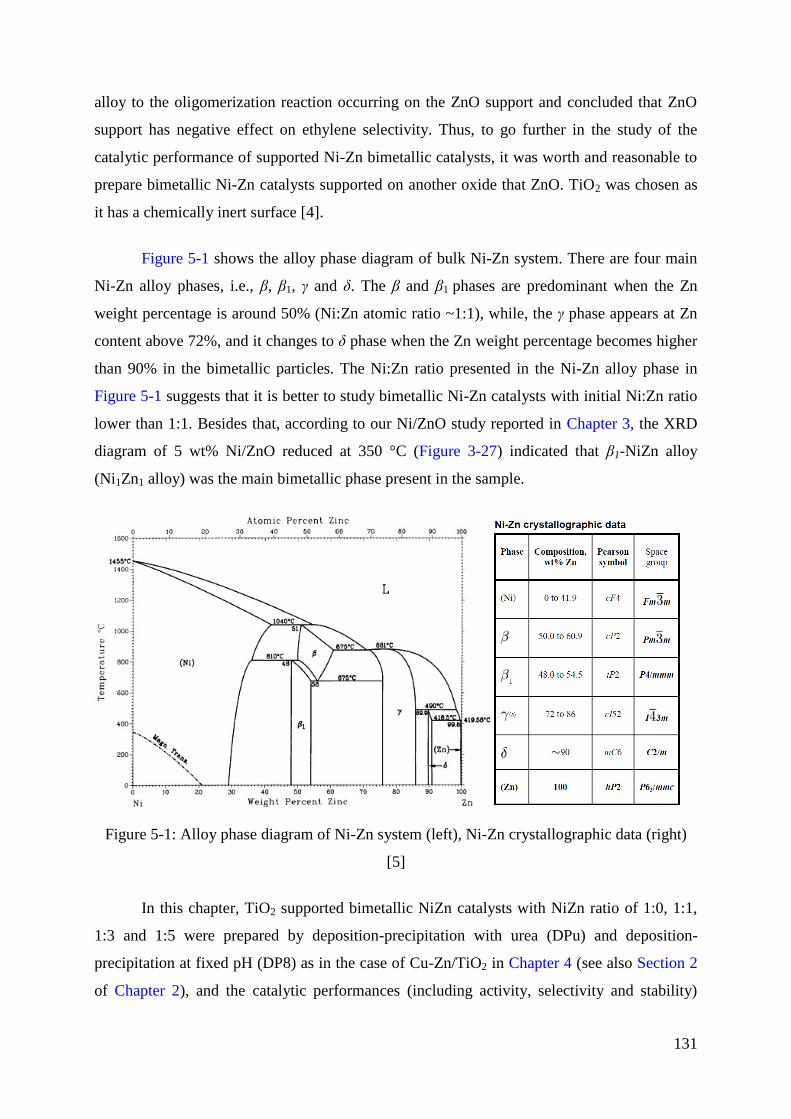
131
alloy to the oligomerization reaction occurring on the ZnO support and concluded that ZnO
support has negative effect on ethylene selectivity. Thus, to go further in the study of the
catalytic performance of supported Ni-Zn bimetallic catalysts, it was worth and reasonable to
prepare bimetallic Ni-Zn catalysts supported on another oxide that ZnO. TiO2 was chosen as
it has a chemically inert surface [4].
Figure 5-1 shows the alloy phase diagram of bulk Ni-Zn system. There are four main
Ni-Zn alloy phases, i.e., β, β1, γ and δ. The β and β1 phases are predominant when the Zn
weight percentage is around 50% (Ni:Zn atomic ratio ~1:1), while, the γ phase appears at Zn
content above 72%, and it changes to δ phase when the Zn weight percentage becomes higher
than 90% in the bimetallic particles. The Ni:Zn ratio presented in the Ni-Zn alloy phase in
Figure 5-1 suggests that it is better to study bimetallic Ni-Zn catalysts with initial Ni:Zn ratio
lower than 1:1. Besides that, according to our Ni/ZnO study reported in Chapter 3, the XRD
diagram of 5 wt% Ni/ZnO reduced at 350 °C (Figure 3-27) indicated that β1-NiZn alloy
(Ni1Zn1 alloy) was the main bimetallic phase present in the sample.
Figure 5-1: Alloy phase diagram of Ni-Zn system (left), Ni-Zn crystallographic data (right)
[5]
In this chapter, TiO2 supported bimetallic NiZn catalysts with NiZn ratio of 1:0, 1:1,
1:3 and 1:5 were prepared by deposition-precipitation with urea (DPu) and deposition-
precipitation at fixed pH (DP8) as in the case of Cu-Zn/TiO2 in Chapter 4 (see also Section 2
of Chapter 2), and the catalytic performances (including activity, selectivity and stability)

132
were evaluated in the selective hydrogenation of butadiene in the presence of an excess of
propene. Specific attention was paid to the characterization of the composition of Ni-Zn
nanoalloy particles. This chapter will describe:
- The deposition behavior of Ni and Zn on titania as a function of pH and time
during bimetallic Ni-Zn preparation by DPu and DP8;
- The effect of the addition of Zn on the reduction behavior of supported Ni;
- The characterization of Ni-Zn nanoalloy after sample calcination and reduction by
XRD and STEM-HAADF coupled with EDS techniques;
- The influence of alloying Ni with Zn on the catalytic activity, selectivity and
stability performances for the butadiene selective hydrogenation reaction;
2. Catalysts preparation
Monometallic Ni/TiO2 and bimetallic Ni-Zn/TiO2 catalysts were prepared using the
method of deposition-precipitation with urea (DPu) as described in Section 2 of Chapter 2, so
as to reach a nickel loading of 0.5 or 2.5 wt%. Briefly, after filling a double wall reactor with
300 ml distilled water, then adding 3 g of supports (TiO2 P25 Evonik, 50 m2 g
-1), the reactor
was heated to 80 oC by water heating system. Then, the appropriate amount of Ni(NO3)2•
6H2O and/or Zn(NO3)2•6H2O precursors were added into the reactor to achieve the desired
nominal nickel and zinc loadings (i.e., 0.5 or 2.5 wt% Ni loading with Ni:Zn atomic ratios of
1:0, 1:1, 1:3 and 1:5). Meanwhile, urea was added to achieve a urea to metal molar ratio of ca.
100. After that, the mixture was kept at 80 °C in a closed reactor for 20 h under continuous
stirring. Finally, the solid samples were separated from the liquid by centrifugation and
subsequently washed with distilled water and centrifuged (three times). All of the samples
were further dried under vacuum at room temperature (RT) for 24 h (as-prepared sample).
The procedure for sample preparation by deposition-precipitation at a fixed pH of 8
(see Section 3 of Chapter 2) is as follows: 3 g of TiO2 support was dispersed into 250 mL
distilled water in beaker at room temperature, and the pH of TiO2 suspension was adjusted to
~8 using 0.5 M NaOH solution. A 50 mL aqueous solution containing appropriate amounts of
Ni(NO3)2•6H2O and/or Zn(NO3)2•6H2O precursors, corresponding to 0.5 or 2.5 wt% Ni
loading with the desired Ni:Zn atomic ratio of 1:0, 1:1 and 1:3, was added into the TiO2
solution in 30 min. During the injection of the Ni/Zn aqueous solution, the pH of the mixture

133
was kept at ~8 by addition of 0.5 M NaOH solution. After stirring for 4 h, the solid samples
were collected by centrifugation and subsequently washed with distilled water and
centrifuged (three times) and dried under vacuum at room temperature (RT) for 24 h.
The kinetics of Ni2+
and Zn2+
deposition during sample preparation by DPu and DP8
were studied by extracting the solid powder from 30-40 mL of suspension out of the reactor at
different pHs (DPu) or time (DP8) during the preparation followed by washing, centrifugation
and drying under vacuum at RT.
Before characterization or catalytic reaction, the catalysts were calcined at 400 °C for
2 h after sample heating with a rate of 5 °C min−1
, under flowing air (100 mL min−1
) then
reduced at a plateau of 450 °C for 2 h with a heating rate of 3 °C min−1
, under flowing pure
H2 (100 mL min−1
).
3. Results and discussion
3.1 Deposition behaviour of Ni2+
and Zn2+
onto TiO2 during sample preparation
During DPu preparation of Ni-Zn/TiO2 with a nominal loading of 2.5 wt% Ni and 2.5
wt% Zn, i.e., a Ni:Zn ratio =1:1, the pH of the suspension increases gradually and uniformly
at 80 oC as the result of urea decomposition [6]. As a consequence, the evolution of the nickel
and zinc loadings with pHs was explored for nominal metals loadings of 2.5 wt%. Figure 5-
2A shows that Zn2+
ions deposition occurs at pH lower than for Ni2+
ions. Zn2+
deposition
mainly occurs at pH between 4.5 and 6.5, while the Ni2+
deposition seems to start at pH
around 5.5 and to become significant at pH above 6.0. This sequential deposition could be
explained by the lower solubility of Zn(OH)2 (4.1×10⁻¹⁷
) than that of Ni(OH)2 (5.5×10⁻¹⁶
) at
room temperature [7].
For the sample prepared by deposition-precipitation at pH 8 at room temperature,
Figure 5-2B shows that Ni and Zn ions were simultaneously deposited on the TiO2 surface.
The Ni and Zn loadings on TiO2 were around 1.8 wt% for each, after 30 min of stirring,
which may correspond to the limitation of the adsorption capacity of TiO2 surface. Based on
the density of TiO-0.35
(i.e., ~5.5 site nm-2
) and Ti2O-0.6
(i.e., ~0.5 site nm-2
) at pH = 8 , given
by Panagiotou et al [8], one can calculate that the total amount of negatively charged sites (i.e.,
9×10²⁰
in 3 g TiO2) roughly corresponds to the loading of 1.8 wt% Ni and Zn ions. Then the

134
metal loadings increase during the following 3 h stirring may result from the deposition and
nucleation growth. Finally, the metal loadings almost remain constant with extending reaction
time in solution from 4 h to 20 h.
3.0 3.5 4.0 4.5 5.0 5.5 6.0 6.5 7.0 7.5 8.0
0.0
0.5
1.0
1.5
2.0
2.5
Ni
Meta
l lo
ad
ing
/ w
t%
Final pH of DPU
Zn
A
0 1 2 3 4 5 6 19 200.0
0.5
1.0
1.5
2.0
2.5
Meta
l lo
ad
ing
/ %
Time / h
Ni
Zn
B
Figure 5-2: Preparation of Ni-Zn/TiO2 catalysts with Ni:Zn ratio =1:1 and nominal loadings:
2.5 wt% Ni and 2.5 wt% Zn: Evolution of the Ni and Zn loadings on titania versus pH during
the DPu (A) and versus time during DP8 (B).
Considering the high catalytic activity of metallic Ni for the selective hydrogenation of
butadiene, the Ni loading had to be lowered to 0.5 wt% in the catalysts for the catalytic tests.
The metals loadings in the as-prepared Ni and Ni-Zn samples are summarized in Table 5-1,
which shows that the final Ni loadings are close to the nominal ones. One can note that the Zn
loadings were always lower than the nominal ones in both types of preparation, as also shown
in Figure 5-2 for higher metal loadings. This might result from a systematic error arising from
the XRF analyses as the membrane used in the sample holder for XRF analysis contains some
zinc element.
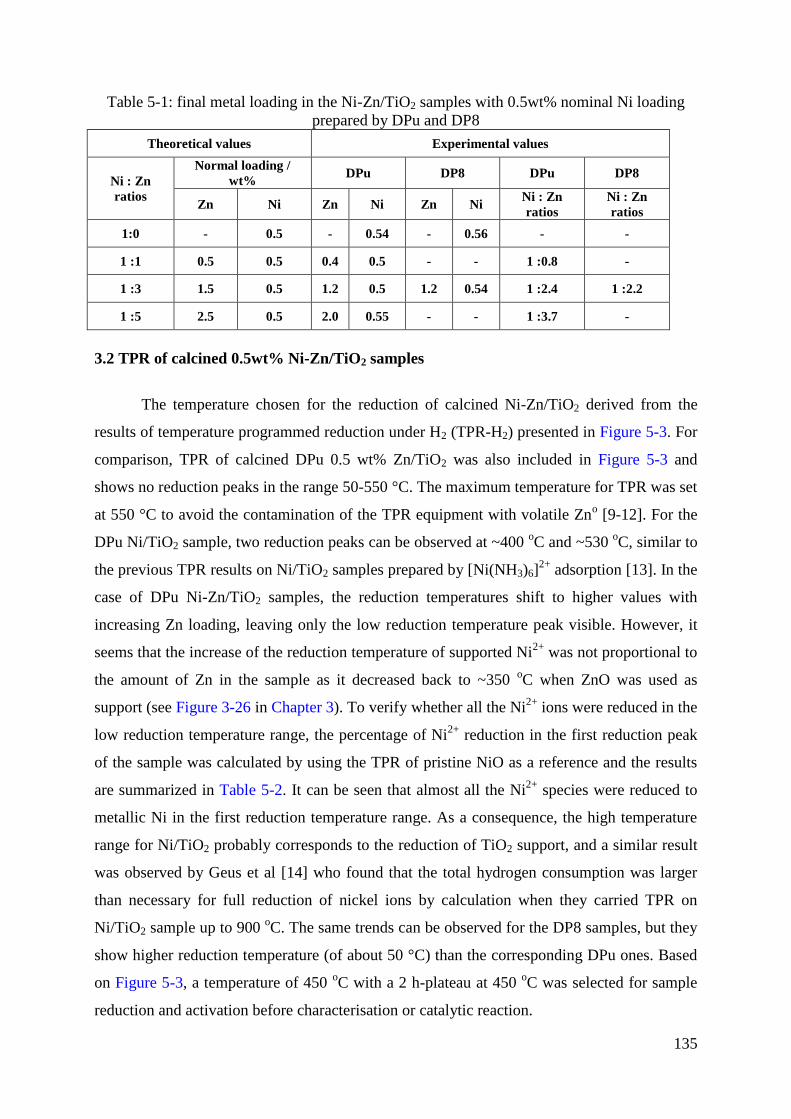
135
Table 5-1: final metal loading in the Ni-Zn/TiO2 samples with 0.5wt% nominal Ni loading
prepared by DPu and DP8
Theoretical values Experimental values
Ni : Zn
ratios
Normal loading /
wt% DPu DP8 DPu DP8
Zn Ni Zn Ni Zn Ni Ni : Zn
ratios
Ni : Zn
ratios
1:0 - 0.5 - 0.54 - 0.56 - -
1 :1 0.5 0.5 0.4 0.5 - - 1 :0.8 -
1 :3 1.5 0.5 1.2 0.5 1.2 0.54 1 :2.4 1 :2.2
1 :5 2.5 0.5 2.0 0.55 - - 1 :3.7 -
3.2 TPR of calcined 0.5wt% Ni-Zn/TiO2 samples
The temperature chosen for the reduction of calcined Ni-Zn/TiO2 derived from the
results of temperature programmed reduction under H2 (TPR-H2) presented in Figure 5-3. For
comparison, TPR of calcined DPu 0.5 wt% Zn/TiO2 was also included in Figure 5-3 and
shows no reduction peaks in the range 50-550 °C. The maximum temperature for TPR was set
at 550 °C to avoid the contamination of the TPR equipment with volatile Zno [9-12]. For the
DPu Ni/TiO2 sample, two reduction peaks can be observed at ~400 oC and ~530
oC, similar to
the previous TPR results on Ni/TiO2 samples prepared by [Ni(NH3)6]2+
adsorption [13]. In the
case of DPu Ni-Zn/TiO2 samples, the reduction temperatures shift to higher values with
increasing Zn loading, leaving only the low reduction temperature peak visible. However, it
seems that the increase of the reduction temperature of supported Ni2+
was not proportional to
the amount of Zn in the sample as it decreased back to ~350 oC when ZnO was used as
support (see Figure 3-26 in Chapter 3). To verify whether all the Ni2+
ions were reduced in the
low reduction temperature range, the percentage of Ni2+
reduction in the first reduction peak
of the sample was calculated by using the TPR of pristine NiO as a reference and the results
are summarized in Table 5-2. It can be seen that almost all the Ni2+
species were reduced to
metallic Ni in the first reduction temperature range. As a consequence, the high temperature
range for Ni/TiO2 probably corresponds to the reduction of TiO2 support, and a similar result
was observed by Geus et al [14] who found that the total hydrogen consumption was larger
than necessary for full reduction of nickel ions by calculation when they carried TPR on
Ni/TiO2 sample up to 900 oC. The same trends can be observed for the DP8 samples, but they
show higher reduction temperature (of about 50 °C) than the corresponding DPu ones. Based
on Figure 5-3, a temperature of 450 oC with a 2 h-plateau at 450
oC was selected for sample
reduction and activation before characterisation or catalytic reaction.

136
50 100 150 200 250 300 350 400 450 500 550
DPU samples
DP8 samples
TiO2 Reference
Zn/TiO2
NiZn 1:5
NiZn 1:3
NiZn 1:1
Ni
NiZn 1:3
TC
D
Temperature / oC
Ni
Ni loading: 0.5wt%
Figure 5-3: TPR of calcined nickel, zinc and nickel-zinc catalysts supported on TiO2 prepared
by DPu and DP8 method.
Table 5-2: Percentage of reduced Ni2+
calculated from the TPR
Sample
Sample
weight for
TPR / mg
NiO weight
/ mg
integral area
from TPR
data
Reduced NiO
calculated
from TPR /
mg
Percentage
of reduced
Ni2+
Reference NiO 112.5 112.5 647.6 112.5 100%
DPu
Ni 113.5 0.78 3.72 0.65 83%
NiZn 1:1 114.5 0.72 3.91 0.68 94.3%
NiZn 1:3 110.6 0.70 4.47 0.78 111%
NiZn 1:5 101.1 0.71 3.94 0.68 96.8%
DP8 Ni 103.3 0.71 4.30 0.75 105.3%
NiZn 1:3 103.7 0.74 4.03 0.70 95%
3.3 Thermal stability of Zn under H2 atmosphere
Considering the fact that 450 oC is higher than the melting temperature of metallic Zn
(~420 oC, see Figure 5-1), and that Zn content in the Ni-Zn alloy system influences the type of
Ni-Zn alloy phase formation (Figure 5-1) after reduction, thus Zn loading in the sample was
analyzed after sample reduction at 450 oC. Here, DPu NiZn/TiO2 (2.5 wt% Ni) samples with
NiZn ratios 1:3 and 1:5 were used as examples to study the zinc thermal stability after sample

137
reduction at 450 oC (Table 5-3). It can be seen that Zn is stable after sample reduction at 450
oC for 2 h.
Table 5-3: Zn loading in Ni-Zn/TiO2 samples after calcination then reduction
DPu Sample Nominal metal loading / wt% As-prepared / wt% C400R450 a /wt%
NiZn 1:3 2.5 7.5 2.1 5.7 2.2 5.7
NiZn 1:5 2.5 10 2.4 9.9 2.5 10.1
a: C400R450: calcination at 400 oC then reduction at 450
oC for 2 h
3.4 XRD of calcined then reduced 0.5wt% Ni-Zn/TiO2 samples
Figure 5-4 shows the XRD diagrams of DPu and DP8 0.5 wt% Ni-Zn/TiO2 samples
after calcination at 400 oC then reduction at 450
oC, as well as the one of the TiO2 support as a
reference. Only two samples, DPu Ni:Zn 1:5/TiO2 and DP8 Ni:Zn 1:3/TiO2, show an
additional peak (~43.3o) to the ones of the support. According to the study of Ni/ZnO with 5
wt% Ni loading in Section 5 of Chapter 3, this peak could be assigned to the one of Ni-Zn
alloy (~43.3o JCPDS card: # 72-2668), which correspond to β1-NiZn alloy with ~50 at% Ni
(i.e., Ni1Zn1 alloy) [15]. Using the Scherrer’s equation, the Ni-Zn alloy crystallite sizes were
estimated at 5.8 nm for the DPu Ni:Zn 1:5/TiO2 and 8.7 nm for DP8 Ni:Zn 1:3/TiO2. For the
other Ni-Zn/TiO2 samples, the crystallite size of metallic Ni or Ni-Zn alloy may be too small
to be detected by XRD, or it could overlap with the broad TiO2 peak at ~44o. Thus, the exact
composition of the Ni-Zn alloy phase on the TiO2 surface needs to be further identified.
40 41 42 43 44 45 460
1000
2000
3000
4000
5000
Inte
nsit
y / a
,u
2 theta
NiZn 1:5
NiZn 1:3
NiZn 1:1
Ni
TiO2
d=5.8nm
40 41 42 43 44 45 460
500
1000
1500
2000
2500
3000
42 43 44 45 46
NiZn 1:3
Ni
Inte
nsit
y /
a.u
2 theta
TiO2
d=8.7 nmB
Figure 5-4: XRD diagrams of the calcined-reduced DPu (A) and DP8 (B) samples: 1,
Ni/TiO2; 2, NiZn 1:1/TiO2; 3, NiZn 3:1/TiO2 and 4, NiZn 5:1/TiO2 and 5, bare TiO2 support.
◄ Rutile TiO2 (JCPDS: 01-086-0147); ▼NiZn alloy peak position from JCPDS: 01-072-
2668; ○ metallic Ni peak position from JCPDS: 00-004-0850

138
3.5 STEM-HAADF coupled with EDS
The metal nanoparticles in the DPu and DP8 samples were imaged by STEM-HAADF
after calcination at 400 oC then reduction at 450
oC (Figure 5-5). The average particle size
deduced from the particle size distribution was also included in Table 5-4. For DPu 0.5 wt%
Ni/TiO2 sample (Figure 5-5A), small particles were visible with average particle size of ~3.7
nm. The metallic particle size increases when Zn is present in the samples. The average
particle sizes are 3.8, 4.9 and 5.3 nm for the DPu Ni-Zn/TiO2 with Ni:Zn 1:1, 1:3 and 1:5
samples, respectively. Besides the effect of alloying Ni with Zn on the particle size, the
addition of Zn also broadens the size distribution in the DPu Ni-Zn/TiO2 samples, from 1 to 6
nm for Ni:Zn 1:1 and from 1 to 9 nm for Ni:Zn 1:5 sample. The same phenomenon was also
observed for the DP8 Ni:Zn 1:3/TiO2 (6.5 nm) compared to DP8 Ni/TiO2 (4.8 nm), and it
seems that the DP8 method brings larger particle size after sample reduction than the DPu
method.
Since Ni-Zn alloy formation was verified by XRD only for the DPu Ni:Zn 1:5/TiO2
and DP8 Ni:Zn 1:3/TiO2 samples, STEM-HAADF coupled with Energy Dispersive X-ray
spectrometry (EDS) was performed on a series of individual particles in several bimetallic Ni-
Zn/TiO2 samples to determine the Ni:Zn atomic ratios as a function of the nanoparticle size
and the Ni:Zn distribution. The results in Figure 5-6 first show that Ni-Zn alloys (or
intermetallic Ni-Zn compounds) are formed in all the DPu and DP8 samples studied, and that
the average Ni:Zn atomic ratios decrease with increasing Zn loading (from 12:1 in DPu Ni:Zn
1:1/TiO2 to 1.8:1 in the DPu Ni:Zn 1:5/TiO2 sample, Table 5-4). The preparation method does
not seem to have an influence on the Ni:Zn atomic ratio as similar Ni:Zn atomic ratios were
observed in DPu and DP8 Ni:Zn 1:1/TiO2 samples (Table 5-4). It is worth to note that the
composition of the Ni-Zn nanoparticles determined by EDS (Table 5-4) reveals that only a
fraction of zinc present in the various samples was alloyed with nickel, implying that another
fraction was still present on the support surface under an unidentified form, as the presence of
ZnO was not evidenced by XRD (Figure 5-7). Figure 5-6 also shows that the Ni:Zn atomic
ratio increases with the decrease of particle size for all the samples, however the lower
amount of Zn content in the smaller particles (< 3 nm) may result in a lower accuracy of EDS
analysis. Moreover, the EDS analysis reveals that the Ni:Zn atomic ratio (1.1:1) is close to 1
for the larger nanoparticles for DPu Ni:Zn 1:5/TiO2 (~6 nm) and DP8 Ni:Zn 1:3/TiO2 (~9

139
nm), which is in agreement with the presence of the β1-NiZn (Ni1Zn1) alloy phase with ~50
at% Ni identified by XRD.

140
2 3 4 50
10
20
30
40
50
Pe
rce
nta
ge /
%
Particle size / nm 2 3 4 5 6 70
5
10
15
20
25
30
35
Perc
en
tag
e / %
Particle size / nm
1 2 3 4 5 6 7 8 90
5
10
15
20
25
30
Perc
en
tag
e /
%
Particle size / nm
3 4 5 60
10
20
30
40
50
Perc
en
tag
e /
%
Particle size / nm
2 3 4 5 6 7 8 9 100
5
10
15
20
25
30
Pe
rce
nta
ge /
%
Particle size / nm
a b c
fd e
2 3 4 50
10
20
30
40
50
Pe
rce
nta
ge /
%
Particle size / nm
đ = 3.7 nm đ = 3.8 nm đ = 4.9 nm
đ = 5.3 nm đ = 4.8 nm đ = 6.5 nm
20 nm 20 nm 20 nm
20 nm
20 nm20 nm
Figure 5-5: STEM-HAADF images of the calcined-reduced DPu and DP8 samples with the particle size distribution: a, DPu Ni/TiO2; b, DPu
NiZn 1:1/TiO2; c, DPu NiZn 1:3/TiO2; d, DPu NiZn 1:5/TiO2; e, DP8 Ni/TiO2; f, DP8 NiZn 1:3/TiO2

141
Figure 5-6: EDS analysis of some particles in the calcined-reduced DPu and DP8 samples: A, DPu NiZn 1:1/TiO2; B, DPu NiZn 1:3/TiO2; C,
DPu NiZn 1:5/TiO2; D, DP8 NiZn 1:3/TiO2;
2 3 4 5 60
10
20
30
40
50
60
0 5 10 150
20
40
60
Pe
rce
nta
ge
/ %
NiZn atomic ratio
Ni:Z
n a
tom
ic r
ati
o
Particle size / nm
A
4.0 4.5 5.0 5.5 6.0 6.5 7.0 7.50
2
4
6
8
10
0 2 40
20
40
60
Pe
rce
nta
ge
/ %
NiZn atomic ratio
Ni:Z
n a
tom
ic r
ati
o
Particle size / nm
B
2 3 4 5 6 7 8 9 100
2
4
6
8
10
0 1 2 30
20
40
60
Pe
rce
nta
ge
/ %
Ni Zn atomic ratio
Ni:
Zn
ato
mic
ra
tio
Particle size / nm
C
2 3 4 5 6 7 8 9 100
2
4
6
8
10
0 2 4 60
20
40
60
Pe
rce
nta
ge
/ %
NiZn atomic ratio
Ni:
Zn
ato
mic
rati
o
Particle size / nm
D
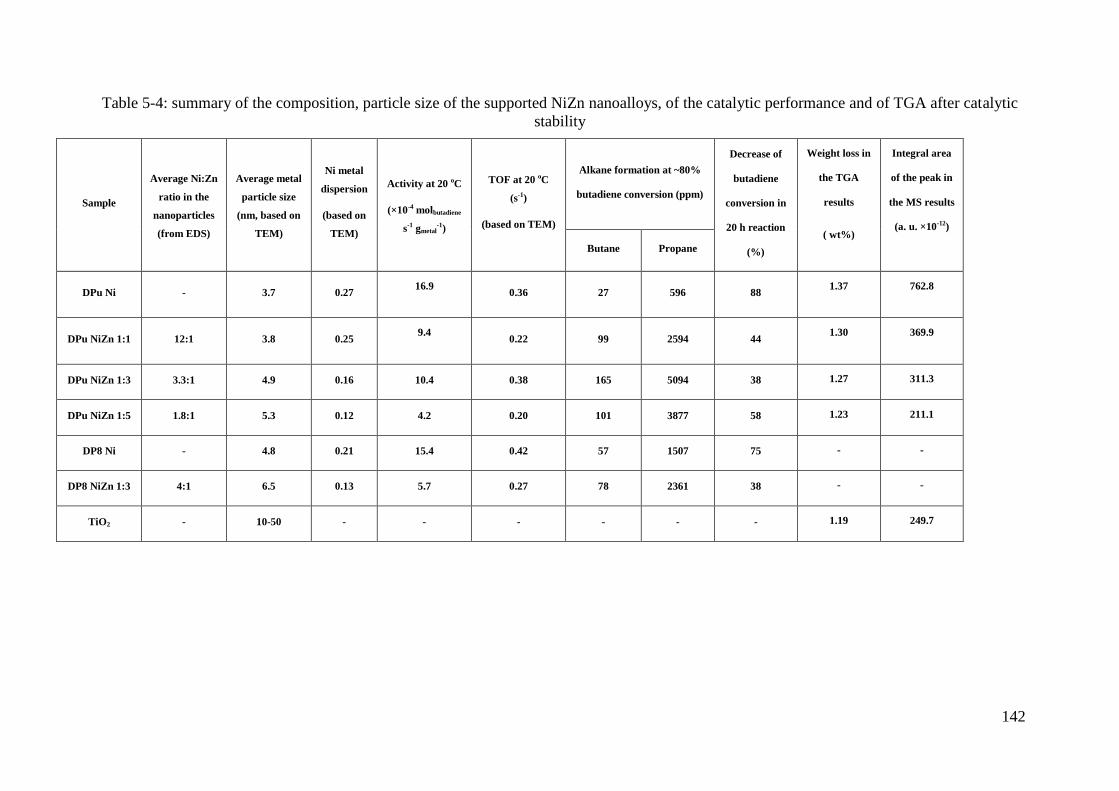
142
Table 5-4: summary of the composition, particle size of the supported NiZn nanoalloys, of the catalytic performance and of TGA after catalytic
stability
Sample
Average Ni:Zn
ratio in the
nanoparticles
(from EDS)
Average metal
particle size
(nm, based on
TEM)
Ni metal
dispersion
(based on
TEM)
Activity at 20 oC
(×10-4 molbutadiene
s-1 gmetal-1)
TOF at 20 oC
(s-1)
(based on TEM)
Alkane formation at ~80%
butadiene conversion (ppm)
Decrease of
butadiene
conversion in
20 h reaction
(%)
Weight loss in
the TGA
results
( wt%)
Integral area
of the peak in
the MS results
(a. u. ×10-12)
Butane Propane
DPu Ni - 3.7 0.27 16.9
0.36 27 596 88 1.37 762.8
DPu NiZn 1:1 12:1 3.8 0.25 9.4
0.22 99 2594 44 1.30 369.9
DPu NiZn 1:3 3.3:1 4.9 0.16 10.4 0.38 165 5094 38 1.27 311.3
DPu NiZn 1:5 1.8:1 5.3 0.12 4.2 0.20 101 3877 58 1.23 211.1
DP8 Ni - 4.8 0.21 15.4 0.42 57 1507 75 - -
DP8 NiZn 1:3 4:1 6.5 0.13 5.7 0.27 78 2361 38 - -
TiO2 - 10-50 - - - - - - 1.19 249.7
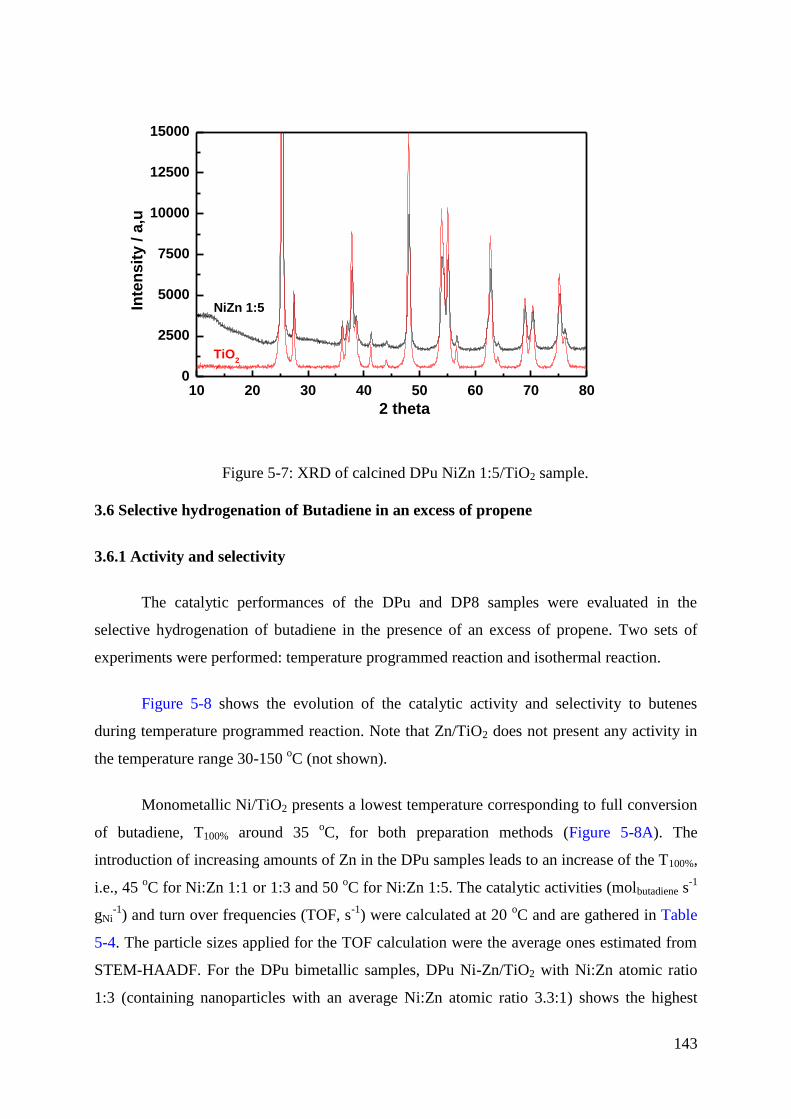
143
10 20 30 40 50 60 70 800
2500
5000
7500
10000
12500
15000
TiO2
Inte
nsit
y / a
,u
2 theta
NiZn 1:5
Figure 5-7: XRD of calcined DPu NiZn 1:5/TiO2 sample.
3.6 Selective hydrogenation of Butadiene in an excess of propene
3.6.1 Activity and selectivity
The catalytic performances of the DPu and DP8 samples were evaluated in the
selective hydrogenation of butadiene in the presence of an excess of propene. Two sets of
experiments were performed: temperature programmed reaction and isothermal reaction.
Figure 5-8 shows the evolution of the catalytic activity and selectivity to butenes
during temperature programmed reaction. Note that Zn/TiO2 does not present any activity in
the temperature range 30-150 oC (not shown).
Monometallic Ni/TiO2 presents a lowest temperature corresponding to full conversion
of butadiene, T100% around 35 oC, for both preparation methods (Figure 5-8A). The
introduction of increasing amounts of Zn in the DPu samples leads to an increase of the T100%,
i.e., 45 oC for Ni:Zn 1:1 or 1:3 and 50
oC for Ni:Zn 1:5. The catalytic activities (molbutadiene s
-1
gNi-1
) and turn over frequencies (TOF, s-1
) were calculated at 20 oC and are gathered in Table
5-4. The particle sizes applied for the TOF calculation were the average ones estimated from
STEM-HAADF. For the DPu bimetallic samples, DPu Ni-Zn/TiO2 with Ni:Zn atomic ratio
1:3 (containing nanoparticles with an average Ni:Zn atomic ratio 3.3:1) shows the highest

144
catalytic activity (TOF), similar to monometallic Ni and higher than Ni-Zn/TiO2 catalysts
with Ni:Zn ratio 1:1 and 1:5. These results are in agreement with the calculation prediction
from Studt et al [1], e.g., which showed that Ni3Zn1 alloy was expected to be more active than
monometallic Ni, Ni1Zn1 alloy and Ni1Zn3 alloy. In the case of DP8 samples, the Ni:Zn
1:3/TiO2 (average Ni:Zn EDS ratio close to 4) catalyst shows slightly higher T100% and is less
active than the monometallic Ni/TiO2 catalyst, and it also show lower activity than that of
DPu Ni:Zn 1:3/TiO2. The lower catalytic activity of DP8 catalysts might be caused by the
rather larger particle size (Table 5-4). Moreover, it is also found that Ni-Zn/TiO2 samples,
whatever the Ni:Zn atomic ratio, have higher catalytic activity than Ni/ZnO after reduction at
450 oC for 2 h, which showed a catalytic activity ~1×10
-4 molbutadiene s
-1 gNi
-1 and TOF of 0.14
s-1
. The lower activity of the Zn-containing catalysts compared to Ni counterparts is in line
with what was previously observed for Ni-Zn systems in selective hydrogenation reactions [2,
16]. For acetylene hydrogenation, such a decrease in activity was ascribed to the decrease of
the acetylene adsorption energy on the Ni-Zn intermetallic compounds [2], which would
result from the substitution of Ni atoms by Zn ones at the surface of the bimetallic
nanoparticles. It has been confirmed by Bond et al [17] that alkynes and diolefins
chemisorption on Ni have a comparable strength as on Pd. Ni substitution by a second metal,
Zn in [1] and Pt in [18], was proposed to modify the electronic properties of surface Ni atoms
and thus the strength of adsorption of reactants [17]. It was also proposed recently that Zn
atoms prefer to replace the Ni atoms at low coordination sites (corners, edges or defects) of
the particles surface [19, 20]. As the low coordination Ni sites are expected to bind
unsaturated compounds more strongly than more coordinated sites [21], their replacement by
Zn atoms could also contribute to the lower activity of bimetallic samples.
For this kind of reaction of semi-hydrogenation of poly-unsaturated hydrocarbons in
the presence of an excess of alkene, the catalytic selectivity can be considered either from the
side of the selectivity to butenes (Figure 5-8B) or from the side of the concentration of alkane
(butane and propane) formed (Figure 5-8C). Figure 5-8B shows that all the catalysts exhibit a
progressive decrease of the selectivity to butenes as the reaction temperature increases and
before T100% is reached, which is similar to what was observed for Ni/ZnO catalyst (Figure 3-
29 in Chapter 3). This trend is more pronounced for the Ni-Zn/TiO2 samples, which means
that they are less selective to butenes than the Ni ones. For instance, at butadiene conversion
close to 100%, DPu Ni:Zn 1:5 and 1:1/TiO2 appear less selective to butenes (Figure 5-8B) and
shows clearly more alkanes formed (Figure 5-8C) than DPu Ni/TiO2. This result is rather

145
surprising as the corresponding bimetallic Ni-Zn samples present lower activity in butadiene
hydrogenation than the monometallic Ni/TiO2 catalysts (Figure 5-8A) and one would have
expected that a decrease in activity would have resulted in an increase in selectivity to
alkenes. However, considering the fact that the calculation performed by Studt et al [1] also
showed that lower selectivity to ethylene were expected for Ni3Zn1 alloy than for
monometallic Ni or bimetallic Ni1Zn1 or Ni1Zn3 systems (the selectivity to alkenes for Ni-Zn
alloys decreases as follows: Ni1Zn3 alloy > Ni1Zn1 alloy > Ni > Ni3Zn1 alloy), and that the
average Ni:Zn atomic ratios estimated by EDS are in the range from 12 to 2 for the bimetallic
catalysts (Table 5-4), the high Ni:Zn ratios may explain the lower observed selectivity to
alkenes than monometallic Ni. Indeed, the DPu Ni:Zn 1:5 catalyst, which contains Ni-Zn
nanoalloy particles with average Ni:Zn atomic ratio close to 2, shows higher selectivity to
alkenes than the other DPu Ni-Zn catalysts at high conversion (Figure 5-8C).
0
20
40
60
80
100
Bu
tad
ien
e C
on
vers
ion
/ %
DPU Ni DP8 Ni
DPU NiZn 1:1
DPU NiZn 1:3 DP8 NiZn 1:3
DPU NiZn 1:5
A
10 20 30 40 50 60 70 800
20
40
60
80
100
Se
lecti
vit
y t
o B
ute
ne
s /
%
Temperature / oC
DPU Ni DP8 Ni
DPU NiZn 1:1
DPU NiZn 1:3 DP8 NiZn 1:3
DPU NiZn 1:5
B

146
0 20 40 60 80 100
0.0
5.0k
10.0k
15.0k
20.0k
25.0k
30.0k
Ou
tlet
alk
an
es (
Bu
tan
e+
Pro
pan
e)
co
ncen
trati
on
/ p
pm
Butadiene Conversion / %
DPU Ni DP8 Ni
DPU NiZn 1:1
DPU NiZn 1:3 DP8 NiZn 1:3
DPU NiZn 1:5
C
Figure 5-8: Evolution of the butadiene conversion (A), the selectivity to butenes (1-butene +
cis-2-butene + trans-2-butene) (B) as a function of the reaction temperature for the reduced
monometallic Ni/TiO2, and bimetallic Ni-Zn/TiO2 catalysts prepared by different methods (10
mg of catalyst diluted with 90 mg TiO2), outlet alkanes concentration as a function of
butadiene conversion (C). (Full symbols for DPu samples, open symbols for DP8 samples)
3.6.2 Stability and regeneration
The catalytic stability of DPu and DP8 samples was compared from a similar initial
butadiene conversion (80-90%) at different reaction temperatures for 20 h (Figure 5-9 and
Table 5-4). For monometallic Ni catalysts, the butadiene conversion decreases rapidly to
below 10% during the first 12 h, whatever the preparation method. In the case of bimetallic
Ni-Zn/TiO2 catalysts, a higher stability is observed, especially for the Ni:Zn atomic ratios of
1:3 and 1:5. For instance, the DPu Ni:Zn 1:3 sample present only 38% butadiene conversion
decrease during 20 h reaction (Table 5-4). The sample preparation method seems to have no
significant effect on the catalytic stability as the deactivation behaviours of monometallic Ni
and Ni:Zn 1:3/TiO2 catalysts prepared by DPu and DP8 are similar. Moreover, the TiO2
supported Ni-Zn alloy has superior stability than that formed on ZnO, which deactivated
rapidly from ~80% to lower than 10% after 4 h of reaction (Figure 3-30 in Chapter 3).
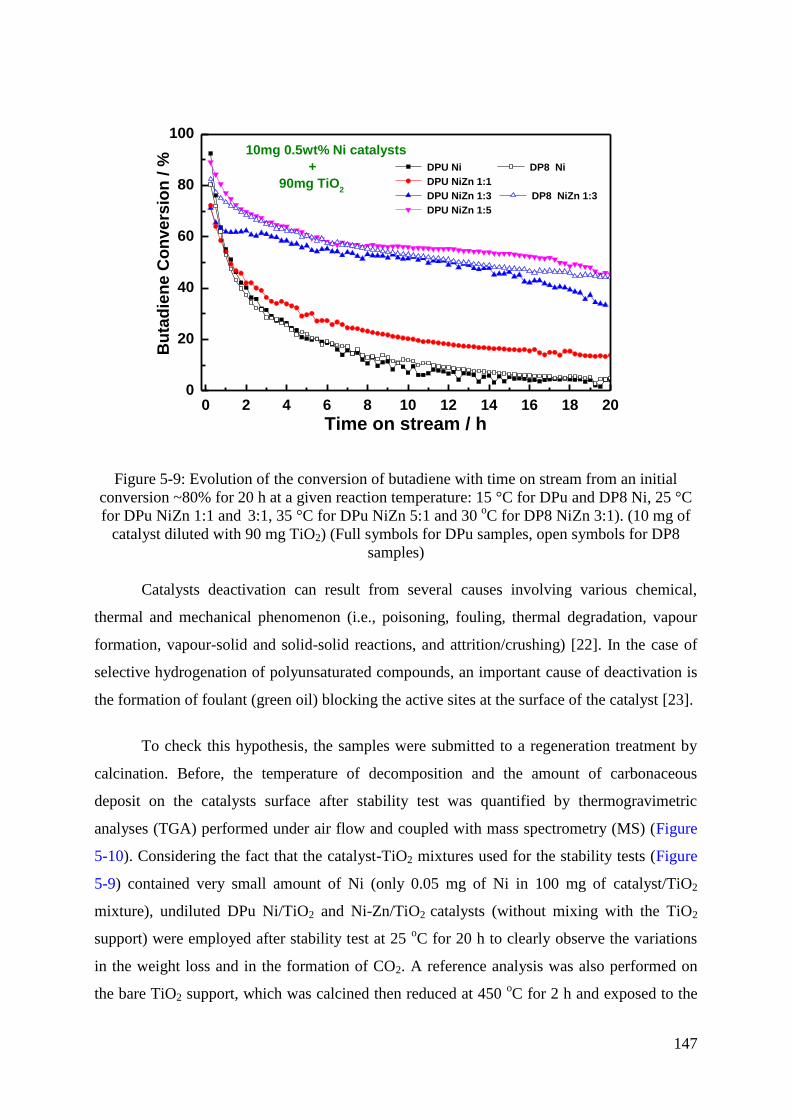
147
0 2 4 6 8 10 12 14 16 18 200
20
40
60
80
10010mg 0.5wt% Ni catalysts
+
90mg TiO2
Bu
tad
ien
e C
on
vers
ion
/ % DPU Ni DP8 Ni
DPU NiZn 1:1
DPU NiZn 1:3 DP8 NiZn 1:3
DPU NiZn 1:5
Time on stream / h
Figure 5-9: Evolution of the conversion of butadiene with time on stream from an initial
conversion ~80% for 20 h at a given reaction temperature: 15 °C for DPu and DP8 Ni, 25 °C
for DPu NiZn 1:1 and 3:1, 35 °C for DPu NiZn 5:1 and 30 oC for DP8 NiZn 3:1). (10 mg of
catalyst diluted with 90 mg TiO2) (Full symbols for DPu samples, open symbols for DP8
samples)
Catalysts deactivation can result from several causes involving various chemical,
thermal and mechanical phenomenon (i.e., poisoning, fouling, thermal degradation, vapour
formation, vapour-solid and solid-solid reactions, and attrition/crushing) [22]. In the case of
selective hydrogenation of polyunsaturated compounds, an important cause of deactivation is
the formation of foulant (green oil) blocking the active sites at the surface of the catalyst [23].
To check this hypothesis, the samples were submitted to a regeneration treatment by
calcination. Before, the temperature of decomposition and the amount of carbonaceous
deposit on the catalysts surface after stability test was quantified by thermogravimetric
analyses (TGA) performed under air flow and coupled with mass spectrometry (MS) (Figure
5-10). Considering the fact that the catalyst-TiO2 mixtures used for the stability tests (Figure
5-9) contained very small amount of Ni (only 0.05 mg of Ni in 100 mg of catalyst/TiO2
mixture), undiluted DPu Ni/TiO2 and Ni-Zn/TiO2 catalysts (without mixing with the TiO2
support) were employed after stability test at 25 oC for 20 h to clearly observe the variations
in the weight loss and in the formation of CO2. A reference analysis was also performed on
the bare TiO2 support, which was calcined then reduced at 450 oC for 2 h and exposed to the

148
reactant gas mixture at 25 oC for 20 h. In Figure 5-10A, a decrease in the weight of the TiO2
support (~1.2 wt%), can be observed in the temperature range between 150 and 500 oC,
combined to CO2 formation detected by MS in the same temperature range (Figure 5-10B). It
can be assigned to the removal of butadiene/propene adsorbed on TiO2 support as TiO2 has no
activity at low temperature. Regarding the Ni containing catalysts, even though the weight
losses in the monometallic Ni and bimetallic Ni-Zn catalysts are similar during the TGA
measurement (Table 5-4), differences in CO2 formation can be clearly observed by the
analysis of the outlet gas from TGA by MS (Figure 5-10B). It can be seen that the
monometallic Ni sample presents the largest CO2 formation while the addition of Zn strongly
decreases the CO2 release (Table 5-4), which indicates that the Zn inclusion limits the
carbonaceous deposition on the catalysts surface, resulting in an enhanced stability.
150 200 250 300 350 400 450 500 550 600
98.0
98.5
99.0
99.5
Weig
ht
perc
en
tag
e / %
Temperature / oC
TiO2
DPU Ni/TiO2
DPU NiZn1:1/TiO2
DPU NiZn1:3/TiO2
DPU NiZn1:5/TiO2
A
150 200 250 300 350 400 450 500 550 6000
1
2
3
4
5
6
7
8
CO
2 in
ten
sit
y *
10
-12/ a,u
Temperature / oC
TiO2
DPU Ni/TiO2
DPU NiZn 1:1/TiO2
DPU NiZn 1:3/TiO2
DPU NiZn 1:5/TiO2
B
Figure 5-10: Thermogravimetric analyses (A) performed in air coupled with mass
spectrometry (B) of TiO2 support and undiluted DPu samples after 20 h of stability test at 25
°C. TiO2 was previously calcined then reduced at 450 oC and exposed to reactant gas mixture
for 20h at 25 oC.
A positive effect of Zn addition to Ni containing catalysts has been previously
observed for ethanol steam reforming, as it resulted in a decrease in the formation of
carbonaceous deposit responsible for the catalysts deactivation [24]. The enhanced stability
was ascribed to the formation of Ni-Zn alloy, resulting in the dilution of large ensembles of
Ni metal atoms by Zn atoms, which led to the inhibition of carbon deposition [24]. In the case
of selective hydrogenation of acetylene in the presence of ethylene over bulk intermetallic Ni-
Zn compounds [2], the formation of Ni-Zn alloys resulted in a decrease in the oligomer
formation, enhancing the selectivity to ethylene. The lower acetylene adsorption energy,
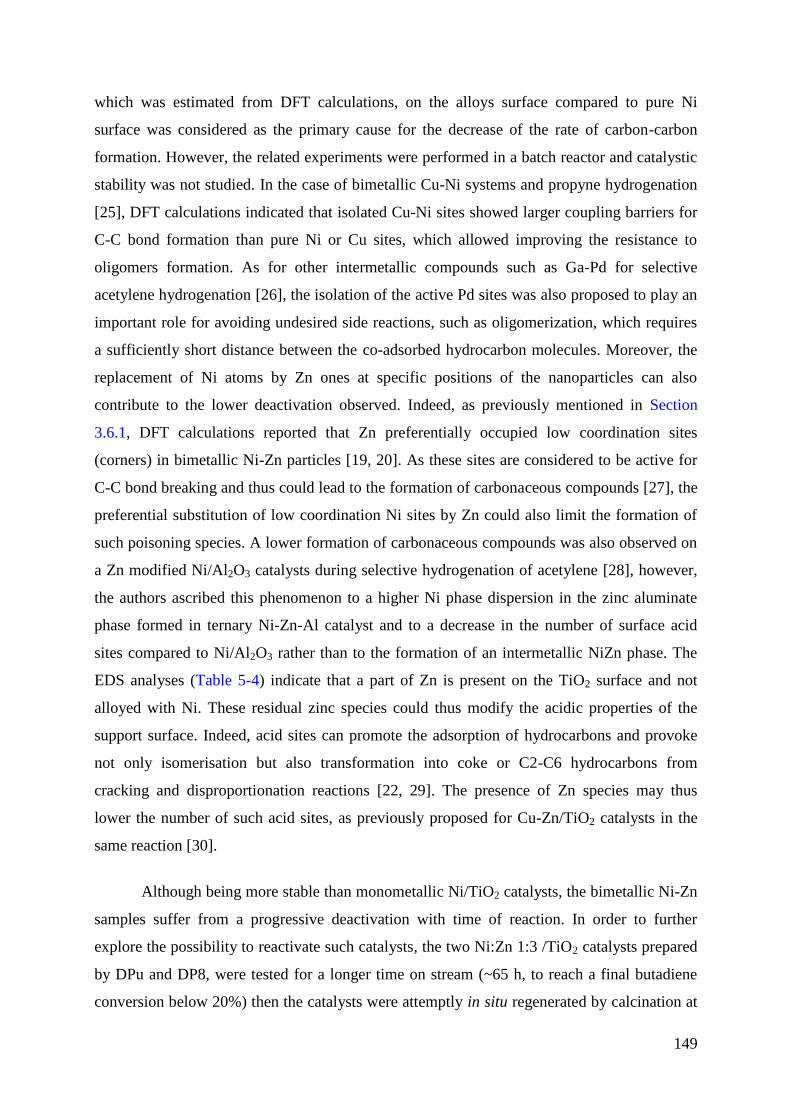
149
which was estimated from DFT calculations, on the alloys surface compared to pure Ni
surface was considered as the primary cause for the decrease of the rate of carbon-carbon
formation. However, the related experiments were performed in a batch reactor and catalystic
stability was not studied. In the case of bimetallic Cu-Ni systems and propyne hydrogenation
[25], DFT calculations indicated that isolated Cu-Ni sites showed larger coupling barriers for
C-C bond formation than pure Ni or Cu sites, which allowed improving the resistance to
oligomers formation. As for other intermetallic compounds such as Ga-Pd for selective
acetylene hydrogenation [26], the isolation of the active Pd sites was also proposed to play an
important role for avoiding undesired side reactions, such as oligomerization, which requires
a sufficiently short distance between the co-adsorbed hydrocarbon molecules. Moreover, the
replacement of Ni atoms by Zn ones at specific positions of the nanoparticles can also
contribute to the lower deactivation observed. Indeed, as previously mentioned in Section
3.6.1, DFT calculations reported that Zn preferentially occupied low coordination sites
(corners) in bimetallic Ni-Zn particles [19, 20]. As these sites are considered to be active for
C-C bond breaking and thus could lead to the formation of carbonaceous compounds [27], the
preferential substitution of low coordination Ni sites by Zn could also limit the formation of
such poisoning species. A lower formation of carbonaceous compounds was also observed on
a Zn modified Ni/Al2O3 catalysts during selective hydrogenation of acetylene [28], however,
the authors ascribed this phenomenon to a higher Ni phase dispersion in the zinc aluminate
phase formed in ternary Ni-Zn-Al catalyst and to a decrease in the number of surface acid
sites compared to Ni/Al2O3 rather than to the formation of an intermetallic NiZn phase. The
EDS analyses (Table 5-4) indicate that a part of Zn is present on the TiO2 surface and not
alloyed with Ni. These residual zinc species could thus modify the acidic properties of the
support surface. Indeed, acid sites can promote the adsorption of hydrocarbons and provoke
not only isomerisation but also transformation into coke or C2-C6 hydrocarbons from
cracking and disproportionation reactions [22, 29]. The presence of Zn species may thus
lower the number of such acid sites, as previously proposed for Cu-Zn/TiO2 catalysts in the
same reaction [30].
Although being more stable than monometallic Ni/TiO2 catalysts, the bimetallic Ni-Zn
samples suffer from a progressive deactivation with time of reaction. In order to further
explore the possibility to reactivate such catalysts, the two Ni:Zn 1:3 /TiO2 catalysts prepared
by DPu and DP8, were tested for a longer time on stream (~65 h, to reach a final butadiene
conversion below 20%) then the catalysts were attemptly in situ regenerated by calcination at

150
500 oC then reduction at 450
oC for 2 h, according to the same procedure as for activation.
The catalytic performances were then evaluated during a second run for 20 h (Figure 5-11).
The results show that the regeneration treatment at 500 oC under air cannot allow the recovery
of the initial catalytic performances of Ni-Zn catalysts, the butadiene conversion is even lower
than the one recorded at the end of the first run. In order to explain this observation, the
cristallites size after regeneration and the formation of carbonaceous species accumulated on
the catalyst surface were estimated by XRD (Figure 5-12) and Raman spectroscopy (Figure 5-
13), respectively. It can be seen that the cristallite size of bimetallic Ni-Zn alloy appears to
only slightly increase after regeneration as a very weak additional broad peak assigned to β1-
NiZn alloy (Ni1Zn1) (JCPDS:01-072-2668) is visible in the regenerated catalyst. The presence
of carbonaceous deposit was identified by Raman spectroscopy (i.e., bands at 1300 cm-1
and
1581 cm-1
, assigned to the C-C single bonds between sp3-hybridized carbon atoms in the
cubic structure (D band) and to the ‘in plane’ displacement of carbons strongly coupled in the
hexagonal sheets (G band) [31], respectively) after stability test but these species seems to
have been removed after the regeneration treatment at 500 oC. Considering the fact that the
catalytic performances cannot be recovered after this oxidative treatment, an additional TGA-
MS experiment was performed on the regenerated DPu Ni:Zn 1:3/TiO2 sample (Figure 5-14),
which shows an only slight weight loss (~0.6 wt%) in parallel to very low CO2 formation in
the temperature range 150 and 600 oC. All these characterizations indicate that particle growth
or deposition of carbonaceous species on the catalysts surface can not be considered as the
main reason for the observed irreversible deactivation. Thus, additional unknown causes are
at the origin of the deactivation phenomenon and further investigations are required to solve
this issue.
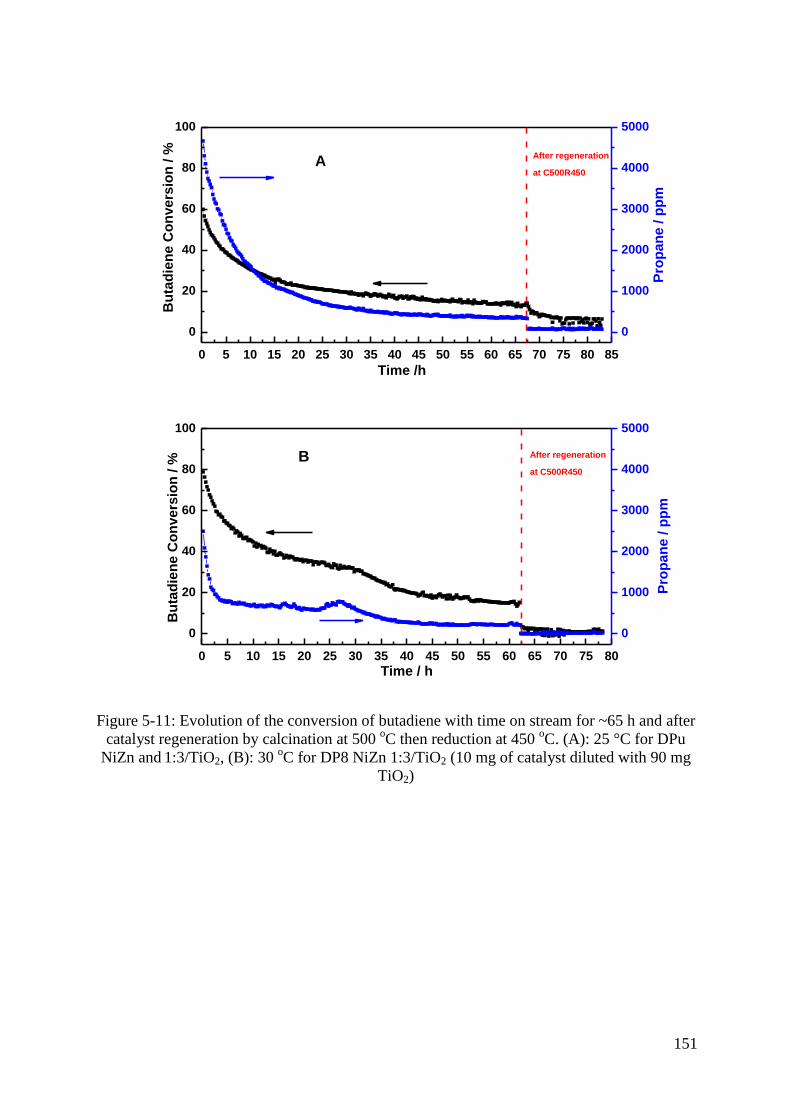
151
0 5 10 15 20 25 30 35 40 45 50 55 60 65 70 75 80 85
0
20
40
60
80
100
Time /h
Bu
tad
ien
e C
on
ve
rsio
n / %
0
1000
2000
3000
4000
5000
Pro
pa
ne
/ p
pm
After regeneration
at C500R450A
0 5 10 15 20 25 30 35 40 45 50 55 60 65 70 75 80
0
20
40
60
80
100
Time / h
Bu
tad
ien
e C
on
ve
rsio
n / %
0
1000
2000
3000
4000
5000
Pro
pa
ne
/ p
pm
After regeneration
at C500R450
B
Figure 5-11: Evolution of the conversion of butadiene with time on stream for ~65 h and after
catalyst regeneration by calcination at 500 oC then reduction at 450
oC. (A): 25 °C for DPu
NiZn and 1:3/TiO2, (B): 30 oC for DP8 NiZn 1:3/TiO2 (10 mg of catalyst diluted with 90 mg
TiO2)

152
40 41 42 43 44 45 461500
2000
2500
3000
3500
4000
4500
(NiZn): JCPDS:01-072-2668
Inte
nsit
y / a
,u
2 theta
Fresh DPU NiZn 1:3 /TiO2
Regenerated DPU NiZn 1:3/TiO2
Figure 5-12: XRD of the freshly calcined 0.5wt% NiZn 1:3/TiO2 and the regenerated 0.5wt%
NiZn 1:3/TiO2 sample after reduction at 450 oC for 2 h.
1000 1200 1400 1600 18000
100k
200k
300k
400k
500k
600k
Inte
nsit
y /
a,u
cm-1
pure NiZn 1:3/TiO2 sample after stability test
A
1581
1300
1000 1200 1400 1600 18000
500
1000
1500
2000
2500
3000
Inte
nsit
y /
a,u
cm-1
regenerated pure NiZn 1:3/TiO2 sample
after stability test
B
Figure 5-13: Raman spectra of the 0.5wt% NiZn 1:3/TiO2 after stability test at 25oC for 20h
(a) and after regeneration at 500 oC for 2 h (b).

153
150 200 250 300 350 400 450 500 550 600
98.0
98.5
99.0
99.5
W
eig
ht
perc
en
tag
e / %
Temperature / oC
DPU NiZn1:3/TiO2
Regenerated DPU NiZn1:3/TiO2
150 200 250 300 350 400 450 500 550 6000
1
2
3
4
5
6
7
8
CO
2 in
ten
sit
y *
10
-12/ a,u
Temperature / oC
DPU NiZn 1:3/TiO2
Regenerated DPU NiZn 1:3/TiO2
Figure 5-14: Thermogravimetric analyses (A) coupled with mass spectrometry (B) analysis of
the undiluted DPu NiZn 1:3/TiO2 sample after catalytic stability test and regeneration at 500 oC.
4. Conclusion
TiO2-supported monometallic Ni and bimetallic Ni-Zn with various Ni:Zn ratios (i.e.,
1:1, 1:3, 1:5) were prepared by deposition-precipitation with urea (DPu) and deposition-
precipitation at fixed pH (DP8). It has been found that Zn2+
deposition occurred first then
followed by the one of Ni2+
on TiO2 surface during DPu preparation, and simultaneously
during DP8. After calcination at 400 oC then reduction at 450
oC for 2 h, the formation of
bimetallic Ni-Zn nanoparticles was evidenced by XRD and STEM-HAADF coupled with
EDS analysis. The Ni:Zn atomic ratio in Ni-Zn alloyed nanoparticles decreases with the
increase of Zn loading in DPu and DP8 samples, and the alloying of Ni with Zn leads to an
increase of the average nanoparticle size. The catalytic results showed that Ni has high
catalytic activity in the selective butadiene hydrogenation reaction, and that alloying Ni with
Zn slightly decreased the activity and, more surprisingly, the selectivity to alkenes, which is
not in full agreement with the theoretical prediction by Studt et al. However, the bimetallic
Ni-Zn/TiO2 catalysts displayed much higher stability under isothermal reaction than Ni/TiO2,
which deactivated rapidly in the first few hours of reaction. The DP8 Ni:Zn sample showed
slightly higher T100% and selectivity to butenes, but similar stability than the corresponding
DPu sample. The higher stability of bimetallic Ni-Zn/TiO2 catalysts, compared to
monometallic Ni/TiO2, was ascribed to the formation of a lower amount of carbonaceous

154
species during reaction, as revealed by TGA analyses. However, even though most of the
carbonaceous deposited on the catalytic surface can be eliminated by an in situ oxidative
treatment, the initial catalytic activity cannot be recovered.

155
5. Reference
1. F.Studt, F.Abild-Pedersen, T.Bligaard, R.Z.Sørensen, C.H.Christensen, J.K. Nørskov.
Science, 320 (2008) 1320.
2. C.S.Spanjers, J.T.Held, M.J.Jones, D.D.Stanley, R.S.Sim, M.J.Janik, R.M.Rioux
Journal of Catalysis, 316 (2014) 164.
3. C.S. Spanjers, R.S.Sim, N.P.Sturgis, B.Kabius, R.M.Rioux, ACS Catalysis, 5 (2015)
3304.
4. K.Bourikas, C. Kordulis, A. Lycourghiotis, Chemical reviews, 114 (2014) 9754.
5. Handbook, A., Volume 3: Alloy phase diagrams. ASM international, 1992: p. p.780.
6. C.Louis, Deposition‐Precipitation Synthesis of Supported Metal Catalysts.
ChemInform, 2007. 38(20).
7. J.Bjerrum, Stability constants of metal-ion complexes. 1964: The Chemical Society.
8. G.D.Panagiotou, T.Petsi, K.Bourikas, C.S.Garoufalis, A.Tsevis, N.Spanos,
C.Kordulisa, A.Lycourghiotis, Advances in colloid and interface science, 142 (2008)
20.
9. T.Imoto, Y.Harano, Y.Nishi, S.Masuda, Bulletin of the Chemical Society of Japan, 37
(1964) 441.
10. S.Lew, A.F. Sarofim, M. Flytzani-Stephanopoulos, Chemical Engineering Science, 47
(1992) 1421.
11. M.Liang, W.Kang, K.Xie, Journal of Natural Gas Chemistry, 18 (2009) 110.
12. M.A.Valenzuela, P.Bosch, J.Jiménez-Becerrill, O.Quiroz, A.I. Páez, Journal of
Photochemistry and Photobiology A: Chemistry, 148 (2002) 177.
13. K.Hadjiivanov, M.Mihaylov, N.Abadjieva, D.Klissurski, J. Chem. Soc., Faraday
Trans., 94 (1998) 3711.
14. J.van de Loosdrecht, A.M.van der Kraan, A.J van Dillen, J.W.Geus, Journal of
Catalysis, 170 (1997) 217.
15. W. Pearson, W. Pearson, An Alphabetical Index of Work on Metals and Alloys. A
Handbook of Lattice Spacings and Structures of Metals and Alloys, 1958: p. 634.
16. D.L.Trimm, N.W. Cant, I.O. Liu, Catalysis today, 178 (2011) 181.
17. G.Bond, Discussions of the Faraday Society, 41 (1966) 200.
18. B.Hammer, J.K. Nørskov, Advances in catalysis, 45 (2000) 71.

156
19. A.H. Al-ShaikhAli, A.Jedidi, L.Cavallo, K.Takanabe, Chemical Communications, 51
(2015) 12931.
20. A.H. Al-ShaikhAli, A.Jedidi, D.H.Anjum, L.Cavallo, K.Takanabe, ACS Catalysis, 3
(2017) 1592.
21. R.T.Vang, K.Honkala, S.Dahl, E.K.Vestergaard, J.Schnadt, E.Lægsgaard, B.S.
Clausen, J.K.Nørskov, F.Besenbacher, Nature materials, 4 (2005) 160.
22. M.D.Argyle, C.H. Bartholomew, Catalysts, 5 (2015) 145.
23. M.R. Stammbach, D.J. Thomas, D.L. Trimm, M.S. Wainwright, Applied Catalysis, 58
(1990) 209.
24. C.Anjaneyulu, L.O.O.da Costa, M.C.Ribeiro, R.C.Rabelo-Neto, L.V.Mattos,
A.Venugopal, F.B.Noronha, Applied Catalysis A: General, 519 (2016) 85.
25. B.Bridier, N. López, J. Pérez-Ramírez, Dalton Transactions, 39 (2010) 8412.
26. M.Krajčí, J. Hafner, ChemCatChem, 8 (2016) 34.
27. J.T. Wehrli, D.J. Thomas, M.S. WainwrightD.L. Trimm, Applied Catalysis, 70 (1991)
253.
28. J.C.Rodrıguez, A.J.March, A.Borgna, A.Monzon, Journal of Catalysis, 171 (1997)
268.
29. P.Berteau, S. Ceckiewicz, B. Delmon, Applied Catalysis, 31 (1987) 361.
30. Z.Wang, G.Wang, C.Louis, L.Delannoy, Journal of Catalysis, 347 (2017).
31. T.Jawhari, A. Roid, J. Casado, Carbon, 33 (1995) 1561.

Chapter 6: Preliminary explorations of the use of supported
bimetallic Fe-based catalysts for selective hydrogenation reaction.

Chapter 6: Preliminary explorations of the use of supported bimetallic Fe-based
catalysts for selective hydrogenation reaction ................................................................... 159
1. Introduction .................................................................................................................... 159
2. Preparation of Fe-based catalysts ................................................................................... 160
3. Monometallic Fe/ZnO catalyst ....................................................................................... 162
3.1 Reduction behaviour of Fe(II)/ZnO catalysts. .......................................................... 162
3.2 Structure evolution of Fe(II)/ZnO after different thermal treatments ...................... 163
3.3 catalytic performance ............................................................................................... 164
4. Bimetallic Fe-Zn/TiO2 catalysts ..................................................................................... 166
4.1 Fe, Zn loading at different final preparation time with Fe2+
/Fe3+
precursors ........... 167
4.3 XRD of the as-prepared and calcined Fe-Zn/TiO2 catalysts .................................... 168
4.4 TPR of Fe-Zn/TiO2 catalyst ..................................................................................... 169
4.5 XRD of reduced Fe-Zn/TiO2 catalyst ....................................................................... 170
4.6 Selective hydrogenation of butadiene in an excess of propene ................................ 171
5. Conclusion ...................................................................................................................... 173
6. Reference ........................................................................................................................ 176

159
Chapter 6: Preliminary explorations of the use of supported
bimetallic Fe-based catalysts for selective hydrogenation reaction
1. Introduction
Recently, an Al13Fe4 bulk alloy was found to have high catalytic performance in
selective hydrogenation of butadiene and acetylene. This remarkable behavior was ascribed to
the presence of highly stable isolated iron catalytic active sites at the surface of the alloy and
to the alteration of the electronic structure of iron by chemical bonding with Al [1, 2]. This
study revealed that iron-based bimetallic catalysts have interesting potential for the selective
hydrogenation of polyunsaturated hydrocarbons. However, even though Fe-based bimetallic
catalysts were explored in various reactions, such as bimetallic Fe-Co and Fe-Ni in the
hydrogenation of carbon monoxide [3], bimetallic Fe-Ru in the Fischer–Tröpsch synthesis [4]
and bimetallic Fe-Cu in the selective catalytic reduction of NO with NH3 [5], the study of
supported bimetallic Fe-based catalysts in the selective hydrogenation of polyunsaturated
hydrocarbons is indeed rare. Thus it is worth to carry out some explorations on the application
of supported Fe-based catalysts in such reactions. On the other hand, through density
functional theory (DFT) calculations, Studt et al [6] predicted that bimetallic Fe-Zn could be
an interesting alternative to palladium-based catalysts for the selective hydrogenation of
polyunsaturated hydrocarbons. Thus, in this chapter, a preliminary exploration of Fe-Zn/TiO2
in terms of catalyst preparation and catalytic evaluation is presented. Based on our previous
study showing Ni-Zn alloy formation after reduction of Ni/ZnO at different temperatures
(Figure 3-27 in Chapter 3), Fe/ZnO was also prepared to more easily evidence the possible
Fe-Zn alloy formation.
The Fe-Zn alloy phase diagram presented in Figure 6-1 shows that no clear boundary
of Zn content for separating different Fe-Zn alloy phases, and only two identifiable Fe-Zn
alloy phases are described: δ-FeZn10 and ζ-FeZn13, with Zn content higher than 88.5 wt%.
Besides that, a kind of Fe-Zn solid solution is formed when Zn content is lower than 46 wt%,
and Γ phase (Γ1 or Γ2) is the main Fe-Zn phase when Zn content increases to 72~85 wt%.
According to a previous structure analysis on bulk Fe-Zn alloy by Pearson et al [7], Γ phase
may be Γ-Fe3Zn10.

160
Figure 6-1: Alloy phase diagram of Fe-Zn system (left), Fe-Zn crystallographic data (right)
[8]
This chapter will describe:
- The reduction behavior of monometallic Fe/ZnO and the possible Fe-Zn alloy
formation after sample reduction at different temperatures and the catalytic performance;
- The deposition behavior of iron and zinc ions on titania was monitored as a function
of preparation time during bimetallic Fe-Zn preparation.
- The reduction behavior of supported monometallic Fe/TiO2 and bimetallic Fe-
Zn/TiO2 was studied by temperature-programmed reduction (see Section 3 of Chapter 2).
- The evolution of the structure of the iron-based phase in supported monometallic Fe
and bimetallic Fe-Zn sample after different thermal treatments was analyzed by XRD (see
Section 3 of Chapter 2).
- Finally, the influence of addition of Zn the catalytic performance of Fe/TiO2 was
evaluated under butadiene/H2/propene gas mixture (see Section 4 of Chapter 2).
2. Preparation of Fe-based catalysts
Fe/ZnO, Fe/TiO2 and FeZn 1:1/TiO2 catalysts with 2.5 wt% Fe loading were prepared
by deposition-precipitation with urea with the same duration of 20 h (Experiment I) according
161
to the following procedure (see Section 2 of Chapter 3): 300 mL of distilled water and 3 g of
support (TiO2 P25 Evonik, 80% anatase and 20% rutile) or ZnO (Kadox) were introduced into
a double-wall reactor under N2 (50 mL min-1
) in order to prevent the oxidation of Fe2+
ions to
Fe3+
and the precipitation in solution (shown later) during sample preparation when a Fe(II)
precursor was used. The mixture was heated at 80 oC. Given amounts of metal precursors
(i.e., FeCl2·4H2O and Zn(NO3)2·6H2O) were dissolved into the TiO2 suspension solution
in order to achieve the desired Fe:Zn ratio (1:0 and 1:1) with 2.5 wt% Fe loading as a
constant. Moreover, the initial pH of the solution depends on the acid-base property of the
metal precursors. After addition of a large excess of urea CO(NH2)2 (Sigma-Aldrich) (i.e.
[urea]/[metal] ≥100), the mixture was stirred at 80 oC in the closed reactor for 20 h. The solid
was separated from the liquid phase by centrifugation and subsequently repeatedly washed
with distilled water and centrifuged (three times). Then the samples were dried under vacuum
at room temperature for 24 h (so-called as-prepared sample).
The pH evolution during monometallic Fe/TiO2 and FeZn 1:1/TiO2 was recorded
every 5 min during the first 5 h of DPu (Experiment II) with initial pH of the preparation
solution adjusted to ~2 by adding 0.5 M HNO3, with Fe(II)/urea and urea/TiO2 as references.
In addition, the evolution of the metals loadings in the as-prepared sample as a function of
time (Experiment III) was studied during the FeZn 1:1/TiO2 with 2.5 wt% Fe loading sample
preparation (using 3 g of TiO2 in 300 mL). Two different iron precursors, i.e., FeCl2·4H2O
and Fe(NO3)3·9H2O, were employed to study the deposition behavior of iron ions. Aliquots
of 40 to 50 mL of suspension were withdrawn at different pHs, and treated as above, i.e.,
centrifuged, washed and dried. Note that, in the following text, Fe(II) was used for the
samples prepared by FeCl2·4H2O precursor and Fe(III) was for Fe(NO3)3·9H2O.
The final metal loadings achieved for the various samples after 20 h of DPu are
summarized in Table 6-1. More than 80% of Fe and Zn were deposited on TiO2 surface.
Table 6-1: Fe and Zn loadings in the as-prepared Fe-Zn/TiO2 sample prepared by DPu
DPu Sample Normal metal loading / wt% Experimental metal loading / wt%
Fe Zn Fe Zn
Fe(II) /TiO2 2.5 - 2.1 -
Fe(II)Zn 1:1/TiO2 2.5 2.5 2.0 2.0
Fe(II)/ZnO 2.5 - 2.1 -
162
Before characterization or reaction, the catalysts were calcined at 400 °C for 2 h with a
temperature ramp of 5 °C min−1
, under flowing air (100 mL min−1
) (like for the Cu-Zn/TiO2,
Ni-Zn/TiO2 study), and reduced at 500 °C for 2 h (temperature ramp of 3 °C min−1
) under
flowing H2 (100 mL min−1
).
3. Monometallic Fe/ZnO catalyst
In this part, 2.5 wt% Fe(II)/ZnO was prepared by DPu method. After calcination at
400 oC for 2 h, the reduction behaviour of the sample was analysed by TPR. Special attention
was mainly paid on the possible formation of Fe-Zn alloy after sample reduction at different
temperatures.
3.1 Reduction behaviour of Fe(II)/ZnO catalysts.
Considering the high iron oxide reduction temperature (above 550 oC) previously
observed by Liang et al [9], the TPR experiment was performed on the calcined Fe(II)/ZnO
sample with temperature going up to 900 oC (Figure 6-2). Three reduction peaks (i.e., 525,
570 and 670 oC) can be observed. As it was mentioned in Section 4 of Chapter 2, ZnO is
reduced at temperature as high as 650 oC [10], thus the broad peak at ~670
oC is probably due
to the reduction of ZnO support. The structure of the iron phase detected by XRD was mainly
ZnFe2O4 in the calcined Fe(II)/ZnO (Figure 6-3), and according to Liang et al [9], bulk
ZnFe2O4 could be first reduced to Fe3O4 (~380 oC) and then to FeO (~560
oC) and finally to
metallic Fe (~640 oC). Thus the reduction peaks at 525 and 570
oC might be attributed to the
reduction of Fe3O4 to FeO and to metallic Fe, respectively. The reduction of ZnFe2O4 to Fe3O4
might occurred at low temperature (i.e., ~450 oC) as the peak at ~525
oC can be divided into
two peaks with a shoulder around 450 oC. Thus, considering that ZnO is not stable when the
reduction temperature becomes higher than 550 oC, two reduction temperatures (450 and 500
oC) were selected for the reduction of calcined Fe/ZnO and the study of the possible Fe-Zn
alloy formation.
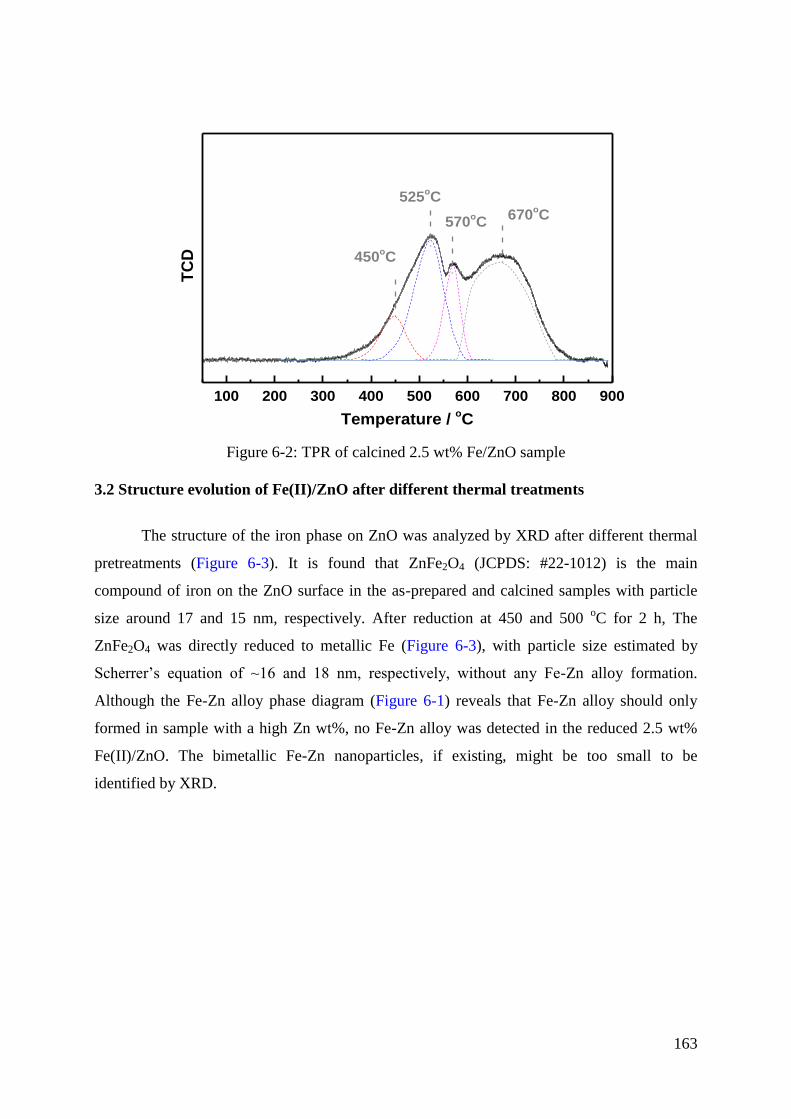
163
100 200 300 400 500 600 700 800 900
TC
D
Temperature / oC
670oC
570oC
525oC
450oC
Figure 6-2: TPR of calcined 2.5 wt% Fe/ZnO sample
3.2 Structure evolution of Fe(II)/ZnO after different thermal treatments
The structure of the iron phase on ZnO was analyzed by XRD after different thermal
pretreatments (Figure 6-3). It is found that ZnFe2O4 (JCPDS: #22-1012) is the main
compound of iron on the ZnO surface in the as-prepared and calcined samples with particle
size around 17 and 15 nm, respectively. After reduction at 450 and 500 oC for 2 h, The
ZnFe2O4 was directly reduced to metallic Fe (Figure 6-3), with particle size estimated by
Scherrer’s equation of ~16 and 18 nm, respectively, without any Fe-Zn alloy formation.
Although the Fe-Zn alloy phase diagram (Figure 6-1) reveals that Fe-Zn alloy should only
formed in sample with a high Zn wt%, no Fe-Zn alloy was detected in the reduced 2.5 wt%
Fe(II)/ZnO. The bimetallic Fe-Zn nanoparticles, if existing, might be too small to be
identified by XRD.
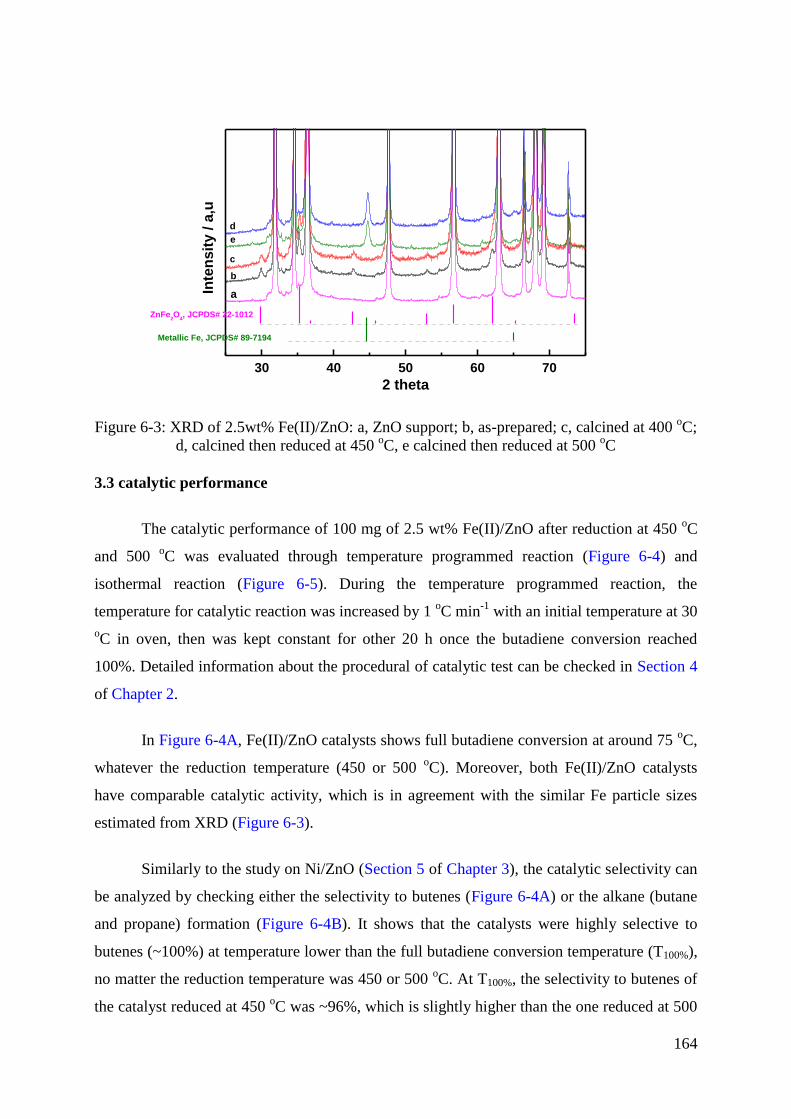
164
30 40 50 60 70
e
Inte
nsit
y / a
,u
2 theta
ZnFe2O
4, JCPDS# 22-1012
Metallic Fe, JCPDS# 89-7194
d
c
b
a
Figure 6-3: XRD of 2.5wt% Fe(II)/ZnO: a, ZnO support; b, as-prepared; c, calcined at 400 oC;
d, calcined then reduced at 450 oC, e calcined then reduced at 500
oC
3.3 catalytic performance
The catalytic performance of 100 mg of 2.5 wt% Fe(II)/ZnO after reduction at 450 oC
and 500 oC was evaluated through temperature programmed reaction (Figure 6-4) and
isothermal reaction (Figure 6-5). During the temperature programmed reaction, the
temperature for catalytic reaction was increased by 1 oC min
-1 with an initial temperature at 30
oC in oven, then was kept constant for other 20 h once the butadiene conversion reached
100%. Detailed information about the procedural of catalytic test can be checked in Section 4
of Chapter 2.
In Figure 6-4A, Fe(II)/ZnO catalysts shows full butadiene conversion at around 75 oC,
whatever the reduction temperature (450 or 500 oC). Moreover, both Fe(II)/ZnO catalysts
have comparable catalytic activity, which is in agreement with the similar Fe particle sizes
estimated from XRD (Figure 6-3).
Similarly to the study on Ni/ZnO (Section 5 of Chapter 3), the catalytic selectivity can
be analyzed by checking either the selectivity to butenes (Figure 6-4A) or the alkane (butane
and propane) formation (Figure 6-4B). It shows that the catalysts were highly selective to
butenes (~100%) at temperature lower than the full butadiene conversion temperature (T100%),
no matter the reduction temperature was 450 or 500 oC. At T100%, the selectivity to butenes of
the catalyst reduced at 450 oC was ~96%, which is slightly higher than the one reduced at 500

165
oC (i.e., 93%). Figure 6-4B also indicates that the formation of alkane was negligible at low
butadiene conversion for both catalysts and the Fe(II)/ZnO reduced at 500 oC formed higher
amount of alkanes (~10 kppm) than that reduced at 450 oC (~6 kppm) when butadiene
conversion was close to 100%.
30 40 50 60 70 80 90
0
20
40
60
80
100
Reduction at 450 oC
Reduction at 500 oC
Temperature / oC
Bu
tad
ien
e c
on
vers
ion
/ %
80.0
85.0
90.0
95.0
100.0
Se
lecti
vit
y t
o b
ute
ne
s /
%A
0 20 40 60 80 100
0.0
5.0k
10.0k
15.0k
Alk
an
es C
on
cen
trati
on
/ p
pm
Butadiene conversion / %
Reduction at 450 oC
Reduction at 500 oC
B
Figure 6-4: Catalytic performance of calcined Fe(II)/ZnO after reduction at 450 and 500 oC:
butadiene conversion and selectivity to butenes versus temperature (A); Alkanes formation
versus butadiene conversion (B)
After reaching T100%, the catalysts were kept at 90 oC for 20 h (Figure 6-5). It shows
that the butadiene conversion decreased sharply from 100% to ~10% after 5 h of reaction for
both samples. Moreover, it seems that the catalyst becomes less stable with higher reduction
temperature as the butadiene conversion of the catalyst reduced at 500 oC decreased faster
than that reduced at 450 oC, similar results were also observed with Ni/ZnO catalysts (Figure
3-30, in Chapter 3). The low catalytic stability could again be attributed to the negative effect

166
of ZnO that can promote oligomerization on the catalyst surface [11] (see Section 5.2 of
Chapter 3).
0 2 4 6 8 10 12 14 16 18 200
20
40
60
80
100
Bu
tad
ien
e C
on
ve
rsio
n / %
Time / h
Reduction at 450 oC
Reduction at 500 oC
Figure 6-5: Evolution of butadiene conversion with time on steam at 90 oC for Fe(II)/ZnO
after reduction at 450 and 500 oC
In summary, the main information arising from this part is that the ZnFe2O4 phase
present in the as-prepared Fe(II)/ZnO sample decomposes into metallic Fe during reduction at
450 oC, without formation of Fe-Zn alloy detectable by XRD whereas it was expected from
the Fe-Zn phase diagram that the high Zn content of this sample would lead to the formation
of an alloy.
4. Bimetallic Fe-Zn/TiO2 catalysts
Even though no Fe-Zn alloy was detected in the Fe(II)/ZnO samples after reduction at
different temperatures, bimetallic Fe-Zn/TiO2 was still explored in this part. TiO2 supported
monometallic Fe and bimetallic FeZn 1:1 with 2.5 wt% Fe loading samples were prepared by
DPu. Moreover, to confirm the calculation prediction about the different deposition behaviors
of Fe3+
and Fe2+
ions in Figure 2-4 of Chapter 2, Fe(NO3)3 and FeCl2 were employed as the
iron precursors and the iron and zinc loading in the as-prepared sample were studied as a
function of DPu time. The reduction behavior of Fe-Zn/TiO2 catalyst was monitored by
temperature-programmed reduction (TPR). The structure evolution of iron-based phase was
recorded by X-ray diffraction after different thermal treatments. Finally, the catalytic
performance was monitored under butadiene/H2/propene mixture as a function of temperature
and time on stream at constant temperature.
167
4.1 Fe, Zn loading at different final preparation time with Fe2+
/Fe3+
precursors
The deposition behavior of iron and zinc ions was studied by analysis of the iron and
zinc loading on TiO2 surface after different preparation time (Figure 6-6). Note that the
nominal Fe loading is 2.5 wt% with Fe:Zn loading ratio 1:1. It can be seen that the Fe3+
and
Fe2+
iron precursors lead to totally different iron deposition behaviors: for the preparation
with Fe3+
precursor, over 80% of Fe3+
was precipitated, mainly in solution as phase
segregation was clearly observed in the resulting as-prepared samples after drying, at the
beginning (i.e., 15 min) of DPu preparation. Then it reached around 93% after 1 h of DPU
with no significant change in the following 19 h. Similar deposition-precipitation behavior of
Fe(III) was also observed by Geus et al [12], which indicated that Fe(OH)3 precipitation
appears when the pH of the solution was higher than 2.0. The situation is different for the Fe2+
precursor, which showed that less than 10% Fe2+
was deposited on the TiO2 surface at 15 min
of DPu. Then it increased gradually to ~95% in the next 4 h and was kept as a constant in the
following 16 h. Additionally, it is also found that the Zn loading evolution with DPu time in
these two preparations is similar, which may means that the type of iron precursor has no
significant effect on the deposition of Zn ions. Moreover, Figure 6-6B also shows that Zn2+
has a similar deposition behavior as Fe2+
during DPu preparation. This observation is in
agreement with the previous theoretical calculation in Figure 2-4 of Chapter 2, which revealed
that the pH for the deposition-precipitation of Fe2+
is rather higher than that of Fe3+
, but is
similar to that of Zn2+
on the basis of the solubility of their hydroxides species (see Table 2-1,
in Chapter 2). Because of the rapid and uncontrolled precipitation of Fe(OH)3, which mainly
occurs in solution, only the samples prepared using Fe(II) precursor (FeCl2·4H2O) will be
considered in the following parts of this chapter.

168
0 1 2 3 4 50.0
0.5
1.0
1.5
2.0
2.5
Meta
l lo
ad
ing
/ %
DPu Time / h
Fe(III)
Zn
Norminal loading:
2.5wt% Fe
2.5wt% Zn
A
0 1 2 3 4 50.0
0.5
1.0
1.5
2.0
2.5
Zn
Norminal loading:
2.5wt% Fe
2.5wt% Zn
Lo
ad
ing
/ w
t%
DPU Time / h
BFe(II)
Figure 6-6: Evolution of the Fe and Zn loadings on titania versus time during the DPu
preparation procedure: (A) Fe(III)-Zn/TiO2; (B) Fe(II)-Zn/TiO2. Nominal loadings: 2.5 wt%
Fe and 2.5 wt% Zn
4.3 XRD of the as-prepared and calcined Fe-Zn/TiO2 catalysts
The structure of the iron-based phase in the as-prepared and calcined Fe-Zn/TiO2
sample was first characterized by XRD (Figure 6-7). Fe2O3 (JCPDS: #33-0664) was formed
in the as-prepared and calcined Fe(II)/TiO2 sample, while, similarly to the Fe(II)/ZnO sample
(Figure 6-3), ZnFe2O4 (JCPDS: #70-6393) was formed in the as-prepared and calcined
Fe(II)Zn 1:1/TiO2. More interesting, the formation of ZnFe2O4 compound in the as-prepared
Fe(II)Zn 1:1/TiO2 reveals that the interaction between Fe and Zn appears on TiO2 surface
during sample preparation by DPu. Calcination treatment has no significant effect on the
structure of the iron-based phase in monometallic Fe/TiO2 and bimetallic FeZn 1:1/TiO2
samples. The crystallite size of Fe2O3 and ZnFe2O4 was estimated by the Scherrer’s equation
at 16 nm 20 nm for the as-prepared and 17 nm and 22 nm for the calcined Fe(II)/TiO2 and
Fe(II)Zn 1:1/TiO2, respectively.

169
20 25 30 35 40 45 50 55 60
Calcined
TiO2
Fe(II)Zn 1:1
Fe2O
3, JCPDS#33-0664
ZnFe2O
4, JCPDS# 70-6393
Inte
nsit
y /
a,u
2 theta
Fe(II)
As-prepared
Fe(II)Zn 1:1
Fe(II)
Figure 6-7: XRD of as-prepared and calcined Fe(II)/TiO2 and Fe(II)-Zn/TiO2 samples with
2.5wt% Fe
4.4 TPR of Fe-Zn/TiO2 catalyst
The reduction of calcined TiO2 supported Fe(II) and Fe(II)Zn 1:1 sample was studied
by TPR (Figure 6-8). The Fe(II)/TiO2 sample shows three reduction peaks at 375, 410
(shoulder) and 490 °C. According to a previous TPR study on the reduction behavior of bulk
Fe2O3 and ZnFe2O4 by Liang et al [9], the first reduction peak (~375 oC) in Figure 6-8A could
correspond to the reduction of Fe2O3 to Fe3O4, and the last two peaks (~410 and 485oC) to the
reduction of Fe3O4 to FeO, and finally to metallic Fe, respectively. Note that the reduction
peak appearing at temperature around 900 oC is unknow, but might be due to TiO2 reduction.
For the Fe(II)-Zn/TiO2 sample, which contains ZnFe2O4, three reduction peaks at 375, 505
and 545 oC are observed, which may be caused by the reduction of ZnFe2O4 to Fe3O4, FeO
and to metallic Fe, respectively. By comparison with Fe/TiO2 (Figure 6-8A), the addition of
Zn increases the reduction temperature of TiO2 supported iron species (Figure 6-8B), and
similar effect of addition of Zn was also observed for supported copper (Figure 4-4 in Chapter
4) and nickel (Figure 5-3 in Chapter 5). However, this is not consistent with the conclusion of
Liang et al [9], which described that the ZnFe2O4 structure was more easily reduced than that
of Fe2O3. Considering the fact that ZnO is not stable when the reduction temperature becomes
higher than 550 oC [13, 14], 500
oC was selected for the Fe(II)-based samples activation for
the catalytic tests.
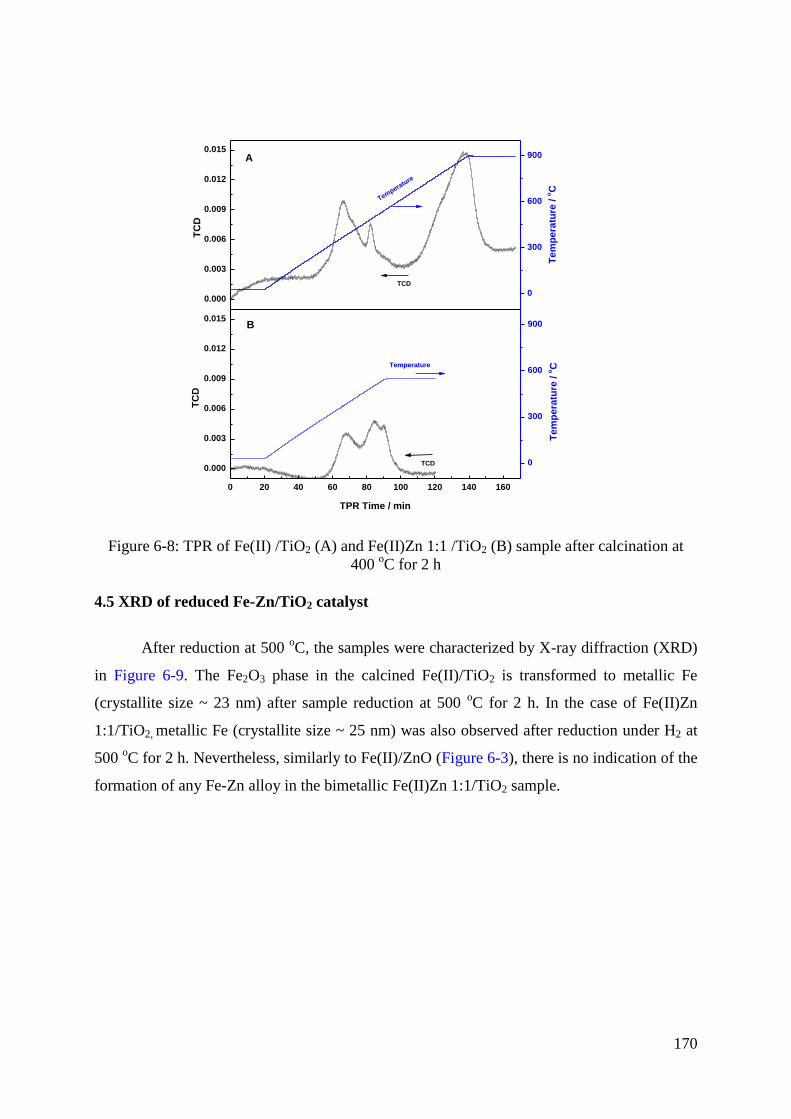
170
Figure 6-8: TPR of Fe(II) /TiO2 (A) and Fe(II)Zn 1:1 /TiO2 (B) sample after calcination at
400 oC for 2 h
4.5 XRD of reduced Fe-Zn/TiO2 catalyst
After reduction at 500 oC, the samples were characterized by X-ray diffraction (XRD)
in Figure 6-9. The Fe2O3 phase in the calcined Fe(II)/TiO2 is transformed to metallic Fe
(crystallite size ~ 23 nm) after sample reduction at 500 oC for 2 h. In the case of Fe(II)Zn
1:1/TiO2, metallic Fe (crystallite size ~ 25 nm) was also observed after reduction under H2 at
500 oC for 2 h. Nevertheless, similarly to Fe(II)/ZnO (Figure 6-3), there is no indication of the
formation of any Fe-Zn alloy in the bimetallic Fe(II)Zn 1:1/TiO2 sample.
0.000
0.003
0.006
0.009
0.012
0.015
TC
D
0
300
600
900
Te
mp
era
ture
/ o
C
Tempera
ture
TCD
TCD
A
0 20 40 60 80 100 120 140 160
0.000
0.003
0.006
0.009
0.012
0.015
TPR Time / min
TC
D
0
300
600
900
Te
mp
era
ture
/ o
CTemperature
B

171
20 25 30 35 40 45 50 55 60
C400R450
Metallic Fe, JCPDS# 89-7194
Inte
nsit
y /
a,u
2 theta
Fe2O
3, JCPDS#33-0664
ZnFe2O
4, JCPDS# 70-6393
TiO2
Fe(II)Zn 1:1
Fe(II)
Figure 6-9: XRD of the calcined then reduced catalysts
4.6 Selective hydrogenation of butadiene in an excess of propene
The catalytic performance of TiO2 supported monometallic Fe(II) and bimetallic
Fe(II)Zn 1:1, after reduction at 500 oC for 2 h, is depicted in Figure 6-10 and Figure 6-11 for
the temperature programmed reaction and the isothermal reaction, respectively. As for the
previous study regarding Fe(II)/ZnO (Section 3), the temperature programmed reaction was
first carried on the reduced 100 mg of catalysts with 2.5 wt% Fe loading, and then the
temperature for the catalytic reaction was kept as a constant when T100% was reached. Detailed
information about the procedural of catalytic test can be checked in Section 4 of Chapter 2.
Firstly, the butadiene conversion as a function of reaction temperature in Figure 6-10A
reveals that bimetallic Fe(II)Zn 1:1/TiO2 has rather lower T100% (i.e., 20 oC) than
monometallic Fe/TiO2 (i.e., ~45 oC). Moreover, on the basis of the particle size estimated
from XRD (23 and 25 nm for the metallic Fe in the Fe(II)/TiO2 and Fe(II)Zn 1:1/TiO2,
respectively) it indicates that bimetallic Fe(II)Zn 1:1/TiO2 has rather higher catalytic activity
than monometallic Fe/TiO2, and much higher than the one observed for Fe(II)/ZnO (Figure 6-
4), which has particle size around 18 nm after reduction at 500 oC.
Figure 6-10A indicates that the Fe(II)/TiO2 catalyst has relatively higher selectivity to
butenes (~ 100%) than that of Fe(II)Zn 1:1/TiO2 (~90%) at temperature closed to T100%.
Moreover, at high butadiene conversion, i.e., ~97% (Figure 6-10B), the formation of alkanes

172
was around ~1100 ppm for the Fe(II)/TiO2 catalyst, while it was doubled (~2500 ppm) but
still very low in the case of Fe(II)Zn 1:1/TiO2. Thus, the addition of Zn slightly decreases the
selectivity to butenes.
After temperature programmed reaction, the temperature for catalytic reaction was
kept as a constant for another 20 h of isothermal reaction once T100% was reached (45 oC and
25 oC for Fe(II)/TiO2 and Fe(II)Zn 1:1/TiO2, respectively). The butadiene conversion
evolution with time on steam is presented in Figure 6-11. For the Fe(II)/TiO2 catalyst, the
butadiene conversion quickly decreased from 100% to lower than 20% in the first 12 h of
reaction at 45 oC. The Fe(II)Zn 1:1/TiO2 catalyst appears more stable as its butadiene
conversion stays at 100% for more than 10 h at 25 oC and decreased to ~70% in the followed
9 h of reaction.
10 15 20 25 30 35 40 45
40
60
80
100
Fe
Fe-Zn
Temperature / oC
Bu
tad
ien
e c
on
vers
ion
/ %
A
40
60
80
100
Sele
cti
vit
y t
o b
ute
nes / %
40 50 60 70 80 90 1000.0
2.0k
4.0k
6.0k
8.0k
10.0k
12.0k
Alk
an
es
fo
rma
tio
n / p
pm
Butadiene conversion / %
Fe
Fe-Zn
B
Figure 6-10: Butadiene selective hydrogenation on Fe(II)/TiO2 and Fe(II)-Zn/TiO2 catalysts:
butadiene conversion and selectivity to butenes as a function of temperature (A) and Alkanes
formation as a function of butadiene conversion (B)

173
0 2 4 6 8 10 12 14 16 18 200
20
40
60
80
100
Bu
tad
ien
e c
on
vers
ion
/ %
Time / h
Fe
Fe-Zn
Figure 6-11: Evolution of butadiene conversion with time on stream. Reaction temperature is
45 oC for Fe/TiO2 and 25
oC for FeZn 1:1/TiO2
According to previous studies on bimetallic Pd-based catalysts [15], the addition of a
second metal (e.g., Cu, Zn, Ga) to Pd could provide highly dispersed catalytic active sites
and/or modify the electronic properties of the adsorption sites of reactants and products, and
results in a superior catalytic performance. Moreover, the remarkable catalytic behavior of
bulk Al13Fe4 alloy for selective hydrogenation of acetylene or butadiene was also proposed to
be due to the formation of a highly stable isolated iron active site on the Al13Fe4 alloy surface
and a modified electronic structure for iron by chemical bonding with Al [2]. Since Zn is
inactive for butadiene hydrogenation at low temperature (<180 oC) (Figure 3-19 in Chapter 3),
and metallic Fe with similar particle size was the main compound identified by XRD for both
Fe(II)/TiO2 and Fe(II)Zn 1:1/TiO2 samples after reduction, thus the reason for the higher
activity and stability of bimetallic Fe(II)Zn 1:1/TiO2 may be caused by: 1. the formation of a
Fe-Zn solid solution during sample reduction, not detectable by XRD; 2. the existence of two
different particle size ranges in the supported Fe(II)Zn 1:1/TiO2 samples (similar as
previously observed for Cu-Zn/TiO2 samples in Chapter 4), in this case, the large ones
corresponding to metallic Fe, and the smaller ones to a possible Fe-Zn alloy, again not
detected by XRD; 3, the addition of Zn may also alter the electronic structure of iron and thus
enhance the catalytic performances In order to verify these hypotheses, additional
characterization, by STEM-HAADF coupled with EDS and XPS for instance, need to be
performed in the future and the positive effect of Zn addition need to be further identified.

174
5. Conclusion
In this chapter, a preliminary exploration of the preparation of Fe/ZnO and Fe-Zn/TiO2
catalysts by DPu and of their catalytic performance for the selective hydrogenation of
butadiene reaction with an excess of propene was performed. The data collected about these
systems are rather uncomplete and should be strongly supplemented. Nevertheless, some
interesting information can already be extracted which demonstrate that the iron-based
catalysts are potentially appropriate for selective hydrogenation reactions at low temperature.
Indeed, it was not possible to evidence the formation of Fe-Zn alloy in the case of our samples
by XRD, even when ZnO was used as the support of the iron phase. Metallic iron was the
only phase visible by XRD whatever the sample, with similar crystallite sizes. The reduction
temperature employed (500 °C), imposed by the volatility of metallic Zn, might be too low to
lead to the formation of intermetallic compounds. Despite this fact, the bimetallic Fe-Zn/TiO2
catalyst showed a higher activity and stability than the monometallic one. The reason for this
superiority is still unknown and this reinforces the need for additional characterization. In the
extension of this work, such characterization will be performed in particular by STEM-
HAADF coupled with EDS on TiO2 supported Fe-Zn catalyst with various Fe:Zn atomic
ratios in parallel with the evaluation of their catalytic performances.

175
6. Reference
1. M.Armbrüster, K.Kovnir, M.Friedrich, D.Teschner, G.Wowsnick, M.Hahne, P.Gille,
L.Szentmiklósi, M.Feuerbacher, M.Heggen, F.Girgsdies, D.Rosenthal, R.Schlögl, Yu.
Grin, Nat Mater, 11 (2012) 690.
2. L.Piccolo, Chemical Communications, 49 (2013) 9149.
3. T.Ishihara, K.Eguchi, H.Arai, Applied Catalysis, 30 (1987) 225.
4. M.C.Bahome, L.L.Jewell, K.Padayachy, D.Hildebrandt, D.Glasser, A.K.Datye,
N.J.Coville, Applied Catalysis A: General, 328 (2007) 243.
5. T.Zhang, J.Liu, D.Wang, Z.Zhao, Y.Wei, K.Cheng, G.Jiang, A.Duan, Applied
Catalysis B: Environmental, 148 (2014) 520.
6. F.Studt, F.Abild-Pedersen, T.Bligaard, R.Z.Sørensen, C.H.Christensen, J.K.Nørskov,
Science, 320 (2008) 1320.
7. W.Pearson, W. Pearson, An Alphabetical Index of Work on Metals and Alloys. A
Handbook of Lattice Spacings and Structures of Metals and Alloys, 1958: p. 634.
8. Handbook, A., Volume 3: Alloy phase diagrams. ASM international, 1992: p.780.
9. M.Liang, W.Kang, K.Xie, Journal of Natural Gas Chemistry, 18 (2009) 110.
10. M.Turco, G.Bagnasco, U.Costantino, F.Marmottini, T.Montanari, G.Ramis, G.Busca,
Journal of catalysis, 228 (2004) 43.
11. C.S.Spanjers, R.S.Sim, N.P.Sturgis, B.Kabius, R.M.Rioux, ACS Catalysis, 5 (2015)
3304.
12. J.Geus, Studies in Surface Science and Catalysis, 16 (1983) 1.
13. T.Imoto, Y.Harano, Y.Nishi, S.Masuda, Bulletin of the Chemical Society of Japan, 37
(1964) 441
14. S.Lew, A. Sarofim, M. Flytzani-Stephanopoulos, Chemical engineering science, 47
(1992) 1421
15. G.Vilé, D.Albani, N.A.Barrios, N.Lopez, J.P.Ramirez, ChemCatChem, 8 (2016) 21.

176
Chapter 7: Conclusion and Outlook
This work mainly investigates the preparation and characterization of titania-supported
non-noble bimetallic Cu-Zn, Ni-Zn and Fe-Zn catalysts with various atomic ratios and their
catalytic properties for the selective hydrogenation of polyunsaturated hydrocarbons. Co-
deposition-precipitation with urea (DPu) and co-deposition-precipitation at pH 8 (DP8)
methods were employed for the sample preparation. The function of each metal (i.e., Zn, Cu,
Ni and Fe) in the catalytic reaction was first determined: Zn is inactive for butadiene selective
hydrogenation, and can only act as a modifier of the monometallic catalysts whose activity
follows the sequence Cu < Fe < Ni while the selectivity to alkenes follows the reverse order.
In the supported bimetallic catalysts preparation, it was found that metal ions were
sequentially deposited on TiO2 surface at different pHs (i.e., lower than 2 for FeIII
, ~4.5 for
CuII, ~6 for Zn
II and Fe
II and ~6.5 for Ni
II) during the preparation by DPu. These results are in
agreement with the theoretical prediction based on the solubility products of their hydroxides
compounds. On the other hand, the metal ions were simultaneously deposited on the TiO2
surface by DP8, by keeping the pH of the preparation solution fixed at 8.
For the Cu-Zn/TiO2 system, TiO2 supported 2.5 wt% Cu with different Cu:Zn ratio
(1:0, 3:1 and 1:1) were prepared by DPu and DP8. After calcination at 400 oC then reduction
at 350 oC, metallic Cu, intermetallic Cu0.9Zn0.1 and Cu3Zn1 alloy were observed by XRD in
the DPU Cu/TiO2, CuZn 3:1/TiO2 and CuZn 1:1/TiO2 samples, respectively. Moreover, two
different metal particle size ranges (~3 nm and > 15 nm) were observed for DPu samples,
while uniform particle size (< 2 nm) were obtained for DP8 samples. EDS analyses confirmed
the presence of bimetallic particles in all samples, with nevertheless various Cu:Zn ratios.
Regarding the Ni-Zn/TiO2 system, TiO2-supported 0.5 wt% Ni with various Ni:Zn ratios (1:0,
1:1, 1:3 and 1:5) were prepared by DPu and DP8. STEM-HAADF imaging coupled with EDS
analysis revealed that Ni-Zn alloyed particles were formed after reduction at 450 °C, and that
the Ni:Zn atomic ratio in Ni-Zn particles decreases with the increase of Zn content in DPU
and DP8 samples, from 12:1 for DPU Ni:Zn 1:1/TiO2 to 1.8:1 for DPU Ni:Zn 1:5/TiO2.
Moreover, alloying Ni with Zn increased the average nanoparticle size and broadened the
particle size distribution compared to monometallic Ni.
177
The catalytic results showed that alloying Cu and Ni with Zn slightly decreased the
activity in butadiene selective hydrogenation, but had almost no effect on the selectivity to
alkenes for Cu-Zn while decreased it for Ni-Zn. The important result is that bimetallic Cu-
Zn/TiO2 and Ni-Zn/TiO2 catalysts displayed much higher stability under isothermal reaction
than their monometallic counterparts, which deactivated rapidly in the first few hours. The
preparation method seems to have only a limited influence on the catalytic performances. The
higher stability of the Zn containing samples was ascribed to the formation of a lower amount
of carbonaceous species on the bimetallic catalysts. Modification of the size of the active
metal (Cu or Ni) surface ensembles by alloying with Zn and reduction of the amount of acid
sites on the catalyst surface resulting from the addition of Zn species were proposed to
account for the enhancement of the stability under time on stream.
Interestingly, change in the composition of the Cu-Zn alloy was observed by XRD
during the catalytic reaction, with a transition from Cu3Zn to Cu0.7Zn0.3 alloy for the DPU Cu-
Zn 1:1/TiO2 sample, underlining the dynamic behavior of such nano-alloy systems.
The iron-based bimetallic system was only briefly studied. The preliminary results
showed that Fe2O3 and ZnFe2O4 were formed in the as-prepared 2.5 wt% Fe/TiO2 and Fe-Zn
1:1/TiO2, respectively. After sample reduction at 500 oC, only metallic Fe was detected by
XRD in the monometallic Fe/TiO2 and Fe-Zn 1:1/TiO2 sample, without any visible bimetallic
Fe-Zn phase. Nevertheless, bimetallic Fe-Zn 1:1/TiO2 showed higher catalytic activity and
stability than monometallic Fe/TiO2 catalyst. This system is promising and, in the future, a
detailed work would focus on the characterization of the size and composition of the
supported metal nanoparticles in the bimetallic Fe-Zn/TiO2 samples, using STEM-HAADF
coupled with EDS for instance, in order to elucidate the positive effect of the addition of Zn to
iron catalysts.
In summary, this thesis presents three of the most interesting non-noble bimetallic
catalysts, Cu-Zn, Ni-Zn and Fe-Zn, predicted by Studt et al [1] in 2008 for the selective
hydrogenation of polyunsaturated hydrocarbons. The experimental results obtained are
roughly in agreement with the DFT data exposed in the previous article in terms of activity
and selectivity scales. However, the alloys phases obtained in our work are different from the
ones studied in this article, which preclude some direct comparison. Nevertheless, the
bimetallic systems described in this thesis demonstrate some interesting features, especially
concerning the increase in stability induced by the addition of Zn. Considering the high cost

178
of the commercial noble-based catalysts (Pd-based catalysts) for the selective hydrogenation
of polyunsaturated hydrocarbons, it is always worth and necessary to keep exploring any new
catalysts with high catalytic activity, selectivity to alkenes and high stability, and moreover,
lower price. This explorative study is intended to demonstrate the potential for using base
metals such as Cu, Ni or Fe for application in selective hydrogenation reaction. The various
results presented in this work show that such systems composed of bimetallic nanoparticles
are complex, with several possible phases and compositions co-existing and evolving under
reaction conditions. Thus, extensive additional studies are clearly required to foresee any
possible long-term catalytic implementation.

Catalyseurs bimétalliques à base de métaux non nobles
pour l’hydrogénation sélective du Butadiène
Résumé:
Ce travail porte sur la préparation et la caractérisation de catalyseurs bimétalliques Cu-Zn, Ni-Zn et
Fe-Zn supportés sur TiO2 avec des rapports atomiques variables et sur l’étude de leurs propriétés
catalytiques pour l'hydrogénation sélective d’hydrocarbures polyinsaturés. Les méthodes de co-dépôt-
précipitation à l'urée (DPu) et co-dépôt-précipitation à pH fixe (DP8) ont été utilisées pour la
préparation des matériaux. Les ions métalliques se déposent séquentiellement sur la surface de TiO2
(selon la séquence CuII < Zn
II ≈Fe
II <Ni
II) durant la méthode DPu, alors qu'ils se déposent
simultanément en utilisant la méthode DP8. Après réduction de l'échantillon à une température
appropriée (350°C pour Cu-Zn, 450
°C pour Ni-Zn et 500
°C pour Fe-Zn), les analyses par DRX et
STEM-HAADF couplé à EDS ont montré que des nanoparticules bimétalliques étaient formées pour
les systèmes Cu-Zn/TiO2 (alliage Cu3Zn1 ou Cu0.9Zn0.1) et Ni-Zn/TiO2 (alliage Ni1Zn1 ou Ni4Zn1) avec
une taille moyenne de particule inférieure à 5 nm. Seul du fer métallique a été détecté par DRX dans le
cas de Fe-Zn/TiO2. Zn est inactif pour l'hydrogénation sélective du butadiène et agit comme un
modificateur des catalyseurs monométalliques dont l'activité suit la séquence: Cu < Fe < Ni. L'ajout de
Zn diminue légèrement l'activité, influence la sélectivité en butènes, mais augmente fortement la
stabilité des catalyseurs. Cette plus grande stabilité des catalyseurs bimétalliques a été attribuée à la
formation d'une quantité inférieure de dépôt carboné pendant la réaction, ceci résultant de la
modification de la taille des ensembles de surface du métal actif par alliage avec Zn.
Mots clés: Catalyseurs bimétallique non nobles; Cu-Zn; Ni-Zn; Fe-Zn; Dépôt - précipitation à l'urée;
Hydrogénation sélective du butadiène;
Selective Hydrogenation of Butadiene over Non-noble Bimetallic Catalysts
Abstract:
This work investigates the preparation and characterization of titania-supported non-noble bimetallic
Cu-Zn, Ni-Zn and Fe-Zn catalysts with various atomic ratios and their catalytic properties for the
selective hydrogenation of polyunsaturated hydrocarbons. Co-deposition-precipitation with urea (DPu)
and co-deposition-precipitation at fixed pH (DP8) methods were employed for the samples
preparation. The metal ions were sequentially deposited onto the TiO2 surface (the sequence of pH for
ions deposition being CuII
< ZnII ≈Fe
II < Ni
II) during the DPu, while they were simultaneously
deposited using DP8 method. After sample reduction at proper temperature (350 °C for Cu-Zn, 450
°C
for Ni-Zn and 500 °C for Fe-Zn), XRD and STEM-HAADF coupled with EDS showed that bimetallic
nanoparticles were formed in Cu-Zn/TiO2 (Cu3Zn1 or Cu0.9Zn0.1 alloy) and Ni-Zn systems (Ni1Zn1 or
Ni4Zn1 alloy) with average particle size smaller than 5 nm. Only metallic Fe was detected by XRD in
Fe-Zn/TiO2. Zn is inactive for butadiene selective hydrogenation, and acts as a modifier of the
monometallic catalysts whose activity follows the sequence: Cu < Fe < Ni. The addition of Zn slightly
decreases the activity and influences the selectivity to butenes, but provides much more stable
catalysts. The higher stability of the bimetallic catalysts was ascribed to the formation of lower amount
of carbonaceous species during the reaction, resulting from the change in the size of the active metal
surface ensembles by alloying with Zn.
Keywords: Non-noble bimetallic catalysts; Cu-Zn; Ni-Zn; Fe-Zn; Deposition-precipitation with urea;
Butadiene selective hydrogenation;


![SPECIAL TOPIC: Single-atom Catalysts Single-atom Pd dispersed … · 2020-06-06 · lectivity with 95% conversion at 50°C in 1,3-butadiene hydrogenation [44]. Cu-alloyed Pd SAC exhibited](https://img.dokumen.tips/doc/110x75/5f70e78e2136b54a186ff2c9/special-topic-single-atom-catalysts-single-atom-pd-dispersed-2020-06-06-lectivity.jpg)