Embed Size (px)
Citation preview

©FUNPEC-RP www.funpecrp.com.brGenetics and Molecular Research 15 (1): gmr.15017720
Selection and validation of reference house-keeping genes in the J774A1 macrophage cell line for quantitative real-time PCR
F.B. Ferraz and J.H. Fernandez
Laboratório de Química e Funções de Proteínas e Peptídeos, Centro de Biociências e Biotecnologia, Universidade Estadual do Norte Fluminense Darcy Ribeiro, Campos dos Goytacazes, RJ, Brasil
Corresponding author: F.B. FerrazE-mail: [email protected]
Genet. Mol. Res. 15 (1): gmr.15017720Received September 24, 2015Accepted November 16, 2015Published March 11, 2016DOI http://dx.doi.org/10.4238/gmr.15017720
ABSTRACT. Macrophages are essential components of the innate and adaptive immune responses, playing a decisive role in atherosclerosis, asthma, obesity, and cancer. The differential gene expression resulting from adhesion of macrophages to the extra-cellular matrix (ECM) has been studied in the J774A1 murine macrophage cell line using quantitative polymerase chain reaction (qPCR). The goal of this study was to identify housekeeping genes (HKGs) that remain stable and unaltered under normal culture conditions and in the presence of laminin after a time lapse of 6 and 24 h. The expression stabilities of eight commonly used reference genes were analyzed by determining the comparative threshold cycle (∆∆Ct) values, and using the BestKeeper, NormFinder, and geNorm algorithms. BestKeeper analysis revealed that the glyceraldehyde-3-phosphate dehydrogenase (GAPDH), peptidylprolyl isomerase A (PPIA), and ribosomal protein L13a (RPL13A) genes were highly stable, confirming the results of the ∆∆Ct analysis. On the other hand, NormFinder proposed RPL13A and beta-glucuronidase (GUSB) to be the most suitable

2F.B. Ferraz and J.H. Fernandez
©FUNPEC-RP www.funpecrp.com.brGenetics and Molecular Research 15 (1): gmr.15017720
combination, and geNorm adjudged RPL13A, PPIA, and GUSB to be the most stable across all culture conditions. All programs discarded the use of actin beta and beta-2-microglobulin for normalization. The collected data indicated that RPL13A, PPIA, GAPDH, and GUSB as highly suitable as reference genes for qPCR analysis of murine macrophages under normal and ECM-simulated culture conditions. This study also emphasizes the importance of evaluating HKGs used for normalization to ensure the accuracy of qPCR data.
Key words: Housekeeping genes; Gene expression; Macrophage; Laminin; qPCR
INTRODUCTION
Macrophages are important players in the innate and adaptive immune responses. In their natural environment, macrophage response to extracellular matrix (ECM) components such as lam-inin and fibronectin, include adhesion, proliferation, gene expression, and signaling (Förster et al., 2008; McNally et al., 2008; Sorokin, 2010). However, macrophages alter their cytokine/chemokine response profiles when cultured in hydrophobic, hydrophilic, and/or ionic surface-modified polymers (Dinnes et al., 2007; Jones et al., 2007). The natural cellular response can be maintained if the ECM components are provided on material surfaces in such a way at the micrometer and nanometer levels that they simulate the natural topography of cell growth area (Yim and Leong, 2005).
Previous studies have shown that macrophages play decisive roles in atherosclerosis (Riazy et al., 2011; Moore et al., 2013), obesity (Baker et al., 2011), and cancer (Yoshikawa et al., 2012; Zhang et al., 2013). The murine macrophage lineage J774A1 cell line is a great in vitro model because of its remarkable plasticity (Franz et al., 2011; Hosokawa et al., 2011). Several recent genomic studies have used the J774A1 cell line to evaluate cytokine/chemokine activity (El Aamri et al., 2015), integrin modulation (Ferraz et al., 2016), inflammatory activity (Bohr et al., 2013), and cancer markers (Prorok-Hamon et al., 2014). These studies mainly utilized quantitative polymerase chain reaction (qPCR), a reliable and versatile technique, to evaluate gene expression under vari-ous biological conditions.
Accuracy of qPCR data requires normalization in order to validate the expression of housekeeping genes (HKGs) in each tissue and under each experimental condition (Vandesom-pele et al., 2002). HKGs encode proteins that are essential for cell survival; therefore, the expres-sion of these genes should be stable in all cells and tissues across various developmental stages and physiological and environmental conditions (Nelissen et al., 2010). However, previous studies have demonstrated that HKG expression varies under different experimental conditions (Shah and Faridi, 2011; Jacob et al., 2013; Gimeno et al., 2014); this necessitates the use of at least three reference genes to ensure the correct normalization of qPCR data (Vandesompele et al., 2002).
Several mathematical algorithms have been developed for the evaluation of reference genes. BestKeeper, a Microsoft Excel workbook, is a useful tool that ranks the stability of a candidate gene by pairwise correlations across the candidate reference genes (Pfaffl et al., 2004). NormFinder algorithm (Andersen et al., 2004) estimates the variation in expression of each candidate reference gene, and provides an overall stability value. GeNorm (Vandesompele et al., 2002) defines gene stability as the average pairwise variation of a particular gene to other candidate genes. Another common alternative is the comparative threshold cycle (∆∆Ct) method, wherein the stability of the can-

3Identifying suitable reference HKGs in macrophages for qPCR
©FUNPEC-RP www.funpecrp.com.brGenetics and Molecular Research 15 (1): gmr.15017720
didate reference gene is ranked based on the repeatability of gene expression (Silver et al., 2006).Several studies have attempted to evaluate the variation of HKGs in different tissues
and samples, in order to propose the best candidate reference gene for qPCR. However, studies evaluating the expression stability of candidate reference genes in macrophages have not been reported, despite their role in determining the pathology and adaptive functional phenotype based on environmental stimuli (Franz et al., 2009).
In this study, we attempted to determine if the most stable HKG can be suitable as a refer-ence gene for the study of macrophage adhesion to ECM components. To the best of our knowl-edge, this is the first study attempting to determine the most suitable HKG facilitating the analysis of murine macrophages under normal and ECM culture conditions. By analyzing the results of this study, we formulated useful general guidelines for the experimental selection of reference genes for qPCR. Additionally, we observed that among the eight putative reference genes representing different functional classes and gene families, RPL13A, PPIA, GAPDH, and GUSB are the most constant and reliable reference genes that could be used to determine the adhesive capacity of mouse macrophages under ECM conditions.
MATERIAL AND METHODS
Cell culture and treatment conditions
J774A1 murine macrophage cells were cultured in Dulbecco’s Modified Eagle’s Medium (Sigma-Aldrich, St. Louis, MO, USA) supplemented with 10% fetal bovine serum (Sigma-Aldrich) at 37°C in a 5% CO2 incubator. The culture medium was changed every 2 days and confluent cells were split by trypsinization. J774A1 cells (2.5 x 10⁵) were then incubated under normal culture conditions (Ctrl) and in the presence of laminin (laminin-coated plates; 10 µg/mL; Sigma-Aldrich) for 6 h (6 h + lam) and 24 h (24 h + lam).
RNA isolation and cDNA synthesis
RNA was extracted in triplicate from Ctrl and laminin-coated condition using NucleoSpin RNAII kit (Macherey-Nagel, Duren, Germany) according to the manufacturer protocols. cDNA was synthesized from the extracted RNA using the Revert-Aid First Strand cDNA Synthesis Kit (Thermo Scientific Fisher, Carlsbad, CA, USA) according to the manufacturer protocols. The concentration and purity of cDNA samples were estimated by evaluating the ratios of absorbance at 260/280 and 260/230 nm using the Picodrop spectrophotometer (Picodrop, South Cambridgeshire, UK).
Selection of candidate reference genes
HKGs commonly used as reference genes in different tissue and cell lineages (Shah and Faridi, 2011; Jacob et al., 2013; Gimeno et al., 2014) were assessed for their use as reference genes in macrophages cultured under normal and laminin-coated conditions.
Primers specific for actin beta (ACTB), beta-2-microglobulin (B2M), glyceraldehyde-3-phosphate dehydrogenase (GAPDH), glucuronidase beta (GUSB), hypoxanthine phosphoribo-syltransferase-1 (HPRT1), phosphoglycerate kinase 1 (PGK1), peptidylprolyl isomerase A (PPIA), and ribosomal protein L13a (RPL13A) were purchased from GenOne Biotechnologies (Rio de Janeiro, RJ, Brazil; Table 1).

4F.B. Ferraz and J.H. Fernandez
©FUNPEC-RP www.funpecrp.com.brGenetics and Molecular Research 15 (1): gmr.15017720
Table 1. Candidate reference genes evaluated in this study.
Full name Symbol Gene function Gene ID Actin beta ACTB Cytoskeletal structural actin 11461 Beta-2-microglobulin B2M Component of the MHC class 1 molecules 12010 Glyceraldehyde-3-phosphate dehydrogenase
GAPDH Enzyme in glycolysis anel nuclear functions 14433
Glucuronidase beta GUSB Hydrolase that degrades glycosaminoglycans 110006 Hypoxanthine phosphoribosyltransferase-1 HPRT1 Generation of purine nucleotides 15452 Phosphoglycerate kinase 1 PGK1 Glycolytic enzyme 18655 Peptidylprolyl isomerase A PPIA Accelerate the folding of proteins 268373 Ribosomal protein L13a RPL13A Structural component of the 60S ribosomal
subunit 22121
qPCR
qPCR was performed in triplicate; each run included an additional technical triplicate (N = 9 runs; Figure S1). qPCR was performed in a StepOne Plus thermal cycler (Applied Biosystems, Foster City, CA, USA); the cycling conditions were set as per the manufacturer protocols. The 12-µL reaction mixture was composed of 6.25 µL SYBR Green Master Mix (Thermo Scientific Fisher), 100 nM ROX (Thermo Scientific Fisher), 50 ng cDNA, 1 µM forward and reverse primer (GenOne Biotechnologies), and 3.7 µL nuclease-free water. The PCR was followed by a melt curve analysis to determine the specificity of the PCR products and the absence of primer dimer formation. The amplification integrity of each candidate gene was confirmed by electrophoresing the PCR products on a 2% agarose gel; the gel was then observed under UV light (L Pix Molecular Imaging; Loccus Biotecnologia, São Paulo, SP, Brazil).
Analysis of reference gene expression
The fluorescence raw data was analyzed by using StepOne v.2.1 (Applied Biosystems); the mean threshold cycle, standard deviation, Pearson correlation coefficient (r), and coefficient of variance of gene expression were calculated between samples cultured under different conditions, based on their crossing points, using BestKeeper. The data was also analyzed using the compara-tive threshold cycle (∆∆Ct) method in StepOne v.2.1; statistically significant differences in amplifica-tion efficiency were assessed using GraphPad Prism5 by two-way analysis of variance (ANOVA). Different groups and their conditions were compared by the Bonferroni post-hoc test. Results with P ≤ 0.05 were considered significant.
Comparative evaluation of the expression stability of candidate reference genes was per-formed using NormFinder (Andersen et al., 2004) and the Ct values were converted to relative quantities to analyze the logarithmic transformation using geNorm (Vandesompele et al., 2002), in order to obtain a stability value (M value).
The analysis was based on the null hypothesis that amplification efficiency is comparable within sample groups allowing the detection of outlier samples, and that the amplification efficiency is compa-rable between sample groups in order to determine the amplification equivalence (Gimeno et al., 2014).
RESULTS
Quality and integrity of cDNA samples
The quality and integrity of cDNA synthesized from laminin-treated and -untreated J774A1

5Identifying suitable reference HKGs in macrophages for qPCR
©FUNPEC-RP www.funpecrp.com.brGenetics and Molecular Research 15 (1): gmr.15017720
murine macrophages were evaluated. The absorbance ratio 260/280 nm was used to assess the purity of DNA; the absorbance ratio 260/230 nm was used as a secondary parameter to identify the presence of contaminants. The average of absorbance ratios (mean ± SD) under normal culture conditions were 1.870 ± 0.04 (260/280 nm) and 1.896 (260/230 nm), and in the presence of laminin after a time lapse of 6 and 24 h were 1.845 and 1.832 (260/280 nm) and 1.939 and 1.967 (260/230 nm), respectively. These results suggested that the cDNA samples were of a sufficient quality and integrity for further analysis (Figure 1).
Figure 1. Image of a 2% agarose gel electrophoresis. PCR products amplified from cDNA obtained from cells cultured under normal conditions (A), and in the presence of laminin for 6 h (B) and 24 h (C) formed bands corresponding to the expected size of each tested gene. Lane 1 = ACTB; lane 2 = B2M; lane 3 = GAPDH; lane 4 = GUSB; lane 5 = HTPR1; lane 6 = PGK1; lane 7 = PPIA; lane 8 = RPL13A.
Specificity of real-time PCR amplification
The amplification plots (data not shown) were analyzed, and the presence of a single peak in each melting curve suggested primer specificity (Figure 2). Agarose gel electrophoresis of the PCR products confirmed these results; a single band was observed at the expected size of each gene tested in this study (Figure 1). These results confirmed that the cDNA synthesized from extracted RNA was of sufficient quality for qPCR.
Expression profile of reference genes
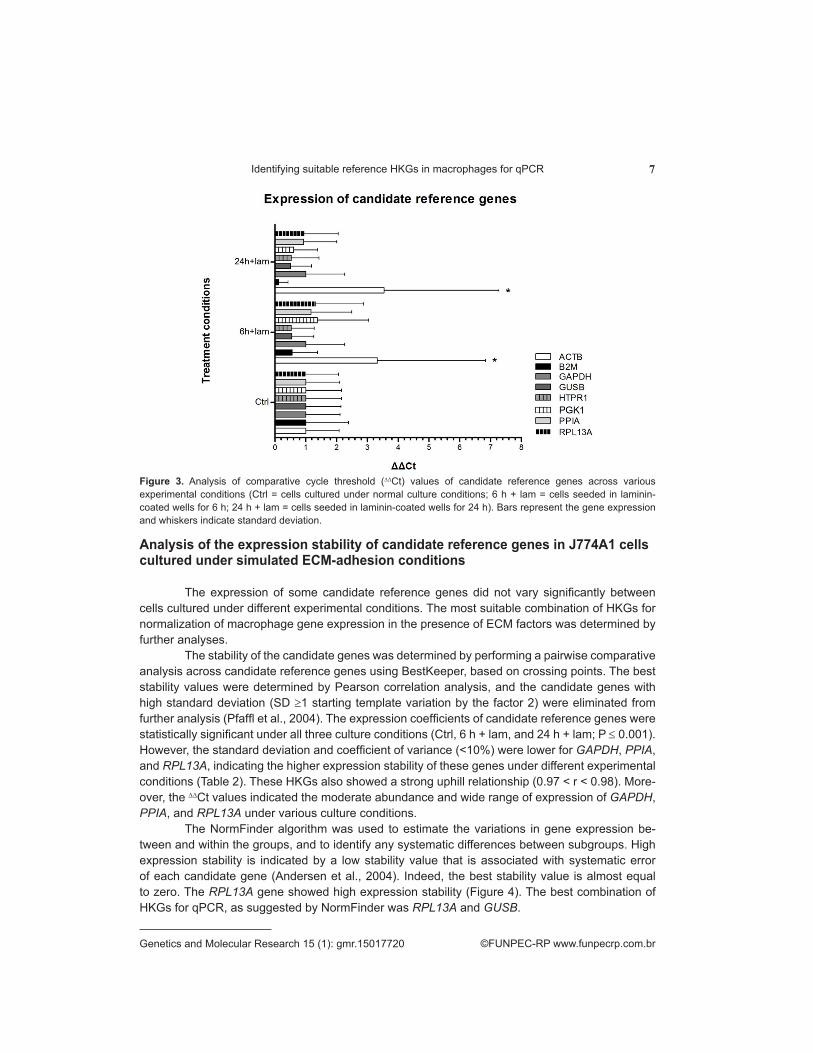
Comparative threshold cycle (∆∆Ct) values of a majority of the candidate reference genes in cells cultured under different experimental conditions (Ctrl, 6 h + lam, 24 h + lam) obtained us-ing StepOne v.2.1 ranged from 0.51 to 1.37. Significantly discordant ∆∆Ct values were observed for B2M (< 0.12) after 24 h and ACTB (> 3.32) after 6 h and 24 h expression in macrophage cells cultured in the presence of laminin (Figure 3; P ≤ 0.05).

6F.B. Ferraz and J.H. Fernandez
©FUNPEC-RP www.funpecrp.com.brGenetics and Molecular Research 15 (1): gmr.15017720
Figure 2. Melt curve of the eight reference genes; the images represent one of the nine technical replicates of qPCR using cDNA extracted from cells cultured under normal conditions (A), and in the presence of laminin after 6 h (B) and 24 h (C).
7Identifying suitable reference HKGs in macrophages for qPCR
©FUNPEC-RP www.funpecrp.com.brGenetics and Molecular Research 15 (1): gmr.15017720
Figure 3. Analysis of comparative cycle threshold (∆∆Ct) values of candidate reference genes across various experimental conditions (Ctrl = cells cultured under normal culture conditions; 6 h + lam = cells seeded in laminin-coated wells for 6 h; 24 h + lam = cells seeded in laminin-coated wells for 24 h). Bars represent the gene expression and whiskers indicate standard deviation.
Analysis of the expression stability of candidate reference genes in J774A1 cells cultured under simulated ECM-adhesion conditions
The expression of some candidate reference genes did not vary significantly between cells cultured under different experimental conditions. The most suitable combination of HKGs for normalization of macrophage gene expression in the presence of ECM factors was determined by further analyses.
The stability of the candidate genes was determined by performing a pairwise comparative analysis across candidate reference genes using BestKeeper, based on crossing points. The best stability values were determined by Pearson correlation analysis, and the candidate genes with high standard deviation (SD ≥1 starting template variation by the factor 2) were eliminated from further analysis (Pfaffl et al., 2004). The expression coefficients of candidate reference genes were statistically significant under all three culture conditions (Ctrl, 6 h + lam, and 24 h + lam; P ≤ 0.001). However, the standard deviation and coefficient of variance (<10%) were lower for GAPDH, PPIA, and RPL13A, indicating the higher expression stability of these genes under different experimental conditions (Table 2). These HKGs also showed a strong uphill relationship (0.97 < r < 0.98). More-over, the ∆∆Ct values indicated the moderate abundance and wide range of expression of GAPDH, PPIA, and RPL13A under various culture conditions.
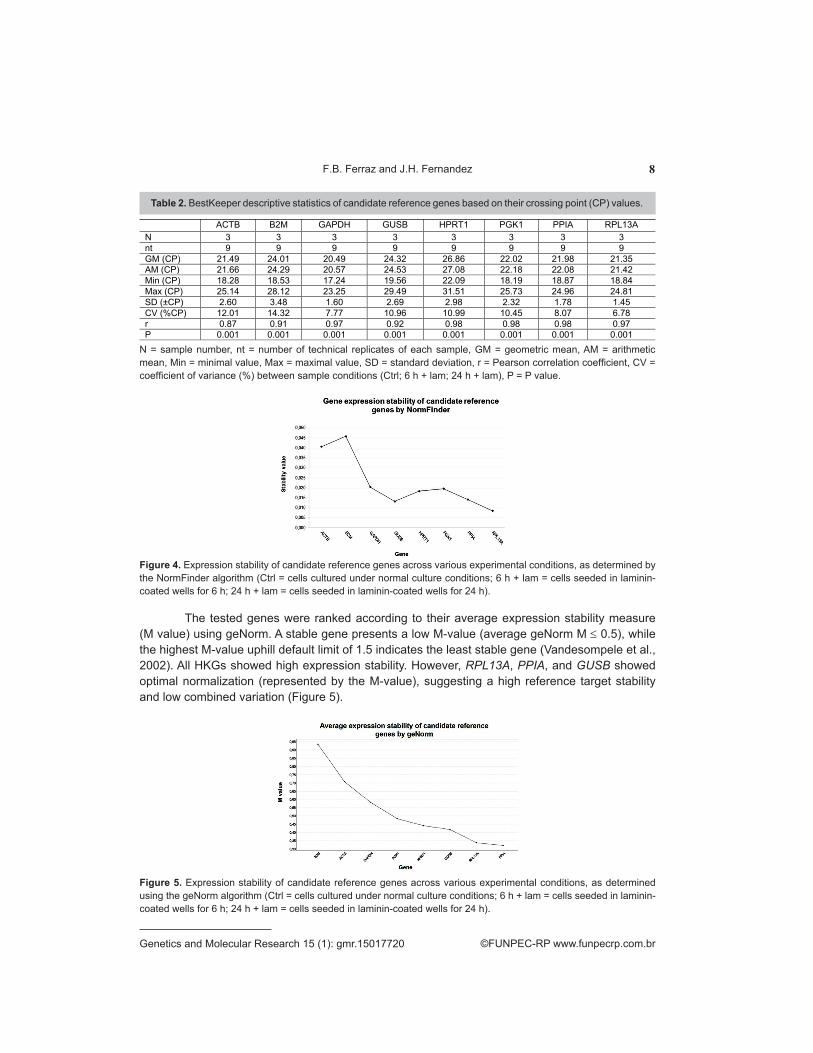
The NormFinder algorithm was used to estimate the variations in gene expression be-tween and within the groups, and to identify any systematic differences between subgroups. High expression stability is indicated by a low stability value that is associated with systematic error of each candidate gene (Andersen et al., 2004). Indeed, the best stability value is almost equal to zero. The RPL13A gene showed high expression stability (Figure 4). The best combination of HKGs for qPCR, as suggested by NormFinder was RPL13A and GUSB.
8F.B. Ferraz and J.H. Fernandez
©FUNPEC-RP www.funpecrp.com.brGenetics and Molecular Research 15 (1): gmr.15017720
The tested genes were ranked according to their average expression stability measure (M value) using geNorm. A stable gene presents a low M-value (average geNorm M ≤ 0.5), while the highest M-value uphill default limit of 1.5 indicates the least stable gene (Vandesompele et al., 2002). All HKGs showed high expression stability. However, RPL13A, PPIA, and GUSB showed optimal normalization (represented by the M-value), suggesting a high reference target stability and low combined variation (Figure 5).
Table 2. BestKeeper descriptive statistics of candidate reference genes based on their crossing point (CP) values.
ACTB B2M GAPDH GUSB HPRT1 PGK1 PPIA RPL13A N 3 3 3 3 3 3 3 3 nt 9 9 9 9 9 9 9 9 GM (CP) 21.49 24.01 20.49 24.32 26.86 22.02 21.98 21.35 AM (CP) 21.66 24.29 20.57 24.53 27.08 22.18 22.08 21.42 Min (CP) 18.28 18.53 17.24 19.56 22.09 18.19 18.87 18.84 Max (CP) 25.14 28.12 23.25 29.49 31.51 25.73 24.96 24.81 SD (±CP) 2.60 3.48 1.60 2.69 2.98 2.32 1.78 1.45 CV (%CP) 12.01 14.32 7.77 10.96 10.99 10.45 8.07 6.78 r 0.87 0.91 0.97 0.92 0.98 0.98 0.98 0.97 P 0.001 0.001 0.001 0.001 0.001 0.001 0.001 0.001
N = sample number, nt = number of technical replicates of each sample, GM = geometric mean, AM = arithmetic mean, Min = minimal value, Max = maximal value, SD = standard deviation, r = Pearson correlation coefficient, CV = coefficient of variance (%) between sample conditions (Ctrl; 6 h + lam; 24 h + lam), P = P value.
Figure 4. Expression stability of candidate reference genes across various experimental conditions, as determined by the NormFinder algorithm (Ctrl = cells cultured under normal culture conditions; 6 h + lam = cells seeded in laminin-coated wells for 6 h; 24 h + lam = cells seeded in laminin-coated wells for 24 h).
Figure 5. Expression stability of candidate reference genes across various experimental conditions, as determined using the geNorm algorithm (Ctrl = cells cultured under normal culture conditions; 6 h + lam = cells seeded in laminin-coated wells for 6 h; 24 h + lam = cells seeded in laminin-coated wells for 24 h).

9Identifying suitable reference HKGs in macrophages for qPCR
©FUNPEC-RP www.funpecrp.com.brGenetics and Molecular Research 15 (1): gmr.15017720
DISCUSSION
The selected set of candidate reference genes ACTB, B2M, GAPDH, GUSB, HPRT1, PGK1, PPIA, and RPL13A are associated with a wide variety of cellular functions (Nelissen et al., 2010; Wang et al., 2012). Therefore, the identification of reliable reference genes across various develop-mental and experimental conditions is required to avoid unstable or misleading qPCR results. Studies reporting HKGs information would contribute to the improvement of experimental design and assure the reproducibility and reliability of PCR results (Vandesompele et al., 2002; Dheda et al., 2004).
After verifying the quality of the synthesized cDNA, we used different computational pro-grams and statistical analyses to identify the best internal controls for normalization in macrophage adhesion experiments, as there is no universally accepted method to determine the reference genes for specific experimental conditions (Vandesompele et al., 2002; Andersen et al., 2004).
ACTB and B2M were found to be the least stable reference genes, showing discordant ∆∆Ct values, a high coefficient of variance, and high stability. This indicated that these HKGs are not good macrophage reference genes; these results also indicated that the expression of these genes could be reshaped by various ECM components present in culture, or be sensitive to adhesion-specific sig-naling. Previous studies have also reported divergent qPCR results for ACTB in rat oligodendrocytes and rat brain tissue (Bonefeld et al., 2008; Nelissen et al., 2010) and B2M in human heart tissues (Molina et al., 2014). These findings emphasize the importance of evaluating all genes used for nor-malization, even if they are traditionally used in other studies (Nelissen et al., 2010).
The remaining genes showed a similar range of ∆∆Ct values; therefore, the BestKeeper and NormFinder algorithms were used to identify the most suitable normalization gene. Best-Keeper showed that GAPDH, PGK1, PPIA, and RPL13A were stable across a wide expression range that was statistically significant across all experimental conditions. Interestingly, NormFinder analysis indicated that a combination of RPL13A and GUSB showed high expression stability, and geNorm ranked RPL13A, PPIA, and GUSB as high stability targets with a low combinatorial varia-tion. These rankings are not identical; however, the order of stability of the candidate genes differed only slightly between BestKeeper, NormFinder, and geNorm.
All analytical programs indicated the high stability of RPL13A under all experimental con-ditions. This corresponds to the conclusions of previous reports that RPL family members are good candidates for internal reference genes in ovarian tissue (Fu et al., 2010), breast cancer cells (Shah and Faridi, 2011), oligodendrocytes (Nellissen et al., 2010), and small intestinal cells (Matoušková et al., 2014).
GAPDH and PPIA were also highly stable under normal and laminin-coated condi-tions. The reliability and stability of PPIA was verified in macrophages under all culture condi-tions, similar to that observed in normal and ovarian cancer cells (Jacob et al., 2013). Previous studies have reported GAPDH to be a highly unstable gene (Jacob et al., 2013; Gimeno et al., 2014; Matoušková et al., 2014), as the gene expression can be influenced by certain experi-mental conditions (Barber et al., 2005). Herein, we suggest that GAPDH can be considered as an internal control for macrophages, based on its stability and lower variance under various experimental conditions, as shown by BestKeeper analysis and the ∆∆Ct values. This conclu-sion was also arrived at in lepidopteran insects, barley, and mouse uterus cells (Teng et al., 2012; Janská et al., 2013; Lin et al., 2013).
GUSB, HTPR1, and PGK1 showed good stability values, but high coefficient of vari-ance and standard deviation across experimental conditions, discrediting the possibility of using these genes as internal controls. Curiously, NormFinder and geNorm analyses indicated

10F.B. Ferraz and J.H. Fernandez
©FUNPEC-RP www.funpecrp.com.brGenetics and Molecular Research 15 (1): gmr.15017720
that GUSB was the second best reference gene, based on its stability. However, this is an expected outcome, as different mathematical approaches were used to calculate stability for each method (Artico et al., 2010; Gimeno et al., 2014). The high correlation among the differ-ent programs used to rank the reference genes is a troubling shortcoming that can potentially influence internal control selection, as it is possible to obtain disparate results from different analytical tools (Jacob et al., 2013; Kozera and Rapacz, 2013). This highlights the need for employing more than two analytical tools for the selection of a set of reference genes with vary-ing functions, but with common regulatory effects.
To the best of our knowledge, this is the first attempt to identify suitable HKGs for qPCR analysis of J774A1 murine macrophage cells cultured under normal and ECM-simulating culture conditions. This study also helped formulate useful general guidelines for the selection of reference genes in macrophages for qPCR. We identified RPL13A, PPIA, GAPDH, and GUSB as the most constant, reliable, and indispensable reference genes for the analysis of macrophages.
Conflicts of interest
The authors declare no conflict of interest.
ACKNOWLEDGMENTS
Special thanks to Prof. Renato A. DaMatta (LBCT-CBB-UENF) for providing access to the J774A1 lineage, to Prof. André O. Carvalho (LFBM-CBB-UENF) for the inestimable help in conducting the experiments, and to Prof. Gustavo L. Rezende (LQFPP-CBB-UENF) for the valu-able advices pertaining to the analysis of the obtained results. Research supported by the #E-26/110.216/2011 and #E-26/110.353/2012 grants given to J.H. Fernandez, and the FAPERJ doc-toral degree grant awarded to F.B. Ferraz.
REFERENCES
Andersen CL, Jensen JL and Ørntoft TF (2004). Normalization of real-time quantitative reverse transcription-PCR data: a model-based variance estimation approach to identify genes suited for normalization, applied to bladder and colon cancer data sets. Cancer Res. 64: 5245-5250. http://dx.doi.org/10.1158/0008-5472.CAN-04-0496
Artico S, Nardeli SM, Brilhante O, Grossi-de-Sa MF, et al. (2010). Identification and evaluation of new reference genes in Gossypium hirsutum for accurate normalization of real-time quantitative RT-PCR data. BMC Plant Biol. 10: 49-61. http://dx.doi.org/10.1186/1471-2229-10-49
Baker RG, Hayden MS and Ghosh S (2011). NF-κB, inflammation, and metabolic disease. Cell Metab. 13: 11-22. http://dx.doi.org/10.1016/j.cmet.2010.12.008
Barber RD, Harmer DW, Coleman RA and Clark BJ (2005). GAPDH as a housekeeping gene: analysis of GAPDH mRNA expression in a panel of 72 human tissues. Physiol. Genomics 21: 389-395. http://dx.doi.org/10.1152/physiolgenomics.00025.2005
Bohr S, Patel SJ, Shen K, Vitalo AG, et al. (2013). Alternative erythropoietin-mediated signaling prevents secondary microvascular thrombosis and inflammation within cutaneous burns. Proc. Natl. Acad. Sci. USA 110: 3513-3518. http://dx.doi.org/10.1073/pnas.1214099110
Bonefeld BE, Elfving B and Wegener G (2008). Reference genes for normalization: a study of rat brain tissue. Synapse 62: 302-309. http://dx.doi.org/10.1002/syn.20496
Dheda K, Huggett JF, Bustin SA, Johnson MA, et al. (2004). Validation of housekeeping genes for normalizing RNA expression in real-time PCR. Biotechniques 37: 112-114, 116, 118-119.
Dinnes DL, Marçal H, Mahler SM, Santerre JP, et al. (2007). Material surfaces affect the protein expression patterns of human macrophages: A proteomics approach. J. Biomed. Mater. Res. A 80: 895-908. http://dx.doi.org/10.1002/jbm.a.30967
El Aamri F, Remuzgo-Martínez S, Acosta F, Real F, et al. (2015). Interactions of Streptococcus iniae with phagocytic cell line. Microbes Infect. 17: 258-265. http://dx.doi.org/10.1016/j.micinf.2014.06.006

11Identifying suitable reference HKGs in macrophages for qPCR
©FUNPEC-RP www.funpecrp.com.brGenetics and Molecular Research 15 (1): gmr.15017720
Ferraz F B, Cunha PM, Fraga HM and Fernandez JH (2016) a6b1-antagonist peptide downregulate laminin-dependent adhesion and migration in J774A1 macrophages. Biochem. Cell Biol. In press.
Förster R, Davalos-Misslitz AC and Rot A (2008). CCR7 and its ligands: balancing immunity and tolerance. Nat. Rev. Immunol. 8: 362-371. http://dx.doi.org/10.1038/nri2297
Franz S, Hoeve MA, Wickert S, Janko C, et al. (2009). Clearance of apo Nph induces an immunosuppressive response in pro-inflammatory type-1 and anti-inflammatory type-2 MPhi. Autoimmunity 42: 275-277. http://dx.doi.org/10.1080/08916930902828080
Franz S, Rammelt S, Scharnweber D and Simon JC (2011). Immune responses to implants - a review of the implications for the design of immunomodulatory biomaterials. Biomaterials 32: 6692-6709. http://dx.doi.org/10.1016/j.biomaterials.2011.05.078
Fu J, Bian L, Zhao L, Dong Z, et al. (2010). Identification of genes for normalization of quantitative real-time PCR data in ovarian tissues. Acta Biochim. Biophys. Sin. (Shanghai) 42: 568-574. http://dx.doi.org/10.1093/abbs/gmq062
Gimeno J, Eattock N, Van Deynze A and Blumwald E (2014). Selection and validation of reference genes for gene expression analysis in switchgrass (Panicum virgatum) using quantitative real-time RT-PCR. PLoS One 9: e91474. http://dx.doi.org/10.1371/journal.pone.0091474
Hosokawa M, Inoue Y, Chen XF, Tsunoda H, et al. (2011). The alterations in cytokine mRNA expressions and productions by fluoride in a murine macrophage cell line evaluated by real-time PCR and ELISA. Biomed. Res. Trace Elem. 22: 27-33.
Jacob F, Guertler R, Naim S, Nixdorf S, et al. (2013). Careful selection of reference genes is required for reliable performance of RT-qPCR in human normal and cancer cell lines. PLoS One 8: e59180. http://dx.doi.org/10.1371/journal.pone.0059180
Janská A, Hodek J, Svoboda P, Zámečník J, et al. (2013). The choice of reference gene set for assessing gene expression in barley (Hordeum vulgare L.) under low temperature and drought stress. Mol. Genet. Genomics 288: 639-649. http://dx.doi.org/10.1007/s00438-013-0774-4
Jones JA, Chang DT, Meyerson H, Colton E, et al. (2007). Proteomic analysis and quantification of cytokines and chemokines from biomaterial surface-adherent macrophages and foreign body giant cells. J. Biomed. Mater. Res. A 83: 585-596. http://dx.doi.org/10.1002/jbm.a.31221
Kozera B and Rapacz M (2013). Reference genes in real-time PCR. J. Appl. Genet. 54: 391-406. http://dx.doi.org/10.1007/s13353-013-0173-x
Lin P, Lan X, Chen F, Yang Y, et al. (2013). Reference gene selection for real-time quantitative PCR analysis of the mouse uterus in the peri-implantation period. PLoS One 8: e62462. http://dx.doi.org/10.1371/journal.pone.0062462
Matoušková P, Bártíková H, Boušová I, Hanušová V, et al. (2014). Reference genes for real-time PCR quantification of messenger RNAs and microRNAs in mouse model of obesity. PLoS One 9: e86033. http://dx.doi.org/10.1371/journal.pone.0086033
McNally AK, Jones JA, Macewan SR, Colton E, et al. (2008). Vitronectin is a critical protein adhesion substrate for IL-4-induced foreign body giant cell formation. J. Biomed. Mater. Res. A 86: 535-543. http://dx.doi.org/10.1002/jbm.a.31658
Molina CE, Barbet E, Jacquet E, Munoz Guijosa C, et al. (2014). Identification of suitable reference genes for gene expression studies in normal and pathological human heart tissues. Cardiovasc. Res. 103 (Suppl.): S57-S94. http://dx.doi.org/10.1093/cvr/cvu091.21
Moore KJ, Sheedy FJ and Fisher EA (2013). Macrophages in atherosclerosis: a dynamic balance. Nat. Rev. Immunol. 13: 709-721. http://dx.doi.org/10.1038/nri3520
Nelissen K, Smeets K, Mulder M, Hendriks JJA, et al. (2010). Selection of reference genes for gene expression studies in rat oligodendrocytes using quantitative real time PCR. J. Neurosci. Methods 187: 78-83. http://dx.doi.org/10.1016/j.jneumeth.2009.12.018
Pfaffl MW, Tichopad A, Prgomet C and Neuvians TP (2004). Determination of stable housekeeping genes, differentially regulated target genes and sample integrity: BestKeeper--Excel-based tool using pair-wise correlations. Biotechnol. Lett. 26: 509-515. http://dx.doi.org/10.1023/B:BILE.0000019559.84305.47
Prorok-Hamon M, Friswell MK, Alswied A, Roberts CL, et al. (2014). Colonic mucosa-associated diffusely adherent afaC+ Escherichia coli expressing lpfA and pks are increased in inflammatory bowel disease and colon cancer. Gut 63: 761-770. http://dx.doi.org/10.1136/gutjnl-2013-304739
Riazy M, Chen JH, Yamamato Y, Yamamato H, et al. (2011). OxLDL-mediated survival of macrophages does not require LDL internalization or signalling by major pattern recognition receptors. Biochem. Cell Biol. 89: 387-395. http://dx.doi.org/10.1139/o11-035
Shah KN and Faridi JS (2011). Estrogen, tamoxifen, and Akt modulate expression of putative housekeeping genes in breast cancer cells. J. Steroid Biochem. Mol. Biol. 125: 219-225. http://dx.doi.org/10.1016/j.jsbmb.2011.03.005
Silver N, Best S, Jiang J and Thein SL (2006). Selection of housekeeping genes for gene expression studies in human reticulocytes using real-time PCR. BMC Mol. Biol. 7: 33. http://dx.doi.org/10.1186/1471-2199-7-33
Sorokin L (2010). The impact of the extracellular matrix on inflammation. Nat. Rev. Immunol. 10: 712-723. http://dx.doi.org/10.1038/nri2852

12F.B. Ferraz and J.H. Fernandez
©FUNPEC-RP www.funpecrp.com.brGenetics and Molecular Research 15 (1): gmr.15017720
Teng X, Zhang Z, He G, Yang L, et al. (2012). Validation of reference genes for quantitative expression analysis by real-time rt-PCR in four lepidopteran insects. J. Insect Sci. 12: 60. http://dx.doi.org/10.1673/031.012.6001
Vandesompele J, De Preter K, Pattyn F, Poppe B, et al. (2002). Accurate normalization of real-time quantitative RT-PCR data by geometric averaging of multiple internal control genes. Genome Biol. 3: H0034. http://dx.doi.org/10.1186/gb-2002-3-7-research0034
Wang T, Liang ZA, Sandford AJ, Xiong XY, et al. (2012). Selection of suitable housekeeping genes for real-time quantitative PCR in CD4(+) lymphocytes from asthmatics with or without depression. PLoS One 7: e48367. http://dx.doi.org/10.1371/journal.pone.0048367
Yim EK and Leong KW (2005). Significance of synthetic nanostructures in dictating cellular response. Nanomedicine 1: 10-21. http://dx.doi.org/10.1016/j.nano.2004.11.008
Yoshikawa K, Mitsunaga S, Kinoshita T, Konishi M, et al. (2012). Impact of tumor-associated macrophages on invasive ductal carcinoma of the pancreas head. Cancer Sci. 103: 2012-2020. http://dx.doi.org/10.1111/j.1349-7006.2012.02411.x
Zhang Y, Cheng S, Zhang M, Zhen L, et al. (2013). High-infiltration of tumor-associated macrophages predicts unfavorable clinical outcome for node-negative breast cancer. PLoS One 8: e76147. http://dx.doi.org/10.1371/journal.pone.0076147
Supplementary material
Figure S1. Plate layout from StepOne software v.2.1. Quantitative real-time PCR (qPCR) experiments were performed in triplicate, with three technical replicates in each run (N = 9 runs). (Ctrl = cells cultured under normal culture conditions; 6 h + lam = cells seeded in laminin-coated wells for 6 h; 24 h + lam = cells seeded in laminin-coated wells for 24 h). The software discriminated against negative controls (N) and unknown (U) tasks.http://www.geneticsmr.com/year2016/vol15-1/pdf/gmr7720_supplementary.pdf


