Embed Size (px)
DESCRIPTION
Selected Results from the Robert Noyce Teacher Scholarship Program Evaluation. Frances Lawrenz Christina Madsen University of Minnesota. Noyce Program Evaluation. University of Minnesota based Noyce Program evaluation team Extensive web site with data bases - PowerPoint PPT Presentation
Citation preview

Selected Results from the Robert Noyce Teacher Scholarship Program
Evaluation
Frances Lawrenz
Christina Madsen
University of Minnesota

Noyce Program Evaluation
• University of Minnesota based Noyce Program evaluation team
• Extensive web site with data bases
• Partnered with the Noyce projects
• Created an evaluation of the Noyce Program
• Supplements current local evaluations • Provides information on the effects of the Noyce
Program overall.
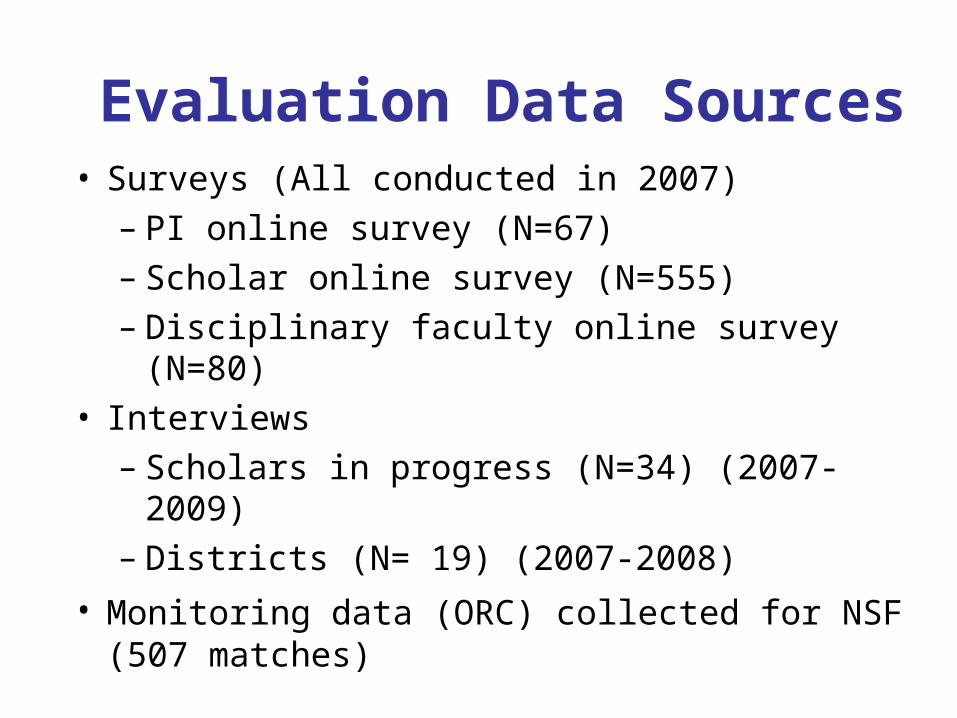
Evaluation Data Sources• Surveys (All conducted in 2007)
– PI online survey (N=67)– Scholar online survey (N=555)– Disciplinary faculty online survey (N=80)
• Interviews– Scholars in progress (N=34) (2007-2009)– Districts (N= 19) (2007-2008)
• Monitoring data (ORC) collected for NSF (507 matches)

Today’s Presentation
• Characteristics of Noyce teacher preparation programs
• Recruitment of scholars• Perceptions of the Noyce scholarship• Scholar leadership

Teaser Questions• The responding PIs indicated the number of teacher education strands
or preparation programs that Noyce Scholars participate in. What was the highest number of strands an individual PI indicated?
– One program reported having 8 different strands which STEM teacher could follow to achieve certification.
• In regard to meetings, 67% of PIs indicated that the Noyce money supported meeting with Noyce scholars during the program, however what percentage of PIs reported the Noyce money supports meeting with scholars AFTER program completion?
– 54% indicated the Noyce money supports meetings with scholars after program completion.
• What percentage of responding scholars indicated they strongly agreed/agreed with the following statement? ‘If I had to do it all over again, I would choose the same teacher preparation program and/or route into teaching.’
– 80% of responding scholars strongly agreed/agreed.

Questions continued…
• What percentage of PIs reported that education about different cultures was a required opportunity in their teacher certification program?
– 83% indicated that education about different cultures was a required opportunity.
• What percentage of STEM faculty reported that STEM majors who intended to become teachers had higher/similar abilities levels compared to STEM non teacher majors?
– 65% of STEM faculty members believed that STEM majors going into teaching had high/similar abilities levels compared to non teaching STEM majors.
• In response to reasons that influenced their decision to become STEM teacher, what percentage reported ‘I feel this career allows me to ‘make a difference’ in the world?’
– 97% indicated teaching allows them to make a difference in the world.

Projects’ Overview (PI reports)
• Total of 141 strands reported– One project reported having 8 different strands– 70% reported having one or two strands– Strand breakdown:
• 49 Undergraduate programs leading to a bachelor’s degree • 17 Teaching credential (no degree) • 27 Post-bac or graduate program (no master’s awarded) • 27 Graduate program• 21 Other
• 60% of projects had students begin full-time teaching after completion of their certification program
• 40% had students start full-time teaching before completion of their certification program.

Noyce Supported Meetings
Which of the following meetings in your teacher preparation programs does Noyce funding support?
67.2%57.6% 53.6%
34.5%
0.0%
20.0%
40.0%
60.0%
80.0%
100.0%
Meetings ofNoyce scholars
during theprogram
Meeting withuniversity or
otherinstructional
faculty
Meetings of theNoyce scholars
after theprogram
Meetings withdistrict
personneland/or
teachers

High Need or Diversity Opportunities
High needs/diversity opportunities required in their teacher preparation programs as reported by PIs.

Comparison of Perceived Ability of STEM majors
How would you compare the ability of STEM majors who do not intend to become teachers with those who intend to become
teachers?
4%
61%
20%15%
0.0%
20.0%
40.0%
60.0%
80.0%
100.0%
Higher ability Similar ability Lower ability Cannot compare
STEM faculty perceptions of the ability of STEM majors going into teaching compared to other STEM majors.

Decision to Become a TeacherWhich of the following helped you decided to become a STEM teacher
(% responding yes)?
72.3%
76.0%
76.7%
89.9%
93.1%
96.6%
97.0%
0.0% 20.0% 40.0% 60.0% 80.0% 100.0%
I like having summers off
I like the flexibility and/or autonomy of STEMteaching
I feel a teaching career is conducive to myfamily life
I feel that I have talent for STEM teaching
I like sharing my subject with others
I like working with young people
I feel this career allows me to 'make adifference' in the world

Recruitment Strategies
Did any of the following help you learn about the Noyce scholarship?
23.4%
4.0%
13.7%
64.5%
0.0% 20.0% 40.0% 60.0% 80.0% 100.0%
Other
Career Center
Website
Advisor
Timing of Teaching Decision
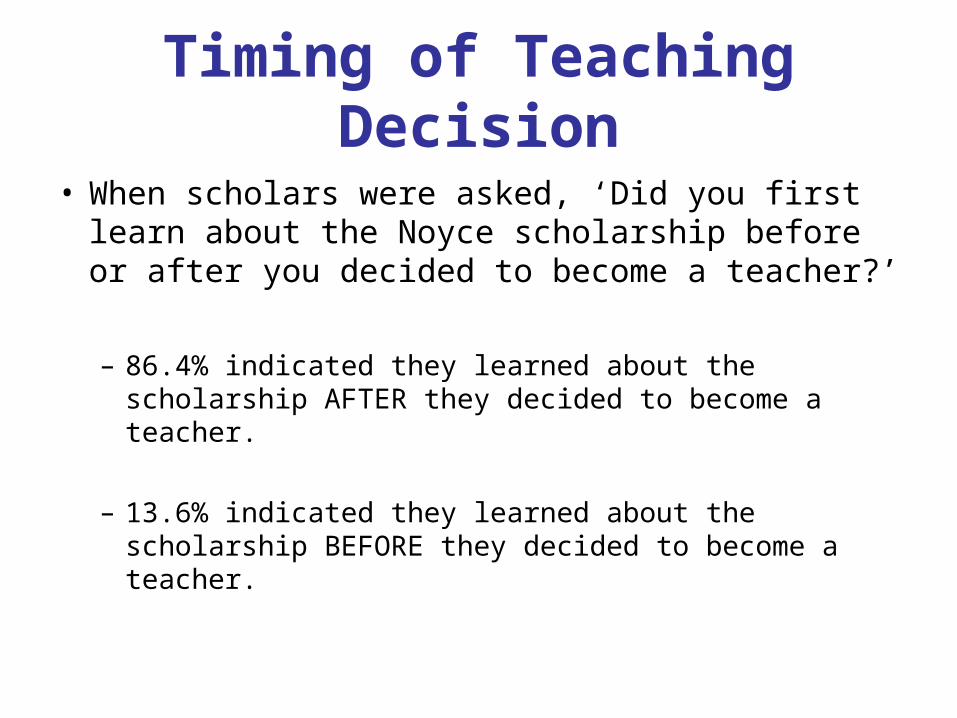
• When scholars were asked, ‘Did you first learn about the Noyce scholarship before or after you decided to become a teacher?’
– 86.4% indicated they learned about the scholarship AFTER they decided to become a teacher.
– 13.6% indicated they learned about the scholarship BEFORE they decided to become a teacher.

Recruitment Strategy Use by Scholars who had Already
Decided to Become a Teacher
18%
53%
9%
20%
12%
62%
3%
23%
0.0%
20.0%
40.0%
60.0%
80.0%
100.0%
Website Advisor Careercenter
Other
Before After
Responding scholars indicated the timing of teaching decision and recruitment strategies.

Think and Talk Activity
• From the data, it appears that many factors are important for the recruitment of high quality STEM scholars.– What recruitment strategies are available at your
institution? • What works? What doesn’t?
– What recruitment strategies do you think would be ideal for recruiting more STEM scholars into teaching?
• What factors affect recruitment?

Influence of Noyce Scholarship on Teaching Decision
Yes Possibly No
21.6%
31.1%
47.3%
Learning about the scholarship BEFORE deciding to become a teacher, would you have become a teacher if you had not received the Noyce Scholarship?
1.5%14.1%
84.4%
Learning about the scholarship AFTER deciding to become a teacher, would you have become a teacher if you had not received the Noyce Scholarship?
Responding scholars indicated the timing and influencing of the scholarship on their teaching decision.

Influence of Noyce Scholarship on High Needs Teaching Decision
Learning about the scholarship BEFORE deciding to become a teacher, would you have taught in a high needs school if you hadn’t participated in the Noyce program?
4.1%
48.6%
28.4% 18.9%
Yes Possibly No I will not teach in a high needs school
Responding scholars indicated the timing and influencing of the scholarship on their teaching decision.
Learning about the scholarship AFTER deciding to become a teacher, would you have taught in a high needs school if you hadn’t participated in the Noyce program?
3.6%7.9%
48.8%
39.6%

Noyce Funding Effects on Recruitment
To what extent do you believe the availability of the Noyce funding has improved recruitment in the following areas?
0.0% 20.0% 40.0% 60.0% 80.0% 100.0%
Recruit participates committed to teaching in high needsdistricts
Recruit more students than you would without funding
Recruit participants with STEM degrees
Recruit participants that would not otherwise considerteacher as a career
Recruit participants from ethnicities under represented inSTEM
Recruit participants with high GPAs
Recruit classes of STEM teacher candidates that aregender balanced
None Little Some Substantial Exceptional
Responding PIs indicated the influence of Noyce funding on recruitment.
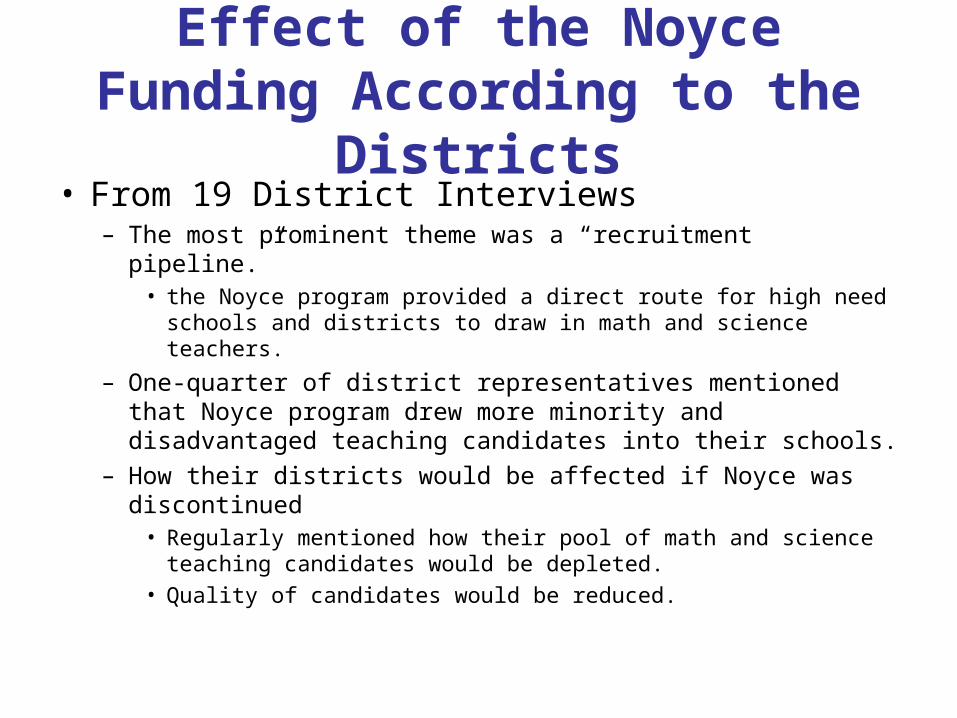
Effect of the Noyce Funding According to the Districts
• From 19 District Interviews– The most prominent theme was a “recruitment pipeline.”
• the Noyce program provided a direct route for high need schools and districts to draw in math and science teachers.
– One-quarter of district representatives mentioned that Noyce program drew more minority and disadvantaged teaching candidates into their schools.
– How their districts would be affected if Noyce was discontinued• Regularly mentioned how their pool of math and science teaching
candidates would be depleted.
• Quality of candidates would be reduced.

Think and Talk Activity
• What is the most important effect of the Noyce funding?
Leadership
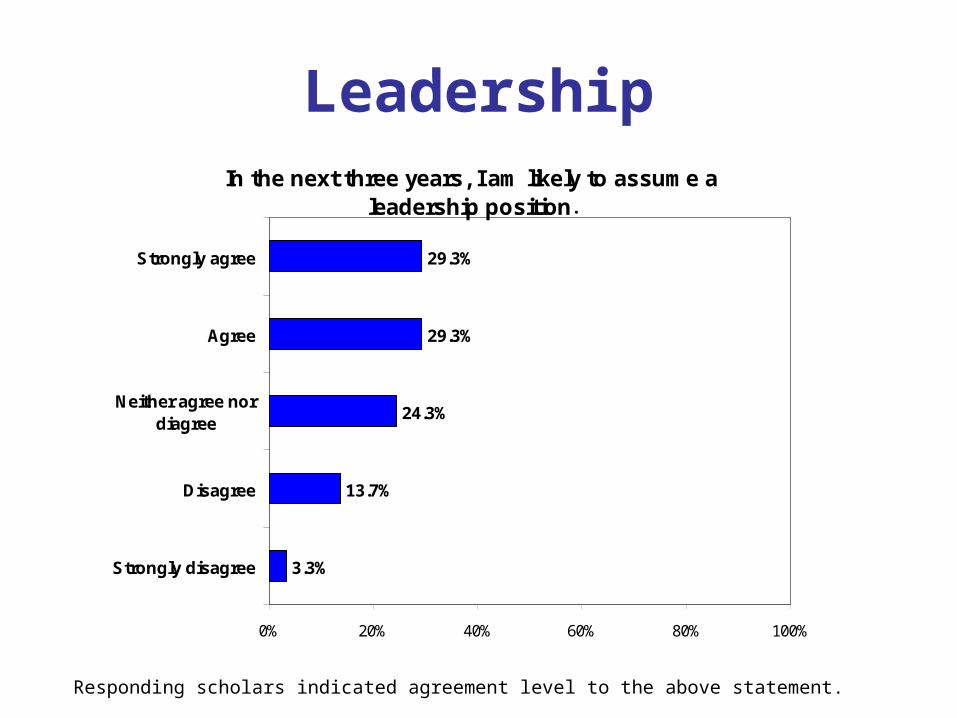
Responding scholars indicated agreement level to the above statement.
In the next three years, I am likely to assume a leadership position.
3.3%
13.7%
24.3%
29.3%
29.3%
0% 20% 40% 60% 80% 100%
Strongly disagree
Disagree
Neither agree nordiagree
Agree
Strongly agree
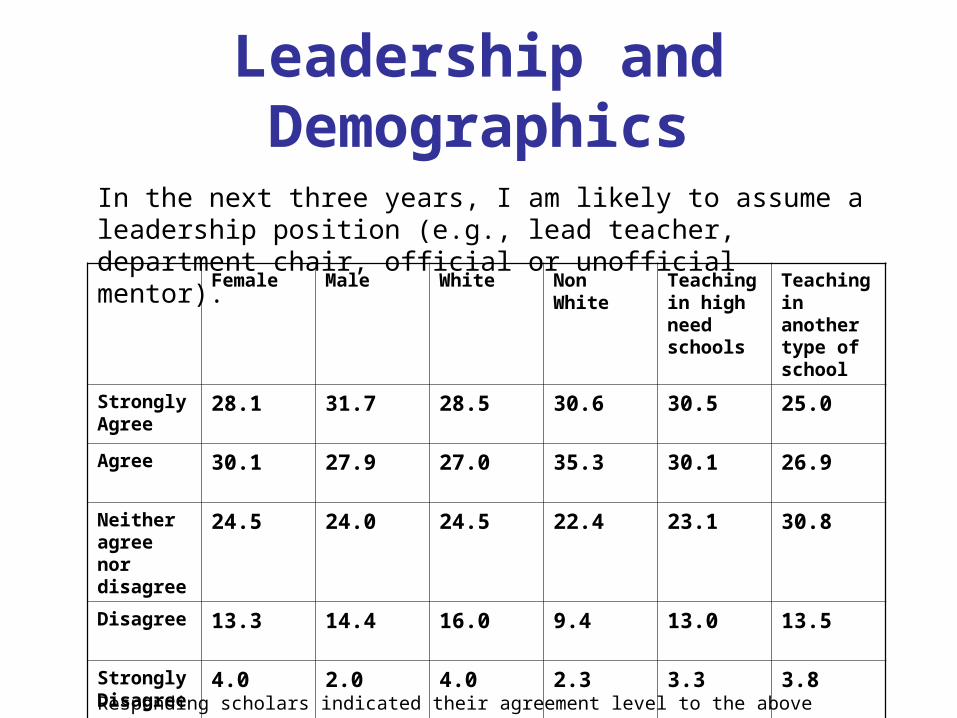
Leadership and Demographics
In the next three years, I am likely to assume a leadership position (e.g., lead teacher, department chair, official or unofficial mentor).
Responding scholars indicated their agreement level to the above statement.
Female Male White Non White Teaching in high need schools
Teaching in another type of school
Strongly Agree
28.1 31.7 28.5 30.6 30.5 25.0
Agree 30.1 27.9 27.0 35.3 30.1 26.9
Neither agree nor disagree
24.5 24.0 24.5 22.4 23.1 30.8
Disagree 13.3 14.4 16.0 9.4 13.0 13.5
Strongly Disagree
4.0 2.0 4.0 2.3 3.3 3.8

Scholar Interviews and Leadership
• 9 of 29 scholars interviewed held leadership positions. These positions include:– Math or science department chair
– Math and science coordinators
– Trainers for new teachers
– Geometry team leader
– National Honor Society advisor
• Of the 9 scholars– Minimum years of teaching was 2 and maximum was 6
– Minimum years in leadership role 1 and maximum was 2
– 7 of the 9 scholars are teaching in high needs school (the two other scholars are no longer teaching however one is receiving a PhD for math and science education)

District Interviews and Leadership
• From 19 District Interviews– Three district representatives – Noyce scholars taking on leadership roles
• teaching Advanced Placement courses • volunteering to serve on committees

Think and Talk Activity
• What factors do you think influence leadership?
• How do teacher certification programs promote leadership?
• Leadership in high need schools. Does it look different? Is it more important?– Why or why not?

Thank you!
Frances Lawrenz
Christina Madsen