Embed Size (px)
Citation preview
Select Committee on Labour Select Committee on Labour and Public Enterprises and Public Enterprises
8 March 20058 March 2005
Presentation on thePresentation on theSAFCOL Annual Report 2003/04SAFCOL Annual Report 2003/04
Charles Ntuli Sikkie Kajee
SAFCOL
Kobus Breed Joe Coetzer

Outline Outline
1. Introduction to SAFCOL Operations Map Video
2. Corporate Governance
3. Status of Privatisation Core Assets Non-core Assets Interest in privatised entities
4. Overview of performance against objectives
5. Financial Review 2004

Introduction to SAFCOL OperationsIntroduction to SAFCOL Operations[PMG note: map not included][PMG note: map not included]

Corporate Governance Corporate Governance
Code of Corporate Practices and Conduct
The Directors endorse the Code of Corporate
Practices and Conduct as set out in the King Report.
The Directors confirm the need to conduct the
business with integrity and in accordance with
generally accepted corporate practice.

Public Finance Management Act, 1999 (“PFMA”)
The PFMA became effective on 1 April 2000. As part of the implementation of the PFMA, there is an ongoing process of awareness, education, instruction and advice to the SAFCOL Board and employees.
The Board of Directors are the accounting authority of SAFCOL. The Directors comply with their fiduciary duties as set out in the Act. Since its inception in 1993, SAFCOL followed a policy of good corporate governance and sound accounting principles and internal control and as a result, comprehensive accounting policies, accounting procedures, internal control procedures, conditions of employment and disciplinary procedures, including a code of conduct, were prepared and documented and are well entrenched in the operations of the company.

As a substitute for the corporate plan and
shareholders’ compact, SAFCOL submitted a
privatisation framework, which outlines Government’s
privatisation objectives for SAFCOL. This privatisation
framework does not contain the performance
objectives as stated in the Chief Executive Officer’s
Report, other than the privatisation objective. The other responsibilities have been addressed by
SAFCOL, as far as practically possible, within the
constraints resulting from privatisation.

Except for one item listed below, SAFCOL complies
with the PFMA and Treasury Regulations in all
material respects with regard to the provisions
applicable to public entities.
• Projections of revenue, expenditure and
borrowings for a financial year are included in
the annual budget that is approved by the
Board. This approval does however not take
place at least one month before the
commencement of the financial year, but within
one month of such commencement.

Status of privatisation Status of privatisation
Eastern Cape North (Singisi)
Assets sold on 1/08/2001 to Singisi and obtained 25% shareholding in the company.
KwaZulu-Natal (SiyaQhubeka)
Sold 75% of the shares and shareholder’s loans to the Siyaqhubeka Consortium on 1/10/2001.
Eastern Cape South (AFC)
Negotiations completed in April 2003, awaiting implementation of forest lease agreement.
Southern and Western Cape (MTO)
Negotiations completed on 31/03/2004. Competition Commission approval received on 5/10/2004. Awaiting implementation of forest lease agreement.
Mpumalanga, Limpopo and KwaZulu Natal (KLF)
Negotiations completed on 31/03/2004. The Competition Commission prohibited this transaction. KLF and Bonheur (purchaser) are addressing the issue. The implementation of the forest lease agreement is in process.
No privations transactions were completed during the year under review in respect of the core assets. The status can
be summarised as follows:-

Core Assets In preparation for the eventual privatisation, SAFCOL acquired certain commercial forestry assets and business from DWAF at a nominal value.
Location of sale assets
Approximately planted area (ha)
Employees transferre
d
Effective date
Eastern Cape North
41 500 591 1 August 2001
Eastern Cape South
4 500 31 1 November 2001
Mpumalanga and Limpopo
17 000 357 1 November 2001
Total 63 000 979

The combined sale assets, comprising the major portion of businesses and commercial forestry assets of the company as well as the relevant portions of the commercial forestry assets and businesses acquired from DWAF were transferred to wholly-owned subsidiaries of SAFCOL, as follows :-
Location Company Effective date Includes DWAF
Eastern Cape North
Singisi Forest Products (Pty) Ltd
1 August 2001 Yes
KwaZulu-Natal Siyaqhubeka Forests (Pty) Ltd
1 October 2001 No
Southern and Western Cape
MTO Forestry (Pty) Ltd
1 November 2001
No
Eastern Cape South
Amatola Forestry Company (Pty) Ltd
1 November 2001
Yes
Mpumalanga and Limpopo
Komatiland Forests (Pty) Ltd
1 November 2001
Yes

Sold to Approx. planted area (ha)
Employees transferred
Net assets sold Rm
Net selling price Rm
Profit/(Loss) on disposal Rm
Singisi 60 000 1 129 40.6 17.1 (23.5)
Siyaqhubeka 22 000 91 30.9 100.0 69.1
MTO 85 000 1 119 78.4 78.5 0.1
AFC 15 000 243 7.1 5.4 (1.7)
KLF 129 000 2 148 335.5 384.0 48.5
TOTAL 311 000 4 730 492.5 585.0 92.5
The following table provides an indication of the impact of the said transactions :

Non-Core Assets The portion of the operations in KwaZulu-Natal not transferred to Siyaqhubeka Forests (Pty) Ltd and therefore remaining with SAFCOL, the St Lucia region, comprises of approximately 7 200 ha of commercial forestry plantations. Other assets remaining with SAFCOL are as follows :-Asset Location Effective
date
Avocado project Frankfort December 2004
Lakenvlei Forest Lodge Belfast Part of KLF sale
Lebanon Fruit Farm Trust
Grabouw July 2004
Lourensford properties Somerset West August 2001
Shannon properties Barberton Not sold
Valgrace Investments Pretoria September 2003
Wildflower project Longmore November 2004

Interest in privatised entities Up to 19% of SAFCOL’s interest in the privatised entities has been earmarked for disposal to the following entities :
Entity Portion of interest
A trust established in terms of the National Empowerment Fund Act,
105 of 1998Or
A trust established for the benefit of surrounding local communities
10%
Employee share ownership plan (“ESOP”)
Up to 9%; subject to a maximum of R10000 per employee

Overview of performance Overview of performance against objectives against objectives
POLICY OBJECTIVE RESULTProfitabilityTo achieve and sustain a return on capital in excess of the cost of capital.
Ensure that a commercially acceptable rate of return is achieved subject to constraints placed on the company due to it being a parastatal.
The required returns were not achieved due to various reasons discussed in more detail in the CEO report.
Sustainable Forestry ManagementTo manage the raw material resource of the company in a professional manner so as to ensure sustainability in the long term.
Harvest and market the annual roundwood yield of the Group of approximately 2,7 million m3, in an environmentally responsible manner.
2003/2004 actual log sales volume amounted to 2,58 million m3 which is in line with the target volume.

Internationalisation
To position the company as an international player in the forestry and forestry related industries.
Expand into Southern African countries in a responsible manner.
There are two timber plantation trials at Chimoio in Mozambique. Exceptional growth rates are being recorded.
An investment to purchase 80% shares in IFLOMA, the forestry parastatal in the Manica Province of Mozambique, amounting to US$450,000 has been made. This will benefit both Mozambique and the RSA in the spirit of NEPAD.
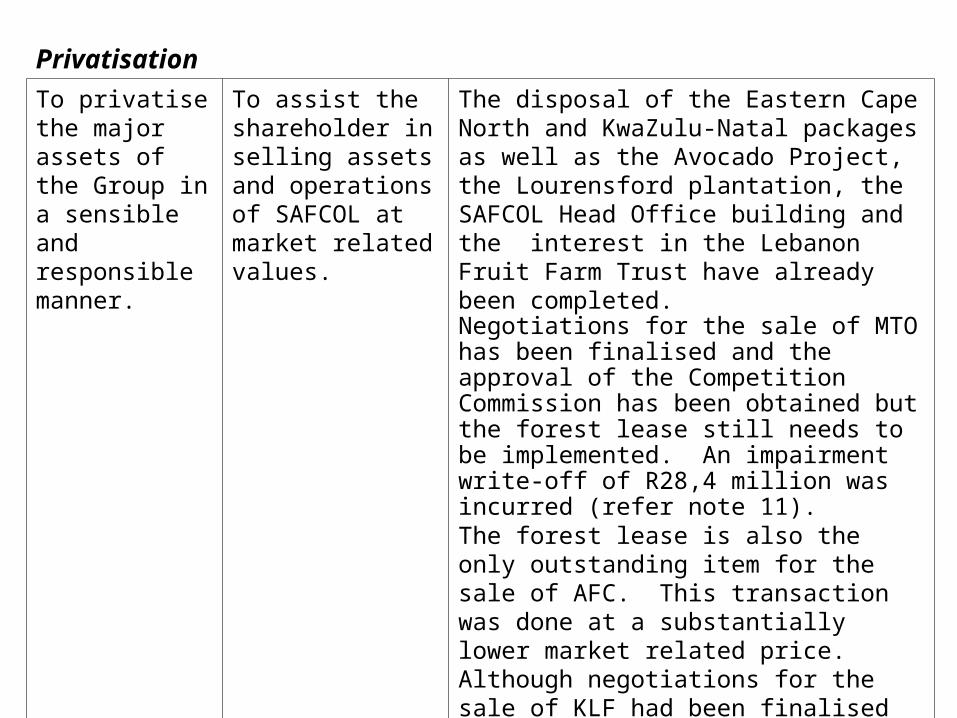
Privatisation
To privatise the major assets of the Group in a sensible and responsible manner.
To assist the shareholder in selling assets and operations of SAFCOL at market related values.
The disposal of the Eastern Cape North and KwaZulu-Natal packages as well as the Avocado Project, the Lourensford plantation, the SAFCOL Head Office building and the interest in the Lebanon Fruit Farm Trust have already been completed.Negotiations for the sale of MTO has been finalised and the approval of the Competition Commission has been obtained but the forest lease still needs to be implemented. An impairment write-off of R28,4 million was incurred (refer note 11).The forest lease is also the only outstanding item for the sale of AFC. This transaction was done at a substantially lower market related price.Although negotiations for the sale of KLF had been finalised some months ago the Competition Commission has now prohibited the transaction. Refer Directors report for further detail.

Enhancement of Sawmilling Technology
To upgrade SAFCOL’s sawmilling technology with a specific view to add value to our raw material.
Upgrade SAFCOL’s sawmills to international technology standards.Maximise the value of the raw material through appropriate recovery techniques and the utilisation of high quality material.
Superior product quality continues to be available to industrial markets.
Additional raw material is being sourced to ensure optimum plant utilisation.
In the short to medium term, SAFCOL’s technology policy is focused on mill specialisation, enhancing of drying facilities and value adding dry mills. However the sawmills, with the exception of the George sawmill, did not operate profitably due to various reasons.

Research & Development
To invest in research and development projects with the objective to enhance the quality and volume of the standing timber stock.
Increase SAFCOL’s mean annual increment by at least 10 % by the year 2020.
Continuous site-species matching, genetic research and improvement of silvicultural practices ensure that the objectives are met.
Seedlings and cuttings planted in SAFCOL originate from the top 10 Pine breeding programme families.
Tissue culture is successfully used to “bulk up” the best Eucalyptus material. As a result, superior genetic material is commercialised faster than through the conventional seed method.
Maintenance of Permanent Sample Plots (PSP) as part of the PSP programme is used for monitoring growing trends and growth modelling.

Employee Development
Development of SAFCOL employees to their optimum capabilities.
This is a continuous process to put as many employees as possible through development programmes, subject to employee and operational requirements.
Separately reported in Human Resources section of the CEO report.
Equality in Employment
SAFCOL is an equal opportunity employer, focusing on and addressing historical employment imbalances.
To have a competent and well-balanced employee profile by 2005 according to the guidelines prescribed in the Employment Equity Act.
Management have committed themselves to the implementation of employment equity and the development of employees. Own initiatives have however been disrupted by the impact of privatisation but targets have been set in the sales agreements entered into with the successful bidders.

Corporate Social Investment
To annually allocate a portion of the net profit of the company to corporate social investment. The amount so allocated is subject to affordability, i.e. actual realised profit.
Invest in the social upliftment of our employees and surrounding communities. Projects are identified and prioritised in consultation with applicable stakeholders.
An amount of R0,7 million has been allocated to Corporate Social Investment (CSI) projects in the financial year under review. In total the CSI expenditure since SAFCOL’s inception amounts to R16,9 million.
Environmental Management Philosophy (EMP)
To be one of the leading forestry companies in terms of environmental and conservation management.
To maintain Forestry Stewardship Council (FSC) certification where possible.Fully integrate health and safety into the Environment Management System.
FSC certification of all business units, other than the exit plantations of MTO and the St Lucia management unit has been maintained. NOSA safety standards are being strived for at all business units.

Financial Review Financial Review For the year ended 30 June 2004
FINANCIAL RESULTS
2004 2003 2002 2001 2000 Growth
R'000 R'000 R'000 R'000 R'000 %
(a) (b) (a-b)/b
REVENUE 681,958
677,257
692,408
645,075
578,114
0.7
OPERATING PROFIT (PBIT) * 64,787
97,542
44,428
41,265
11,044
(33.6)
INCOME FROM INVESTMENTS 13,819
21,616
11,233
4,799
5,326
(36.1)
INCOME FROM ASSOCIATES (4,843)
8,648
6,770
-
-
(156.0)
PROFIT BEFORE TAXATION (PBT) * 71,912
125,680
62,112
45,317
13,823
(42.8)
TAXATION * 34,858
31,889
29,166
13,463
(1,137)
9.3
NET PROFIT / (LOSS) * 37,054
93,791
32,946
31,854
14,959
(60.5)
DIVIDEND PAID 50,000
18,000
66,667
-
-
177.8
RETAINED INCOME / (LOSS) * (12,946)
75,791
(33,721)
31,854
14,959
(117.1)

FINANCIAL POSITION2004 2003 2002 2001 2000
Growt
h R'000 R'000 R'000 R'000 R'000 %
(a) (b) (a-b)/b ASSETS
PROPERTY, PLANT & EQUIP 118,211
116,678
122,205
157,056
160,137
1.3
PLANTATIONS * 681,381
604,823
275,724
344,114
341,007
12.7
AGRICULTURAL ASSETS 3,165
4,309
5,063
5,883
5,984
(26.5)
INVESTMENTS IN ASSOCIATES 46,384
51,639
46,677
-
-
(10.2)
INVESTMENTS AND LOANS 5,486
35,925
30,243
17,615
17,626
(84.7)
CURRENT ASSETS 254,451
273,210
248,520
209,454
165,836
(6.9)
EQUITY AND LIABILITIES
CAPITAL AND RESERVES * 787,639
802,651
488,118
465,734
440,569
(1.9)
DEFERRED TAXATION 115,906
103,822
(12,014)
42,228
31,509
11.6
LONG-TERM PROVISIONS 24,205
23,217
31,864
128,847
117,911
4.3
INTEREST BEARING LOANS 11,089
12,437
6,895
-
-
(10.8)
CURRENT LIABILITIES 170,239
144,456
213,570
97,315
100,601
17.8
Cents Cents Cents Cents Cents %
BASIC EARNINGS PER SHARE 11.7
29.5
10.4
10.0
4.7
(60.3)
(net profit/number of shares)
Financial Review (continued) Financial Review (continued)
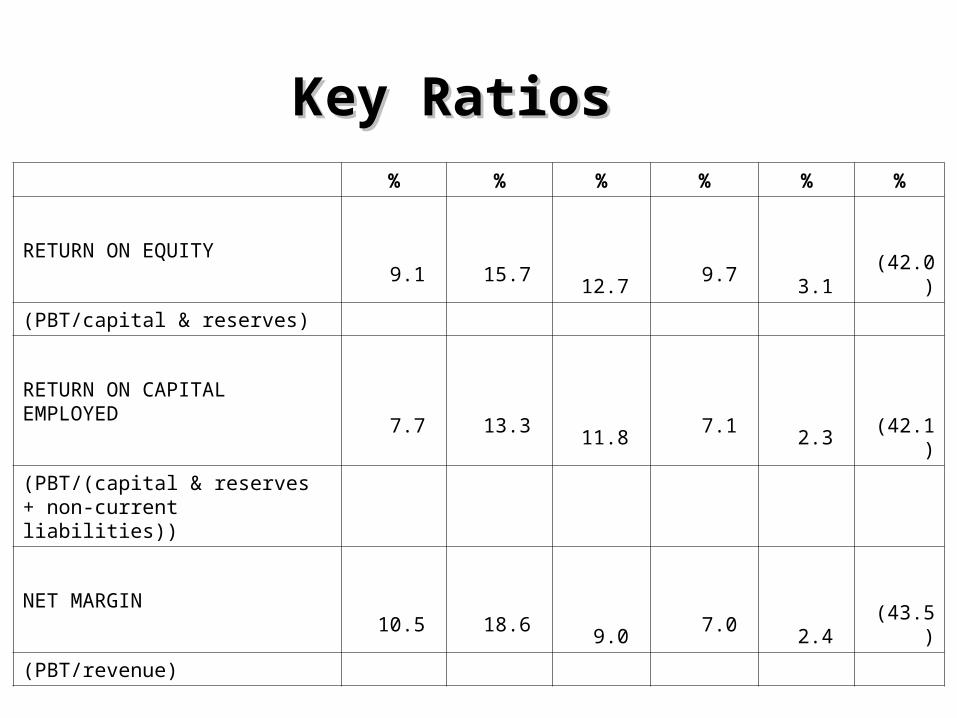
% % % % % %
RETURN ON EQUITY
9.1
15.7
12.7
9.7
3.1 (42.0)
(PBT/capital & reserves)
RETURN ON CAPITAL EMPLOYED
7.7
13.3
11.8
7.1
2.3
(42.1)
(PBT/(capital & reserves + non-current liabilities))
NET MARGIN
10.5
18.6
9.0
7.0
2.4 (43.5)
(PBT/revenue)
* All the above figures include the AC 137 fair value adjustment for 2004 and 2003 of R64,8 million and (R14,5 million) respectively.
Key RatiosKey Ratios

GROUP VALUE ADDED STATEMENTFor the year ended 30 June 2004
The statement below details how the value added is applied to meet certain obligations, reward those responsible for its creation and the portion that is reinvested in the business for the continued operation and expansion of the group.
2004 2003 R'000 % R'000 %
TURNOVER 681,958
677,257
LESS: DIRECT COST (excluding labour cost) 388,061
344,011
VALUE ADDED BY OPERATIONS 293,897
333,246
ADD: INVESTMENT INCOME 13,819
21,616
TOTAL VALUE ADDED 307,716
354,862
DISTRIBUTED AS FOLLOWS: EMPLOYEES (remuneration, benefits, social welfare and training)
206,107
67.0
201,236
56.7
PROVIDERS OF FINANCE 1,851
0.6
2,126
0.6
CORPORATE SOCIAL INVESTMENT 663
0.2
620
0.2
GOVERNMENT FOR TAXATION* 34,858
11.3
31,889
9.0
DIVIDENDS TO THE STATE 50,000
16.2
18,000
5.1
SUB TOTAL 293,479
95.3 253,871
71.6
VALUE REINVESTED 14,237
4.5 100,991
28.4
DEPRECIATION 27,183
8.8
25,200
7.0
RETAINED INCOME / (LOSS) (12,946)
(4.3)
75,791
21.4
TOTAL VALUE DISTRIBUTED 307,716 99.8
354,862 100.0

FINANCIAL HIGHLIGHTS
YEARS ENDED2004 2003 2002 2001 2000
R'000 R'000 R'000 R'000 R'000
Turnover 681,958
677,257
692,408
645,075
578,114
Operating profit - PBIT* 64,787
97,542
44,428
41,265
11,044
Profit before taxation - PBT* 71,912
125,680
62,112
45,317
13,823
Net profit / (loss)* 37,054
93,791
32,946
31,854
14,959
Basic earnings per share (cents)* 11.7
29.5
10.4
10.0
4.7
Capital expenditure 32,891
25,009
31,562
29,467
14,053
* After the AC 137 fair value adjustment of R64,8 million and (R14,5 million) for 2004 and 2003 respectively.