Embed Size (px)
Citation preview
SEISMOLOGICAL SOCIETY OF AMERICA 94th ANNUAL MEETING
May 3-5, 1998 (Monday-Wednesday) Northwest Rooms, Seattle Center
Seattle, Washington, USA
For Current Information:
WWW: http://www.geophys.washington.edu/SEIS/SSA99/ Email: [email protected]
Important Dates
Program/ Abstracts on WWW: Hotel Reservation Cutoff: Preregistration Deadline:
MEETING CHAIRMAN
Steve Malone University of Washington Geophysics Program, Box 351650 Seattle, WA 98195-1650 Telephone: (206) 685-3811 Fax: (206) 543-0489 Email: [email protected]
EXHIBITS
Ruch Ludwin, telephone: (206) 543-4292 Fax: (206) 543-0489 Email: [email protected]
PROGRAM COMMITTEE
Bob Crosson, telephone: (206) 543-6505 Email: [email protected]
Ken Creager, telephone: (206) 685-2803 Email: [email protected]
March 15, 1999 March 31, 1999 April 16, 1999
MEETING INFORMATION
Meeting Committee Ken Creager, Bob Crosson, Ruth Ludwin, Tony Qamar, Bill Steele Email for general business and info: ssa99@geophys. washington.edu
Registration Information The registration form is in this issue of SRL on page 194 and is available via the WWW at http://mail.seismosoc.org/ ssa99_Reg.html.
Meeting Location The meeting will be held in the Northwest Rooms at Seattle Center, adjacent to the Key Arena and a shorr walk from the Space Needle and monorail terminal. The icebreaker on Sunday evening will be held at the Best Western Executive Inn. The luncheon, at the Space Needle, will be held on Tuesday, May 4.
PLANNED SCHEDULE
Sunday, May 2
Registration: 4:30-7:00 PM, Best Western Executive Inn
190 Seismological Research Letters Volume 70, Number 2 March/April 1999
Icebreaker: 5:00-7:00 PM, Best Western Executive Inn
Monday, May 3
Registration: 8:00 AM-12:00 noon Seattle Center, Pacific Northwest Rooms
Technical Sessions: 8:30 AM-5:00 PM Seattle Center, Pacific Northwest Rooms
Microbrew Social: 5:00-7:00 PM Seattle Center, Rainier Room
Public/Press Forum: 7:30-9:30 PM Seattle Center, Pacific Northwest Rooms
The Seismological Society of America presents a Public/Press Forum on the Latest Scientific Research Regarding Earthquake Hazards in the Puget Sound Region
The public and press are invited to meet with the scientists who are presenting their latest results on earthquake hazards in the Puget Sound region at the annual meeting of the Seismological Society of America. Short presentations on recent major scientific results will be followed by a question and answer period. Individual scientists with posters and displays will then be available for one-on-one discussions.
Topics Covered
• The "Big One" That Was: Paleoseismology-How we find and date big prehistoric earthquakes
• The Ultimate Cause: GPS and Geodesy-Determining relative posmon within a fraction of an inch to measure slow earth movements
• Where the Hazards Are: The "SHIPS" experiment-Three-dimensional imaging of faults under the Puget lowlands and progress toward estimates of ground shaking
• What's beneath Our Feet: Detailed geologic maps of Seattle-New data, techniques, and regional understanding lead to a greatly improved view oflocal geology
• So What: Science in the real world-What is and can be done to use this new information to reduce earthquake hazards for the rest of us
Tuesday, May 4
Registration: 8:00 AM-12:00 noon Seattle Center Northwest Rooms
Technical Sessiom: 8:30 AM-5:00 PM Seattle Center Northwest Rooms
SSA Annual Luncheon: 11 :45 AM-2:00 PM Seattle Space Needle Plaza dining room ( 1/3 way up the needle)
The Presidential Address will be given by Dr. Ralph Archuleta. The 1998 Medal of the Seismological Society of America will be awarded to Dr. James Savage.
Self-guided Field Trip: Afternoon/evening following the technical sessions there will be a self-guided field trip of earthquake-relevant structures in downtown seattle and the central Puget Sound area. Maps and a field guide will be provided to everyone interested in taking a walking, bus and ferry ride tour of seismologically interesting sites in Seattle and the central Puget Sound. Knowledgeable individuals will be available for parts of the tour for those with questions. Sites to be seen include:
• earthquake-resistant buildings • retrofit structures • elevated roadway and port facilities at great risk from
earthquakes • geomorphic evidence ofM = 7.5 earthquake 1,100 years
ago
The map and guide includes recommendations for routes via bus, streetcar, walking, and ferry boat and suggestions for restaurants (and coffee bars) along the way for those unable (or unwilling) to do the whole thing at once.
Wednesday, May 5
Registration: 8:00 AM-12:00 noon Seattle Center, Pacific Northwest Rooms
Technical Sessions: 8:30 AM-5:00 PM Seattle Center, Pacific Northwest Rooms
Seismological Research Letters Volume 70, Number 2 March/April 1999 191

Annual Meeting of the Council of the National Seismic System: 1:30-5:00 PM Seattle Center, Shaw Room
Business Meeting: • Report on the status of the CNSS • Installation of new Chairman • Election of Vice Chairman and appointment of execu
tive committee
Special Session: USGS report to Congress on "Assessing Seismic Monitoring in the U.S."-Highlights of report and what we can do to
help others understand and act on its recommendations
Special Session: Cooperation between seismic network operators and IRlSsponsored projects such as USAray-How can we work together to improve the effectiveness and efficiency of both activities?
Nearby Attractions Mount Rainier National Park http://www.nps.gov/mora/mora.htm
Mount Saint Helens National Park http://vulcan.wr.usgs.gov/Volcanoes/MSH/framework.html
Washington State ferries http://www. wsdot. wa.gov /ferries
Coffee http://www.kumc.edu/MLA/MLA97 /coffee.html
LODGING
Blocks of rooms have been reserved at four hotels within walking distance of the meeting rooms. Book early, as there is a shortage of hotel rooms in Seattle. The cut-off date for hotel reservations is March 31, 1999. Seattle hotel tax is 15.6%.
Best Western Executive Inn ($109 + tax) 200 North Taylor Avenue (800) 351-9444 or (206) 448-9444
Icebreaker held here; short walk to meeting rooms across Seattle Center; free parking; restaurant and room service; up to four people per room, no extra charge; data ports in room phone
TraveLodge (single $79 + tax; double $89 + tax) John Street and North 6th Street (800) 578-7878 or (206) 441-7878
Short walk to meeting rooms across Seattle Center; free parking; complimentary coffee and muffins in the morning
Hampton Inn and Suites ($109 + tax) 700 North 5th Avenue (206) 282-7700
Short walk to meeting rooms across Seattle Center; free parking; complimentary continental breakfast buffet; suites available at additional charge; data ports in room phone
Inn at Queen Anne (single $79 + tax; double $89 + tax) 505 North First Avenue (800) 952-5043 or (206) 282-7375
Closest to meeting rooms; complimentary coffee and muffins in the morning; all rooms have kitchenettes; "old-world charm"; cat on premises
TRANSPORTATION
Get there for less! Call our official travel agency, Conventions in America (CIA), at (800) 929-4242 and ask for Group #515. You will receive 5%-10% off the lowest applicable fares on any carrier, and an additional 5% off United if you purchase at least 60 days prior to departure. Travel between April 29-May 8, 1999. All customers of CIA also receive free flight insurance of $100,000. Avis Rent-a-Car is offering special low conference rates with unlimited free mileage.
Call Conventions in America (CIA) at (800) 929-4242 and ask for Group #515.
Outside the 800 area, call (619) 453-3636 or fax (619) 453-7976.
Reservation hours: M-F 6:30 AM-5:00 PM Pacific Time Visit CIA's web site at http://www.scitravel.com. E-mail address: [email protected].
If you call direct or use your own agency, refer to these codes: United: (800) 521-4041, IO #524AR Avis: (800) 331-1600, AWO #]948900
Seattle-Tacoma (SeaTac) Airport is served by most major U.S. airlines. Metro bus connection from the airport to the Seattle Center is very cheap and easy. Taxi or shuttle service to Seattle Center hotels is also available. Details are available on the SSA99 web site: http://www.geophys.washington.edu/SEIA/ SSA99/lodging.html.
192 Seismological Research Letters Volume 70, Number 2 March/April 1999
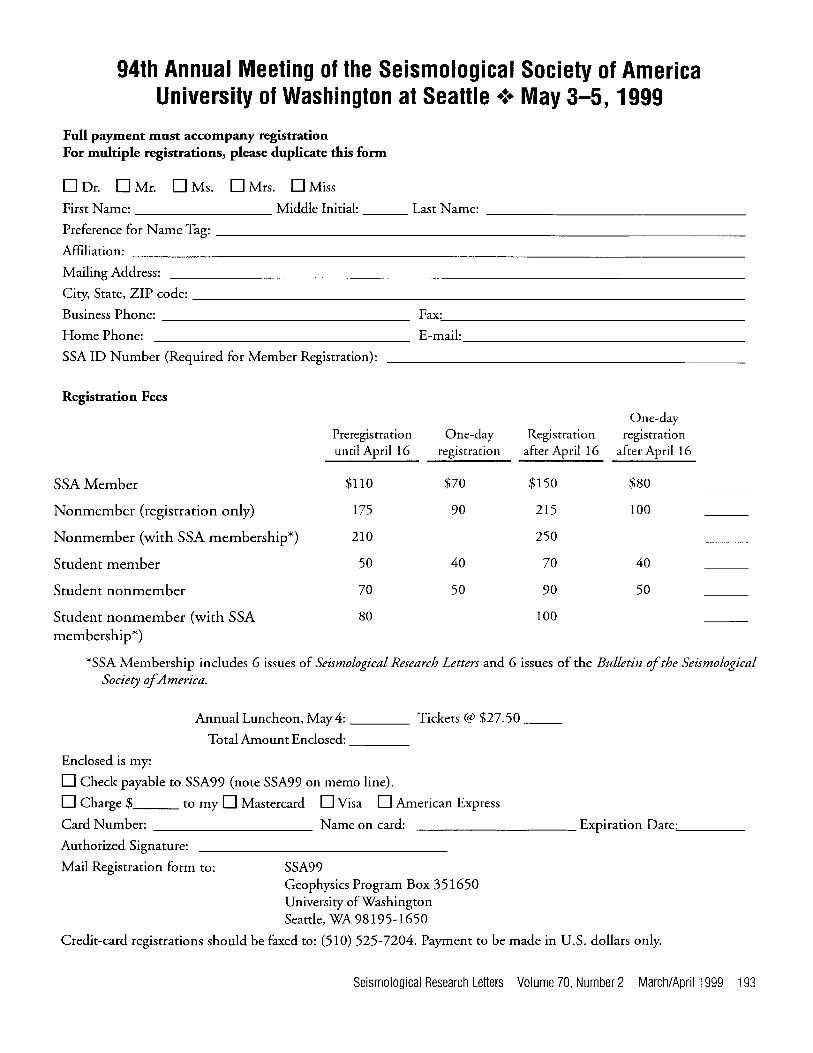
94th Annual Meeting of the Seismological Society of America University of Washington at Seattle •!• May 3-5, 1999
Full payment must accompany registration For multiple registrations, please duplicate this form
D Dr. D Mr. D Ms. D Mrs. D Miss
First Name: _________ Middle Initial: ___ Last Name:
Preference for Name Tag: --------------------------------
Affiliation: -------------------------------------Mailing Address:
City, State, ZIP code:-----------------------------------Business Phone: _______________ _ Fax:,_ _________________ _
Home Phone: E-mail: _________________ _
SSA ID Number (Required for Member Registration):
Registration Fees
SSA Member
Nonmember (registration only)
Nonmember (with SSA membership*)
Student member
Student nonmember
Student nonmember (with SSA membership*)
Preregistration until April 16
$ll0
175
210
50
70
80
One-day registration
$70
90
40
50
Registration after April 16
$150
215
250
70
90
100
One-day registration
after April 16
$80
100
40
50
*SSA Membership includes 6 issues of Seismological Research Letters and 6 issues of the Bulletin of the Seismological Society of America.
Annual Luncheon, May 4: ____ Tickets@ $27.50 __
Total Amount Enclosed: ___ _
Enclosed is my:
D Check payable to SSA99 (note SSA99 on memo line).
D Charge $ to my D Mastercard D Visa D American Express
Card Number: Name on card: ----------Expiration Date.~· ___ _ ----------Authorized Signature:
Mail Registration form to: SSA99 Geophysics Program Box 351650 University of Washington Seattle, WA 98195-1650
Credit-card registrations should be faxed to: (510) 525-7204. Payment to be made in U.S. dollars only.
Seismological Research Letters Volume 70, Number 2 March/April 1999 193

194 Seismological Research Letters Volume 70, Number 2 March/April 1999

Monday 8:30 A.M.-12:00 noon
Monday 1:30 P.M.-5:00 P.M.
Tuesday 8:30 A.M.-11:45 A.M.
Tuesday 2:00 P.M.-4:45 P.M.
Wednesday 8:30 A.M.-12:00 noon
Wednesday 1:30 P.M.-5:00 P.M.
Monday
Overview of Technical Program
Olympic Room
Pacific Northwest Earthquake Hazards and Tectonics I
Pacific Northwest Earthquake Hazards and Tectonics II
Ancient Earthquakes and Active Faults in the Pacific Northwest
Oral Sessions
Lopez Room
Earthquake Sources and Fault Mechanics: Observations and Insights I
Fidalgo Room
Volcano Dynamics and Seismology II
Seismicity, Seismotectonics, and Structure
Opportunities and Earthquake Sources and Seismology in Initiatives in Seismology; Fault Mechanics: Education II Pacific Northwest Observations and Crustal Deformation Insights II and Tectonics
Seismological Characterization of the Continental Upper Mantle II
Advances in Seismic Wave Propagation Theory and Modeling II
Poster Sessions-Rainier Room
Shaw Room
CTBT Research and Its Role in Earthquake Studies I
Strong Ground Motion: Observing, Predicting, and Engineering Applications II
Deep Earth Structure: New Results and Interpretations
Strong Ground Motion: Observing, Predicting, and Engineering Applications III
Seismic Hazards and Seismic Risk
The U.S. National Seismic System (CNSS Meeting)
8:30 A.M.-12:00 noon Strong Ground Motion: Observing, Predicting, and Engineering Applications I, Al-A21 Volcano Dynamics and Seismology I, Bl-B3
Monday 1 :00 P.M.-4:45 P.M.
Tuesday 8:30 A.M.-11:45 A.M.
Tuesday 2:00 P.M.-4:45 P.M.
Wednesday 8:30 A.M.-12:00 noon
CTBT Research and Its Role in Earthquake Studies II, Cl-C15 Earthquake Hazards and Risks, 01-010
Seismology in Education I, El-E3 Networks and Instrumentation, Fl-F8
Seismological Characterization of the Continental Upper Mantle I, G 1-G 10 Pacific Northwest Crustal Structure: SHIPS Results, Hl-H9 Pacific Northwest Earthquake Hazards, 11-19 Advances in Seismic Wave Propagation Theory and Modeling I, Jl-J9
Earthquake Sources and Fault Mechanics: Observations and Insights 111, Kl-Kl2 Seismicity and Seismotectonics, Ll-L12 Structure, M 1-MS
Seismological Research Letters Volume 70, Number 2 March/April 1999 195
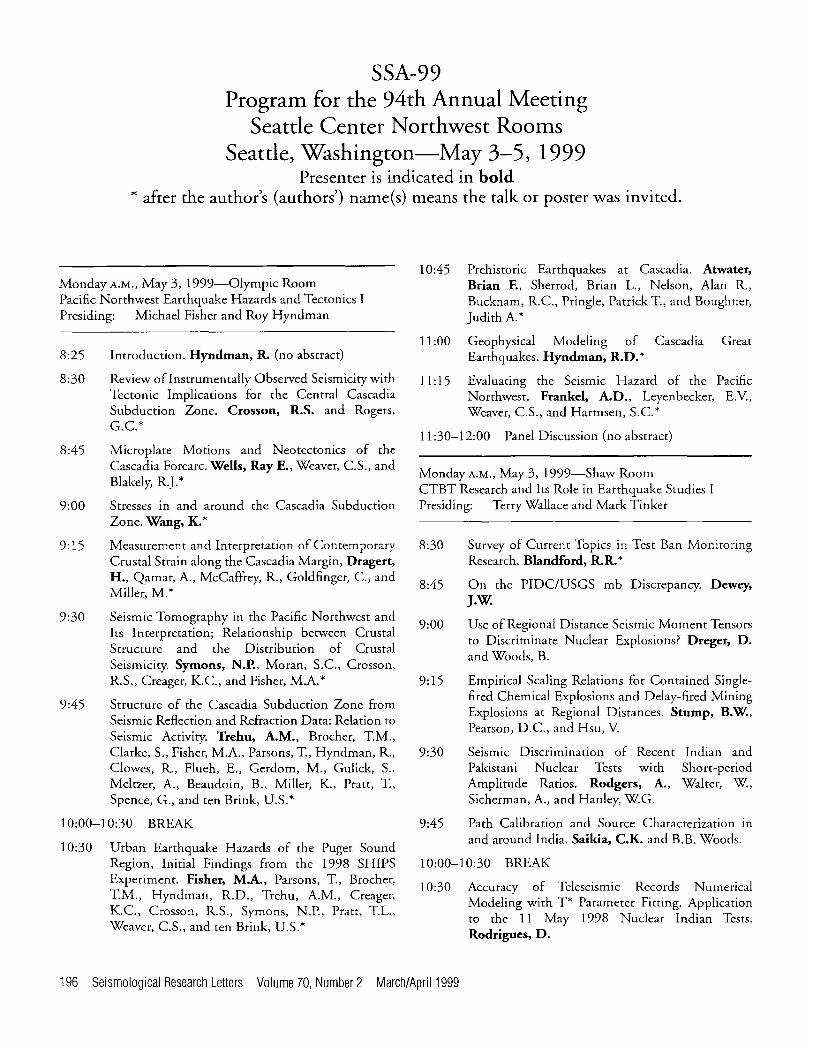
SSA-99 Program for the 94th Annual Meeting
Seattle Center Northwest Rooms Seattle, Washington-May 3-5, 1999
Presenter is indicated in bold * after the author's (authors') name(s) means the talk or poster was invited.
Monday A.M., May 3, 1999-0lympic Room Pacific Northwest Earthquake Hazards and Tectonics I Presiding: Michael Fisher and Roy Hyndman
8:25
8:30
8:45
9:00
9:15
9:30
9:45
Introduction. Hyndman, R. (no abstract)
Review oflnstrumentally Observed Seismicity with Tectonic Implications for the Central Cascadia Subduction Zone. Crosson, R.S. and Rogers, G.C.*
Microplate Motions and Neotectonics of the Cascadia Forearc. Wells, Ray E., Weaver, C.S., and Blakely, R.J.*
Stresses in and around the Cascadia Subduction Zone. Wang, K.*
Measurement and Interpretation of Contemporary Crustal Strain along the Cascadia Margin, Dragert, H., Qamar, A., McCaffrey, R., Goldfinger, C., and Miller, M.*
Seismic Tomography in the Pacific Northwest and Its Interpretation; Relationship between Crustal Structure and the Distribution of Crustal Seismicity. Symons, N.P., Moran, S.C., Crosson, R.S., Creager, K.C., and Fisher, M.A.*
Structure of the Cascadia Subduction Zone from Seismic Reflection and Refraction Data: Relation to Seismic Activity. Trehu, A.M., Brochet, T.M., Clarke, S., Fisher, M.A., Parsons, T., Hyndman, R., Clowes, R., Flueh, E., Gerdom, M., Gulick, S., Meltzer, A., Beaudoin, B., Miller, K., Pratt, T., Spence, G., and ten Brink, U.S.*
10:00-10:30 BREAK
10:30 Urban Earthquake Hazards of the Puget Sound Region, Initial Findings from the 1998 SHIPS Experiment. Fisher, M.A., Parsons, T., Brocher, T.M., Hyndman, R.D., Trehu, A.M., Creager, K.C., Crosson, R.S., Symons, N.P., Pratt, T.L., Weaver, C.S., and ten Brink, U.S.*
10:45 Prehistoric Earthquakes at Cascadia. Atwater, Brian F., Sherrod, Brian L., Nelson, Alan R., Bucknam, R.C., Pringle, Patrick T., and Boughner, Judith A.*
11 :00 Geophysical Modeling of Cascadia Great Earthquakes. Hyndman, R.D. *
11: 15 Evaluating the Seismic Hazard of the Pacific Northwest. Frankel, A.O., Leyenbecker, E.V., Weaver, C.S., and Harmsen, S.C.*
11 :30-12:00 Panel Discussion (no abstract)
Monday A.M., May 3, 1999-Shaw Room CTBT Research and Its Role in Earthquake Studies I Presiding: Terry Wallace and Mark Tinker
8:30
8:45
9:00
9:15
9:30
Survey of Current Topics in Test Ban Monitoring Research. Blandford, R.R.*
On the PIDC/USGS mb Discrepancy. Dewey, J.W.
Use of Regional Distance Seismic Moment Tensors to Discriminate Nuclear Explosions? Dreger, D. and Woods, B.
Empirical Scaling Relations for Contained Singlefired Chemical Explosions and Delay-fired Mining Explosions at Regional Distances. Stump, B.W., Pearson, D.C., and Hsu, V.
Seismic Discrimination of Recent Pakistani Nuclear Tests with Amplitude Ratios. Rodgers, A., Sicherman, A., and Hanley, WG.
Indian and Short-period Walter, W,
9:45 Path Calibration and Source Characterization in and around India. Saikia, C.K. and B.B. Woods.
10:00-10:30 BREAK
10:30 Accuracy of Teleseismic Records Numerical Modeling with T* Parameter Fitting. Application to the 11 May 1998 Nuclear Indian Tests. Rodrigues, D.
196 Seismological Research Letters Volume 70, Number 2 March/April 1999

10:45 The Chinese Nuclear Weapons Test Program: Seismic Yields and Locations at Lop Nor. Wallace, T.C. and Tinker, M.A.
11 :00 Improving Regional Seismic Event Location through Calibration of the International Monitoring System. Schultz, Craig A. and Myers, Stephen C.
11: 15 Can the International Monitoring System for the Comprehensive Nuclear Test Ban Treaty Attain the Goal to Locate Events with 1000 Square km Uncertainty? McLaughlin, K.L., Yang, X., lsraelsson, H., and Stead, R.
11 :30 Maximum Spectral Energy Arrival Time of Rayleigh Waves for Epicenter Determination and Location Error Reduction. Yacoub, N.K.
11 :45 The Comprehensive Test Ban Treaty in the Region of Bolivia. Drake, L.A., Ayala, R., and Vega, A.
Monday A.M.-Rainier Room Posters Strong Ground Motion: Observing, Predicting, and Engineering Applications I
Al
A2
A3
A4
A5
A6
A7
Seismic Wave Amplification in the Santa Clara Valley from Nearby Earthquakes. Harmsen, S.C., Frankel, A., and Graves, R.W
Ground-motion Amplification on Vertically and Laterally Heterogeneous Media: Some Typical Cases from the Urban Area of Catania. Langer, H., Cristaldi, M., Gresta, S., and Tortorici, L.
Ground Motion Attenuation at Regional Distance in Italy and Germany. Malagnini, L., Herrmann, R.B., Di Bona, M., and Koch, K.
Ground Motion Amplification by an Orthotropic Basin. Zheng, T. and Dravinski, M.
Empirical Site Responses in Bucharest, Romania, Determined from Ambient Noise and Small Earthquake Investigations. Bonjer, K.-P., Driad, L., Oncescu, M.-C., Rizescu, M., Ionescu, C., and Moldoveanu, T.
Correlation of Ground Motion and Intensity for the January 17, 1994, Northridge, CA, Earthquake. Boatwright, J., Thywissen, K., and Seekins, L.C.
Regressing Velocity Response Spectra from Large Strike-slip Earthquakes for Site Amplification, Attenuation, and Directivity. Boatwright, J., and Seekins, L.C.
AS Basin Structure Estimation by Forward and Inversion Method. Ji, C. and Helmberger, D.
A9
AlO
All
A12
A13
A14
A15
A16
Al?
A18
A19
A20
All
Maps of Orbital Motions for the 1994 Northridge Earthquake. Porter, L.D. and Leeds, D.J.
A 1-km Wide Low Velocity Zone in the Calaveras Fault, and Its Effect on Strong Ground Motions. Spudich, P., Olsen, K.B., Jewel, E., and Archuleta, R.
Investigating the Effects of 3D Structure on Strong Ground Motions in Santa Clara Valley. Stidham, C., Dreger, D., Romanowicz, B., and Larsen, 5.
High Frequency Vertical Ground Motion in the Pacific Northwest Using PNSN Data. Herrmann, Robert B. and Dutt, James.
Style-of-faulting and Footwall/Hanging Wall Effects. Chiou, S.J., Makdisi, F., and Youngs, R.R.
Analysis of Ground Motion Parameters for Scenario Earthquakes on the Santa Monica Mountain Thrust and Hollywood-Santa Monica Faults. Saikia, C.K. and P.G. Somerville.
Results of Site Amplification Study in Anchorage, Alaska on the Basis of Generalized Inversion Scheme. Dutta, U., Martirosyan, A., Biswas, N., Dravinski, M., and Papageorgiou, A.
G/Gmax and Hysteretic Damping Soil Models Based on Modeling Strong Ground Motions. Silva, Walter J., Pyke, Robert, Roblee, C., Stokoe, K., and Vucetic, M.
Comparisons of Nonlinear and Equivalent Linear Analyses at High Strain Levels. Silva, Walter J., Humphrey, J., Stokoe, K., Pyke, Robert, and Idriss, I.M.
Surface Geology-based Amplification Factors for San Francisco, Los Angeles, and Portland Areas. Gregor, Nick, Silva, Walter J., Wills, C., and Li, 5.
Performance of the Base Isolators in the Mackay Mines Building at the University of Nevada, Reno, during the 30 October 1998 Incline Village Earthquake. Anooshehpoor, A.
Evidence for Vertical Ground Accelerations Exceeding Gravity during the 1997 UmbriaMarche (Central Italy) Earthquakes. Bouchon, M., Gaffer, 5., Cornou, C., Dietrich, M., Glor, J.P., Courboulex, F., Caserta, A., Cultrera, G., Marra, F., and Guiguet, R.
Seismic Characterization of Tunneling Activity at the Yucca Mountain Exploratory Studies Facility. Steck, L.K., Pehler, M.C., Baker, D.F., Edwards, C.L., and Cogbill, A.H.
Seismological Research Letters Volume 70, Number 2 March/April 1999 197
Monday A.M.-Rainier Room Posters Volcano Dynamics and Seismology I
Bl Multiplet Analysis at Alaskan Volcanoes. J.A. Power, S.C. Moran, and J.M. Lees.
B2 Earthquake Swarms at Mount Hood: Relation to Geologic Structure. Norris, R.D., Weaver, C.S., Meagher, K.L., Qamar, A., and Blakely, R.J.
B3 Volcanic Tremor during Eruptions, S.R. McNutt and Tytgat, G.
Monday P.M., May 3, 1999-0lympic Room Pacific Northwest Earthquake Hazards and Tectonics II Presiding: Roy Hyndman and Michael Fisher
1:30
1:45
2:00
2:15
2:30
2:45
Structure of the Seattle Basin: A Tomographic Model Using Data from the 1998 Seismic Hazards Investigation in Puget Sound (SHIPS) Experiment, Washington State. Brochet, T.M., Parsons, T., Fisher, M.A., ten Brink, U.S., Molzer, P.C., Creager, K.C., Crosson, R.S., Trehu, A.M., Miller, K.C., Pratt, T.L. and Weaver, C.S.
Ground Shaking in the Puget Lowland, Western Washington State, from Earthquakes Recorded on the SHIPS Land Geophone Array. Pratt, T., Brocher, T., Parsons, T., Fisher, M., Creager, K., Crosson, R., Weaver, C., Hyndman, R., Trehu, A., Miller, K., and ten Brink, U.S.
Tectonic Setting and Earthquake Hazards of the Seattle Fault, Washington: Implications from Highresolution Aeromagnetic Data. Blakely, R.J., Wells, R.E., Weaver, C.S., and Johnson, S.Y.
The June 23, 1997 Bainbridge Island, Washington, Earthquake: Evidence That the Seattle Fault is Seismically Active. Weaver, C.S., Meagher, K.L., Qamar, A., Blakely, R.J., and Wells, R.E.
Modeling the Effect of the Puget Basin on Strong Ground Motions from Earthquakes on the Seattle Fault. Pitarka, A., Smith, N.F., Graves, R.W, and Somerville, P.
Evidence for Quaternary Neotectonics in the Marine Record of the Pacific Northwest and Southwestern British Columbia. Mosher, D.C., Johnson, S.Y., Dadisman, S.V, Hyndman, R.D., Fisher, M.A., and scientific personnel from SHIPS' 98 Expedition.
3:00-3:30 BREAK
3:30
3:45
4:00
4:15
Neotectonics of the Devils Mountain Fault and Northern Whidbey Island Fault, Eastern Strait of Juan de Fuca and Northern Puget Lowland, ~'ashington. Johnson, S.Y., Dadisman, S.V, Mosher, D.C., Blakely, R.J., Childs, J.R., and Rhea, S.B.
Phase Changes, Fluids and the Colocation of the Deep and Shallow Seismicity beneath Puget Sound and Southern Georgia Strait. Rogers, G.C.
The June 24, 1997 M=4.6 British Columbia Earthquake: Shallow, Thrust Faulting beneath the Strait of Georgia. Cassidy, J.F., Rogers, G.C., Horner, R.B., and Waldhauser, F.
Relocation of Earthquakes in the Leach River Fault Region of Vancouver Island, BC. Mulder, T.L. and Rogers, G.C.
4:30 A Characterization of Seismic Sources in Western Washington and Northwestern Oregon. Wong, I.G., Pezzopane, S.K., and Blakely, R.J.
4:45 A Stochastic Source Model for Estimating Local Tsunami Hazards. Geist, E.L.
Monday P.M., May 3, 1999-Fidalgo Room Volcano Dynamics and Seismology II Presiding: Jonathan Lees and Jeffrey Johnson
1 :30 Location of the Seismovolcanic Source at Stromboli Volcano Using Two Seismic Antennas. La Rocca, M., Del Pezzo, E., Petrosino, S., Saccorotti, G., Ibanez, J., Almendros, J., Alguacil, G., and Carmona, E. *
1 :45 Recent Work and Future Directions in Shortperiod Volcano Seismology. Moran, S.C. and Power, J .A.*
2:00 Seismic Evidence for a Complex Magmatic System beneath Long Valley Caldera, California. Hill, David P.*
2:15
2:30
2:45
The Summer 1998 "Tom's Place" Sequence Southeast of Long Valley Caldera, California: Hints of Magmatic/Geothermal Involvement? Hough, S.E. and Dollar, R.S.
Propagation of Seismicity during the Sept.!Oct., 1996 Subglacial Eruption Episode near Bardarbunga Volcano, Iceland. Vogfjord, K., Rognvaldsson, S., Slunga, R., Morgan, J., Nolet, G. Allen, R., Erlendsson, P., Ragnarsson, S., Stefansson, R., Julian, B., and Foulger, G.
Evidence for an Intermittent Supply of Magma at Mount St. Helens, Washington. Musumeci, C., Malone, S.D., Giampiccolo, E., and Gresta, S.
198 Seismological Research Letters Volume 70, Number 2 March/April 1999

3:00-3:30 BREAK
3:30 Two Chugging Giants: Karymsky and Sangay. Lees, J.M. and Johnson, J.B.
3:45 Comparing Physical Tremor Models with Measurements: How Big Is the Source of Harmonic Tremor? Hellweg, M. *
4:00 Thrust Inversion: A Method of Measuring Mass Discharge Rate from Seismic Data. Brodsky, E.E. Kanamori, H., and Sturtevant, B.*
4: 15 Integration of Seismic and Infrasonic Data: Essential to the Understanding of Explosion Source Dynamics at Volcanoes. Johnson, J.B. and Lees, J.M.
4:30 Applications of GPS to Volcano Monitoring. Newman, A., Dixon, T., Dixon, J., Meertens, C., Perin, B., and Stein, S.
4:45 Integrated Seismic, Acoustic, and Ground Deformation Studies at Arenal Volcano, Costa Rica. Schwartz, S.Y., Schapiro, R., Sampson, D., Hagerty, M.T., Garces, M.A., Protti, M., Van Der Laat, R., Hernandez, E., Dixon, T.H., and Norabuena, E.
Monday P.M., May 3, 1999-Shaw Room Strong Ground Motion: Observing, Predicting, and Engineering Applications II Presiding: Steven Kramer and Kim B. Olsen
1:30
1:45
2:00
2:15
2:30
An Engineering Model of the Near-fault Rupture Directivity Pulse. Somerville, P.G.
Probabilistic Soil Amplification for Nonlinear Soil Sites with Uncertain Properties. Bazzurro, P. and Cornell, C.A. *
Stochastic Modeling of California Ground Motions. Atkinson, G.M., and Silva, WJ.
Strong Motion Simulation of the Hyogo-ken Nanbu Earthquake Using Multiple Asperities and a 3-D Basin Structure. Kawase, H., Matsushima, S., and Graves, R.W
Identification of Path and Local Site Effects on Phase Spectrum of Seismic Motion. Sawada, S., Morikawa, H., Toki, K., and Yokoyama, K.
2:45 Importance of Integral Parameters for Seismological and Engineering Studies. Tumarkin, A.G.
3:00-3:30 BREAK
3:30 Geotechnical Arrays Instrumented by the California Strong Motion Instrumentation
3:45
4:00
4:15
4:30
Program (CSMIP). Graizer, V.M., Shakal, A.F., and Roblee, C.J.
Broadband Modeling of Nonlinear Soil Response for the 1994 Northridge, California, Earthquake. Jones, E.M. and Olsen, K.B.
Liquefaction and Dynamic Poroelasticity in Soft Sediments. Bachrach, R., Nur, A., and Agnon, A.
Time and Spectral Analysis of the Hyperbolic Model and Extended Masing Rules Hysteresis for Nonlinear Site Response Modeling. Bonilla, L.F., Lavallee, D., and Archuleta, R.J.*
Compressional and Shear Wave Velocities of Soils at Low Pressures-Theoretical Estimates, and Comparison to Laboratory and Field Data. Berge, P.A., Bonner, B.P., Aracne-Ruddle, C., Trombino, C., and Berryman, J.G.
Monday P.M.-Rainier Room Posters CTBT Research and Its Role in Earthquake Studies II
Cl Using Three-dimensional Mantle Velocity Models in Teleseismic Event Location. Antolik, M., Ekstrom, G., and Dziewonski, A.M.
C2 Improvement in Seismic Location Using Nonstationary Bayesian Kriging. Myers, S.C. and Schultz, C.A.
C3
C4
cs
C6
C7
cs
C9
Calibration of the IMS Seismic Network by Surrogate Stations. Engdahl, E.R.
Statistical Analysis of Travel Time Residuals Applied to the Analysis of Station Quality. Hanley, W.G., Schultz, C.A., and Myers, S.C.
Noise Characteristics for Borehole Stations with and without Sand. Astiz, Luciana.
Cluster Analysis for CTBT Seismic Event Monitoring. Carr, D.B., Young, C.J., Harris, J.M., Aster, R.C., and Zhang, X.
Modeling Ripple Fired Explosions from the Centralia Mine, Southwestern Washington. Rohay, A.C.
Surface Wave Measurements across the Middle East and North Africa. Pasyanos, M.E., Walter, WR., and Hazler, S.E.
Regional Waveform Modeling in Southwestern Asia: Tectonic Release from the May 11, 1998 Indian Nuclear Tests. Walter, W.R. and Rodgers, A.J.*
Seismological Research Letters Volume 70, Number 2 March/April 1999 199

CIO
Cll
C12
Amplitude Corrections for Regional Seismic Discriminants. Taylor, S.R., Velasco, A.A., Hartse, H.E., Phillips, WS., Walter, WR., and Rodgers, A.J.*
An Unusual Seismic Event from Qinghai Province, China. Hartse, H.E. and Velasco, A.A.*
A Preliminary Regionalized Velocity Model of the Pakistan/India Region for Use m Seismic Monitoring Applications. Bernard, M., Reiter, D.T., and Rieven, S.A.
C13 Amplitude Tomography for Regional Seismic Verification. Phillips, W.S., Hartse, H.E., Taylor, S.R., Velasco, A.A., and Randall, G.E.
C14 Ground Truth Source Parameters and Locations for Earthquakes in Central Asia. Woods, B.B., Saikia, C.K., and Thio, H.K.
C15 Path Corrections, Kriging, and Regional Seismic Event Location in China. Steck, L.K., Velasco, A.A., and Cogbill, A.H.
Monday P.M.-Rainier Room Posters Earthquake Hazards and Risks
DI
02
03
04
05
06
07
08
09
Hokusai's "Great Wave" Is Not a Tsunami. Berglof, W.R.
Probabilistic Seismic Hazard Maps for the Central United States. Herrmann, Robert B., Akinci, Aybige, and Ortega, Roberto.
A Methodology to Estimate Site-specific Seismic Hazard for Critical Facilities on Soil or Sofr-rock Sites. Lee, R.C., M.E. Maryak, and J. Kimball.
Geologic Hazards Assessment for U.S. Navy Installations, Western United States. Wells, D.L., Chase, E.G., Power, M.S., and Beukelman, G.
A "Floor" for Seismic Ground Motions for the Most Stable Part of Canada. Adams, J., Halchuk, S., and Fenton, C.H.
Triggering of Earthquakes by Earthquakes: Prediction Possibilities in Greece. Papadopoulos, G.A.
The Memphis-Shelby County Seismic Hazard Mapping Project. Schweig, Eugene S. and Gomberg, Joan S.
Near-surface Shear-wave Refraction and Soil Velocity Measurement. Wang, Z.
Radar Imagery of Fault Breaks in Soil: San Andreas and Hayward Faults, Central California. Kayen,
010
R.E., Barnhardt, WA., Fumal, T.F., Carkin, B., and Minasian, D.
Internal Structure of Earthquake-induced Landslides in Anchorage, Alaska. Barnhardt, W.A. and Kayen, R.E.
Tuesday A.M., May 4, 1999-0lympic Room Ancient Earthquakes and Active Faults in the Pacific Northwest Presiding: Brian Atwater and Brian Sherrod
8:30
8:45
9:00
9:15
9:30
9:45
Seismotectonics of the Eastern Aleutian Subduction Zone: An Analog for Great Tsunamigenic Earthquakes in Southern Cascadia? Plafker, G. and Carver, G.A.
Palynological Evidence for Crustal Subsidence during the Last Cascadia Subduction Zone Earthquake, Tofino, Vancouver Island, Canada. Hughes, J.F., Mathewes, R.W, and Clague, J.J.
Paleotsunami Evidence from Northern California for Repeated Long Rupture (M 9) of the Cascadia Subduction Zone. Carver, G.A., Abramson, H.A., Garrison-Laney, C.E., and Leroy, T.
Radiocarbon Dating of a Seattle Earthquake to
A.O. 900-930. Atwater, B.F.
Evidence for at Least Three Moderate or Larger Earthquakes near Everett, Washington, Since about A.O. 800. Bourgeois, J. and Johnson, S.Y.
A Fault Scarp of Probable Holocene Age in the Seattle Fault Zone, Bainbridge Island, Washington. Bucknam, R.C., Sherrod, Brian L., and Elfendahl, Gerald.
10:00-10:30 BREAK
10:30 Holocene Surface Faulting in the Seattle Fault Zone, Bainbridge Island, Washington. Nelson, A.R., Pezzopane, S.K., Bucknam, R.C., Koehler, R.D., Narwold, C.F., Kelsey, H.M., Laprade, WT., Wells, R.E., and Johnson, S.Y.
10:45 New Tree-ring Evidence Suggests That at Least Two Major Rock Avalanches Were Approximately Contemporaneous with Fault-scarp Damming of Price Lake in the Southeast Olympic Mountains about 1000 Years Ago. Pringle, Patrick T., Logan, Robert L., Schuster, Robert L., and Palmer, Stephen P.
11 :00 Earthquake-induced Subsidence about 1100 Years Ago around Southern Puget Sound, Washington. Sherrod, Brian L.
200 Seismological Research Letters Volume 70, Number 2 March/ April 1999
11: 15 Character and Age of Tectonically Deformed Pleistocene Deposits in the Central Puget Lowland, Washington State. Booth, D.B. Troost, K.G., and Hagstrum, J.T.
11 :30 High-resolution Seismic Images of the Ancestral Columbia River Valley and Recent Faulting beneath the Portland-Vancouver Urban Area, Oregon and Washington. Pratt, T., Odum, J., Stephenson, W, Williams, R., Dadisman, S., Holmes, M., and Haug, B.
Tuesday A.M., May 4, 1999-Lopez Room Earthquake Sources and Fault Mechanics: Observations and Insights I Presiding: Gregory Beroza and Chris Marone
8:30 Stress Triggers, Stress Shadows, What Have We Learned and Where Do We Go from Here? Harris, Ruth A.
8:45 Effects of Stress History on Earthquake Timing. Blanpied, M.L., Gomberg, J., Beeler, N.M., Dieterich, J.H., Kilgore, B.D., and Bodin, P.
9:00 Laboratory Measurements of Frictional Healing and Their Implications for Fault Healing. Marone, C.
9: 15 A Brownian Model for Recurrent Earthquakes. Matthews, M.V., Ellsworth, WL., and Reasenberg, P.A.
9:30 Towards a Generic Earthquake Recurrence Model: Application of the Brownian Passage Time Distribution to a Global Earthquake Data Set. Ellsworth, W.L., Matthews, M.V, Nadeau, R.M., Nishenko, S.P., and Reasenberg, P.A.
9:45 Paleoseismic Reconnaissance along the Great 1905 Bulnay, Mongolia Surface Rupture. Schwartz, D.P., Hecker, S., Ponti, D.J., Bayasgalan, A., Lund, WR., Stenner, H.D., and Enkbaatar, D.
10:00-10:30 BREAK
10:30 Three-dimensional Simulations of the Dynamics of Dipping Faults. Oglesby, D.O., Archuleta, R.J., and Nielsen, S.B.
10:45 Fault Slip and Loading Rates at Depth from Recurrence Intervals of Repeating Microearthquakes. Nadeau, R.M. and McEvilly, TV
11 :00 Nucleation of Large Earthquakes: Effects of Spatial Variations in the Constitutive Law Parameters. Shibazaki, B.
11:15 Earthquake Source Parameter Scaling from Deep Borehole Observations in Long Valley, California. Prejean, S.G., Ellsworth, WL., and Ito, H.
11 :30 Earthquakes Clustering as Driven by Local Interaction Geometry. Amitrano, 0., and Grasso, J.-R.
Tuesday A.M., May 4, 1999-Fidalgo Room Seismicity, Seismotectonics, and Structure Presiding: Michael Stickney and Bruce Schell
8:30 Effects of Shallow Mississippi Embaymenc Structure on Ground Motions from Teleseisms. Bodin, P., Hall, J.L., Horton, S., Withers, M., and Herrmann, R.
8:45 Contemporary Deformations along the Southern Part of the Imperial Fault and Its Relation With Subsidence and Seismicity in the Mexicali Valley . (B.C., Mexico). Glowacka, E., Gonzalez, J., Diaz de Cossio, G., and Farfan, F.
9:00 Characteristics of Recent Seismicity in Southwest Montana and Its Relation to Late Quaternary Faults. Stickney, M.C.
9:15 Microearthquakes of the Charlevoix Seismic Zone, Quebec, Canada, Occur in Highly Fractured Zones Bounded by Regional Faults. Lamontagne, M.
9:30 Does the Spatial Distribution of Smaller Earthquakes Delineate Areas Where Larger Earthquakes Are Likely to Occur? Kafka, A.L. and Levin, S.Z.
9:45 Seismic Velocity Structure across the Boundary Between the Insular and Intermontane Belts, Southwestern British Columbia. Zelt, B.C. and Ellis, R.M.
10:00-10:30 BREAK
10:30 A New Crustal Velocity Model for the Monterey Bay Coastal Region. Begnaud, M.L., McNally, K.C., Stakes, D.S., and Gallardo, VA.
10:45 Location and Activity of the Hollywood Fault, Los Angeles County, CA. Schell, Bruce A.
11 :00 Crustal Structure under the Coso Geothermal Field from Broadband Receiver Functions. Bhattacharyya, J., Levin, V, Lees, J. and Park, J.
11: 15 Hotspot Effects on the Seismic Structure of the Lithosphere: Tomography in Hawaii. Tilmann, F.J., Benz, H.M., Priestley, K.F., and Okubo, P.G.
11 :30 Shallow Seismic Investigation of an Ancient Archaeological Site in Southern Egypt. Alexander, S.S., Vasalani,J.L., Brown, S.M., and Montague, M.
Seismological Research Letters Volume 70, Number 2 March/April 1999 201

Tuesday A.M., May 4, 1999-Shaw Room Deep Earth Structure: New Results and Interpretations Presiding: Eddie Gamero and Sara Russell
8:30
8:45
9:00
9:15
9:30
The Nature of the Lower Mantle: Toward a Hybrid Convection Model. van der Hilst, Rob D. and Karason, Hrafnkell. *
Variations of the Lowermost Mantle beneath the Northeastern Pacific. Wysession, M.E., Langenhorst, A., Fischer, K.M., and Fouch, M.J.*
Improved Shear Velocity Structure of the Base of the Mantle (D") Using (ScS-S) and (Sdiff-SKS) Residual Travel Times. Castle, J.C., Creager, K.C., Preston, L., and Winchester, J.P.*
Comparison of Small Scale Structure in D" beneath Central America and the Central Pacific. Russell, S.A. and Lay, T. *
Compressional Wavespeeds of the Core Mantle Boundary Region from PcP-P Differential Travel Times. Bradshaw,J.A., Creager, K.C., and Preston, L.A.*
9:45-10: 15 BREAK
10: 15 The D" Discontinuity as a Change in the Statistics of Heterogeneity Scale Lengths. Cormier, V.F.*
10:30 Shear Wave Anisotropy near the Core-Mantle Boundary beneath the Central Pacific. Fouch, M.J., Fischer, K.M., Wysession, M.E., and Silver, P.G.*
10:45 Extremes in Complex Structures at the CMB. Helmberger, D.V., Sidorin, I., Wen, L., Ni, S., Ritsema, J., and Gurnis, M.*
11 :00 A Broadband Seismic Study of the Lowermost Mantle beneath Mexico: Further Evidence of a Partial Melt Origin of Ultralow Velocity Zones. Revenaugh, J., Havens, E., and Reasoner, C.*
11: 15 On Detecting Structure and Roots of Plumes in the Lower Mantle. Garnero, E.J., and Wen, L.-X.*
11 :30 The Effect of Deep Mantle Heterogeneity on PKP Differential Travel Time Residuals: Implication for Inner Core Structure. Ludovic Breger, Barbara Romanowicz, and Hrvoje Tkalcic.*
Tuesday A.M.-Rainier Room Posters Seismology in Education T
El
E2
E3
E4
Seismology m Undergraduate Education: Opportunities and Resources Available through IRIS. Johnson, C.L.
Wiggles-An Easy-to-use Seismogram Display/ Processing Tool for Macintosh Computers. Ammon, Charles J.
The Southern California Earthquake Center: Providing Unique Life-long Learning Experiences. Andrews, J.A., Tekula, S.A., and Benthien, M.L.
Updates to the "Investigating Earthquakes through Regional Seismicity" Educational Module. Marquis, J., Hafner, K., and Hauksson, E.
Tuesday A.M.-Rainier Room Posters Networks and Instrumentation
Fl
F2
F3
F4
FS
F6
F7
Automatic Picking of S Arrival Type Using a Nonlinear Filtering. Tasie, I., and Lapajne, J.K.
An Affordable Broadband Seismometer: The Capacitive Geophone. Barzilai, A., Vanzandt, T., Pike, T., Manion, S., and Kenny, T.
New Developments at the Southern California Earthquake Center Data Center (SCEC_DC) http://www.scecdc.scec.org. Hafner, K. and Clayton, R.
Database Oriented Distributed Seismic Processing. Johnson, Carl E., Bittenbinder, A., Bogaert, B., Dietz, L., and Kragness, David.
Integration of GPS, Seismic, and Other Measurement Systems for Geophysical Research. Shiver, W.S., Meertens, C., Perin, B., and Stein, S.
Single-channel Recorder Test Results from Two Active Source Experiments. Passmore, P.R., Keller, G.R., Miller, K.C., Levander, A.R., and McMechan, G.
The Evaluation of the Wilmot Seismoscope Response Assigned to the 1861 Mendoza, Argentina, Earthquake. Carmona, Juan S. and de Carmona, Raquel P.
F8 Installation and Calibration of Five New Broadband Digital Telemetry Stations in Utah. Pechmann,J.C., Nava, S.J., andArabasz, WJ.
202 Seismological Research Letters Volume 70, Number 2 March/April 1999

Tuesday P.M., May 4, 1999-0lympic Room Opportunities and Initiatives in Seismology Presiding: Joseph Henton and Anthony Qamar
2:00
2:15
2:30
Opportunities and Initiatives in Seismology. Simpson, D.W. and Meltzer, A.
USARRAY. Meltzer, A.S., Ekstrom, G.A., Humphreys, E.D., Levander, A.R., and Shearer, P.M.
Integration of Geodetic and Seismic Observations for Plate Boundary Studies. Stein, S., Silver, P., Burgmann, R., and Romanowicz, B.
Tuesday P.M., May 4, 1999-0lympic Room Pacific Northwest Crustal Deformation and Tectonics Presiding: Anthony Qamar and Joseph Henton
2:45 GPS Constraints on Plate Coupling in Central Western Oregon. Goldfinger, C., McCaffrey, R., Murray, M., Zwick, P., Nabelek, J., Smith, C.L., and Johnson, C.
3:00 Earthquake Hazards in Western Washington: What Have We Learned from Continuous GPS Measurements? Qamar, A. and Khazaradze, G.
3:15 GPS Monitoring of Crustal Deformation on Vancouver Island. Henton, J.A., Dragert, H., Hyndman, R.D., Wang, K., and Schmidt, M.
3:30-3:45 BREAK
3:45 Implications of Thermal Modeling for Shallow and Intermediate Seismicity of the Southern Cascadia Subduction Zone? McKenna, J.R. and Blackwell, 0.0.
4:00
4:15
4:30
Cascadia Subduction Zone Segmentation in the Mendocino Triple Junction Region. Carver, G.A. and Plafker, G.
Deformation and Mass Transfer at the Mendocino Triple Junction: What Gorda Gives Up, North America Receives. Henstock, T.J., Levander, A., Meltzer, A.S., and Gulick, S.P.S.,
Thermal and Dislocation Modeling and Great Thrust Earthquakes of the Queen Charlotte Transform Margin. Smith, A.J., Hyndman, R.D., Wang, K., Cassidy, J.F., Dragert, H., and Schmidt, M.
Tuesday P.M., May 4, 1999-Lopez Room Earthquake Sources and Fault Mechanics: Observations and Insights II Presiding: Gregory Beroza and Chris Marone
2:00
2:15
2:30
Fault Fabrics/Earthquake Mechanics from Precise Relative Earthquake Locations. Rubin, A.M., Gillard, 0., and Got, J.-L.*
Slip-parallel Seismic Lineations on the Hayward Fault and the San Andreas Fault near Parkfield, California. Waldhauser, E, Ellsworth, WL., and Cole, A.*
Source Parameter Inversion Using 3-0 Green's Functions: Application to the 1979 Coyote Lake, California, Earthquake. Archuleta, R.J. and Liu, P.C.
2:45 Dramatic Reduction in Friction of Quartz at Rapid but Subseismic Slip Rates. Goldsby, D.L. and Tullis, T.E.*
3:00 Distributed Flow vs. Localized Slip in Late Cenozoic Low-angle Fault Zones, Death Valley, California. Cowan, D.S. and Miller, M.G.*
3: 15-3:45 BREAK
3:45 3-D Rupture Dynamics with Kinematic Constraints: The 1992 Landers Earthquake. Olsen, K.B. and Madariaga, R.
4:00 On the Resolvability of Fault Frictional Parameters from Wave Form Inversion of Strong Ground Motion Data. Guatteri, M., and Spudich, P.
4: 15 Coseismic and Postseismic Stress Histories Inferred from Focal Mechanisms: A Review. Michael, A.J. and Bawden, G.W
4:30 Observations of Earthquakes in Oceanic Intraplate Lithosphere with Exceptionally Intense Seismicenergy Radiation. McGarr, A. and Choy, G.L.
Tuesday P.M., May 4, 1999-Fidalgo Room Seismology in Education II Presiding: Catherine Johnson and Charles Ammon
2:00
2:15
NSF Support for Undergraduate Geoscience Education. Mayhew, M.A. and Stout, D.L.*
The SAGE (Summer of Applied Geophysical Experience) Program-Integration of Education and Research in Geophysics. Braile, Lawrence W., Jiracek, George R., Baldridge, W Scott, Ferguson, John R., Biehler, Shawn, and Gilpin, Bernard J.*
Seismological Research Letters Volume 70, Number 2 March/April 1999 203
2:30
2:45
3:00
Experiences in Building Interactive, Web-based Learning Environments: Introduction to Geophysical Exploration. Boyd, T.M. *
Tectonic Geodesy Involves Undergraduate UCSB Students in Meaningful Seismological Research. Sylvester, Arthur Gibbs.
Seismology for Future Decision-makers, Van der Vink, G.E. and Allen, R.M. *
3: 15-3:45 BREAK
3:45 Earth Observatories: A Mechanism for Educating Future Scientists and Citizens. Meltzer, A.S. and Zeitler, P.K.*
4:00
4:15
4:30
Beyond Locating Epicenters: Quantitative Seismology in Geoscience Courses. Kroeger, G.C.*
Incorporating Introductory
An Undergraduate Course in Earthquakes for Nonmajors. Yeats, R.S. *
Technology in Introductory Geophysics: The High-low Mix. Klosko, E., Delaughter, J., and Stein, S.
Tuesday P.M., May 4, 1999-Shaw Room Strong Ground Motion: Observing, Predicting, and Engineering Applications III Presiding: Steven Kramer and Kim B. Olsen
2:00 1-D and 2-D Analyses of Weak Motion Data in Fraser Delta from 1966 Duvall Earthquake. Finn, W.D.L., Zhai, E., Thavaraj, T., Hao, X.-S., and Ventura, C.E. *
2:15
2:30
2:45
3:00
3:15
Investigation of Earthquake Ground Motion Amplification in the Olympia, Washington, Urban Area. Palmer, S.P., Walsh, T.J., and Gerstel, WJ.*
Variation in Ground Motion in Greater Vancouver, Canada. Cassidy, J.F. and Rogers, G.C.
Determination of Site Amplification Factor for Anchorage, Alaska, Using Spectral Ratio Methods. Martirosyan, A., Dutta, U., Biswas, N., Dravinski, M., Papageorgiou, A.
Site Response Analysis in the Lanyang Plain from Earthquake and Microtremor Data. Wen, K.L., Peng, H.Y., Chang, C.L., and Liu, L.F.
Application of Site Characterization Studies to Ground Motion Prediction: Analysis of Vertical Array Data from Well Characterized Sites in California. Steidl, J.H., Archuleta, R.J., and Bonilla, L.F.
3:30-3:45 BREAK
3:45 Surface Ground Motion Maps of Oregon. Wang, Yumei.*
4:00
4:15
4:30
Finite Fault Source Inversion Using 3D Green's Functions. Graves, R.W., Wald, D.J., Kawase, H., and Sato, T.
Differences among Micro tremor, Coda, and S-wave Amplifications. Satoh, T. and Kawase, H.
Evaluation and Application of the Horizontal-tovertical Ratio in Taipei Basin. Peng, H.Y., Wen, K.L., and Liu, H.J.
Tuesday P.M.-Rainier Room Posters Seismological Characterization of the Continental Upper Mantle I
GI
G2
G3
G4
G5
G6
G7
GS
G9
Modeling of Teleseismic Waves in Dipping Anisotropic Structures. Frederiksen, A.W. and Bostock, M.G.
VSS Analysis of the Transition Zone Thickness beneath Several GDSN Stations. Simmons, Nathan and Gurrola, Harold.
Imaging the Upper Mantle Transition Zone beneath California Using Teleseismic Ps Receiver Functions. Simmons, Nathan and Gurrola, Harold.
Broadband Upper Mantle Structure near the East Pacific Rise. Melbourne, T.I. and Helmberger, D.V.
Three Dimensional Structure of the Mantle Transition Zone beneath the Tanzanian Craton and Surrounding Mobile Belts, East Africa. Owens, T.J., Gurrola, H., Nyblade, A.A., and Langston, C.A.
Seismic Images of Archean/Proterozoic Differences across the Cheyenne Suture. Cook, S.W., Dueker, K.G., and Sheehan, A.F.
Western U.S. Mantle Strain Provinces Inferred from S-wave Splitting. Schutt, D.L., Humphreys, E.D., Crosswhite, J.C., and Dueker, K.G.
3-D Velocity Tomography of the Southern Part of Korean Peninsula and Its Vicinity. Kim, S.G. and Li,Q.
Characterization of the Upper Mantle beneath the Archean Slave Craton Using Teleseismic Methods. Bank, C.-G., Bostock, M.G., Ellis, R.M., and Cassidy, J.
204 Seismological Research Letters Volume 70, Number 2 March/April 1999

GlO Seismic Velocity Structure in Western China from Surface Wave Dispersion. Ketter, B.S., Velasco, A.A., Randall, G.E., and Ammon, C.J.
Tuesday P.M.-Rainier Room Posters Pacific Northwest Crustal Structure: SHIPS Results
Hl
H2
H3
H4
H5
H6
H7
Structure and Reflectivity of the Subducting Juan de Fuca Plate beneath the Straits of Juan de Fuca and Northern Olympic Peninsula. Trehu, A.M., Bracher, T.M., Fisher, M.A., Parsons, T., Hyndman, R.D., and Spence, G.
Structure beneath Southern Vancouver Island and Juan de Fuca Strait from Onshore-offshore and Two-ship Wide-angle Seismic Data. Graindorge, D., Spence, G., Mosher, D., Hyndman, R., Charvis, P., Collot, J.-Y., and Trehu, A.
Crustal Structure beneath Puget Sound, Washington, from Coincident Seismic Refraction and Reflection Data. ten Brink, U.S., Molzer, P.C., Fisher, M.A., Bracher, T.M. Parsons, T., Crosson, R.S., and Creager, KC.
3-D Reflection Imaging of the Puget Lowlands, Cascadia. Preston, L.A., Creager, KC., Crosson, R.S., Pratt, T.L., Weaver, C., Fisher, M.A., Parsons, T., and Bracher, T.M.
A Model for Localization of Seismicity in the Central Puget Lowland, Washington. Crosson, R.S. and Symons, N.P.
Optimal Utilization of Suboptimal 3D Wide-angle Data. Zelt, C.A.
Tectonic Analysis of the Northern Cascadia Subduction Zone in Western Washington State Using Velocity and Deformation Models. Stanley, D., Villasenor, A., and Benz, H.
HS Velocity Structure in the State of Washington from Local Earthquake Tomography. Villasenor, A., Stanley, D., and Benz, H.
Tuesday P.M.-Rainier Room Posters Pacific Northwest Earthquake Hazards
11 The Seattle Urban Seismic Hazard Mapping Project: A USGS Contribution to Seattle's Project Impact. Weaver, C.S., Troost, KG., Booth, D.B., Frankel, A., Wells, R.E., Mullen, J. and Nolan, T.
12 Geologic/Geophysical Database to Characterize Site Response m the Seattle, Washington,
13
14
15
16
Metropolitan Area. Wong, I.G., Sparks, A., Metcalfe, R., Wright, D.H., Kalinski, M.E., Stakoe, KH., Brown, L.T., and Yount, J.C.
Probabilistic and Earthquake Scenario Ground Shaking Maps for the Portland, Oregon, Metropolitan Area. Wong, I.G., Silva, WJ., Bott, J.D.J., Wright, D.H., Thomas, P.A., Sojourner, A., Gregor, N.J., Li, S., and Mabey, M.A.
Lithology and Site Response in Eugene/Springfield, Oregon. Perry, S.C. and Weldon, R.J. II.
Reducing Earthquake Losses in the Pacific Northwest-A USGS National Earthquake Hazard Reduction Program Internet Home Page at http:// geohazards.cr.usgs.gov/pacnw/. Rhea, Susan and Cox, Jonathon.
Site Response in West Seattle, Washington. Carver, David, Hartzell, Stephen, Frankel, Arthur, Cranswick, Edward, and Norris, Robert.
17 S-wave Velocities for Specific Near-surface Deposits
18
in Seattle, Washington. Williams, R.A., Stephenson, WJ., Odum, J.K, and Worley, D.M.
Simulation of a M6.5 Earthquake on Fault Using 3D Finite-difference Stephenson, W.J. and Frankel, A.D.
the Seattle Modeling.
19 Modeling Observed Ground Motions in Seattle Using Three-dimensional Simulations. Frankel, A.O. and Stephenson, WJ.
Tuesday P.M.-Rainier Room Posters Advances in Seismic Wave Propagation Theory and Modeling I
Jl
J2
J3
J4
J5
Elastic Wave Radiation from a Line Source of Finite Length. Aldridge, D.F.
On Evaluation of 3D Green's Functions for Anisotropic Media. Dravinski, M. and Zheng, T.
A Mode Coupling Mechanism for Scattering of Quasi-Love and Quasi-Rayleigh Waves in Heterogeneous Anisotropic Media. Soukup, D.J., Odom, R.I., and Park, Jeffrey.
The Stochastic Crust and Its Seismic Response. Levander, A., La Flame, L.M., Zelr, C.A., and Henstock, T.J.
Anomalous Phases in the Records of Alaskan Subduction Zone Earthquakes: Observations and Modeling. Ratchkovsky, N.A., Hansen, R.A., and Orrey, J.L.
Seismological Research Letters Volume 70, Number 2 March/April 1999 205
]6
J7
]8
]9
Modeling Surface Topography in Seismic Wave Field Methods with Application to the Generalized Fourier Method. Orrey, J.L.
Elastic Coarse-graining of Memory Vanables: Memory Efficient Q Simulation for Finite Difference Methods. Bradley, C.R. and Day, S.M.
High Frequency Waveform Inversion for Velocity and Attenuation Structure. Keers, Henk, Vasco, Don, and Johnson, Lane.
Three Dimensional Distribution of Scattering Strength Determined from Inversion of Seismic Coda. Chen, :X.Q. and Long, L.T.
Wednesday A.M., May 5, 1999-0lympic Room Seismological Characterization of the Continental Upper Mantle II Presiding: Michael Bostock and Ken Dueker
8:30
8:45
9:00
9:15
9:30
9:45
Small-scale Anisotropic Heterogeneity m the Continental Upper Mantle. Jordan, T.H., Saltzer, R.L., and Gaherty, J.B.*
Splitting and Relative Delays of Teleseismic Shear Waves in Northeastern U.S. Levin, V., Menke, W, and Park, J. *
Downward Continuation ofTeleseismic Wavefields and Anisotropic Lithospheric Stratigraphy at Stations of the Canadian National Seismograph Network. Bostock, M.G.
Seismic Reflection and Refraction Imaging of the Upper Mantle: Examples from Canada's Lithoprobe Project. Clowes, Ron M. with contributions from many other Lithoprobe seismologists.*
New Results on Upper Mantle Structure at Collision Zones from Seismic P to S Converted Waves. Kind, R., Yuan, X., Sobolev, S., Li, X., and Gossler, J. *
Inherited Structure and Mass Balance in the Archean and Proterozoic Lithosphere of Western North America: The 1995 Deep Probe Experiment. Levander, A., Henstock, T.J., Clowes, R.M., Gorman, A.R., Keller, G.R., and Snelson, C.M.*
10:00-10:30 BREAK
10:30 New Seismic Images of the Western U.S. from Crust to 660 km. Dueker, K.G. *
10:45 Teleseismic Investigation of the Yellowstone Swell: A Summary of Results. Humphreys, E.D., Dueker, K.G., Schutt, D.L., Saltzer, R.L., and Peng, X.*
11 :00 Evidence for a Mantle Plume in East Africa from the Tanzania Broadband Seismic Experiment. Nyblade, A.A., Langston, C.A., Owens, T.J., Gurrola, H., and Ritsema, J.*
11: 15 Seismic Structure and Tectonics of Southern Africa: Progress Report. Silver, P.G., Gao, S.S., and James, D.E.*
11 :30 The Upper Mantle beneath Australia: Results from the SKIPPY Seismometry Project. van der Hilst, Rob D., Simons, Frederik]., and Zielhuis, Alet.*
11 :45 Structure of the Lithosphere beneath the Siberian Shield. Priestley, K. and McKenzie, D.
Wednesday A.M., May 5, 1999-Lopez Room Advances in Seismic Wave Propagation Theory and Modeling II Presiding: Robert Odom and Margaret Hellweg
8:30
8:45
9:00
9:15
9:30
Generalized Screen Propagators and One-return Approximation for Seismic Wave Modeling and Imaging. Wu, R.S. *
Mixture Theories for Anisotropic Poroelasticity with Application to Estimating Effects of Partial Melt on Seismic Velocities. Berryman, J.G. and Berge, P.A.
Lattice BGK Method for Modeling Acoustic Wave Propagation in Strongly Heterogeneous Viscous Media. Huang, L.-J., Fehler, M.C., and He, X.
Polarization of Volcanic Tremor: Source or Medium? Hellweg, M. *
Spectral Mode Diffusion in Heterogeneous Media. Odom, R.I.
9:45 Seismic Waves Converted from Velocity Gradient Anomalies in Earth's Upper Mantle. Bostock, M.G.*
10:00-10:30 BREAK
10:30 Envelope Broadening of Outgoing Waves in Random Media: A Comparison between the Markov Approximation and 20 Numerical Simulations. Fehler, M.C., Sato, H., and Huang, L.-J.*
10:45 30 Elastic Wave Modeling of Air- and Water-filled Voids. Bartel, L.C., Aldridge, D.F., and Walck, M.C.
11 :00 The Effects of Near-source 30 Velocity Heterogeneity and Topography on Teleseismic Body Waveforms. Kang, D. and Langston, C.A.
206 Seismological Research Letters Volume 70, Number 2 March/April 1999

11: 15 Boundary Conditions for Free Surface Topography in Finite Difference Seismic Wave Modeling. Hestholm, S.O. and Ruud, B.O.
11 :30 Seismic Wave Field Modeling on Parallel Computers with the Generalized Fourier Method. Orrey, J.L. and Robinson, G.
11 :45 Crustal Complexity from Regional Waveform Tomography: Landers Aftershocks. Helmberger, D.V. and Song, X.J.
Wednesday A.M., May 5, 1999-Shaw Room Seismic Hazards and Seismic Risk Presiding: Roland Laforge and John Boatwright
8:30 On-site Test of an Earthquake Disaster Risk Index (EDRI) in the Caspian and Latin American Regions. Babb, Carmen, Trumbull, Sam, Khalturin, Vitaly, and Davidson, Rachel.
8:45
9:00
Seismic Hazard Mapping in Slovenia by Spatially Smoothed Seismicity Modeling and Seismic Source Zone Modeling. Lapajne, J.K., Zabukovec, B., Sket Motnikar, B., and Zupancic, P.
Seismotectonics and Seismic Hazard of Western Iberia. Fonseca, J.F.B.D. and Vilanova, S.P.
9: 15 Errors, Myths, Cover-ups, and Reality in Fatality Figures for Devastating Earthquakes in the Past. Khalturin, V.I.
9:30 Probabilistic Seismic Hazard Analysis for Carraizo and LaPlata Dams, Puerto Rico. Laforge, R. and McCann, WR.
9:45 Short-term Exciting, Long-term Correcting Models for Earthquake Catalogs. Schoenberg, F.R. and Bolt, B.
10:00-10:15 BREAK
10:15 Low Slip Rates versus High Erosion Rates:
10:30
Recognition and Characterization of Active Faults in a Tropical Environment. Fenton, C.H., Charusiri, P., and Hinthong, C.
The U.S. Geological Project Impact m Boatwright, John.
Survey Partnership with Oakland, California.
10:45 Holocene Uplift and Paleoseismology of the San Joaquin Hills, Orange County, California. Grant, L.B. and Ballenger, L.J.
11 :00 Slow Deformation and Implied Long Earthquake Recurrence Intervals from GPS Surveys across the New Madrid Seismic Zone. Newman, A., Stein, S., Weber, J., Engeln, J., Mao, A., and Dixon, T.
11: 15 Horizontal to Vertical Ground Motion Relations for Eastern Canada. Bent, A.L.
11 :30 Benefit of Local Seismic Monitoring for Hazard Assessment in Context ofinduced Seismicity. Bard, P.-Y., Grasso, J.-R., Koller, M., Lahaie, F., Volant, P., and Fourmaintraux, D.
11 :45 Improved Corrections for Epicentral Distance and Focal Depth for Use in the Estimation of mb Magnitudes. Murphy, J.R., Bennett, T.J., Barker, B.W, and Cook, R.W
Wednesday A.M.-Rainier Room Posters Earthquake Sources and Fault Mechanics: Observations and Insights III
Kl Finite Fault Inversion in the Wavelet Domain. Ji, C. and Wald, D.J.
K2
K3
K4
K5
K6
K7
KB
K9
KIO
Broadband Investigation of Recent Large Earthqukes in the Kamchatka Subduction Zone. Malagnini, L., Ammon, C.J., and Velasco, A.
Evidence for High-pressure Fluids in the San Andreas Fault Zone. Hardebeck, J.L. and Hauksson, E.
Hybrid LG + RG and LG + SN Data at Regional Distances: Implications for Source Spectra and Inferred Seismic Moments. Haddon, R.A.W, Adams, J., and Bungum, H.
Estimates of Rigidity Variations with Depth along the Seismogenic Zone Interface in Subduction Zones. Bilek, S.L. and Lay, T.
Source Features of Shallow Repeating Microearthquakes in the New Madrid Seismic Zone. Xie, J.
Seismic Swarms and Surface Deformation in the Hengill Area, SW Iceland. Arnadottir, T., Rognvaldsson, S., Agustsson, K., Stefansson, R., Hreinsdottir, S., Vogfjord, K., and Thorbergsson, G.
Fault Plane Solutions of the 1990 Romanian Earthquakes and the Regional Stress Pattern. Fan, G.-W. and Wallace, T.C.
Modeling of Observed Wave Propagation Changes in the San Andreas Fault Zone at Parkfield. Korneev, V.A., McEvilly, T.V, and Karageogy, E.D.
What Can Icequakes Tell Us about Earthquake Mechanics? Helmstetter, A., Grasso, J.-R., Baumont, D., Dietrich, M., Garambois, S., Guiguet, R., Hellman, R., Janod, F., Lahaie, F.,
Seismological Research Letters Volume 70, Number 2 March/April 1999 207

Kl 1
K12
Lambert, M.S., Martinod, J., Nair, J., Thomas, J.C., van-der-Baan, M., and Amitrano, D.
A Delineation of Depth-dependent Structure of the Landers Fault Zone Using Trapped Waves. Li, Y.G., Vidale, J.E., and Xu, F.
Self-healing Pulses, Friction, and Fault Geometry: How to Scale the Characteristic Lengths? Nielsen, S.B. and Carlson, J.M.
Wednesday A.M.-Rainier Room Posters Seismicity and Seismotectonics
L1
L2
L3
L4
LS
L6
L7
LS
L9
California North Coast Seismicity. Bakun, W.H.
Application of Bayesian Inference to the Association of Earthquakes and Faults in the San Francisco Bay Region. Wesson, R.L., Bakun, WH., Uhrhammer, R.A., Oppenheimer, D.H., and Perkins, D.M.
Automated High-accuracy Hypocentral Relocation for Large Seismicity Catalogues. Aster, R.C., Rowe, C., Phillips, WS., and Fehler, M.
Fluid Paths from Precise Microearthquake Locations at the Soultz Geothermal Site. Phillips, w.s. Seismotectonics and Crustal Velocities in the Imperial Valley, California. Magistrale, H.
Historical Seismicity of New Mexico-1869 through 1998. Sanford, AR., Lin, K.W, Jaksha, L.H., and Tsai, LC.
San Francisco Bay Region Historical Earthquake Relocation Project. Uhrhammer, R.A., Fink, J., and Ford, S.
Contributions of the Puerto Rico Seismic Network toward Seismic Hazard Assessment, Awareness, and Emergency Response. Von Hillebrandt-Andrade, C.G. and Huerfano, V.A.
Changes in the Southern California Earthquake Catalog Magnitudes. Hutton, K., Kanamori, H., Maechling, P., and Jones, L.
LIO
Ll 1
L12
L13
L14
Faulting within the Mountain Block South of Long Valley Caldera. Johnson, P.A.B. and Seeber, L.
Estimation of Crack Density and Saturation Rate in the Source Area of the 1994 Northridge Earthquake. Zhao, Dapeng.
A Seismotectonic Model for the Eastern Tennessee Seismic Zone Based upon Potential Field and Velocity Inversions. Vlahovic, G. and Powell, C.
Seismotectonics of the Northeastern United States from Regional Earthquake Monitoring. Ebel, J.E.
Seismotectonic Study of Kennedy Entrance, Southcentral Alaska. Velasquez, M. and Doser, D.I.
L1 S Historic Seismicity of the Prince William Sound, Alaska, Region (1928-1964). Doser, D.I. and Brown, WA.
Wednesday A.M.-Rainier Room Posters Structure
Ml
M2
M3
M4
MS
Sidescan Sonar and Seismic Reflection Data over the San Gregorio Fault between Pillar Point and Pescadero. Ross, S.L., Ryan, H.F., and Stevenson, A.J.
Fault Relations and Shallow Velocity Structure in the San Gorgonio Pass Region, Southern California, Using High-resolution Seismic Reflection and Refraction Imaging. Catchings, R.D., Rymer, M.J., Goldman, M.R., Gandhok, G., and Horta, E.
Poisson's Ratio Variations of the Crust beneath North America. Ligorria, J.P. and Ammon, C.J.
Upper-crustal Structure in the Mississippi Embayment and Adjacent Areas from Teleseismic Receiver Analysis. Akinci, Aybige, Herrmann, Robert B., and Ammon, Charles J.
Attenuative Body-wave Dispersion along the North Anatolian Fault Zone of Turkey and in Southern Germany. Akinci, Aybige and Mitchell, Brian J.
208 Seismological Research Letters Volume 70, Number 2 March/April 1999
SSA-99 94th Annual Meeting
Meeting Abstracts These abstracts are listed in the order they appear in the program.
Monday A.M., May 3, 1999-0lympic Room Pacific Northwest Earthquake Hazards and Tectonics I Presiding: Michael Fisher and Roy Hyndman
Review of Instrumentally Observed Seismicity with Tectonic Implications for the Central Cascadia Subduction Zone CROSSON, R.S., University of Washington, Geophysics Program, Box 351650, Seattle, WA 98195-1650, [email protected] and ROGERS, G.C., Geological Survey of Canada, Pacific Geoscience Centre, P.O. Box 6000, Sidney, B.C. Canada V8L 4B2, [email protected].
Approximately 30 years of modern instrumental observations in the Pacific Northwest and British Columbia provide an important, if incomplete, picrure of ~mall to large siz': earthquake activity in the central Cascadia region. We review these observations from the viewpoint of the constraint that they provide on the development of tectonic and earthquake hazard models for the region. Seismic activity in the forearc region is clearly separated into intraslab and intracruscal zones with little or no contemporary activity directly on the Cascad1a megachrust. Slab activity extends to depths of approximately 70 km, and focal mechanisms of slab earthquakes suggest complex stress in the slab distinct fro~. the stress pattern in the overlying continental crust. Although seismic act!Vlty m the forearc crustal "block" is highly non-uniform, focal mechanisms of crustal earthquakes are generally consistent with margin parallel compressive stress in the Cascadia forearc. Moderate to large-magnitude intraslab earthquakes have been observed from Washington to British Columbia along the Puget Sound-Strait of Georgia forearc axis at depths of 40-60 km. Moderate sized crustal earthquakes tend to cluster along the Cascade front in Washington and n~rthern ,Oregon, bm appe,ar more varied in British Columbia suggesting a tectomc transmon associated with the arc bend, Small crustal earthquake activity shows a major clustering in the Central Puget lowland to depths of about 30-35 km, with irregular clustering elsewhere in both the forearc and backarc regions. The Mount Saint Helens zone appears to be one of the clearest examples of a crustal strike-slip fault zone, but clear surface geologic evidence of faulting is obscure. In other localities, crustal earthquake activity in general is not easily associated with known or suspected crustal faults such as the Seattle fault, the south Whidbey Island fault, and the Leech River fault on Vancouver Island. This lack of correlation is not the result of significant location error.
Micro plate Motions and Neotectonics of the Cascadia Forearc WELLS, Ray E., USGS, MS 975, 345 Middlefield Road, Menlo Park, CA 94025, WEAVER, C.S., USGS at Univ. of Washington, Seattle, WA 98195, and BLAKELY, R.J., USGS, MS 989, 345 Middlefield Road, Menlo Park, CA 94025; [email protected], [email protected], [email protected]
North ro northwest motion of a forearc microplate at 4-11 mm/yr with respect to North America probably affects deformation rates and seismicity along the Cascadia convergent margin. Clockwise rotation of an Oregon Coast microplate about a pole in E. Washington can accommodate the difference in VLBI crustal motions between a relatively fixed Canadian buttress (Penticton, BC) and the Sierra Nevada microplate moving northwest at 11 mm/yr.
Forearc velocities calculated from the pole vary along the Cascadia margin but are consistent with along-strike changes in Quaternary faulting, volcanism, and current seismicity. In SW Oregon, the forearc moves 11 mm/yr N 70° W away from the Cascade arc graben toward Cape Blanco, thus increasing the convergence rate. Near Portland (closer to the rotation pole), velocities are subpar-
~Ile! to the right-lateral Mt. St. Helens seismic zone (4 mm/yr, N 19° W) and mcrease westward to 6.6 mm/yr at Astoria, North-south compression, earthquakes, and active thrust faulting in the northern forearc result from northward movement of the Oregon Coast micro plate toward the Canadian Coast Mountains .res-training bend, Shortening across the active, E-W-trending Seattle fault and s1m1lar faults m the northern forearc could total 4-6 mm/yr, if the northern buttress is fixed and no shortening takes place in the seismically quiet southern Oregon Coast Ranges.
Although uncertainties are large, subtracting the long-term plate velocities from, fo,re~rc GPS velociti,es results in a consistent east-directed velocity field that ts s1m1lar to that predicted by an elastic dislocation model for deformation above the locked subduction zone.
Stresses in and around the Cascadia Subduction Zone WANG, K., Pacific Geoscience Centre, Geological Survey of Canada, Sidney, B.C.,[email protected]
Stresses in and around the Cascadia subduction zone have been inferred from earthquake focal mechanism solutions, in situ stress measurements, and neotect~nic geological struct~res. In the Juan de Puca plate, the maximum compressive stress (S 1) 1s oblique offshore Washington and Oregon and becomes margin-parallel and increasingly compressive in the Gorda region, In the continental forearc, S 1 is margin-parallel, and stress in the direction of plate convergence is no greater than lithostatic. Margin-normal S 1 prevails only in the fron~al part of the accretionary prism, The interaction of the two obliquely converging plates and their interaction with the mantle influence stress patterns in both places. For the JDF plate, the most important roles are played by a compressional force normal to the Mendocino transform fault, a result of the northward push by the Pacific plate, and a horizontal resistance operating against the northward component of oblique subduction. The stress regime of the continental forearc can be characterized as that of a buttressed sliver. Shear along the Casc.ades defines a forearc sliver, which is driven to move north by oblique subduction and by crustal blocks at its trailing edge, The sliver is buttressed at its leading edge in the Puget Sound-Vancouver Island area, resulting in marginparallel com,press1on, On the other hand, the margin-normal force due to plate couplmg ts JUSt enough to keep the forearc from collapsing seaward under its own weight, Low frictional heating on the subduction fault, focal mechanisms of crustal earthquakes, and the difference between the JDF and NA stress regimes, all indicate that the static shear stress on the subduction fault is low (of the order of 10-20 MPa). A weak subduction fault that is frictionally coupled at very shallow depths, in conjunction with the gravitational force, causes the margin-normal compression to be low in the continental crust but high in the accretionary prism. Great thrust earthquakes occur under very low shear stresses. Geodetically observed contemporary crustal contraction in the direction of plate convergence reflects .an increase in elastic stress due to the locking of the subduction fault, a transient small perturbation to the forearc stress regime. Stress Ructions in subduction earthquake cycles have a small magnitude because. of the weakness of the subduction fault, bur they occur relatively fast, giving nse to large scram rates. The forearc stresses and their variations in earthquake cycles are similar to those of the Nankai forearc, Southwest Japan,
Measurement and Interpretation of Contemporary Crustal Strain along the Cascadia Margin DRAGERT, H., Pacific Geoscience Centre, Geological Survey of Canada, Sidney, B.C., V8L 4B2, [email protected]; QAMAR, A., Geophysics Program, University of Washington, Seattle, WA 98195-1650, [email protected],edu; McCAFFREY, R., Dept. of Earth and Environmental Sciences, Rensselaer Polytechnic Institute, Troy, NY 12180-
Seismological Research Letters Volume 70, Number 2 March/April 1999 209

3590, [email protected]; GOLDFINGER, C., College of Oceanic and Atmospheric Sciences, Oregon State University, Corvallis, OR 97331, [email protected]; MILLER, M., Dept. of Geology, Central Washington University, Ellensburg, WA 98926, [email protected].
Beginning with tide gauge monitoring, precise gravity measurements, and leveling and trilateration surveys, geodetic techniques have been used along che coastal margin of the Cascadia Subduction Zone for more than 30 years in an effort to measure present-day crustal motions in chis active seismic region. The objectives of such measurements are to provide a better understanding of regional tectonics and to augment the limited seismic and paleoseismic information on strain rates associated with damaging earthquakes. Results from these earlier surveys, that focused more on vertical deformation, provided somewhat sparse but consistent evidence for the existence of a locked subduction thrust fault underlying the continental slope from northern California to central Vancouver Island. The routine availability of extremely precise GPS orbits since circa 1992/93 revolutionized the monitoring of crustal motions on a global scale because it allowed relative horizontal positioning at the level of a few millimeters over distances of hundreds of kilometers. As elsewhere, chis new technology is being exploited in the Pacific Northwest through the establishment of continuous GPS tracking networks as well as GPS campaigns repeated over more densely spaced sites at intervals of several years. Results from the most recent GPS measurements have provided more precise and more comprehensive estimates of crustal motions that not only confirm the presence of the locked subduction zone but also indicate spatial variations in strain rates that are not explained by current elastic slip-dislocation models. These newly resolved motions may provide key information addressing the north-south compression inferred from crustal seismicity, the motions and deformation of crustal blocks in the forearc, the variability of plate coupling along the strike of the subduction zone, the partitioning of strain across the margin of chis oblique convergem zone, and the possible cemporal nature of the accumulating strain.
Seismic Tomography in the Pacific Northwest and Its Interpretation; Relationship between Crustal Structure and the Distribution of Crustal Seismicity SYMONS, N.P. (Sandia National Laboratories, Albuquerque, NM); MORAN, S.C. (USGS, Alaska Volcano Observatory, Anchorage, AK); CROSSON, R.S.; CREAGER, K.C. (University of Washington, Seattle, WA); FISHER, MA (USGS, Menlo Park. CA)
The existence oflarge seismic datasets, such as the one maintained by the Pacific Northwest Seismograph Network (PNSN) in Washington and Oregon, in combination with new sources of data, such as the Seismic Hazards in the Puget Sound (SHIPS) experiment, is making possible rhe inversion of high resolution 3-D tomographic velocity models in the Pacific Northwest. In several locations a correlation exists between the crustal structure derived from interpretations of seismic velocity models and the distribution of crustal seismicicy. In the greater Mount Rainier area, tomographic models derived using local earthquake data from the PNSN indicate low P-wave velocities, possibly related to Tertiary sedimentary rocks in che Morton anticline, that correlate with the St. Helens seismic zone. In the Puget Sound region, models derived using a combination of data from the PNSN and approximately 1000 travel-times of first arriving Pwaves from SHIPS recorded at PNSN stations have increased resolution in the upper 20 km. This model shows improved resolution of the low velocity core rocks of the Olympic Mountains, as well as the contacts between the core rocks with the subducting Juan de Fuca plate at a depth of -20 km and the core rocks and the Crescent Formation. This latter contact coincides with the western edge of extensive seismicity in the Puget Lowland. The geometry of the contact suggests that the western edge of the Crescent Formation is warped upward over the accretionary prism. Based on this geometry we suggest a simple mechanical model that explains boch the control of this contact over crustal seismicity and the predominant direction of maximum stress exhibited by crustal earthqualres in this region.
Sandia is a multiprogram laboratory operated by Sandia Corporation, a Lockheed Martin Company, for the United States Department of Energy under Contract DE-AC04-94AL85000.
Structure of the Cascadia Subduction Zone from Seismic Reflection and Refraction Data: Relation to Seismic Activity TREHU, A.M. (Oregon State Un., Corvallis, OR, 97330; [email protected]); BROCHER, T.M., CLARKE, S., FISHER, M.A., PARSONS, T. (USGS, 345 Middlefield Rd., Menlo Park, CA); HYNDMAN, R. (Geo!. Survey of Canada, Sydney, BC, Canada), CLOWES, R. (Un. of
British Columbia, Vancouver, BC, Canada), FLUEH, E., GERDOM, M. (GEOMAR, Keil, Germany); GULICK, S., MELTZER, A. (Lehigh Un., Bethlehem, PA), BEAUDOIN, B. (PASSCAL, New Mexico Tech, Sicorro, NM), MILLER, K. (Un. ofTexas, El Paso, TX), PRATT, T. (USGS); SPENCE, G. (Un. ofVictoria. Victoria. BC. Canada): TEN BRINK, U.S. (USGS. Woods Hole,MA)
The Cascadia subduction zone is characterized by a very heterogeneous distribution of earthquakes in both the upper (North America) and lower (Juan de Fuca) plates and by a conspicuous lack of historic seismic activity on the plate boundary. Upper and lower plate seismicity is concentrated near the two ends of the subduction zone, beneath Puget Sound and beneath northern California. During the past 15 years, there have been a series of controlled source seismic experiments that now form a nearly connected nerwork of transects for imaging the velocity and reflectivity strucrure of the subduction zone. The objective of this talk is to synthesize the results from these various experiments to construct a 3-D model of the geometry of the subducting plate and of crustal blocks within the geologically heterogeneous upper plate. In the upper plate, the presence of the early-Eocene age accreted Siletz/Crescenc terrane appears to modulate the regional heterogeneity in stress resulting from plate geometry (Wang, this session) to control the distribution of seismicity. In the lower plate, plate geometry may also generate stress concentrations at the extremities of the subduction zone, because the small, thin Juan de Fuca plate is caught between the much larger and thicker North American and Pacific plates and must. However, variations in upper plate structure may also influence the thermal state of the lower plate and, consequently, the interplate coupling and internal plate deformation. Seismic activity and plate coupling may also be affected by the presence of buried ridges and/or seamounts on the subducring place.
Urban Earthquake Hazards of the Puget Sound Region, Initial Findings from the "\998 SHIPS Experiment FISHER, M.A., PARSONS, T., BROCHER, T.M. (U.S. Geological Survey, 345 Middlefield Rd., Menlo Park, CA 94025; email [email protected]); HYNDMAN, R.D. (Geological Survey of Canada, Pacific Geoscience Centre, Sidney, BC, Canada, V8L 4B2); TREHU, A.M. (Oregon State Univ., Corvallis, OR 97331); CREAGER, K.C., CROSSON, R.S., SYMONS, N.P. (PO Box 351650, Univ. of Washington, Seattle, WA 98195); PRATT, T.L., WEAVER, C.S. (U.S. Geological Survey, PO Box 351650, Univ. ofWashington, Seattle, WA 98195); TEN BRINK, U.S. (U.S. Geological Survey, Woods Hole, MA, 02543)
In March 1998 the SHIPS (Seismic Hazards Investigation in Puget Sound) consortium collected seismic data through large populated areas that overlie the Cascadia subduction zone. Early findings presented here and elsewhere in this session are based on marine seismic reflection dara and on wide-angle seismic data obtained from recording airgun shots with several hundred onshore and seabottom recorders.
Reflection and wide-angle seismic data from the Strait of Juan de Fuca show that strong midcrustal reflectors dip east. Below rhe eastern part of this strait, the dip of the reflecrors increases, and they extend downward to depths of 50-60 km. These reflections probably correlate with similar ones evident in Lithoprobe seismic data collected across southern Vancouver Island.
Wide-angle data from along the western side of the Puget Lowland indicate that shallow, high-velocities, which probably indicate volcanic rocks of the Crescent Formation, overlie low velocities, which probably reveal accreted sedimentary rocks like those that form the core of the Olympic Mountains. The sedimentary rocks ex,end downward to a depth of about 25 km. The velocity contact between shallow volcanic and deep sedimentary rocks appears to coincide with the western limit of the upper-crustal seismicity in the Puget Sound region.
Seismic reflection data show that the Seattle fault dips south at a low angle; the hanging wall of this fault overrides fill in the Seattle basin. Tomographic modeling indicates that beneath Puget Sound chis basin is 9 km deep, and the basin deepens to the ease to as much as 10 km.
Preliminary tomographic inversions of wide-angle seismic data from the Tacoma, Seattle, and Everett Basins all indicate that seismic velocity in the basin fill is lower than previously estimated.
Prehistoric Earthquakes at Cascadia ATWATER, Brian F., and SHERROD, Brian L., USGS at Univ. of Washington, Seattle, WA 98195-1310, [email protected], [email protected]; NELSON, Alan R., and BUCKNAM, R.C., USGS, MS 966, Box 25046, Denver, CO 80225, [email protected],
210 Seismological Research Letters Volume 70, Number 2 March/April 1999
[email protected]; PRINGLE, Patrick T., Wash. Div. of Geology, Olympia WA [email protected]; BOUGHNER, Judith A., EvansHamilton, Inc., 4608 Union Bay Place N.E., Seattle, WA 98105, [email protected]
Earthquakes in Cascadia's recenr geologic past imply hazards greater than those known from 200 years of written history.
** An earthquake ruptured much of the length of the Cascadia subduction zone in A.D. 1700. Large uncertainty remains about the size of this event, the amounts of subsidence and shaking that it caused, and the extent of its tsunami.
** The 1700 earthquake is the most recent of seven great earthquakes that struck southwestern Washington in the past 3500 years. These earthquakes are too few and their recurrence intervals too irregular to pinpoint the conditional probability of the next great earthquake in the area.
** Great-earthquake records elsewhere at Cascadia similarly suggest irregular recurrence intervals averaging roughly 500 years. One of the longest of these records, from a lake in southern Oregon, spans 7000 years.
** A lot happened in western Washington about 1100 years ago. Between 900 and 930 A.D., an earthquake on the Seattle fault caused seven meters of uplift between Seattle and Bremerton, landslides into Lake Washington, and a tsunami in Puget Sound. Within a century or two of this event, additional uplift and a tsunami took place northwest of Tacoma, land subsided and sand liquefied near Olympia, faults broke to the surface and rockslides dammed streams in the eastern Olympic Mountains, Mount Rainier erupted explosively and its volcanic sand clogged Seattle's Duwamish River, sandy water erupted from more than 3 5 m depth near Copalis Beach, and the Pacific coast subsided at Neah Bay, Grays Harbor, Willapa Bay, and the lower Columbia River.
Geophysical Modeling of Cascadia Great Earthquakes HYNDMAN, R.D., Pacific Geoscience Centre, Geological Survey of Canada, Sidney, B.C., V8L 4B2, [email protected]
Information on Cascadia great subduction earthquakes comes mainly from: ( I) paleoseismicity evidence of past events and, (2) measurements and modelling of elastic strain build-up. This paper summarizes constraints to the portion of the subduction thrust fault that is locked and can rupture in future earthquakes. The downdip limit, important for hazard as the landward extent of the seismic source zone, may be estimated from modelling current deformation data. If the subduction thrust fault is locked, ongoing plate convergence results in the toe of the continent being dragged down and flexural uplift further inland, along with elastic shortening in the direction of plate motion. The abrupt collapse of the uplift (near the coast for most of Cascadia) in great earthquakes gives the subsidence inferred from buried coastal marshes. The long-term net deformation appears to be small so the cycle is nearly elastic. The wider the locked zone, the further landward are the flexural uplift and extent of horizontal shortening. The model constraint initially was from repeated precision levelling and tide gauges (and some microgravity and trilateration). Expanding networks of continuous and repeated GPS stations are now providing a more secure constraint. To a first order, the observed deformation can be explained by elastic dislocation models for a locked subduction thrust fault. The locked zone is mainly offshore (50 km wide locked with a 50 km wide transition zone) for Oregon and S. British Columbia, widening in northern Washington (JOO km and 100 km). The model coastal coseismic subsidences are in slightly larger but in general agreement with the marsh data for the last great earthquake in 1700. Thermal modelling indicates that the locked zone extends to where the thrust is 350C with a transition to free slip above 450C, in agreement with laboratory data for the maximum temperature of earthquake behaviour. The new high precision GPS data are starting ro resolve important second order effects that may reflect nonelastic components of the great earthquake cycle, long-term margin deformation and motion of crustal blocks in the forearc.
EVALUATING THE SEISMIC HAZARD OF THE PACIFIC NORTHWEST FRANKEL A.D., LEYENDECKER, E.V., U.S. Geological Survey, MS 966, Box 25046, DFC, Denver, CO 80225, [email protected]; WEA VER, C.S., USGS, Seattle, WA; and HARMSEN, S.C., USGS, Denver, CO Two principal sets of products for seismic-hazard mitigation are probabilistic seismichazard maps and synthetic time histories of strong ground motions for scenario large earthquakes. To construct seismic-hazard maps for the Pacific Northwest, it is necessary to specify the expected locations, magnitudes, and recurrence rates of 1) great eanhquakes on the Cascadia subduction zone, 2) large intermediate-depth earthquakes within the subducted Juan de Fuca plate, and 3) large shallow earthquakes on crustal faults. Seismic hazard maps for the region have been produced by the USGS and for Oregon by Geomatrix. Logic trees provide a means to include alternative models for the magnitude. recurrence rate, and rupture location of great subduction zone earthquakes. Although large intermediate-depth earthquakes in 1949 and 1965 caused substantial damage to Olympia, Tacoma, and Seattle, it is not clear how to constrain the recurrence rate of such events in the slab under southwest Washington and western Oregon. which historically has not produced known large events. Evaluating the hazard from crustal faults is impeded by the lack of a comprehensive inventory of Quaternary faults in the region. Recent aeromagnetic studies have highlighted the locations of many crustal faults in the Puget Lowland and the Portland area. For Seattle, a key question remains the recurrence rate for large earthquakes on the Seattle fault. Efforts are underway to make seismic hazard maps including site response for Seattle (Frankel et al., 1998; Wong et al., 1998) and Portland (Wong et al., 1998). Some studies have determined the site responses for the Seattle and Portland areas based on surficial geology and shear-wave velocity measurements from boreholes and seismic exploration methods. Arrays of digital seismographs in Seattle and Portland have recorded important recent earthquakes and these recordings have been used in Seattle to characterize site response. There has been progress in producing time histories for scenario large events (e.g., Silva et al., 1998). Recent work has focussed on understanding the effects of the three-dimensional structure of the Seattle basin on strong ground motions.
Monday A.M., May 3, 1999-Shaw Room CTBT Research and Its Role in Earthquake Studies I Presiding: Terry Wallace and Mark Tinker
Survey of Current Topics in Test Ban Monitoring Research BLANDFORD, R.R., Air Force Technical Applications Center, Center for Monitoring Research, Arlington, VA 22209, [email protected]
Major areas of research in CTBT monitoring include source mechanisms, detection, association, location, discrimination, and yield estimation. Recent advances in explosion source theory include improved understanding of the fractured zone, and the intermediate strain zone, around the explosioin. Requirements for infrasound detection have revived interest in array correlation detectors, in their relation to power detecrors, and in the relation between signal correlation and array design. Automatic detection of Rayleigh waves for Ms has recently been greatly advanced, in part due to detailed mapping of 20--40 second crustal velocitys. Substantial work has also gone into techniques for rejecting false alarms due to data faults and local noise. Association techniques have moved from generating trial epicenters from combinations of arrivals, to generating all possible epicenters on a space-time grid. Location research is improving location accuracy by using ray tracing through 3-D structures, melding of regional 1-D structures, and gridding of residuals from calibration events. Discrimination of different types of mining events by analysis of the moment tensor at a very few stations has seen great advances; and work continues on regionalization of discrimination using high frequency regional phases, and on the reasons why these discriminants appear to work. Yield estimation theory has profited greatly from the release of data on the FSU PNE events, and from the recent US-Kazakhastan depth-of-burial experiment.
On the PIDC/USGS mb Discrepancy DEWEY, T.W., U.S. Geological Survey, MS 966, Federal Center, Denver, CO 80225, [email protected].
Short-period P-wave magnitudes (mb) computed by the Prototype International Data Center (PIDC) differ systematically from the mb computed by the National Earthquake Information Center of the U.S. Geological Survey (USGS). Some of the discrepancy is attributable to different magnitude formulas used at the two agencies, bur most arises from differences in the data that are independent of the magnirude formulas. The mb-formula-independent bias is about 0.3 magnitude units in the magnitude range (USGS mb) 4.5 to 5.0. The bias is slightly larger at and above mb (USGS) about 5.5 and decreases or even changes sign with decreasing magnirude below mb (USGS) about 4.5.
The mb-formula-independent component of the PIDC/USGS mb discrepancy arises from several sources. Differences in procedures used at the PIDC
Seismological Research Letters Volume 70, Number 2 March/April 1999 211

and the USGS to obtain short-period amplitudes and periods from digital data account for about .05 magnitude units of the discrepancy at all magnitudes and also account for the discrepancy being slightly larger at higher magnitudes. Much of the decrease in the discrepancy at low magnitudes may be due to 1 ricnrnrlt:'rF" qmplirig nf' ,tarinn,:; and event,;; :H low magnitudes. Bias from amplitude/period data that are read outside of the USGS and contributed to the USGS does not appear to contribute significantly to the mb discrepancy. The PIDC's extensive reliance on data from seismic arrays accounts for a small but uncertain amount (.05 to .10 magnitude units) of the discrepancy. To ace ount for much of the remaining 0.15 to 0.2 units of the mb discrepancy, it seems necessary to hypothesize systematic differences in site amplification or regional attenuation for the stations that contribute data to the PIDC and USGS, respectively.
Use of Regional Distance Seismic Moment Tensors to Discriminate Nuclear Explosions? DREGER, D., University of California, Berkeley, CA, 94720, [email protected], WOODS, B., Woodward-Clyde Federal Services, Pasadena, CA, 91101 [email protected]
We examine the performance of routine, regional distance, moment tensor methods in the discrimination of Nevada Test Site (NTS) nuclear explosions from earthquakes. Isotropic component restrained and unrestrained moment tensor inversions are performed on a reference earthquake and five nuclear explosions, namely the Barnwell, Bexar, Bullion, Dalhart and Junction tests. These events have ML greater than or equal to 5.5 (Mw greater than or equal to 4.4), good signal-to-noise levels, and represent a range of tectonic release. We confirm that the inversion of low frequency data for regionally recorded earrhquakes is insensitive to the velocity model used, results in solutions that are dominated by double-couple components, and that as few as a single station is sufficient to determine the source parameters. To examine the possible isotropic nature of a nuclear explosion requires the use of more than one station to sample the focal sphere. Our results show that this can be as few as two stations provided that the paths are well calibrated and the azimuthal aperture of the stations is sufficient to resolve the double-couple nature of a seismic source. The explosions that we analyzed are characterized as having anomalously shallow source depth and radiation patterns compared to earthquakes. Based on these observations it appears that it is possible to discriminate or at least identify nuclear explosions as suspect events using standard, regional distance, moment tensor methods.
Empirical Scaling Relations for Contained Single-fired Chemical Explosions and Delay-fired Mining Explosions at Regional Distances STUMP, B.W., Geophysical Laboratory, Southern Methodist University, Dallas, TX 75275-0395, USA, [email protected], PEARSON, D.C., Seismic Research Center, Los Alamos National Laboratory, Los Alamos, NM 87544, USA, [email protected], HSU, V., HQAFTAC/TTR, Patrick AFB, FL, 32925-3002, USA, [email protected]
Mining explosions are typically composed of numerous individual explosions that are detonated in a complex spatial and temporal pattern. For purposes of monitoring the Comprehensive Nuclear Test Ban Treaty (CTBT), the signals from delay-fired mining explosions must be distinguished from those of a possible nuclear explosion. A series of experiments were designed to quantify similarities and differences between contained, single-fired chemical explosions and delay-fired mining explosions. The single-fired shots ranged in size from 5500 lb. to 50000 lb. The spatial separation of the individual explosions ranged from approximately 100 m to nearly 4 km. Seismograms from the single-fired explosions were recorded within the mine as well as at the IMS regional array, PDAR (-360 km). Peak amplitudes for Pg, Pn and Lg phases at PDAR increased linearly with yield of the single-fired explosions. In contrast, peak amplitude measurements from production coal and cast shots in the same mine show no trend of ~eak amplitude with explosive weight. Correlation analysis was applied to the re?1onal data to investigate the importance of source location to the regional se1smograms. For two explosions separated by 100 m, coherency was strong to
16 Hz, the bandwidth of the regional data. Regional waveforms from two, single-fired explosions separated by nearly 4 km lost coherency at frequencies above 1 Hz. Source related coherency estimates were made using single elements of PDAR. Receiver effects were quantified by comparing coherency acr?ss the_ array elements for single events and were found to degrade even more rapidly with frequency than the source related effects. These observations suggest _limited applicability of coherency for identifying events from a single mine 1f It 1s large. Restricting the analysis bandwidth may prove to be useful.
SEISMIC Dl~CRIMINATION OF RECENT INDIAN AND PAKISTANI NUCLEAR TESTS WITH SHORT-PERIOD AMPLITUDE RATIOS l~DGER_~_.~. I\'. WALTER. A. SICHERMAN and W. HANLEY L1\\'rc•11cc Livermon.· Na11omll l.:ihoratory. 1.-:!.ll'.'. l.iv~1111oi\~ CA 9455I. rodgcr~7((1 !lnLgO\
Th...: j\_:..:..,:;:\ _:,~ ... ;l,\O"_. >l' '.' ... ~.<: .. ~, ···,;.:'..::-i ..... ,,:·: ,,L,\.. ,.1'.;b1,i::<11; j~):
11.'sl.ing short-pcntld sc1~m1c discrimination strategies. Wc mcasu1Ld :1111pli1udcs of r~gH~na/ ~md ~1pp~·r 1t1.1.1~l~ ph.;1scs for _ihc tc:-;Js and rnany carthqu;ik~:-. reconkd. :11 st:il1ons NIL (Ndoit:. f .1k1sr.1_11) Lrnd AAK (Ala Archa. Kyrgyzstan). I-or the lnd1:111 test recorded at f'!ll.. pha:--c ~·atios :such ;1s Pn/Lg and Pn/Sn show promise of discrnrnnation CVL'll ~11 rc\at1vcly lo\\' 1rcquL'lll.'h:'s (0.5-:Z H:1). This observation differs from prL,·ious r~S\.ilts whJCh report 1~o~n S('p;trallon of L'Jrthquakes and explosJ(Jn:-. at lmvcr frL·qucn<.:1cs and helter scpa1at1on :ll hi~hcr frequencies. Spectral and <.:ross-spec1r~1l ratios s.hmv a strnn!! distance ;~nd rn~ignnudc dependence that arises from sourCL' .._ 1:IL'-corner 1rcqui..!~1cy scal11.1g. and dtffL'rt'ntral .i11enuatio11. \Ve developed a simpk proccdurL' for modeling thL' d1:.tance ,ind m;1gn11udc dependence of spectral nuicb and applied it 10 ti!.: ~ll.:- da.ta. l~csults sl.10"· that the distance and magnitude corrections irnpron· the d1scn!11mal1_l~n ol lhc l11d.1an test for the spectral an~ cross-spectral ratio data. Path propaga~1011 c1kcts on rcg1onal phases (e.g. attenuatIOn and crust.-11 \\'a\'C!!llllk heterogeneity) result in latcr~I va~·1a1ions of discriminants beyond simple dis-tancc trends We show. that accountmg 101 palh effects with Bayesian kri!.1,in!.! can s1cnificantlv improve d1scriminalion perfom1ancc. These correction procedu;es -lead to ;norc nm:rna~ly dis1ributcd discriminants for inpul into multivariate discrimination algorithms wlrn.:h we arc usmg. to furthL't analyze the NIL data. The Indian and Pakistani test, '.1!1d adjacent ca11hqu,~kcs \~'er.: recorded at upper mantle distances ,11 s1~1tion AAK I hesc t~sts ?o not d1scrim111a1L· well_ from. nearby earthquake~ whc.:n ,m1plitwks ~ll'L:
measured usmg standard procedures tor regional data (.6<1500 km). At these di:-.rnncl's P ~nd S bmly-wa~,c an:1va1.~ an~ composed o.f 111terfering upper mantk tnplication
;~~·:1
1~/~~\iis~;
1~ct;~rn1~~:l:st1gat111~ \\ratcgics for improving discrimin:11mn in the- upper
/fr.11'11rd1 l\'11\ 1wrfom1,:l 1111der tht· 1111,pic('.\ of 1/11' l 'S Dep,11 (//1('/1( or Dw1g1 /11· //1(' / (/\I n·111, / 11·n.
111,11,• .\'1111011,il !.11hnr11tnn ll//(l1•r, 0111r,1( 1 /f'-7401-1:\1( ;_4s
Path Calibration and Source Characterization in and around India SAIKIA. C.K. and B.B. WOODS, URS Greiner Woodward Clyde, 566 El Dorado Street, Pasadena, CA 91101, USA, e-mail: [email protected]
Regional path calibration of seismic phases is primarily dependent upon the accuracy of hypocentral locations of seismic events. In general, accurate locations and identification of seismic events based on travel time studies require several stations surrounding each event, which is often difficult to achieve especially for events of magnitude Mw 4 or less. Such small earthquakes are plentiful in the Indian sub-continent including its neighboring countries, thus rendering seismic monitoring of the region difficult. To help overcome this difficulty, we developed a regional seismic event location approach using only two broadband stations, which we have successfully applied for locating in the Hindu-Kush region down to Mw 4 using regional seismograms from NIL in Pakistan and AAK in Kyrgyzstan. To apply this method requires path calibration along specific path in regions of interest. To this end, we have developed models for crustal structure which can produce remarkable agreement for events recorded at Hyderabad (HYB) to distance of 120. The model consists of two sub-crustal layers with a Pn velocity of 8.2 km/sec. This model produces detail features recorded in regional waveforms from events occurring in the Pokhran test site, central India and Koyna regions. We have also developed a velocity profile from the NW India to NIL using regional waveforms recorded at HYB and NIL from an earthquake that occurred near the Pokhran test site on April 4, 1995. This event occurred at a depth of 15 km, shallower than the reported 18.7 and 21 km depths in the REB and PDE bulletins respectively. This estimated depth is consistent with depth phases recorded at teleseismic stations. Focal mechanism and event depth are also consistent with the regional seismograms recorded at stations HYB and NIL. This preliminary crustal model from the NW India to NIL consists of four sub-crustal layers; the upper most layer has a thickness of 7 km with velocity relatively lower than the Indian shield region. It also includes a gradient in the upper mantle which helps to account for the strong Pn waves recorded at NIL. The model produces travel times for P, S, Rayleigh and Love waves, including the dispersion recorded in the Rayleigh waves. This model is then used to synthesize explosion seismograms for estimating yield.
We also determined focal mechanism and analyzed the consistency of crustal structure for regional seismograms at LSA in China, recorded from earthquakes in northeast India occurring north of one of the world's largest river valley, namely the Brahmaputra river valley. Plenty of small and large earthquakes occur in the subducting Indian Plate along the Burmese arc and in the south of this river valley. Seismograms from these events at LSA are complicated as they traverse through the large river basin of the region and adjoining mountains. Knowing better locations and depths of large earthquakes from this area can be useful as they can later be used to calibrate upper-mantle paths towards the NW India and Pakistan. In general, we found that depth of the events are shallower than the depths reported in the monthly PDE/lSC bulletins and the CMT solutions are not necessarily optimal.
We have analyzed the short-period:long-period (SP:LP) and short-period P:S (SP-P:S) energy ratios, duration of the Lg wave complexity and Pnl wave complexity, using regional broadband seismograms recorded at station NIL.
212 Seismological Research Letters Volume 70, Number 2 March/April 1999

The first two measurements were cross-checked against our previous data points of similar measurements for earthquakes around NIL including explosions from the Chinese Lop Nor test site which were recorded at NIL. Boch energy ratio measurements for the explosions remain higher than the earthquakes, thus readily distinguishing the recent Indian explosion from earthquakes. The Pnl complexity is a recencly developed discriminant based on the shore-period velocity envelopes, and is found to have considerable potential for characterizing source type. The Indian explosion is rich in P waves and the initial portion (the first 5 second of the window) of the record has a distinctly different appearance from the shallow earthquake.
Accuracy of Teleseismic Records Numerical Modeling with T* Parameter Fitting. Application to the 11 May 1998 Nuclear Indian Tests RODRIGUES, 0., Commissariat a l'Energie Atomique, Laboratoire de Detection et de Geophysique, BP 12, 91680 Bruyeres-le-Chacel, FRANCE, rodrigues@dase. bruyeres.cea. fr
Since the 11 May 1998 Indian nuclear tests have been conducted in the Pokaran site, a controversy about the energy which could have been released remains between Indian and U.S. seismologists. Indian scientists state a global yield, including the three tests, of at least 55 kt, while U.S. teams provide a 10 to 25 kc range for the same event.
In order to obtain new insights on these tests, I propose to use numerical modeling of telesismic records. Computations are done with a high order, in time and space, finite differences code for axisymmetric media. A simple stratification of the local test site geology is taken into account and the main yield is supposed to be located at 400 meters depth, in hard rock, on the basis of P-pP time delay observed on seismograms. Data which are used to validate numerical modeling are issued from the french seismic network, whose mean distance to indian test site is 56 deg. To obtain teleseismic synthetics, dose-source seismograms are convolved with an attenuative-dispersive filter, including a t* parameter, and with the instrument response. Three synthetic yields of respectively I 0 kc, 20 kt and 55 kc are modeled with the Mueller-Murphy source for nuclear tests.
Numerical results show a close agreement between data and synthetics for the P and pP waveforms if c* is properly scaled. It results chat the t* value must lie in a 0.7 to 1.0 range to fie data for a 10 kt yield, in a 0.7 to 0.8 range for a 20 kt yield and about 0.5 and less for a 55 kc yield. Although an uncertainty of less than 50 % is hardly achievable with the present method, it appears chat a correct estimation of the global yield depends strongly on the choice of the c* parameter value.
The Chinese Nuclear Weapons Test Program: Seismic Yields and Locations at Lop Nor WALLACE, T.C. and TINKER, M.A., University of Arizona, Dept. of Geosciences, BLDG #77, Tucson, AZ 85721
We have examined the seismic characceriestics of 20 underground nuclear explosions detonated at the Lop Nor test site in western China. Seismic yields are estimated using network average teleseismic P wave spectra using the methodology of Murphy et al. (1989). The smallest test modelled (Sept. 29, 1988, mb=4.6) had a yield of approximately 3 Kt, while the largest test (May 21, 1992) had a yield of approximately 690 Kc. We use the body wave yields to calibrate a yield-mblg relationship for 5 seismic stations reporting to the IMS and 9 other "open" broadband seismic stations.
We also relocated the last 11 explosions using ground truth information and a master event location technique. Gupta (1995) located ground truth based signarures of 4 explosions using commerical satellite imagery. Three of the ground truth locations are clustered within approximately 10 km of each ocher, allowing us to determine mean station corrections by averaging the 231, 534 and 620 reporting stations respectively. The residuals generated were then used to relocate the fourth ground truth event to examine the accuracy of the procedure. The relocations of the 11 events (4 GT events plus the 7 other evecns) show a much stronger clustering than was present in the original USGS locations.
Improving Regional Seismic Event Location Through Calihration of the International Monitoring System Craig A. Schultz and Stephen C. Myers:, Lawrence Livennorc National Lahom10ry 1
• L-205, Livermore, CA 94551, [email protected]
At Lawrence Livermore National Laboratory (LLNL), we arc working to help calibr.ite the 170 seismic stations that are part of the Comprehensive Nuclear-Test-Ban Treaty (CTBT) monitoring network, in order 10 enhance the network's ability to locate small seismic ~vents. These low magnitude events arc likely to be recorded by only the closest of seismic :--.tatinns. rant!ing from local to near telescisn11c distances. At these distance ranges. calibration stafr•,tics become highly nonstationary. challenging us to develop more general slati\tical nuHIL'ls for proper calibration
In thi.'> study. we arc developing a general nonstationary lllodcl to accurntely calibrate \CJ',,lllic travl'l-ti111es over the full range, from local. to regional, to telcscismic distance:-. This 111mh:I intcgrati:s five core components essential to accurate calibration. First. is th1.; compilalinn and statistical characterization of well located rckrcncc events, lnduding alkrshock \L'quences, mining explosions and rockbursts. calibration explosions, ~Uld tL'lcsci~mically constrained events (Harris ct al . this meeting: Hanley ct al.. this meeting}. Sc<:und. i~ the dc\'dopment of generalized velocity models based on these reference ~vcnls ( McNamara cl al.. SSA 1998: Pasyanos. this meeting). Third. is the dcvclopmc:nl of non~talionary spatial coffcctions (nonstationary Bayesian kriging) that rdinc the hasc ,·L·locity lllodcls (Schult1. ct al., SSA 1998). The fou11h component is the (Tos:,;-v;.,lidat~on of calibration n .. ·~ults tu ensure intemat consistency along with tht! continual hi.!ni..'.h1narkmg of our n11ns.tauonary model where evenr locarions arc accurately known (Myers ct aL this meeting). Finally. the fifth component is 1hc development of location uncc11uinty maps. demonstrating how caiihra1ion is helping to improve loca1ion accuracy across both sci~mically active and aseis.mic regions. Together. these components help us to ensure .the accurate location of events, and jusl as i1npo11am. help to ensure the accurate reprcsc:ma110n or hia~ unccnainty and random unce11ainty in the predicted error ellipses.
1This research was pcrfonned under lhe ausrices of lht" Li S Department of Encr:;) hy Liwrem:c I 1w1 n10r~· r\:111nn,1t Lahor:uory under contrntt number\\'_ 7--l0.5-ENCi--tH
Can the International Monitoring System for the Comprehensive Nuclear Test Ban Treaty Attain the Goal to Locate Events with 1000 Square km Uncertainty? McLAUGHLIN, K.L., YANG, X., ISRAELSSON, H. and STEAD, R., Center for Monitoring Research, Suite 1450, 1300 N. 17th St., Arlington, VA 22209, 703-276-7900, [email protected], [email protected], [email protected], [email protected].
It is a goal of the Internacional Monitoring System (IMS) to locate continental seismic events with an accuracy of 1000 square kilometers. The text of the Comprehensive Nuclear Test Ban Treaty says: "The area of an on-site inspection shall be continuous and its size shall not exceed 1000 square kilometers. There shall be no linear distance greater than 50 kilometers in any direction." Simulations oflocation capability support the argument that the full primary and auxiliary seismic network will be capable of locating small continental events (mb 3.5-4.0) within this uncertainty provided travel time and azimuth errors are suitably reduced by regional calibration. Recent small events in southern Nevada serve to illustrate such location calibration of the IMS seismic network. While che worldwide IMS primary and auxiliary networks are far from complete, the North American IMS network is nearly complete and excellent locations for use as ground truth are available from a local network in southern Nevada. Two methods for calibration are compared to ground truth. In the first method, historic explosions are used to derive travel rime corrections for IMS stations using a Joint Hypocenter Determination (JHD) procedure. In the second method, regionalized travel time curves are used to derive corrections for each IMS station. North America has been divided into a tectonic region and a stable region and corrections to the standard IASPEI travel time model have been derived for each IMS station as a function of source location. These Source Specific Station Corrections (SSSC) will be applied as pare of the standard location procedure. The prototype Internacional Data Center (pIDC) generates automated Standard Event Lists at 2 hours (SEU), 6 hours (SEL2), and 12 hours (SEL3) after real time. Events of the SEL3 are analyst reviewed and, nominally within five days, published in the Reviewed Event Bulletin (REB). We illustrate che use of JHD corrections and SSSC with arrival rime, azimuth, and slowness observations of the REB to relocate small events in southern Nevada compared to "ground truth". Boch procedures improve locations compared to "ground truth" and reduce formal uncertainties approaching or exceeding the 1000 square km goal. Considerable work will be required to further implement and validate location calibration worldwide.
Maximum Spectral Energy Arrival Time of Rayleigh Waves for Epicenter Determination and Location Error Reduction. YACOUB, N .K. Air Force Technical Application Center, Patrick AFB, FL 32925-3002, [email protected]
Maximum spectral energy (MSE)arrival times for Rayleigh waves are used in the hypocenter determination procedure co locate seismic events, assuming a constant velocity model of3.0 km/sec. MSE is computed by means of the Fast Fourier Transform and the Multiple Filter Analysis techniques. The arrival times for che MSE is computed in the period range 17 to 23 seconds and within a velocity
Seismological Research Letters Volume 70, Number 2 March/April 1999 213

window of 2.8 to 3.2 km/sec, using a predicted location. These arrival times are measured from digitized seismograms for six nuclear explosions from the Nevada Test Sire, USA. Corresponding P-wave first-break arrival times were obtained from the International Seismological Center (ISC) Bulletin. The location for each explosion is determined. independently, from the Rayleigh wave MSE arrival rimes and the P-wave first-break arnval nmes, using a common sec of stations that have digital seismograms and published ISC first-break arrival times. The accuracy of the determined epicenters are measured by the mislocation vector magnitude, which is the distance between the ground truth and the determined location. The results show that all mislocation vector magnitudes derived from the MSE arrival times are less than those derived from the P-wave first-break arrivals (the conventional method). On the average, the size of the mislocation vector magnitude, for the six explosions, calculated by the MSE riming method is more than half that calculated from the P-wave first-break riming method.
The Comprehensive Test Ban Treaty in the Region of Bolivia DRAKE, L.A., AYALA, R., VEGA, A., Observatorio San Calixto, Casilla 12656, La Paz, Bolivia, [email protected]
Regional structures, such as downgoing slabs, severely bias hypocentral, particularly depth, estimation of earthquakes, when only regional and releseismic Parrivals are used to determine the hypocenter. The region of Bolivia is unusual in that it includes a downgoing slab, the Nazca plate from the west, at about 8 cm/a, and a decollemenr in the east of the Subandean fold-thrust belt over the Brazil Shield, at about 1 cm/a. There are only two Comprehensive Test Ban Treaty seismic stations in Bolivia, a primary station (LPAZ), just north of La Paz, and an auxiliary station, San Ignacio Velasco (SIV), in eastern Bolivia. The two principal problems of seismic event location in Bolivia are: i) the Andean crust under the most western of the national stations is approximately 75 km thick, while the Brazil Shield crust under SN is approximately 40 km thick; ii) SN is the western control of an area approximately the size of Europe. We have used two approaches to constrain hypocenters in the region of Bolivia. First, Ayala has found that, for earthquakes recorded by the telemetered network of Antofagasta, in northern Chile, in the period from June 1990 to August 1991, horizontally layered velocity models gave a clear increase in the dip of the Wadati-Benioff zone of the Nazca plate below a depth of 100 km, compared with the locations of a model with a three-dimensional mesh. With horizontally layered velocity models, high velocities up the slab pulled rhe apparent locations of the earthquakes toward the coastal Antofagasta network. Secondly, we have examined the intensity maps of 10 important earthquakes in Bolivia, including the Consata earthquake of 24 February 1947 (Mw = 6.4) and the Pampa Grande earthquake of 22 May 1998 (Mw = 6. 5) . We have found that the hypocenters of the international agencies are inconsistent with the observed intensities, in particular, always being too deep.
Monday A.M., May 3, 1999-Rainier Room Posters Strong Ground Motion: Observing, Predicting, and Engineering Applications I
Seismic Wave Amplification in the Santa Clara Valley from Nearby Earthquakes HARMSEN, S.C., FRANKEL, A. (U.S. Geological Survey, Denver, CO 80225), and GRAVES, R.W (URS Greiner Woodward Clyde, Pasadena, CA 91101)
We model the seismic response of basins in and near the Santa Clara Valley (SCV) to local San Andreas and Hayward fault earthquakes using three-dimensional finite-difference (Graves, 1996) and the velocity model ofBrocher eta!. (1997) . We focus on the development of surface waves generated at basinhardrock interfaces. We find that at frequencies modeled, less than 0.5 Hz, peak ground velocity (PGV) is often associated with these surface waves. For point sources at depths ranging from 5 to 8 km, the amplitude of the surface wave is very sensitive to depth of focus. PGV from a 5-km source compared to chat from an 8-km source at the same epicentral location is, on average, throughout the SCV, more than a factor of two greater, and can exceed a factor of five. Seismic attenuation in shallow sediments is also a critical factor in the prediction of
surface wave amplitude in the basins. Gibbs et al. (1994) determine Qs to be about 12 in the upper 175 m of sediments near Gilroy, CA, at frequencies> 1 Hz. We compare surface response assuming Qs = 12 with that assuming Qs =
56 in the shallow valley sediments where vs <= 0.3 km/s (much higher Q for deeper media). We find that PGV in rhe center nf rhe SCV (frequencies < 0.5 Hz) for a nearby San Andreas or Hayward source can be more than a factor of two higher assuming shallow Qs = 56 versus shallow Qs = 12.
Frankel et al. (1991) associated some of the largest amplitude displacements recorded in the Sunnyvale array from aftershocks of Loma Prieta mainshock with late-arriving surface waves. Finite-difference synthetics are used to model these aftershock records and to examine the tradeoffs between Qs and depth-offocus in the generation of surface waves at the Sunnyvale array. We are now using numerical simulations to help decide on seismograph locations in rhe SCV in an array being deployed by the U.S. Geological Survey.
Ground-motion Amplification on Vertically and Laterally Heterogeneous Media: Some Typical Cases from the Urban Area of Catania. LANGER, H., and CRISTALDI, M., Mesror snc, Via Teocrito 11, 95131 Catania, Italy, [email protected]; GRESTA, S., and TORTORICI, L., Dept. of Geological Sciences, University of Catania, Corso Italia 55, 95129 Catania, Italy, [email protected].
Catania is one of the cities with major seismic hazard in Italy. In history the city was repeatedly hit by destructive earthquakes, e.g., the shocks of 1169, 1542 and 1693, all with estimated magnitudes around or above 7. As an example, the January 11, 1693 earthquake destroyed rhe city almost completely, causing here about 20,000 fatalities.
The purpose of this study is the evaluation of site effects and response of soil in the Catania area based on synthetic simulations. We have considered various scenarios with earthquake sources whose magnitudes range from 4.0 to 7.5 and whose foci are located at depth from 5 to 15 km. The epicentral distances of these earthquakes are supposed to be in the range 5-50 km.
The subsurface geology of the urban area of Catania is characterized by a marly-clay substratum overlain by lavas, sands and conglomerates. The lava thickness range from few ro over 60 meters, while sand terraces range from few to 30 meters. Our srudy is based on ca. 100 boreholes from which geotechnical and geophysical data were available. We calculated synthetic accelerograms and response spectra some typical layered structures both assuming a receiver position at the surface and at depth. The results highlight the importance of the subsurface geological conditions, in particular the presence of low velocity layers which enhance seismic loading. On the other hand thick lava layers act as "protecting shields" against earthquake shaking.
Ground Motion Attenuation at Regional Distance in Italy and Germany MALAGNINI, L., Istituto Nazionale di Geofisica, Rome (Italy) and Saint Louis University, HERRMANN, R.B., Saint Louis Universiry, DI BONA, M., Istituto Nazionale di Geofisica, Rome (Italy), and KOCH, K., Institute for Geosciences and Natural Resources, Hannover (Germany)
Regressions over two datasets of broadband seismograms are performed to quantify the ground motion scaling at regional distances in Italy and Germany, for both peak and Fourier ground morion amplitudes. The datasets consist of 1900 waveforms from 327 events up to magnitude M=6 for Italy and of 1350 waveforms from 222 events with a maximum magnitude M=4.9 for Germany.
Observed motions are modeled as PEAK(f,r) = SRC(f) + SITE(f) + D(r,f), where PEAK(f,r) is the logarithm of the motion morion in different filter
bands, SRC(f) gives the excitation terms for rhe ground motion, and SITE(f) represents the effect due to the shallow geology at the recording sires. D(r,f), modeled as a piece-wise linear function with many nodes, includes the effects of geometrical spreading and Q. The regression D(r,f) is very similar to that obtained by using a simpler coda normalization technique. In a subsequent step, the peak velocity and Fourier velocity spectra D(r,f) are parameterized using a geometrical spreading function, frequency dependent Q, and distance dependent duration using rhe tool of random vibration theory (RVT) to create a predictive model.
Results ·support the idea of a low-Q crust in the Apennines, implying rhat seismic hazard along rhe Apennines should be be dominated by the local seismiciry. Higher values of crustal Qare found in Germany. The different geometrical spreading functions may reflect rhe Moho depths in the two regions.
214 Seismological Research Letters Volume 70, Number 2 March/April 1999

Ground Motion Amplification by an Orthotropic Basin ZHENG, T., and DRAVINSKI, M., Department of Aerospace and Mechanical Engineering, University of Southern California, Los Angeles, CA 90089-1453, [email protected]
Scattering of elastic waves by an orthotropic basin of arbitrary shape embedded in a half space is investigated for the sagittal plane motion using an indirect boundary integral equation approach. Sceady-scate resulte were obtained for incident plane pseudo P-, S-, and Rayleigh waves. Detailed convergence analysis of the method is presented. Surface ground motion is evaluated for semicircular and semielliptical basins with different material properties and various angles of incidence. The results show chat surface motion strongly depends upon the nature of incident wave, geometry and material properties of the basin and location of the observation points. Comparison with isotropic response demonstrate that anisotropy is very important in amplification of surface ground motion.
Empirical Site Responses in Bucharest, Romania, Determined from Ambient Noise and Small Earthquake Investigations BONTER, K.-P., DRIAD, L., ONCESCU, M.-C.', Geophysical Institute, University of Karlsruhe, Germany, [email protected], RIZESCU, M., IONESCU, C., National Institute for Earth Physics, Bucharest, Romania, MOLDOVEANU, T., Geotec S.A., Bucharest, Romania. +now with Teledyne, Dallas, U.S.A.
To quantify che variations of the site responses in downtown Bucharest the horizontal- to vertical-component spectral ratio method (HIV) on different kinds of seismic data was applied. Starting September through November 1997 we have recorded ambient seismic noise at 11 sites in Bucharest. In addition, we used ambient noise and small earthquake recordings from instruments deployed during an aftershock campaign in June/July 1990 and first recordings of the new K2 network, installed recently (1997) within a joint German-Romanian longterm project on strong earthquakes.
The ambient noise ratios, determined on rwo profiles which cross in the center of Bucharest, show a remarkable constancy of the main resonance period in the l-2s range. First recordings ofVrancea earthquakes by the new K2 network corroborate chis observation but show that the high frequency peak ground accelerations may differ up co 2-3 times in downtown Bucharest. However, lowpass filtering with a corner frequency of 1 Hz reduces these differences co about + 15%, thus confirming the almost constant level of the main soil resonance of the noise data. The two noise profiles as well as the earthquake data document a broad resonance peak between 1 and 2 seconds in the whole city area of Bucharest. The average resonance period of T = 1.36s would imply a thickness of the sediments of about 120 m, assuming a shear wave velocity of 0.35 km/s.
The majority of the buildings in Bucharest have fundamental periods of about 0.3 to 0.5 seconds. This is exactly the range, where the 'earthquake-ratios' display the greatest local differences but the 'noise-ratios' fail to resolve such variations. So further efforts co map differences in che soil resonances of Bucharest by ambient noise recordings, remain questionable. Permanent deployment of additional free field stations is required co enable mapping of the lateral variations of the high frequency site responses in downtown Bucharest.
Correlation of Ground Motion and Intensity for the January 17, 1994, Northridge CA, Earthquake BOATWRIGHT, J., US Geological Survey, Menlo Park, CA 94025, [email protected]; THYWISSEN, K., Swiss Re America, New York, NY 10017, [email protected]; SEEKINS, L.C., U.S. Geological Survey, Menlo Park, CA 94025, [email protected]
We analyze the correlations between modified Mercalli intensity and a set of ground motion parameters obtained from 63 free-field and small structure stations in Los Angeles County chat recorded the 1994 Northridge earthquake. We use the tagging intensities based on ATC-20 inspection procedures obtained by Thywissen and Boatwright (1998) because these intensities are area-specific: they were determined independently for each census tract, rather than estimated from the isoseismals interpolated by Dewey et al. (1995). The ground motion parameters we consider are peak ground acceleration (PGA), peak ground velocity (PGV), 5%-damped pseudo-velocity response spectral ordinates (PSV) at 15 periods from 0.1 to 10 s, and two averages of these ordinates from 0.3 co 3 s. Visual comparisons of the distribution of tagging intensity with contours of peak acceleration, peak velocity, and average response spectra suggest that the peak velocity and the average response spectra are better correlated with intensity than the peak acceleration. Correlation coefficients berween the
intensity and the ground motion parameters bear ouc this interpretation: r=
0.75 for PGA, 0.85 for PGV, and 0.85 for PSV averaged over 0.3 to 3.0 s. Correlations between the intensity and pseudo-velocity response spectral ordinates, as a function of period, are strongest at 1.5 s (r = 0.83) and weakest at 0.2 s (r =
0.66). Regressing the intensity on the logarithms of the ground motion parameters yields the range of relations I = m1ogv + b with 3 * m * 5 for different parameters and periods: m = 3.3±0.5 for peak ground velocity and m = 3.5±0.5 for the average pseudo-velocity response spectra.
Regressing Velocity Response Spectra from Large Strike-slip Earthquakes for Site Amplification, Attenuation, and Directivity BOATWRIGHT, J., U.S. Geological Survey, Menlo Park, CA 94025, [email protected], and SEEKINS, L.C., U.S. Geological Survey, Menlo Park, CA 94025, [email protected]
We analyze the 5% damped pseudo-velocity response spectral ordinates obtained from 95 strong motion instruments in free-field or small-structure sites that recorded the 1989 Loma Prieca, California, earthquake and 81 instruments that recorded the 1994 Landers, California, earthquake. We perform two different regressions for site amplification, attenuation, and directivity, at a set of 17 periods from 0.04 to 10 s. The first regression uses the least distance from the rupture area to the receiver and models the directivity following Somerville et al. (1997). The second regression uses rms measures for the source-receiver distance and directivity derived from Boatwright's (1982) model for the highfrequency acceleration spectrum. The results from the two regressions are generally similar, although the directivity regressed using the rms measures is greater. Stations sited on bay mud are strongly amplified at periods from 0. 75 to 3 s, while stations sited on competent rock are deamplified from 0.04 to 10 s. The attenuation with distance is stronger at periods shorter than 1 s than at longer periods. The directivity (that is, the amplification of the motion radiated at azimuths in the direction of fault rupture relative ro that radiated at azimuths normal to the fault) varies between the two earthquakes, but generally increases with period co a peak at 3-7.5 sand then decreases abruptly for longer periods. The rms measure of directivity used in the second regression allows us to infer an effective rupture velocity from the directivity: the amplification factor of 2-3 (rupture-direction/fault-normal) observed for periods from 1 to 4 s corresponds to effective rupture velocities of0.70G* v *0.82K
Basin Structure Estimation by Forward and Inversion Method ~ and HELMBERGER, D., Seismological Laboratory, California Institute ofTechnology, Pasadena, CA 91125, [email protected], helm@gps .cal tech. ed u
The broadband records of regional earthquakes can be used to refined basin velocity models. Weapproximate the basin structure with several 2-D layers; some key points control the position of the interfaces between the adjacent layers. Hence we can obtain different shaped basins by just changing the vertical positions of the key points and velocities of layers. For the region outside the basin, we use a ID-layered model. The synthetic seismograms are calculated by a hybrid method combining analytical and numerical interfacing, Wen and Helmberger, 1996. We start with an approximate structure and make some reasonable changes to some parameters, until synthetics generated from these models explain the records inside the basin. This was done successfully for a cross-section through the Los Angeles Basin based on Landers earthquake data. Moreover, the procedure can be extended to a direct waveform inversion process using the conjugate gradient method to perturb the basin velocity model automatically, if a sufficient number of recordings containing travel-time information are available, (TriNet data).
Maps of Orbital Motions for the 1994 Northridge Earthquake PORTER, L.D., Advanced Precision Graphics, 340 Rutherford Drive, Danville, CA 94526-2242, [email protected]; LEEDS, D.J ., David J. Leeds Associates, 11972 Chalan Road, Los Angeles, CA 90049-1525, [email protected]
Strong-motion data were recorded from the 1994 Northridge earthquake at over eighty freefield locations. Interest has been directed co this data set not only because of the extremely large amplitudes obtained, but also as a consequence of the great variations found between adjacent stations. Although some of the variations can be explained in terms of site effects and topography, further analysis is needed to resolve the remainder.
In this study maps of the orbital motions as a function of station location have been constructed for seven instruments in the Van Norman complex. This cluster is located about ten km north of the epicenter.
Seismological Research Letters Volume 70, Number 2 March/April 1999 215

Closely adjacent stations (two km apart or less) show an increasing similarity in orbital patterns for the horizontal motions as one progresses from the accelerations through the velocities to the displacements. AB the separation between stations is increased to moderate distances (about five km), the similar::-y i') best retained fnr the dispbcements, and in some inst:1nce5 m:1y n~r ;e~ni:~
for the velocities and accelerations. By annotating the orbital traces with respect to time it is possible to track specific segments of the motion from station to station through the complex. This study verifies the increase in pattern similarity between adjacent stations that would be expected as the periods of the data are lengthened.
A 1-km Wide Low Velocity Zone in the Calaveras Fault, and Its Effect on Strong Ground Motions SPUDICH, P., U.S. Geological Survey, Menlo Park, CA 94025 USA, [email protected]; OLSEN, K.B.,[email protected], JEWEL, E., [email protected], ARCHULETA, R., [email protected], all at Inst. for Crustal Studies, Univ. of Calif., Santa Barbara, CA 93106
We are srudying the ground motion effects of the wide low velocity zone (LVZ) in which the Calaveras Fault is embedded. The Calaveras fault LVZ has had two clear effects on the ground motions oflarge earthquakes on that fault. The first effect of the LVZ has been to move the locations of nodal lines. Liu and Helmberger (1983) noted that the nodal line for the tangential component of the hypocentral S wave in the 1979 Coyote Lake earthquake (M 5.8) fell between stations G03 and G04. Being unaware of the fault LVZ, they explained this observation by hypothesizing that the true hypocenter was about 4 km southeast of the hypocenter determined by the local seismic networks. However, we are developing a LVZ structure that explains this nodal line shift using a LVZinduced shift of the nodal ray.
The second effect of the Calaveras fault LVZ has been the generation of a large, low frequency trapped wave observed during the M 6.2 1984 Morgan Hill earthquake on station GOG in the fault zone but not on station G07, 4 km distant, outside the fault zone. Hartzell and Heaton (1986) speculated that the large motions at GOG were caused by a wave guide in the fault zone LVZ, and they speculated that the unusually low amplitude at G07 was caused by its possible location in a shadow zone. GOG and G07 have similar amplitude motions during the M 6.9 1989 Loma Prieta earthquake, which was not located on the Calaveras fault, confirming that the amplitude and waveform differences between the two stations during the Morgan Hill earthquake were not caused by local site effects at the two stations but rather by fault zone focussing effects.
The period of the fault zone guided wave (FZGW) observed during the Morgan Hill earthquake is about 1.0-1.5 s, which is considerably greater than the periods of other observations cited above. The long period of the FZGW probably was observable because the Calaveras fault zone is wide and because the Morgan Hill earthquake generated ample long period signal. This raises the question of whether other fault zones may have similar long period FZGWs (and wide LVZs) that are not usually observed in studies of trapped waves because the sources in these other studies are not sufficiently rich in long period energy.
Investigating the Effects of 30 Structure on Strong Ground Motions in Santa Clara Valley STIDHAM, C., DREGER, D. and ROMANOWICZ, B., Seismological Laboratory, University of California, Berkeley, CA, 94720, [email protected]; and LARSEN, S., Lawrence Livermore National Laboratory, Livermore, CA, 94551, [email protected].
We have constructed a 3D velocity model of the San Francisco Bay Area for the crust and upper mantle, on the basis of geological information, seismological results and gravity modeling (Stidham et al., submitted to BSSA.) Previous tests of the 3D velocity model include simulations of the 1989 Loma Prieta earthquake and of a small Rodgers Creek event, using a 30 finite difference code developped by Larsen. These simulations provide synthetic seismograms and views of the synthetic maximum ground velocities at the surface which, when compared to the recorded seismograms and ground velocities, indicate both the validity of the 3D model as a starting model and the usefulness of such comparisons in constraining subsurface features in the Bay Area. The Santa Clara Valley has recently become an area of increased interest, as the effects of basin structures and alluvial velocities on strong ground motions are explored. The recent temporary array of the USGS/UCB/PASSCAL Santa Clara Valley Seismic Experiment recorded small to moderate earthquakes (including the 8/12/98 San Juan Bautista event) on a density of stations that allows close examination of the effects of the structure of the basin and the major faults adjacent to the basin on the relative amplitude of ground motions across the array. Improved
understanding of the effect of the basin's structure and the major faults' velocity contrasts on wave propagation in Santa Clara Valley, can be derived through waveform modelling using the records from the Santa Clara Valley array. These results will aid in prediction of the areas of greatest damage from future large e:1 rth quake~ i !1 the R:iy .A. re>:1
High Frequency Vertical Ground Motion in the Pacific Northwest Using PNSN Data HERRMANN, Robert B., and DUTT, James, Department of Earth and Atmospheric Sciences, 3507 Laclede Avenue, St.Louis, MO, 63103, USA
Vertical component velocity seismograms from the Pacific Northwest Seismograph Network (PNSN) are used to extend our studies of high frequency ground motion scaling with distance to other locales in the US. A total of 2500 waveforms from 133 stations and 134 events in the region were used. The signals were processed to examine the peak ground velocity and Fourier velocity spectra in the frequency range of 1-16 Hz. Analysis involves a two step process: first, modeling of PEAK S-wave motions in terms of EXCITATION, DISTANCE and SITE terms, followed by a parameterization in terms of geometri-cal spr_eading, frequency _dependent Q and distance ~
61endent duration. .
lnmal parametenzauon requires Q(f) = 160 f' · , a network average site 'kappa' of 0.04, and a tripartite srreading function of r(-1.0 for r < 50 km, ,(-0·25
for 50 <= r <= 150 km, and r(O. for r > 150 km. These values are sufficient to explain the data using the predictive model, but may only be indicative of true earth values. These values will be compared to similarly derived relations for the Southern Great Basin, Southern California, New Madrid, Germany and Italy.
Style-of-faulting and Footwall/Hanging Wall Effects CHIOU, S.J., MAKDISI, F., and YOUNGS, R.R., Geomatrix Consultants, 100 Pine St., Suite 1000, San Francisco, CA 94111 ([email protected], [email protected], [email protected])
Style-of-faulting effects for strike-slip and reverse earthquakes are analyzed using empirical and simulated strong-motion data. The empirical data consist of recordings from the western United States and other active tectonic regions. Simulated data are computed using the composite source model (Zeng and others, 1994; Frankel, 1991) and theoretic Green's functions of a layered crust. Peak ground accelerations and spectral accelerations at periods of 0.1, 0.2, 0.3, 0.5, 0.75, 1.0, 2.0, and 4.0 seconds are analyzed. Previously observed large effects in the low- magnitude range (Mw < 6.0) were driven by the larger than average motions from the aftershocks of the 1983 Coalinga earthquake. The recently released CDMG data of the 1994 Northridge aftershocks, with Mw ranging from 5.0 to 6.2, have provided useful constraints on the magnitudedependence of the style-of-faulting effects in the low-magnitude range.
We also examine the footwall/hanging wall effects of a dipping fault using both empirical and simulated data. Our analyses confirm the suggestion that footwall/hanging wall effects are due to the inadequacy of the closest fault distance to capture the dipping geometry of a reverse earthquake. To further verify this conclusion, we define a new distance measure that incorporates rupture geometry and finiteness. Re-analyses of data with this new distance show statistically insignificant footwall/hanging wall effects.
Analysis of Ground Motion Parameters for Scenario Earthquakes on the Santa Monica Mountain Thrust and Hollywood-Santa Monica Faults SAIKIA, C.K. and P.G. SOMERVILLE, URS Greiner Woodward Clyde, 566 El Dorado Street, Pasadena, CA 91101, USA., e-mail:[email protected]
We have simulated ground motion parameters for engineering use at eighteen urban centers located along the Santa Monica Mountain fault system for earthquakes occurring on the Hollywood-Santa Monica and Santa Monica Mountain thrust faults. These urban centers, which include Beverly Hills, Westwood, Sherman Oaks, Santa Monica, Century City and down town Los Angeles, have many multi-story buildings. Of these, thirteen have CSMIP strong motions instruments which recorded the 1994 Northridge earthquake. In this study, we considered three earthquake scenarios: a Mw 7 earthquake on the HollywoodSanta Monica fault which has a dip of 70° and varying strike for different segments of the fault (taken from Wright, 1991), and a rake of 5°, a Mw 7 earthquake on the buried Santa Monica Mountain thrust which has a dip of 20°, a strike of 266° and rake of 90°, and a Mw 7 .2 earthquake which is generated by a simultaneous rupturing of these two faults. To produce ground motion parameter for the simultaneous rupture, broadband time histories simulated for the two fault systems were added with appropriate time lags. Each Mw 7 earthquake was simulated using a fault surface with a length of52 km and a width of 18 km. Broadband time histories were simulated using 9 hypocenters and 10
216 Seismological Research Letters Volume 70, Number 2 March/April 1999
randomly generated slip models. Thus for each site, we simulated a total of 180 horizontal component ground motion time histories for each earthquake scenario. Based on this simulation study, we conclude that the peak ground accelerations from the Hollywood fault dominate the ground motions from the Santa Monica Mountain thrust fault system. In general, peak ground accelerations from the Hollywood fault earthquake are 2 to 2.5 times larger than the peak ground accelerations from the Santa Monica Mountain thrust fault at sites hsbg, shro, nhol, lace, smn, bvh, ulg, lal9, and ul7. These large motions are primarily caused by rhe shallow depth and proximity of the Hollywood-Santa Monica fault ro rhe selected sites. This shallow depth of the Hollywood-Santa Monica fault system also contributes significantly to the long-period ground motions. At sites la52, la54, lal5, lal3, la12 and la9 which are located in the Los Angeles down town area, accelerations from the Hollywood-Santa Monica fault are larger than those of the Santa Monica Mountain thrust by a factor of about 1.7. We also analyzed the spectral values for each scenario afrer averaging the spectral values obtained from all hypocenters and slip models. These averaged spectral values, which are currently for rock-like site structure (lOOOm/sec for shear waves at the surface), are compared with the empirical spectral values determined using the attenuation relation of Abrahamson and Silva (1997) for rock. The median spectral values of our simulation lie above the empirical median values, especially for the Hollywood-Santa Monica fault, bur lie within one standard deviation from the mean of these empirical estimates at most of the sires. Ar several sires, for example hsbg, shro, nhol, lace, Beverly Hills, Glendale, UCLA ground, and UCLA ?-story, the long-period (l-3sec) spectral values are significantly higher than those predicted using the empirical relation. In particular, hypocenters located at the western edge of the fault cause the simulated median motions to become large due to rupture directvity effects.
RESULTS OF SITE AMPLIFICATION STUDY IN ANCHORAGE,ALASKA ON THE BASIS OF GENERALIZED INVERSION SCHEME
DUTTA U. MARTIROSYAN. A.. and BISWAS, N., Geophysical Institute, University of Alaska, Fairbanks, AK 99775, [email protected]; DRAVINSKI, M.. University of So. California, Los Angeles, CA 90089; and PAPAGEORGIOU, A., University of New York, Buffalo, NY 14261
In 1996, 22 short period (4.5Hz sensor) IRIS-PASSCAL stations were operated for 6 months in Anchorage, Alaska. During this time about 114 local earthquakes with focal depths in the range of O km to 160 km were recorded with good signal-to-noise ratio. The data for these events were sorted into two groups - one for those events with focal depths less than 40 km (41 events) and the other for the events of focal depths greater than 40 km (73 events). Both data sets were analyzed for site amplification factor (SAF) using generalized inversion scheme. The following results were obtained:
( 1) The SAF values yielded by the data set representing the shallow (focal depth < 40 km ) events in most cases are higher by a factor in the range of 1.1 to 1.8 than values obtained for the deeper events (focal depth > 40 km). However, the residuals of SAF values corresponding to this two set of data are within one standard deviation over the entire frequency band (0.5 - 11 Hz) considered in this study.
(2) The variations of SAF values obtained by the inversion scheme show higher correlation with those yielded by the standard spectral ratio method compared to those obtained by the horizontal to vertical spectral ratio method. The same data set has been used in all three cases.
(3) The trend of the spatial variation of SAF values is in accord with that of the surficial geology the Anchorage basin.
G/Gmax and Hysteretic Damping Soil Models Based on Modeling Strong Ground Motions Walter). SILVA, Pacific Engineering and Analysis, El Cerrito, CA 94530, [email protected]; Robert PYKE, Bob Pyke Consulting Engineer, 1076 Carol Lane Suite 136, Lafayette, CA 94549, [email protected]; C. ROBLEE, Caltrans, Sacramento, CA 95819, [email protected]; K. STOKOE, University ofTexas, Austin, TX 78712-1076, [email protected]; M. VUCETIC, University of California, 4532 Boelter Hall, Los Angeles, CA 90024-1593, [email protected]
Strong ground-morion recordings from the 1979 Imperial Valley, 1989 Loma Priera, and 1994 Northridge earthquakes are modeled using a methodology which incorporates source, path, and equivalent-linear site response. Site response nonlinearity is clearly resolved at frequencies exceeding about 3 Hz for sites within about 30 km of the source where expected rock outcrop peak accelerations exceed about 0.25 g. Regional (soil type) specific modulus reduction and hysteretic damping curves are estimated by reducing model bias (average chi square of response spectra over all stations). These gorund-motion-driven curves depart significantly and systematically from conventional curves, being generally more linear and depth-dependent. Regional differences show increased linearity in going from Northern California ro Southern California to
Imperial Valley. The Southern California curves compare favorably with recent laborarory test results from the ROSRINE project.
Comparisons of Nonlinear and Equivalent Linear Analyses at High Strain Levels Walter). SILVA, Pacific Engineering and Analysis, El Cerrito, CA 94530, [email protected]; J. HUMPHREY, 21380 Castal Peak Road, Reno, NV 89511-7119; K. STOKOE, University ofTexas, Austin, TX 78712-1076, [email protected]; Robert PYKE, Bob Pyke Consulting Engineer, 1076 Carol Lane Suite 136, Lafayette, CA 94549, [email protected]; I.M. IDRISS, University of California, Davis One Shields Avenue, Davis, CA 95616, [email protected]
Ar three strong-motion sites-Gilroy 2, Treasure Island, and Lo Tung, Taiwan-both equivalent-linear and fully nonlinear analyses are compared to recorded motions. Profile shear-wave velocities are based on both downhole and crosshole rests (Gilroy 2 and Treasure Island) with nonlinear properties determined from laborarory testing of undisturbed samples. Favorable agreement is seen between equivalent-linear and nonlinear analyses and with the recorded motions. At the soft soil site Lo Tung, nonlinearity is seen down to surface peakacceleration values as low as 5% g.
Surface Geology-based Amplification Factors for San Francisco, Los Angeles, and Portland Areas Nick GREGOR, Pacific Engineering and Analysis, El Cerrito, CA 94530, [email protected]; Walter J. SILVA, Pacific Engineering and Analysis, El Cerrito, CA 94530, [email protected]; C. WILLS, CEDMG SF, 185 Berry Street Suite 210, San Francisco, CA 94107; [email protected]; S. LI, Pacific Engineering and Analysis, El Cerrito, CA 94530, [email protected]
Equivalent-linear site-response analyses are used ro develop amplification factors for 5% damped response spectra relative to firm rock response spectra as functions of expected rock outcrop peak acceleration. Generic soil profiles are first developed consistent with surface geology along with ranges in depth to baserock. For San Francisco and Los Angeles areas, region-specific modulus reduction and damping curves are used in equivalent-linear analyses. Profile velocity, layer thickness, depth to baserock, and nonlinear properties are randomized to accommodate parameter uncertainty and randomness in the amplification factors. Parametric statistical models are based on analyses of variance of measured shear-wave velocity profiles and laboratory rest data. Good agreement between the model-based factors and available empirical factors (linear response range) is seen. The amplification factors can be used to adjust rock spectra to surface geology and depth-specific site conditions at high levels of loading.
Performance of the Base Isolators in the Mackay Mines Building at the University of Nevada, Reno, during the 30 October 1998 Incline Village Earthquake ANOOSHEHPOOR, A., Seismological Laborarory/174, University of Nevada, Reno, NV 89557-0141, [email protected]
The Mackay Mines Building on the campus of the University of Nevada, Reno was recently retrofitted with base isolators to reduce the potential for damages during earthquakes. Laminated rubber bearings (elasromeric bearings) were used for seismic isolation of this historic building. These bearings, constructed of alternating layers of steel and rubber, are very stiff vertically, but very flexible laterally. They are designed ro lessen the dynamic forces by lowering the natural frequency of the building while the displacement is increased. The lead core in the bearings will provide damping of the building motion.
In order to monitor the performance of the base isolation system, in March of 1997 we installed 3-component seismic recorders both on the foundation, below the base isolation and on the first floor. At each sire, we deployed the Teledyne Geotech S-13 seismometers for weak morion, and the Kinemetrics FBA-I 1 accelerometers for strong morion recording. The digital data was recorded continuously on a SUN workstation. During the course of20 months we recorded many small earthquakes and the M4.9 Incline Village earthquake on October 30, 1998 with a horizontal Peak Ground acceleration of 0.036 g. Preliminary analyses indicate that, in general, the base isolation system strongly filters high frequencies of ground motions. We observe no significant differences between the vertical components of the data recorded below and above the bearings. The spectral ratios of the horizontal components of the data recorded above and below the isolation system indicate filtering of high frequencies (above 4 hz). They also show a strong nonlinearity recognized by a major shift of the peak response of the building ro lower frequencies for the larger event.
Seismological Research Letters Volume 70, Number 2 March/April 1999 217

Evidence for Vertical Ground Accelerations Exceeding Gravity during the 1997 Umbria-Marche (Central Italy) Earthquakes BOUCHON, M.(*), GAFFET, S.(**), CORNOU, C.(*), DIETRICH, M.(*), GLOT, J.P.(*), COURBOULEX, F. (**),CASERTA, A.(***), CULTRERA, G.(***), MARRA, F.(***), and GUIGUET, R.(*), (*) UniversiteJoseph Fourier, 38041 Grenoble, France,(**) Geosciences Azur, Sophia-Antipolis, 06560 Valbonne, France, (***) Istituto Nazionale di Geofisica, 00143 Rome, Italy
We found extensive evidence that the vertical ground accelerations produced during the largest shock (M~6.0) of the 1997 Umbria-Marche (central Italy) earthquake sequence exceeded lg in two areas close ro the heavily-damaged villages of Annifo and Colle Croce. This evidence comes from the striking observation of thousands of freshly fractured and broken rocks and stones in these areas. Some of the broken stones lie isolated on soft detritic soil while others had been previously piled up, probably a long rime ago, to clear the fields for farming. The freshness of the cuts and fractures and the consistency of the observations for thousands of rocks and stones in these areas indicate that these rocks were thrown upwards during the earrhq uake, with breakage occurring at the time of impact. Ground motion calculations consistent with the static deformation inferred from GPS and interferometry data, show that the broken stones and rocks are found in the zone where the strongest shaking took place during the earthquake and that most of the shaking there was vertical.
Seismic Characterization of Tunneling Activity at the Yucca Mountain Exploratory Studies Facility STECK. L.K., PEHLER, M.C., BAKER, D.F., EDWARDS, C.L., and COGBILL, A.H., Seismic Research Center, Los Alamos National Laboratory, Los Alamos, NM 87545, USA, [email protected]
In order to characterize the seismic wave field associated with tunneling and other activities at the Yucca Mountain Project Exploratory Studies Facility (ESP), eight seismometers were deployed around the facility from December 1996 through January 1997. The seismic stations consisted of three-component L-4 sensors recording on Ref Tek Digital Acquisition Systems (DASs) at 500 samples per second. A combination of continuous and timed recording was used. Six of the stations were deployed on a five km long, north-south line parallel to and slighrly east of the main loop of the ESE The other two instruments were placed along the north ramp: one at the north portal itself, the other about 0.6 km inside the tunnel in alcove #3. During the time period of the deployment, tunneling progress was limited to about 1-2 m per day at best. Nevertheless, we have identified a few episodes of tunnel boring machine (TBM) activity. The TBM signal extends from roughrly 5-50 Hz. We tentatively associate a spectral peak near 19 Hz with the ventilation system. Clear, recurrent, high-frequency signals (90-250 Hz) are the DASs writing data to magnetic disk every 300 sec. Spectral peaks at 30, 60, and 90 Hz are related to electrical power. At stations nearest to the TBM we see a number of as-yet-unexplained spectral peaks. Seismic sources within the ESP include the TBM, the ventilation system, the power system, conveyor belts used for earth removal, a diesel trolley system, and other human activity.
Monday A.M., May 3, 1999-Rainier Room Posters Volcano Dynamics and Seismology I
Multiplet Analysis at Alaskan Volcanoes T.A. POWER, Alaska Volcano Observatory, U.S. Geological Survey, 4200 University Dr. Anchorage, AK 99508, 907-786-7426, [email protected], S.C. MORAN, Alaska Volcano Observatory, U.S. Geological Survey, 4200 University Dr. Anchorage, AK 99508, 907-786-7462, [email protected], J.M. LEES, Department of Geology and Geophysics, Yale University, P.O. Box 208109, New Haven, CT, 06520-8109, 203-432-6947 [email protected]
The Alaska Volcano Observatory has recorded many seismic swarms at monitored Alaskan volcanoes in the past decade. Events with similar waveforms at the same stations (multiplets) have occasionally been observed during the routine processing of these swarms. However, no quantitative analysis has been performed to determine the significance of these qualitative observations. Preliminary results are presented from a cross-correlation analysis that we are currently performing at several Alaskan volcanoes, including Mount Spurr,
Iliamna Volcano, the Katmai Group (including Novarupta, Trident Volcano, and Mounts Martin, Mageik, and Katmai), and Akutan Volcano, where multiplets either have been observed or are suspected. To isolate potential multiplets, we use cross correlation of 0.8 and higher and equivalence class analysis. Relative locations are calculated using phase shifts between all events in a particular multiplet and one master event from the same multiplet. Phase shifts are estimated using multi-taper spectrum methods which provide error estimates for establishing confidence bounds.
Using this technique, we have identified multiplets at Spurr, the Katmai group, and Akutan Volcano. Relocated events are distributed over a much smaller volume than the original locations. In some cases, where station geometry has changed due to station outages, new installations, etc., application of this technique has resulted in significant changes in locations of events in a multiplet that had poorly constrained original solutions. Using similar cross-correlation techniques we hope to develop the capability to produce higher-quality relative locations of multiplets in near-real-time, so that more informed interpretations of their significance can be made during volcanic swarms.
Earthquake Swarms at Mount Hood: Relation to Geologic Structure NORRIS, R.D., WEAVER, C.S., and MEAGHER, K.L., U.S. Geological Survey, Seattle, WA 98195, [email protected], [email protected], [email protected], and QAMAR, A., University ofWashington, Seattle, WA 98195, [email protected], and BLAKELY, R.J., U.S. Geological Survey, Menlo Park, CA 94025, [email protected]
Mount Hood has traditionally been considered one of the more hazardous volcanoes in the Pacific Northwest. Analyses of seismic refraction data, SLAR images, and aeromagnetic data indicate that Mount Hood and several ancestral Pliocene eruptive centers grew within local subsidence blocks nested within the High Cascades graben. The subsidence blocks are crossed by a series of northwest-striking, right-lateral strike-slip faults, which are part of a much larger system of such faults across the Pacific Northwest.
Continuous seismic monitoring of Mount Hood since November, 1977 has yielded a two-decade sample of background seismicity in its current state of repose. Mount Hood is unusual among the Cascade volcanoes in that it has been a significant source of small earthquake swarms in an area of low regional seismicity; with the exception of Mount St. Helens during the 1980s, the rate of seismicity near other Cascade volcanoes has generally been similar to the regional rate. Data from the Pacific Northwest Seismograph Network show that the swarms occur an average of about once a year, last from a few hours to a few days, and the magnitudes of the largest events are usually <3.5. The epicentral locations define several small clusters 4-7 km south of the summit, mostly within the boundary faults of the subsidence blocks. Focal mechanisms from larger events in the swarms range from nearly purely strike-slip to normal faulting; although the strike of the nodal planes varies considerably, these mechanisms are consistent with the types of movement observed along the mapped and inferred faults near Mount Hood.
VOLCANIC TREMOR DURING ERUPTIONS McNytC S.R. an<l Tytgat. G., Alaska Volcano Observatory. Geophysical Institute. University of Alaska Fairbanks. 903 Koyukuk Dr., P.O. Box 757320. Fairbanks, AK 99775-7320. (907) 474-7 I [email protected], [email protected]
Volcanic tremor during eruptions provides mformation about the sJze af'ld type of eruptions. Tremor ilmpliludes, normaJized 10 reduced displacemenls (rmJ amplitude x distance). arc proporlional to the Volcanic Explo~ivily Index (VEI). which characterizes eruptions bascc.l on tephra volume, ash column height, .etc. The present data set of 38 eruptions from 25 volcanoes spans six orders of magnitude in VEI. and three orders of magnitude in rcc.luced displacements. Systematic scatter in the data, which is about a factor of 3. c..111 be explained using data from Redoubt Volcano, Alaska. Redoubt had a ~cries of eruptions in 1989-1990 with two main types: pumice eruptions and dome collapses. All the pumice eruptions pro<luced about 2x stronger tremor for the same volume of tcphra lhan the dome colhlpse eruptions. The most gas-rich pumice eruption (February 15, 1990) .Jlso followed the longest repose period and produced the strongest tremor. We computed total seismic energie.!> for the Redoubt eruptions using rm.\·
amplitude squared. corrected for noise. These measurements provide a hetter physical ba,is for comparis,.)n than durations alone, which have previously been used to paramctc1izc the eruptions. The three eruptions of Mt. Spurr. Ala . ..,ka in 1992 were all accompanied by tremor of reduced displacements 16-30 cm2 , which correlated with tcphra volume and S02 from TOMS data. Ash column heights and eruption durations, on the other hand. were quite similar. Tremor amplitudes were proportional to lava fountain heights for a numher of volcanoes, including Kilauea, P":1vlof. Pacaya, ~nd Vesuvius. Higher gas contents in the lava, and fissure vcm geometries produced hLgher tremor amplitudes for the same fountain heights. Seismic efficiencies of tremor are about I percent for fi~~u1e~ and lower for cylindrical vents. The largest known instrumentally measured tremor amplitudes were 1070 cm2 at Mt. Pinatubo. on June 15, 1991. and 2380 cm:! at lzu-Oshima. November 2 I, I 986. All these observations demonstraLc the value of volcanic tremor amplitude measurements in characterizing eruptions. Therefore, plots of reduced displacement versus time for 20 volcanoes are ~ow mad~ in near-rcallimc and displayed on the Alaska Volcano Ob~ervatory world wide web mternal page.
218 Seismological Research Letters Volume 70, Number 2 March/April 1999

Monday P.M., May 3, 1999-0lympic Room Pacific Northwest Earthquake Hazards and Tectonics II Presiding: Roy Hyndman and Michael Fisher
Structure of the Seattle Basin: A Tomographic Model Using Data from the 1998 Seismic Hazards Investigation in Puget Sound (SHIPS) Experiment Washington State ' BROCHER. T.M., PARSONS, T., FISHER, M.A., U.S. Geological Survey, 345 Middlefield Rd., MS 977, Menlo Park, CA 94025, [email protected]. gov; TEN BRINK, U.S., MOLZER, P.C., U.S. Geological Survey, Woods Hole, MA 02543; CREAGER, K.C., CROSSON, R.S., Dept. of Geophysics, Box 351650, University ofWashington, Seattle, WA 98195; TREHU, A.M., College of Oceanic and Atmospheric Sciences, Oregon State University, Corvallis, OR 97331; MILLER, K.C., Dept. of Geologic Sciences, University ofTexas, El Paso, TX 79968; PRATT, T.L. and WEAVER, C.S., U.S. Geological Survey, University ofWashington, Seattle, WA 98195.
We present a 3-D model for the geometry of the Seattle Basin based on a tomographic inversion of first-arrival travel times of airgun signals recorded during the 1998 Seismic Hazards Investigation in Puget Sound (SHIPS) study. For this inversion, we used first-arrival times for airgun lines in Hood Canal, Puget Sound, and Lake Washington recorded by more than 80 Refteks deployed throughout the Puget Lowland. We compare the tomography model to SHIPS seismic reflection profiles, industry borehole logs, and laboratory measurements of seis_mic velocities for rocks exposed in the Puget Sound region. Preliminary 111vers1ons reveal low-velociry zones (2. 5 ro 6 km/s) associated with the Tacoma, Seattle, and Everett basins. Velocity isoconrours within the Seattle basin are asymmetric and, in agreement with seismic reflections from within the basin, dip southward toward the Seattle fault. The tomography model compares favorably to sonic log velocities in three wells on the northern flank of the Seattle basin; both types of data indicate that compressional wave velocities close to 3.5 km/s characterize much of the Eocene sedimentary basin fill. Laboratory measurements indicate that the Siletz volcanic rocks beneath these basins have compressional wave velocities higher than 6 ro 6.5 km/s. If the 6-km/s contour represents the top of seismic basement, then the Seattle basin reaches a maximum thickness of about 9 km beneath Puget Sound whereas the Tacoma basin is 6 km thick. The romography model indicates that the Seattle basin extends from Hood Canal eastward ro a point about 35 km east of Puget Sound. The 6-km/s contour rises at the Seattle faulc, on the southern flank of the basin, ro 5 km, and beneath the Kingston Arch, on the northern flank of the basin, co 7 km. Compressional-wave velocities between 6.5 and 7 km/s characteristic of the Siletz volcanic rocks at depth can be traced from the base of the sedimentary rocks in the Tacoma and Seattle basins to depths of at least 15 km.
Ground Shaking in the Puget Lowland, Western Washington State, from Earthquakes Recorded on the SHIPS Land Geophone Array PRATT. T. (USGS, School of Ocean., Univ. ofWA, Seattle, WA, 98195; 206-543-7358; [email protected]}; BROCHER, T., PARSONS, T., FISHER, M. (USGS, 345 Middlefield Rd., Menlo Park, CA 94025); CREAGER, K., CROSSON, R. (Geophysics Dept., Univ. ofWA, Seattle, WA 98195); WEAVER, C. (USGS, Geophysics Dept., Univ. ofWA, Seattle, WA 98195); HYNDMAN, R. (Geological Survey of Canada; Pacific Geoscience Center, Sidney, BC, Canada, V8L 4B2}; TREHU, A. (College of Oceanic and Atmospheric Sci., Oregon State Univ., Corvallis, OR 97331); MILLER, K. (Dept. of Geological Sci., Univ. ofTX, El Paso, TX 79968); TEN BRINK, U.S. (USGS, Woods Hole, MA 02543)
We analyzed recordings from three M2. l ro M2.8 earthquakes chat occurred while the approximately 150 SHIPS seismic instruments were deployed over che 100-km by 120-km Puget Sound region. Two of these events were M2.l and M2.3 earthquakes located near the center of the SHIPS array (near Seattle} and the 3rd was a M2.8 event about 50 km south of the array. Only the stations with L28, 4.5 Hz geophones were used after filtering ro a Oto 16 Hz bandpass. For each earthquake at each receiver we determined the peak amplitude, rms amplitude and average absolute amplitude of 20 sec time windows that included the largest-amplitude arrivals from the earthquakes. We corrected these amplitudes for spherical spreading and attenuation. Relative shaking maps were constructed by categorizing the amplitudes at each receiver as: 1) more than 1/2 of a standard deviation above the average, 2) within 1/2 of a standard deviation above the average, 3) within 1/2 of a standard deviation below the average, and 4) more than 1/2 of a standard deviation below the average. All
three ~arthq~akes and the average of the 3 earthquakes show a similar map pattern, md1catmg th~t the ~eceiver sites have characteristic relative amplitudes. The strongest shak111g dunng these events occurred along rhe Cascade foothills, 111 the Tacoma-Olympia area, and on the wesr side of Puget Sound north of Seattle. Relatively low shaking occurred in che Seattle ro Everett urban corridor. Further analysis is being done to compensate for source effects (focal mechanisms) and to examine smaller frequency ranges.
Tect~nic_Setting and Earthquake Hazards of the Seattle Fault, Washington: lmphcat1ons from High-resolution Aeromagnetic Data BLAKELY. R.J., and WELLS, R.E., USGS, Menlo Park, CA 94025, [email protected], [email protected]; WEAVER, C.S., USGS, Seattle, WA 98195, [email protected]; and JOHNSON, S.Y., USGS, Denver, CO 80225, [email protected].
New, high-resolution aeromagnetic data from the Puget Lowland provide an un~recedented view of subsurface geology beneath this poorly exposed forearc bas111. Flown 250 m above terrrain, the survey highlights important structures that accomodate contemporary arc-parallel, northward migration and shortening of the Cascadia forearc. The Seattle fault is an active but largely concealed east-west zone of reverse faulting that forms the southern margin of the Seattle basin. Magnetic anomalies over the uplifted Bremerton-Tukwila block south of the Seattle faulc are striking in their correlation with exposed geology and their continuity beneath glacial deposits. A pronounced set of three subparallel, eastwest anomalies can be correlated over a distance of 50 km with the stratigraphic sequence 111 the steeply north-dipping hanging wall: (1) Over most of this distance, a narrow, elongate magnetic high correlates precisely with a Miocene volcanic conglomerate mapped on Bainbridge Island. (2) A broad magnetic low, on the south side of the conglomerate anomaly and traceable a similar distance, correlates with mapped nonmagnetic marine sediments of Oligocene and Eocene age. (3) A broad, complex magnetic high over much of the Bremerton!ukwil~ uplift correlates ~ith_Eocene volcanic basement. This tripartite package 1s especially clear over Ba111 bndge Island west of Seattle and over the region east of Lake Washington. Although attenuated in the intervening region, the pattern can be correlated semi-continuously with the mapped strike of beds around a northwest-striking anticline beneath the City of Seattle. The aeromagnetic and geologic data constrain three main strands of the Seattle fault, as identified in marine seismic reflection profiles, ro be subparallel to mapped bedrock trends over a distance of 50 km, a length consistent with the M 7 earthquke 1100 years ago.
The June 23, 1997 Bainbridge Island, Washington, Earthquake: Evidence That the Seattle Fault is Seismically Active WEAVER, C.S., MEAGHER, K.L., U.S. Geological Survey, Geophysics Program Box 351650, University of Washington, Seattle, WA 98195, [email protected]; QAMAR, A., Geophysics Program, University of Washington, Seattle; BLAKELY, R.J. and WELLS, R.E., U.S. Geological Survey, Menlo Park, CA.
Crustal earthquakes in rhe central Puget Sound basin have been difficult ro relate to Quaternary fault zones, even though ample paleoseismic evidence suggests Holocene earthquakes on the Seattle fault and elsewhere. In part this difficulty reflects the face that most earthquakes in the central basin occur below 15 km "."her_e fault locations are uncertain and in part the face rhac che earthquake d1stnbunon below about 15 km is complex. On June 23, 1997, a magnitude 4.9 earthquake occurred 12 km west of Seattle, just west of Bainbridge Island. The earthquake was unusual in two respects. First, ir was a shallow event (8 km deep) and of magnitude 4.9 in an area where few shallow events of any magnitude are known. Second, although the hypocenter was within che Seattle fault zone, the focal mechanism indicated faulting on a near-vertical fault plane, with the north side moving up. This sense of motion is opposite that expected.
New aeromagnetic data collected over the Puget Sound basin improved the understanding of the location of rhe Seattle fault. These data, combined with marine sdsmic interpretations and geologic mapping have been used to suggest rhe locanon of three strands of the Seattle fault. Using that model, the Bainbridge Island earthquakes are part of a diffuse zone of shallow earthquakes in western Puget Sound that follows the aeromagneric structure associated with the middle strand of the fault. On magnetically and seismically constrained cross-sections perpendicular to this structure, most shallow crustal earthquakes from about Bremerton ro Lake Washington fall in a eight vertical zone beneath the strand or cluster just north of the mapped leading edge of the Seattle fault. East of Lake Washington, this pattern breaks down, and shows a much wider areal distribution of shallow events. We conclude that the Seattle fault zone is more seismically active than previous recognized, and that most shallow ( <15
Seismological Research Letters Volume 70, Number 2 March/April 1999 219
km) events west of Lake Washington are associated with the fault. The complications east of Lake Washington may reflect changes in deep crustal strucrure along the fault, perhaps near the change in the earthquake distribution.
Modeling the Effect of the Puget Basin on Strong Ground Motions from Earthquakes on the Seattle Fault PITARKA, A., SMITH, N.F., GRAVES, R.W., and SOMERVILLE, P., URS Greiner Woodward Clyde, Pasadena, CA 9110 l, [email protected]
Recent damaging crustal earthquakes and seismic reflection images of the crust in the Puget Sound region are beginning to more clearly define the seismic hazard potential in the Seattle area. In particular, geological and geophysical studies (Johnson, 1998; Pratt et al., 1997) suggest chat the Seattle fault may generate earthquakes as large as M7.6. We developed a preliminary model of the basins in the Puget Trough based on structural models and available geophysical and geotechnical information. As a first step in the ongoing process of testing the adequacy of the basin velocity model we simulated ground motion from the 23 }llne, 1997 Bremerton earthquake (M=4.9) recorded by portable digital stations in urban Seattle and operated by the USGS. The simulated waveforms (0.1-1.0Hz) suggest that the extended durations of the observed ground motions at sediment sites are related to the trapping and focusing of seismic energy within the Puget Sound basin. To investigate the effect of the basin response and the source process on strong ground motion in the Seattle area we performed simulations for a hypothetical crustal earthquake of magnirude Mw6.5 on the Seattle fault. Velocity seismograms at frequencies 0.1-lHz were calculated using a 30 finite difference method with variable grid spacing and several slip models. The simulations demonstrate the amplification and increase in duration of the ground motion in the central part of the basin in downtown Seattle, which lies above the basin edge formed by the fault. Comparisons with simlllations performed with flat layered reference models suggest that the subsurface geometry controls the distribution of ground motion amplirudes arollnd the Seattle fault similar to what has been observed in Kobe and Santa Monica.
Evidence for Quaternary Neotectonics in the Marine Record of the Pacific Northwest and Southwestern British Columbia MOSHER, O.C. (Geological Survey of Canada, Sidney, BC, Canada V8L 4B2; [email protected]), JOHNSON, S.Y., and DADISMAN. S.V, (United States Geological Survey, Denver, CO 80225; [email protected], [email protected]), HYNDMAN, R.D. (Geological Survey of Canada, Sidney, BC, Canada V8L 4B2; [email protected]), FISHER, M.A. (United States Geological Survey, Menlo Park, CA 94025; [email protected]) and Scientific Personnel from SHIPS'98 Expedition
The eastern Strait of Juan de Fuca and Strait of Georgia span a concentration of modern crustal seismicity which extends northwards from Puget Sound. The region lies in a north-south compressional tectonic regime in addition to a westeast subduction setting. Geologic evidence of earthquakes can provide important information for earthquake hazard assessment. A range of seismic reflection data, including ultra-high resolution boomer, high resolution single channel airgun, high resolution multi-channel seismic (MCS), industry seismic, and SHIPS MCS data have been used in the eastern Strait of Juan de Fuca to map the surficial and subsurface geology. These data have been integrated with other regional geophysical and geological data. Particular emphasis has been placed on identifying structural elements, faults and other deformation features that are indicative of tectonic and neotectonic activity.
The eastern Strait of Juan de Fuca overlies a major crustal boundary that juxtaposes Eocene marine basaltic basement rocks and pre-Tertiary rocks of southern Vancouver Island, the San Juan Islands, and North Cascades. The boundary, represented by rhe Leech River fault on southern Vancouver Island, splays into a distributed zone of deformation in the Strait of Juan de Fuca that includes the Trial Island/Devil's Mountain Fault, the southern and northern Whidbey Island faults, and structures that cut the northeastern Olympic Peninsula. The region was intensely glaciated during the Pleistocene, significantly affecting Quaternary sedimentation and the seafloor morphology. Seismic reflection profiles show reverse and normal offsets along faults in both bedrock and the Quaternary section. In a few places, the post-glacial (latest Pleistocene to Holocene) section is cur by faults that displace reflectors several meters. More commonly, the post-glacial section near faults is characterized by zones of warped reflectors and vertical pipes that may be similar to large liquefaction structures viewed in adjacent coastal bluff exposures of Pleistocene sediments. Seismic-reflection data are consistent, therefore, with recent (post-glacial) tectonism.
Neotectonics of the Devils Mountain Fault and Northern Whidbey Island Fault, Eastern Strait of Juan de Fuca and Northern Puget Lowland, Washington JOHNSON, S.Y., and DADISMAN, S.V, (U.S. Geological Survey, Denver, CO 8022~ USA· sjnhnsnn@lghrmail er usgs g0v. [email protected]). MOSHER, D.C. (Geological Survey of Canada, Sidney, BC, Canada VBL 4B2; [email protected]), BLAKELY, R.J., and CHILDS, J.R., (U.S. Geological Survey, Menlo Park, CA 94025; [email protected], [email protected]), and RHEA, S.B. (U.S. Geological Survey, Denver, CO 80225; [email protected])
We are developing and using extensive geologic and geophysical databases to document the locations, lengths, geometries, and histories of active faults in western Washington. The west-trending Devils Mountain fault forms the northern boundary of the Everett basin and coincides with large aeromagnetic and gravity anomalies that can be traced for more than 100 km from rhe Cascades foothills across the Puget Lowland to southern Vancouver Island. Highresolution marine seismic-reflection profiles reveal that this fault is a north-dipping reverse or thrust fault that dips 45° to 70° in the upper 1 km. Quaternary deposits are truncated and (or) warped along the fault and in several northwesttrending contractional faults and folds in the hanging wall north of the fault. On northern Whidbey Island, dips in rare exposures of Quaternary strata near the projected fault trace are as steep as 35°. Logs from Whidbey Island water wells adjacent to the fault reveal a change in elevation in late Pleistocene stratigraphic markers across the fault trace. From the elevation changes and the fault geometry deduced from the marine seismic data, we estimate an approximate lace Quaternary vertical slip rate of 0.2 to 0.3 mm/year. Because this estimate does not account for possible lateral fault slip (suggested by the orientation of hanging-wall structures), it represents a minimum rate.
The west-northwest trending northern Whidbey Island fault lies 2-l O km south of the Devils Mountain fault on the northern flank of the Everett basin. Seismic-reflection data reveal chat the fault consists of two near-vertical splays that converge to the northwesr, bound an uplifred block of pre-Tertiary basement (exposed on the west coast ofWhidbey Island), and coincide with lowamplitude aeromagneric anomalies. Both splays truncate and (or) warp Quaternary strata. Rare coastal bluff exposures of Quaternary deposits along these splays are variably faulted and warped, consistent with the seismic-reflection evidence of Quaternary deformation. Analysis of logs from water-well adjacent to the northern Whidbey Island fault is presently underway and may help constrain Quaternary deformation rates.
Phase Changes, Fluids and the Colocation of the Deep and Shallow Seismicity beneath Puget Sound and Southern Georgia Strait ROGERS, G.C., Geological Survey of Canada, Pacific Geoscience Centre, P.O. Box 6000, Sidney, B.C., V8L 4B2, Canada, [email protected]
The majority of contemporary seismiciry in the Cascadia subduction zone occurs in one location: straddling the international border, adjacent to the change in trend of the North American coastline from north-south to northwest-southeast. This is true in both the subducting oceanic Juan de Fuca place and in the overlying continental North American plate. Why is the region of crustal seismicity located directly above the subcrusral seismiciry and why is the areal exrent very similar, even though rhe two regions are decoupled and have very different stress regimes' The upward migration of fluids offers a potential explanation. In the subducring oceanic crust, the phase change from basalt to
eclogite is coincident with the region of seismiciry. This phase change creates extensional stress in the subducting oceanic crust and alters the subducting plate buoyancy from positive to negative, adding to the tension near the upper surface. The phase change from hydrous metababasalt to eclogite also releases water. In warm subduction zones such as Cascadia, chis phase change takes place over a very narrow range in the down-dip direction. The broad arch in the subducting plate, created by the change in the orientation of the subducting margin, allows margin parallel migration of fluids to the highest region: beneath Puget Sound and southern Georgia Strait. The crustal seismiciry in the North America plate is characterized by patterns and lineaments, but there is licrle evidence of fault planes aligning with spatial trends of epicentres. Instead, most crustal seismicity seems to be occurring on random faults, all responding to the same regional stress. Seismicity induced by fluid injection often e,chibits this characteristic. Recent seismic tomography results delineate a low velocity region extending through the crust just north of Vancouver that is coincident with a shallow heat source that has been attributed to hot fluids. This evidence is consistent with seismicity being related co fluid migration between the plares_ Geochemical studies of crustal fluids in the regions of seismiciry may be the most effective way to test this hypothesis.
220 Seismological Research Letters Volume 70, Number 2 March/April 1999

The June 24, 1997 M=4.6 British Columbia Earthquake: Shallow, Thrust Faulting beneath the Strait of Georgia CASSIDY. T.F., ROGERS, G.C., and HORNER, R.B., Geological Survey of Canada, Pacific Geoscience Centre, P.O. box 6000, Sidney, B.C., CANADA, V8L 4B2, [email protected], WALDHAUSER, F., United States Geological Survey; 345 Middlefield Road, MS977, Menlo Park, California, 94025.
On June 24, 1997 at 14:40 UTC, a magnitude 4.6 earthquake occurred 3-4 km beneath the Strait of Georgia, British Columbia, about 30 km from the urban core of Vancouver, and midway between Vancouver and Nanaimo. This earthquake was felt throughout the greater Vancouver area, and most of southern Vancouver Island. It was preceded (by 11 days) by a M=3.4 event, and was followed by numerous small (Md.7) aftershocks. The location of these events is one of persistent shallow seismic activity beneath the Strait of Georgia. In 1975 a M=5 earthquake occurred at this site and there have been several small felt events since then.
Both P-nodal and CMT solutions indicate that the 1997 mainshock, and foreshock were thrust evenrs, similar to mechanism of the 1975 event. We have relocated the 1997 mainshock, foreshock and 70 smaller aftershocks to identify the fault plane, and the extent of rupture. Using a waveform cross-correlation technique and joint hypocentral determination, we have determined accurate relative hypocentres. The relative locations of these events defines a small (less than I km diameter) area. The aftershocks delineate a NNW-dipping plane at a depth of 3-5 km, and a dip angle of 40-50 degrees, in good agreement with the focal mechanism solutions. This is the first time that well-located aftershocks have been combined with focal mechanism ro define an active fault plane in the vicinity of the urban areas of southwestern British Columbia.
Relocation of Earthquakes in the Leach River Fault Region of Vancouver Island, BC MULDER, T.L. and ROGERS, G.C., Geological Survey of Canada, Pacific Geoscience Centre, P.O. Box 6000 Sidney BC V8L 4B2, Canada, [email protected]
The Leach River Fault is a major feature on southern Vancouver Island that thrusts Eocene oceanic crust beneath the older rocks of Vancouver Island. It is expressed by a highly eroded linear east-west valley that crosses Vancouver Island, it forms the linear waterfront of the city of Victoria and it has been detected by marine seismic work as it heads across the Strait of Juan de Fuca into Puget Sound. The fault figures as a key element in many Tertiary tecronic models of the region. Routine location of earthquakes shows many epicentres scattered about the surface trace of the fault. A suite of earthquakes in the vicinity of the fault near the city ofVicroria were relocated using a balanced distribution of seismograph stations and a local velocity model consistent with the results from the Lithoprobe seismic studies that crossed the fault in chi,; region. The relocated events are all in the footwall of the fault with no events appearing to be on the fault trace. None of the focal mechanisms that could be determined show any alignment with the fault. Instead, fault planes appear random and the faulting is a mixrure of thrust and strike-slip events. The alignment of the principal axes of stress in a north-northwest direction appears to be the only common feature and is consistent with the orientation of the regional tectonic stress for southwestern BC. From the examination of this suite of earthquakes there is no indication that the fault is currently active.
A CHARACTERIZATION OF SEISMIC SOURCES IN WESTERN WASHINGTON AND NORTHWESTERN OREGON WONG, I. G .. Seismic Hazards Group, URSG Woodward·Clyde Federal Services, 500 121
h
Street, Oakland, CA 94607, [email protected]; PEZZOPANE. S. K. U.S. Geological Survey, Denver, CO 80225; BLAKELY, R. J., U.S. Geological Survey, Menlo Park, CA 94025
As part of an effort to develop probabilistic ground shaking microzonation maps for the Ponland and Seattle metropolitan areas, known crustal faults, areal seismic source zones (to account for buried crustal faults and background earthquakes). and the Cascadia subduction zone (mcgathrust and intraplate zones) in western Washington and northwestern Oregon have been characterized. For each seismic source. its seismogenic capability, geometry including possible fault segmentation, Mma-~, recurrence model, and slip rate/recurrence intervals have been assessed. The uncertainties in these source parameters are significant because few fault zones west of the Cascades have been studied. In particular, slip rates may be uncertain by an order of magnitude or more.
A total of 46 faults have been characterized, mostly in northwestern Oregon. However, the activity of most crustal faults particularly in western Washington is not well defined due largely to the lack of exposure in late Pleistocene and younger units. Mmn ranges from M\.\ 6 1!.. to 71
/4 and slip rates from about 0.05 to 1 mm/yr. Of particular importance to the Ponland and Seattle areas in terms of probabilistic hazard, are the local faults. The Portland Hills and Oatfield faults in Portland are characterized based on limited geologic investigations, aeromagnetic analysis, and some seismicity studies. The characterization of the Seattle and south Whidbey Island faults in the Seattle area is derived largely from USGS marine seismic reflection studies and acromagnetic and gravity data although the Seattle fault has been the focus of several paleoseismic investigations.
For the Cascadia subduction zone, Mmd, ranges from Mw 81/4 to 9 for the megathrust and M" 7 to 7 Y2 for the intraplate zones. Megathrust recurrence intervals of 450 ± 200 years are based on numerous coastal paleoseismic studies. The historical seismicity record was used to characterize the activity of the intraslab. Areal source zones include both localized zones of crustal scismicity such as the St. Helens, Western Rainier, and Goat Rocks zones and regional source zones. The latter are based on the tectonic block model of Wells et al. ( 1998). Mma, for the regional source zones ranges from Mw 6~ to 7 due to the rclativelv thick seismogenic crust (20-30 km) in the region west of the Cascades. ·
A Stochastic Source Model for Estimating Local Tsunami Hazards GEIST, E.L., U.S. Geological Survey, Menlo Park, CA 94025, [email protected]
The local tsunami wavefield associated with major subduction zone earthquakes is highly dependent on the spatial heterogeneity of coseismic slip. In particular, variations of slip in the dip direction have a large influence on wave height and wave steepness of the local tsunami. Because of this dependency, it is difficult to estimate the local tsunami hazard for future events. A stochastic source model is proposed in which the slip distribution for a given rupture area is randomly varied, but constrained to match the observed fractal dimension for most earthquakes. The static vertical displacement field calculated from superimposed point-source elastic dislocations provides initial conditions for tsunami propagation. The tsunami wavefield as a function of time is calculated from a finitedifference approximation to the shallow water wave equations, with reflection boundary conditions at the shoreline. Using the Pacific Northwest as a test area, Monte Carlo simulations are run for a large number of sources to determine average and maximum near-shore wave amplitudes. For shoreline locations broadside from the rupture area, the first arrival is often largest. For shoreline locations oblique to the rupture area, however, the propagation and scattering of coastal-trapped edge waves with slower group velocities than non-trapped modes often result in large wave amplitudes after the time of first arrival. Thus, the average time between the first arrival and the arrival with maximum amplitude for a large number of sources can yield information on the relative importance of edge waves on local tsunami hazards. Results from this study indicate that local tsunami hazards are better defined by incorporating the expected diversity of slip distributions derived from a stochastic source model rather than using uniform slip dislocations derived from scenario earthquakes.
Monday P.M., May 3, 1999-Fidalgo Room Volcano Dynamics and Seismology II Presiding: Jonathan Lees and Jeffrey Johnson
Location of the Seismovolcanic Source at Stromboli Volcano Using Two Seismic Antennas LA ROCCA, M., Universita di Salerno, Via Salvador Allende 84081 Baronissi (SA), e-mail [email protected]; DEL PEZZO, E., Universita di Salerno, Via Salvador Allende 84081 Baronissi (SA), Osservatorio Vesuviano, Via Manzoni 249, 80123 Napoli; [email protected]; PETROSINO, S., Osservatorio Vesuviano, Via Manzoni 249, 80123 Napoli; SACCOROTTI,
Seismological Research Letters Volume 70, Number 2 March/ April 1999 221

G., Universita di Salerno, Via Salvador Allende 84081 Baronissi (SA); IBANEZ, J., ALMENDROS, J., ALGUACIL, G., CARMONA, E., Instiruto Andaluz de Geofisica, Campus Universitario de Cartuja sin, Universidad de Granada-Spain
ln .)eptember 1997 two short period seismic antennas were installed at Stromboli volcano (Southern Italy) with the main aim of space location of the explosion quake source in the frequency band 1-5 Hz. The first antenna was installed at Semaforo Labronzo (northern flank of Stromboli) and consisted of 26 vertical component and two 3-D seismometers. The second antenna was deployed at Timpone de! Fuoco site, (close to Ginostra village, western flank of Stromboli), and it was composed by 15 vertical component and three 3-D seismometers. Both the antennas had an aperture of about 300 meters.
Several tens of explosion quakes triggered both the antennas simultaneously and were analyzed using rhe Zero Lag Cross-correlation method (ZLCC) obtaining ray parameter and back-azimuth as a function of time. Slowness spectra calculated at both arrays for several time windows sliding along the seismograms track the seismic source in 4 frequency bands centered at 1, 2, 3 and 4 Hz, with 1 Hz bandwidth. Synthetic ray parameters and backazimurh were then generated for each node of a 3-D grid encompassing the whole volcano. An approximate ray tracing in 3-D was used to perform this task, using a velociry model which includes the results obtained from the velociry dispersion of surface waves for the shallowest 200 meters thick layer, carried out in the same array sites, and reasonable velociry values elsewhere. The search for the grid node whose ray parameter and backazimuth minimize, in the least square sense, the difference between synthetic and experimental slowness spectra for both the arrays, furnish the spatial position of the source.
Results show that the most probable source volume lies below the crater area. Some coherent phases are observed in the late coda of the seismograms, showing the presence of coherent back-scattered arrivals. The pre-event noise is also well correlated in the investigated frequency range, showing slowness vectors similar to those observed for the explosion quakes.
Recent Work and Future Directions in Short-period Volcano Seismology MORAN, S.C., Alaska Volcano Observarory, US Geological Survey, 4200 Universiry Dr., Anchorage AK, 98508, [email protected], POWER, J.A., Alaska Volcano Observatory, US Geological Survey, 4200 University Dr., Anchorage AK, 98508, [email protected]
Recent work at frequently active volcanoes such as Kilauea, Karymsky, Stromboli, and Soufrierre Hills has shown that the use of seismic instruments such as broadband seismometers and acoustic geophones can provide important information about volcanologic phenomena. However, the majoriry of networks at seismically monitored volcanoes worldwide consist dominantly, and in many cases exclusively, of short-period, usually vertical-component, seismometers. Short-period seismometers will likely be in use at most monitored volcanoes for the next 10 ro 20 years, especially at infrequently active and/or remote volcanoes, particularly in developing countries and in places like the Aleutian arc, where logistics are difficult and deployment costs are high. Thus it is equally important for volcano seismologists to continue developing new methods for interpreting information about volcanologic processes from short-period recordings, as well as from other types of instruments.
In this talk we present examples from recent and on-going studies at volcanoes such as Mount St. Helens, Mount Rainier, Mount Spurr, Mount Redoubt, the Katmai Group, Pinatubo, and others to illustrate the rypes of problems that can be, and need to be, investigated using data recorded by short-period networks. One example is a cross-correlation analysis that is currently being performed at several Alaskan volcanoes, including Mount Spurr, Iliamna, the Katmai Group, and Akutan, where multiplets have been observed or are suspected. One potential outcome of this project is the development of the capabiliry to produce higher accuracy relative locations in near-real-rime.
Seismic Evidence for a Complex Magmatic System beneath Long Valley Caldera, California HILL, David P., U.S. Geological Survey, Menlo Park, CA 94025, [email protected]
Accumulating data on the persistent unrest in Long Valley caldera provides intriguing clues on the geometry and nature of the complex magmatic system that underlies both the caldera and the southern end of the Mono-Inyo volcanic chain. The dominant component in this system is an inflating magma body centered roughly 7 km beneath the resurgent dome in the west-central section of the caldera. Cumulative uplift of the resurgent dome from the onset of unrest in late 1979 through early 1999 approaches 70 cm, which corresponds to a volume increase in rhe underlying magma body of roughly 0.3 km3. Geodetic,
tomographic, and seismiciry data suggest additional magma bodies may be centered at mid-crustal depths (10 to 15 km) beneath the sourh moat, the western margin of the resurgent dome, and the southwest flank of Mammoth Mountain at the southern end of the Inyo volcanic chain. Earthquake swarm activity, which is dominated by vnlcano-rectonic /hrirrle-failure) earthquakes, is largely confined to a WNW-trending seismiciry zone coincident with the axis of the south moat of the caldera and a ENE-trending zone in the Sierra Nevada south of the caldera. These seismiciry zones intersect at a right angle near the southern margin of the caldera, and they form a conjugate fault set with dominantly right-slip within the south-moat zone and left-slip in the Sierra Nevada zone. Kinemarically, this requires local extension along one or both of the seismicity zones. Right-lateral slip along the south-moat seismic zone also implies local extension across the north-trending axis of the Inyo volcanic chain. Local extension implied by these kinematic patterns may allow magma or magmatic fluids to move to shallower depths in the crust. The 1989 earthquake swarm beneath Mammoth Mountain, which was associated with a shallow intrusion and was accompanied by the onset ofborh deep (10 to 25 km), long-period (LP), volcanic earthquakes and elevated CO2 emissions, may be a response to local extension across the southern end of the Inyo volcanic chain. To date, however, we have not detected deep LP earthquakes beneath the caldera that might mark rhe upward migration paths of magma or magmatic fluids from mid- or lowercrustal sources to the inflating magma body beneath the resurgent dome.
The Summer 1998 "Tom's Place" Sequence Southeast of Long Valley Caldera, California: Hints of Magmatic/Geothermal Involvement? HOUGH, S.E. and DOLLAR, R.S., U.S. Geological Survey, 525 S. Wilson Ave, Pasadena, CA, 91106 USA, [email protected]
From 2/98 through 9/98 we operated an array of 6-8 PASS CAL instruments in and around Long Valley, California (the STORMS deployment). The STORMS stations recorded over 3500 events char associate with NCSNlocated events, including nearly 2000 to the south/southeast of the caldera, west/northwest of Tom's Place. Acriviry through late May was concentrated in and around the south moat; the Tom's Place region remained relatively quiet until approximately 5/20, when a small upswing in acriviry presaged a larger burst of seismiciry that included two M5.l events (on 6/9 and 7/15) and their respective aftershock sequences. Although energetic, both aftershock sequences exhibited a standard Omori decay and were deemed to be recronic rather than magmatic sequences (David Hill, pers. comm.). The location of rhe events, 1-10 km south of rhe caldera edge, is also away from regions of known geothermal acriviry and rhe locaiton of magmatic intrusion events inferred in recent years. However, a careful examination of events from the Tom's Place sequence reveals a small number whose spectral signarure (at multiple stations) is strongly peaked at a suite of harmonic frequencies. A harmonic signal is suggested but less clearly evident in a larger number of events occurring at rimes and locations similar to the first set. The events with the most striking harmonic signatures are clustered in the viciniry of the McGee Creek campground, near the epicenter of the 6/9 M5.l event. Two separate reports of'yellow steam' emanating from the ground within a mile of the campground were made to the campground manager in June. Although such eyewitness accounts are difficult to corroborate, both they and the inferred harmonic events suggest there have been some degree of either hydrothermal or possibly magmatic association associated with the 1998 Tom's Place sequence.
Propagation of Seismicity during the Sept./Oct., 1996 Subglacial Eruption Episode near Bardarbunga Volcano, Iceland VOGFTORD, K., National Energy Authoriry, Reykjavik, Iceland, [email protected]; ROGNVALDSSON, S., Icelandic Meteorological Office, Reykjavik, Iceland [l]; SLUNGA, R. Dept. ofGeosciences, Uppsala University, Uppsala, Sweden; MORGAN, J., NOLET, G. and ALLEN, R., Dept. of Geosciences, Princeron University, Princeton, NJ; ERLENDSSON, P., RAGNARSSON, S., STEFANSSON, R. [l]; JULIAN, B., U.S. Geological Survey, Menlo Park, CA; FOULGER, G., Dept. of Geological Sciences, Universiry of Durham, UK.
From the first five days of the earthquake sequence, events with magnitudes above Ml~2.5 were selected and located. Volcanic tremors were not included. Where possible, the resulting ~60 locations, were improved with relative methods. The data are from 18 stations of the temporary HOTSPOT/Passcal network and the permanent Icelandic SIL network. With the addition of the HOTSPOT stations, location accuracy has significantly improved from those previously published, possibly permitting inferences abour lateral magma transport with time to be made.
The earthquake sequence initiated with a shallow, Mw=5.6 earthquake on rhe morning of Sept. 29th under rhe NE rim of the Bardarbunga caldera, in the
222 Seismological Research Letters Volume 70, Number 2 March/April 1999

NW part of the Vamajokull glacier. Shortly thereafter, activity started on the caldera's western rim. During the next three hours a sequence of 15 smaller events propagated -5 km south along the western rim, abrubdy stopping at the SW edge around 2PM. The activity reached a maximum on the second day (-100 events), when all 34 selected events located near the eruptive fissure. Activity decreased again around 10PM, when the eruption, which lasted for 13 days is believed to have started. The third day had - 20 events of which 9 were ofMb2.5. Four were located around the eruption fissure, the rest under the SE and the NE edges of the caldera. Activity continued to decrease through the fifth day, with a few additional events occurring on the NE and SE caldera rims. The SE-edge seismicity clusters around the location of ice-cauldrons, which formed in the glacier and are believed to represent a minor subglacial eruption. Source depths of all events in this 5-day sequence were -1 km, except for three events on the NE rim, which were at -15 km depth.
Evidence for an Intermittent Supply of Magma at Mount St Helens, Washington MUSUMECI, C., MALONE, S.D., Geophysics Program, University of Washington, Seattle, WA 98195, USA, [email protected], [email protected], GIAMPICCOLO, E., GRESTA, S., lstituto di Geologia e Geofisica, University of Catania, 95129, Italy, [email protected], [email protected]
Seismic data from the Mount St. Helens area are used to develop a model for the intermittent supply of magma from a deep source into a crustal magma chamber beneath the volcano. Earthquakes beneath Mount St. Helens recorded over the last decade occur at depths of O to 10 km with magnirudes not exceeding 2.8. Following the eruptive period of the volcano extending from 1980 to 1986 there was a brief pause in seismic activity. In 1989 small earthquakes located from 2 to 10 km beneath the volcano increased in number. Since then 3,900 earthquakes have been well recorded by the Pacific Northwest Seismograph Network of which more than 500 have sufficient polarity data to determine good focal mechanisms. These events occurred in two distinct depth zones. One zone, between 2 and 6 km, is confined to a thin cylinder directly beneath the crater. The other is spread over a larger area from 6 to 10 km and defines an aseismic zone below and slightly west of the lava dome. Focal mechanism compressional axes between 2 and 6 km do not cluster around a single direction, while between 6.0 and 10 km they define a wheel-spoke pattern pointing radially away from the center of the aseismic zone. The stress field inferred from the focal mechanisms for different groups of events indicates an inhomogeneous stress field consistent with a time varying pressure source originating from the inferred crustal magma chamber and a thin conduit extending above it. Three distinct pressure pulses with intervening relative quiescence occurred between 1989 and 1998 which can be interpreted as due to the arrival of three separate batches of magma.
Two Chugging Giants: Karymsky and Sangay LEES, {.M., Yale University, New Haven, CT, 06511, [email protected]; and JOHNSON, J.B. Geophysics Program, University of Washington, Seattle, WA 98195 [email protected]
Chugging, the characteristic locomotive sound observed at several open vent volcanos around the world can be heard audibly and recorded on infrasonic and seismic instruments alike. Chugging may provide a way to relate the geochemistry of degassing and the seismic phenomena of harmonic tremor near active vents. Over two field seasons we have recorded infrasonic and seismic signals at Sangay, Ecuador, and Karymsky, Kamchatka, which display similar characteristics, suggesting a common physical model. Several general observations regarding the train of pulses include the following facts: 1) Chugging events always follow an initial explosion, although not all explosions are followed by chugging. 2) There is usually a lag time between the initial explosion and the commencement of intense chugging. We assume this is a preparation time where the system is building up intensity. 3) Chugging is fairly regular, with a dominant, fundamental frequency that varies from 0.7 ro 1.5 s between explosions. Within each sequence of pulses, however, fluctuations of fundamental frequency are considerably less. 4) Individual pulses are vety uniform and often near duplicates of the initial explosive pulses. 5) A typical sequence of events has an envelope that grows rapidly in amplitude and later diminishes gradually. Karymskystyle chugging is not observed at low-viscosity systems such as Stromboli, Erebus, even though all the volcanoes exhibit explosions many times each hour. Rather, the discrete pulses observed at Sangay, Karymsk"Y, Langila, Semeru and Arena! are apparently associated with the non-linear dynamics of choked fluid flow near the conduit vent. Degassing of rising magma columns provide a constant supply of pressurized volatiles, while gas depleted, highly viscous lava pro-
vides a mechanism for occasionally choking off the escape of gases during explosions.
Comparing Physical Tremor Models with Measurements: How Big ls the Source of Harmonic Tremor? HELLWEG, M., lnstitut fur Geophysik, Universitat Sruttgart, RichardWagner-Str. 44, D-70184 Stuttgart, Germany, 112052.3440@ compuserve.com
Over an 18 hours interval the tremor at Lascar volcano, Chile, was characterized by a spectrum with narrow peaks at a fundamental freqency of about 0.63 Hz and up to 30 overtones at exact integer multiples. This "harmonic tremor" was recorded at four three-component, high-dynamic range stations during the deployment of the Proyecto de Investigaci6n Sismol6gica de la Cordillera Occidental 94 (PISC0'94). Three source models from fluid dynamics produce repetitive, nonsinusoidal waveforms: The release of gas through a very small outlet (the soda bortle model), slug flow in a narrow conduit, and von Karman vortices produced at obstacles. These models represent different flow regimes, each with its own characteristic range of Reynold's numbers. Combining the Reynold's numbers for each model with typical kinematic viscosities for fluids encountered in volcanoes - magma, water, steam, air or some combination, at appropriate temperatures and pressures - provides limits on such physical parameters of the volcano as the dimensions of the flow conduit and che flow velocity of the fluid generating the tremor. For each of these models, I calculate the motion at the source using reasonable parameters for the geometry and flow properties and compare it with the amplitude of the seismograms recorded at the stations of the Lascar network.
Thrust Inversion: A Method of Measuring Mass Discharge Rate from Seismic Data BRODSKY; E.E. and KANAMORI, H., Seismological Laboratory, California Institute ofTechnology, Pasadena, CA 91125, [email protected]; and STURTEVANT, B., Graduate Aeronautical Laboratories, California Institute ofTechnology; Pasadena, CA 91125, [email protected].
We present a new method to invert seismic data to measure the mass discharge rate from explosive eruptions and therefore provide a direct constraint on the eruptive dynamics. Seismic waves observed during certain explosive eruptions have been previously shown to be generated by series of single forces. These forces can be modeled as the thrusts from blasts or other directed explosive processes. In these cases, the amplitude of the seismic waves is directly related to the momentum discharge rate. Simple models can constrain the velocity from information about the geometry and material properties of the products. Therefore, the seismic data provides a record of the mass discharge history and the total impulse of the wavetrain provides an estimate of the total mass discharged in the event. This new method is used to calculate the mass ejected in a series of vertical pulses during the beginning of the cataclysmic eruption of Mount St. Helens on May 18, 1980. The mass ejected vertically in the first 100 seconds is between 1.6 x 10 11 and 4.6 x 10¹¹ kg, i.e., at least 20% of the total products of May 18 were erupted within the first two minutes. Such concentrated episodes may be typical of blasts. A comparison between the seismic measurements and the mass of the blast deposit (-3.2-4.1 x 10¹¹ kg) indicates that the directed blast had a significant (>30%) vertical component. This observation can be interpreted as evidence that either the vertical events were redirected to generate the destructive lateral blast or the mass of the lateral blast was only a fraction of the mass of the "blast" deposit. The method also shows potential for interpreting Strombolian eruptions such as the 1997 Karymsky events.
Integration of Seismic and Infrasonic Data: Essential to the Understanding of Explosion Source Dynamics at Volcanoes JOHNSON, J.B., University of Washington, Seattle, WA 98195, [email protected], LEES, J.M., Yale University, New Haven, CT, 06511, [email protected]
Independent observations of material flux and / or acoustic pressure is vital for the successful interpretation of near-field seismic records of volcanic explosions. Infrasonic signals (between 0.5 to 10 Hz) are particularly valuable because they occupy a band of high acoustic energy and their waveforms are only slightly attenuated during transmission through the atmosphere. Nevertheless, an understanding of the filtering effects (which include time-dependent weather variations, energy focusing, and instrument response), is essential for recovery of the overpressure-time history at the vent.
Properly processed acoustic data, together with seismic, is effective for constraining explosive source motions, seismic propagation filters, and magma
Seismological Research Letters Volume 70, Number 2 March/April 1999 223

properties. Arrays of infrasonic instruments are able to filcer effects of weather and to boost signal-to-noise in windy conditions. We illustrate these techniques with seismo-acoustic data collected at Karymsky Volcano (Kamchatka) over a six-day period in the summer of 1998. During field work, we recorded more than 3000 summit explosions with 3 broad-band seismometers, 4 short-period seismometers, and 7 well-calibrated, low-frequency acoustic sensors. We deployed these instruments in variable array configurations about the cone within 2.5 km of the summit.
Applications of GPS to Volcano Monitoring NEWMAN, A., Department of Geological Sciences, Northwestern University, Evanston, IL, 60208, ([email protected]), DIXON, T., DIXON, J., Rosenstiel School for Marine and Atmospheric Sciences, University of Miami, Miami, FL 33149, MEERTENS, C., PERIN, B., STEIN, S., UNAVCO, 3340 Mitchell Lane, Boulder, Colorado 80301
Geodetic measurements of ground deformation provide one of the best methods of studying volcanoes. Recent technological advances make widespread use of the Global Positioning System feasible for these applications. A new single frequency GPS system provides the required high-precision data at far lower cost than previously possible. Hence such systems can be deployed in larger numbers than previously feasible. Second, satellite communications permit return of real-time data from remote areas without ground-based telephone communication. Such geodetic measurements should identify magma movement at depth long before it reaches depths shallow enough to provide seismic signals. Such deformation could easily be missed by conventional ground-based geodetic techniques, even at "well-monirored" volcanoes, because the deformation might be too broad to be captured by geodetic networks designed to moniror shallow-seated deformation.
The potential of such an approach is illustrated by GPS results from Long Valley, California. The rate of surface deformation on the resurgent dome there increased by more than an order of magnitude from July to December 1997, compared to the previous 3 yr average. However, the location of the source of deformation remained essentially constant at a depth of 5-7 km beneath the dome, near the top of the seismically defined magma chamber. Similarly, alchough the rate of seismic moment release increased dramatically, earthquake locations remained unchanged. The deformation rate increased exponentially with a time constant of ~45 days over 5 months, after which it decreased with about the same time constant. This range of time constants is considerably longer than for typical deformation events at basaltic volcanos, and may be related to the visco-elastic properties of rhyolitic material at the top of the magma chamber.
Integrated Seismic, Acoustic, and Ground Deformation Studies at Arenal Volcano, Costa Rica SCHWARTZ, S.Y., SCHAPIRO, R., and SAMPSON, D., Earth Sciences, University of California, Santa Cruz, CA 95064, [email protected]; HAGERTY, M.T., LDEO, Palisades, NY 10964; GARCES, M.A., University of Hawaii, Manoa, HW 96745; PROTTI, M., VAN DER LAAT, R., and HERNANDEZ, E., OVSICORI-UNA, Costa Rica and DIXON, T.H., and NORABUENA, E., RSMAS, University of Miami, FL 33149
Long-term, continuous measurements of seismic, acoustic and ground deformation signals at Arena! Volcano in Costa Rica are being used to elucidate some of the processes that lead to and accompany volcanic eruptions. Arena! has been in a near continuous eruptive state since its initial Plinean eruption in July 1968. Present activiry consists of frequent summit eruptions and less frequent block lava flows. We operated a network of five, three-component broadband seismometers and electronic tilcmeters and 2 continuously recording GPS receivers for more than three years at Arena! Volcano. For several months during this period either a single or an array of broadband microphones recorded the acoustic signals generated during Strombolian activity. These data have been extended in both time and space by integration with EDM measurements that span more than seven years of volcanic activity and GPS measurements from four additional sites that have been observed annually since 1997.
Seismic and acoustic signals are primarily of two types: 1) long-period (1-3 Hz) transients associated with summit explosions, and 2) harmonic tremor chat consists of regularly spaced spectral peaks and lasts up to several hours. These signals have been analyzed to help understand the nature of degassing and to constrain the time-varying properties of the magma-gas mixture at shallow depth inside of che volcanic conduit. Geodetic observations have been interpreted in terms of deeper volcanic processes. Shortening across a north-south baseline of about 8 mm/yr and tilt down towards the volcano at all sites spanning the volcano's circumference are consistent with deflation of a shallow non-
replenishing magma chamber. Highlights of our long-term seismic, acoustic and geodetic monitoring of Arena! Volcano will be presented with an emphasis on the integration of data from the different geophysical sources.
Monday P.M., May :3, 1999-~haw Room Strong Ground Motion: Observing, Predicting, and Engineering Applications II Presiding: Steven Kramer and Kim B. Olsen
An Engineering Model of the Near-fault Rupture Directivity Pulse SOMERVILLE, P.G., URS Greiner Woodward Clyde, 566 El Dorado Street, Pasadena, CA 9110 l, [email protected]
For the analysis of the inelastic response of structures to near-faulc ground motions, it is desirable to augment the response spectral representation of the ground motion with a time domain representation of the near-fault pulse caused by rupture directivity. We have developed equations that relate the peak velocity and period of the near-fault rupture directivity pulse to earthquake magnitude and distance. This model is based on 15 time histories recorded in the distance range of Oto 10 km from earthquakes in the magnitude range of 6.2 to 7.3, augmented by 12 simulated time histories that span the distance range of3 to 10 km and the magnitude range of6.5 to 7.5. This pulse model is for the fault-normal component of ground motion on soil under forward rupture directivity conditions. A preliminary relationship between the period T of the near-faulc fault-normal forward directivity pulse recorded on soil and the moment magnitude Mw is: loglO T; -3.0 + 0.5 Mw
One of the most important parameters for rhe prediction of strong ground motion is the duration of slip on the fault (rise rime TR). The self-similar relation between rise rime TR and magnitude Mw derived from a set of crustal earthquakes is:
loglO TR; -3.34 + 0.5 Mw From these two equations, the period T of the pulse is related to the rise
time TR by the equation T ; 2.2 TR. The period of the pulse contains contributions from the rise time TR of slip on the fault and from the duration of propagation of the rupture over the fault surface. We have confirmed this empirical relationship by independently deriving it from a simple analytical model of fault rupture based on the scaling of fault dimensions and rise time with seismic moment.
An approximate relationship between the peak velocity PGV on soil of the near-fault fault-normal forward directivity pulse and the moment magnitude Mw and closest distance R is:
loglO PGV ~ -1.0 + 0.5 Mw- 0.5 loglO R . This model assumes a linear relationship between PGV and R whJCh may
not be realistic at very dose distances; data recorded at distances of less than 3 km were not used in developing this relationship.
Probabilistic Soil Amplification tor Nonlinear Soil Sites with Uncertain Properties BAZZURRO, P., and CORNELL, C.A., Stanford University, Dept. of Civil and Environmental Engineering, Stanford, CA, 94305, [email protected], [email protected].
This study presents an effective probabilistic approach for evaluating the ground motion at the surface of a nonlinear soil deposit located at a specific sit:. This methodology couples conventional Probabilistic Seismic Hazard Analysis (PSHA) with nonlinear dynamic analyses of the soil column with uncertain properties. Such a procedure provides more precise ground motion estimates than those found by means of standard attenuation laws for generic soil conditions. Using generic ground motion predictive equations may lead to inaccurate results especially for soft soil sites, where significant amplification is expected at long periods, and for saturated sandy sites, where loss of shear strength due to liquefaction or to cyclic mobility effects may be expected for severe levels of ground shaking. Both cases are considered here. In the proposed method the ground motion at the surface, or at any depth of interest (e.g., at the structure foundation level), is characterized either by oscillator-frequency-dependent hazard curves for acceleration, or by acceleration uniform hazard spectra associated with a given mean return period. The effect of the soil layers on the intensity of the ground morion at rhe surface is studied in terms of a site-specific, frequencydependent amplification function, AF(/), where f is a generic oscillator frequency. The median AF(fJ can be accurately predicted by a small number of ground motion records (as few as ten or less) driven through a finite element
224 Seismological Research Letters Volume 70, Number 2 March/April 1999

model of the soil deposit with uncertain properties. The limited computational effort required is a big advantage if resources and/or accelerograms "appropriate" for the site are a major constrai~t.
Stochastic Modeling of California Ground Motions ATKINSON, G.M., Carleton University, Ottawa, Ont., KlS 5BG, Canada, SILVA, W.J., Pacific Engineering and Analysis, El Cerrito, Ca., 94530, USA
Ground-motion relations are developed for California using a stochastic simulation method that exploits the equivalence between finite-fault models and a two-corner point-source model of the earthquake spectrum. First, stochastic simulations are generated for finite-fault ruptures at near-source distances. The length and width of the fault plane are defined based on the moment magnitude of the earthquake, and modeled by an array of subfaults. The radiation from each subfault is modeled as a simple Brune point source (ie. single corner frequency), using the stochastic approach. An earthquake rupture initiates at a randomly-chosen subfault (hypocenter), and propagates in all directions along the fault plane. A subfault is triggered when rupture propagation reaches its center. Fourier spectra are computed for records simulated at many azimuths, placed at equidistant observation points around the fault, by summing the subfault time series, appropriately lagged in time. The mean Fourier spectrum for each magnitude, at a reference near-source distance, is used ro define the shape and amplitude levels of an equivalent point-source spectrum that mimics the salient finite-fault effects. The functional form for the equivalent point-source spectrum contains two corner frequencies.
Stochastic point-source simulations, using the derived two-corner source spectrum, are then performed to predict peak ground motion parameters and response spectra for a wide range of magnitudes and distances. The stochastic ground-motion relations are in good agreement with the empirical strongmotion database for California; the average ratio of observed to simulated amplitudes is near unity over all frequencies from 0.2 to 12 Hz. The stochastic relations agree well with empirical regression equations in the magnitude-distance ranges well-represented by the data, but are better constrained at large distances, due to the use of attenuation parameters based on regional seismographic data. The stochastic ground-motion relations provide a sound basis for estimation of ground motions for earthquakes of magnitude 4 through 8, at distances from 1 to 200 km.
Strong Motion Simulation of the Hyogo-ken Nanbu Earthquake Using Multiple Asperities and a 3-D Basin Structure KAWASE, H., Grad. School of Human Env. Studies, Kyushu Univ., Fukuoka, 812-8581, Japan, [email protected]; MATSUSHIMA, S., ORI, Shimizu Corp., Tokyo, 100-0011, Japan, [email protected]; GRAVES, R.W, URS Greiner Woodward Clyde, Pasadena, CA 91101, [email protected]
We reproduced strong ground motions during the Hyogo-ken Nanbu earthquake of 1995 by using a relatively simple rupture process and a three-dimensional (3-D) basin structure. We first prepare tables of peak ground velocities (PGVs) and pulse widths calculated from a single asperity. We found that PGV in the near-field is controled byrhe peak slip velocity in an asperity, not by the final slip. Based on such relationships we tty to find the locations, sizes, and slip velocity time hisrories of asperities by matching the synthetics with the observed or estimated badrock motions. We confirmed that the bedrock motion at JMA Kobe station can be vety well reproduced by using four asperities below Kobe. Then we construct a realistic 3-D basin model to calculate the 3-D basin edge effect, which muse be the cause of the damage concentration in Kobe during the earthquake. The 3-D calculation is performed by using 3-D FDM with 4-ch ordered staggerred grid scheme (Graves, 1996). The resultant synthetic waveforms are very similar to the observed and the strong contribution of the edge effect is observed. This result shows strong contrast with the results from an inverted source model (Wald, 1996) in which the same basin model reproduces observed waveforms only in the long-period range. If we convolve the synthetic bedrock motion with the bedrock motion at JMA to account for the shorter period generation in the Wald's model, then the synthetic waveforms becomes very similar to the observed. Thus we have two alternative models, one with simple geometry and simple but sharp slip functions and the ocher with complex geometry and complex and unrealistic (=convolved) slip functions. In any case we conclude that the peak slip velocity on the rupture surface, rather than the final slip, controls the near-field strong motions.
Identification of Path and Local Site Effects on Phase Spectrum of Seismic Motion SAWADA, S., Disaster Prevention Research Institute, Kyoto University, Gokasho, Uji, Kyoto 611-0011, Japan, [email protected]; MORIKAWA, H., TOKI, K. and YOKOYAMA, K., Graduate School of Civil Engineering, Kyoto University, Yoshida-honmachi, Sakyo, Kyoto, GOG-8501, Japan, [email protected]
The response spectra are widely used to define the design seismic motion for many types of infrastructures. Although the response spectra are very useful for the super-structures, it is not suitable for defining the input ground motion for underground structure because the maximum displacement of the seismic motion on the ground surface is necessary for the design. Smoothed Fourier spectrum is promising for this purpose, if its phase characteristics ace defined.
Path and local site effects on Fourier phase spectra are identified using ground motions due to small events. Group delay time (Tgr), defined as the gradient of the phase spectrum, is used to make clear the relationship between phase characteristics and time histories. In order to decrease the number of data for representing the characteristics of seismic motion, the average Tgr spectrum is defined as the smoothed T gr. The variance spectrum of T gr is defined as the averaged square residual of the Tgr and the average Tgr spectrum. The former corresponds to the mean arrival time of the wave group of the frequency, and the latter the duration.
The analysis is based on the following assumptions. The observed variance T gr spectrum can be estimated by summing variance spectra of the source, path and local site effects. Identification of the variance spectrum of path and site effects was done by the generalized inverse matrix method using seismic records from 3 stations in Osaka region, Japan. We consider that che variance spectrum of source effects must be zero because only the records of 5 small earthquakes with magnitudes less than 5.0 were used. Conclusion derived by the present study is that the variance spectrum of path effects takes a large value when 1/Q is large and that one of site effects is large when amplification factor is large.
Importance of Integral Parameters for Seismological and Engineering Studies TUMARKIN, A.G. Institute for Crustal Studies, University of California, Santa Barabara, CA 93106-1100, USA, [email protected]
We study integral characteristics of seismic sources (seismic moment, radiated energy) and of strong motion records (Arias intensity, CAY). We present various analytic estimates of peak parameters in terms of these integral characteristics. For example, we obtained an upper bound of the maximum moment rate in terms of the product of moment and energy. This estimate is exact in the sense that we can explicitly describe the extreme source time function, for which this estimate is achieved. It is interesting that this function has aw-squared shape of the amplitude spectrum. Response spectral values can be estimated in terms of the cumulative absolute velocity (CAV) for general even non-linear multidegree-of-freedom systems (Tumarkin, 1991). Our results demonstrate the importance of using integral parameters for seismic risk assessment studies.
Geotechnical Arrays Instrumented by the California Strong Motion Instrumentation Program (CSMIP) GRAlZER, V.M., SHAKAL, A.F. (California Division of Mines & Geology, Strong Motion Instrumentation Program, Sacramento, CA 95814; [email protected]), ROBLEE, C.J. (Caltrans, Facilities Research Branch, 5900 Folsom Blvd, Sacramento, CA 95819)
In an effort to study site effects the California Strong Morion lnstrumemacion Program (CSMIP) began instrumenting boreholes with strong-motion accelerometers in 1989. As of January 1999 nine geotechnical arrays are operational, and installation of three new arrays is planned in 1999. Many of the recent downhole arrays have been deployed with the support of the California Department ofTransportation (Caltrans).
Low amplitude data from 5 earthquakes with magnitudes up to 5.3 have been recorded at the Treasure Island-Geotechnical Array near San Francisco. In this soft-soil/rock atray accelerometers are installed at che surface and in 6 nearby boreholes. The borehole accelerometers are located at 4 intermediate locations in the soft soil profile (7, 16, 31, 44 m) and the deepest are below the sandstone and shale bedrock surface (104 and 122 m). This array was installed by CSMIP in cooperation with the National Science Foundation in 1993.
To study the site response effect of a deep soil geologic structure an array was installed near the Santa Monica freeway (I-10) at La Cienega, which collapsed during the Northridge earthquake. Eight earthquakes with magnitudes 2.5<M<5. l have been already recorded at chis site at the surface and at depths
Seismological Research Letters Volume 70, Number 2 March/April 1999 225

of 18 and 100 m. The deepest hole (250 m) was instrumented in January 1999. This array was installed in cooperation with Caltrans in 1995.
A geotechnical array site near Eureka also represents a deep soft alluvium site and has accelerometers located at the surface and at the depths of 19, 33, 56 and 136 m. A low amplitude events have been recorded by the array since 1997. Thi, array was also installed in cooperauon wuh Caltrans.
Broadband Modeling of Non-linear Soil Response for the 1994 Northridge, California, Earthquake JONES, E.M., Los Alamos National Laboratory, MS F659. Los Alamos, NM [email protected]; OLSEN, KB., Institute for Crustal Studies, UC Santa Barbara, Santa Barbara, CA 93106-1100, [email protected]
We present a hybrid finite-difference technique capable of modeling fully nonlinear broadband soil response due to the 3-D finite-fault radiation pattern of buried earthquakes. Long-period ground motion is computed within an area above the causative fault to a darum plane below the surface using a fourthorder 3-D finite-difference method and results from kinematic slip inversion. These ground motions are combined with stochastic time series to obtain broadband source time functions which are then propagated vertically up through non-linear soil models for selected sites. The method is tested for sites in the San Fernando Valley for the 17 January 1994 M 6.7 Northridge earthquake. Site-specific non-linear material parameters from the San Fernando Valley were taken from laboratory analyses of borehole samples from the ROSRINE project and experience from Nuclear Test Site models. Our results show reduction of spectral acceleration up to an order of magnitude at Newhall Fire station (NWH) and Jensen Filtration Plant, Generator Building (JFG), while no significant reduction was found at the rock site SCT. The nonlinear effects appear in rhe synthetics for frequencies above 0.6-0.7 Hz, and we find no significant influence on the long-period ground motion due to non-linear soil effects at the selected sites in the San Fernando Valley. The reductions of the spectral accelerations relative to those for a linear model generally agree with ratios between strong motion spectral amplification from the Northridge main shock and weak motion spectral amplification from Northridge aftershocks.
Liquefaction and Dynamic Poroelasticity in Soft Sediments BACHRACH, R., Dept. of Geological Sciences, Michigan Stare University, East Lansing, MI 48824, [email protected]; NUR, A., Rock Physics Laboratory, Geophysics Dept. Stanford University, Stanford, CA 94305, [email protected]; AGNON, A., institute of Earth Sciences, Hebrew University; Jerusalem, 91904, Israel.
Soil engineers consider dynamic liquefaction a poroplastic process where the collapse of pore volume with the concomitant increase in pore pressure leads to vanishing effective stress. Such a mechanism cannot explain repeated non-hysteretic liquefaction.
We study the behavior of a single poroelasric layer subjected to a periodic cyclic stress using dynamic poroelasticity formulation. We show chat in such a layer pore pressure can be built due to a resonant mode of Bioc's rype II wave. This is an attenuated mode whose wavelength is short and can resonate inside a layer of few meters thickness.
We show that in stiff sediments (shear modulus greater than 0.3Gpa) the pore pressure build-up does not exceed the total stress. However, in soft sediments (e.g. sand), where the shear modulus is less than 0.3Gpa, pore pressure can exceed the total stress. This will cause unconsolidated material to liquefy.
We also show chat in beach sand where measured Bulk and Shear Moduli follows Hertz-Mindlin Pressure dependence, liquefaction is more likely to occur having the shear modulus decrease as pore pressure increases.
Time and Spectral Analysis of the Hyperbolic Model and Extended Masing Rules Hysteresis for Nonlinear Site Response Modeling BONILLA, L.F., LAVALLEE, D., and ARCHULETA, R.J., Institute for Crustal Studies, University of California Santa Barbara, Santa Barbara, CA 93106, [email protected]
Nonlinear site response studies have mostly been approached by using a hyperbolic stress-strain relationship with hysteresis following the Masing rules to characterize the nonlinear rheology of soils observed in laboratory tests. Masing rules describe the srress-strain path at any given rime. How closely do these rules describe the stress-srrain loops observed both in laboratory and earthquake data? To answer this question we have developed a nonlinear model of soil that includes the functional form of the extended Masing rules. The model validation and calibration were performed using the stress-strain curves obtained in laboratory tests on sand. The model was also used to reproduce earthquake
accelerograms recorded on sand deposirs. These numerical investigations suggest the following conclusions: First, we found that the inclusion of the extended Masing rules provides a berter description of soil hysteresis. Second, the strain rate time history is necessary to fir the observed data and represents the anelasric attenuation of the medium. Thirtl. hv including extended Masing rules, it is possible to approximate the dilatancy of the material, and chis allows the modeling of events that may produce large deformations in the medium. The latter result can be important in the generation of pore pressure pulses capable of initiating liquefaction. Even in the absence ofliquefaction, simulated accelerograms show large accelerations and intermittent behavior. For instance, high frequency peaks are generated lace in the synthetic signals, similar to those observed in recorded accelerograms. This behavior cannot be modeled by equivalent linear methods, and demonstrates the importance of the hysteretic stress and strain time history modeling for producing more realistic accelerograms.
Compressional and Shear Wave Velocities of Soils at Low PressuresTheoretical Estimates, and Comparison to Laboratory and Field Data BERGE. P.A., BONNER, B.P., ARACNE-RUDDLE, C., TROMBINO, C., and BERRYMAN, J.G., Lawrence Livermore National Laboratory, Livermore, CA 94550, [email protected], [email protected], [email protected], berryman [email protected].
Thin soil layers control the amplitude and duration of seismic surface displacements because of large impedance contrasts with underlying bedrock. For example, site amplification occurs when energy is trapped in surface layers during strong motion. Values of P and S velocities and elastic moduli for materials such as silty sands and peat are more than an order of magnitude lower in the near-surface than at depth, and change rapidly in the top few meters. Effects of pressure and microgeometry on mechanical properties of unconsolidated materials can be explored using laboratory measurements under controlled conditions. At low pressures representative of the near-surface, however, P velocity data are scarce and reliable S velocities are extremely difficult to obtain because of high attenuation.
We developed a technique for simultaneous measurement of ultrasonic P and S velocities at low pressures for dry and saturated soil samples. We measured velocities for various mixrures of Ottawa sand, clays, and peat moss at pressures of about .01 to .1 MPa, representing depths of a few meters.
Our laboratory measurements of velocities in artificial soils compare reasonably well to literature values from the field at shallow depths, with P velocities between 150 and 400 mis and S velocities about half as large. Our S wave amplitudes are highly sensitive ro pressure and to clay content, and S velocity gradients are much steeper than P velocity gradients. We applied several effective medium theories to model measurements, and obtained useful velocity estimates when appropriate microstrucrure assumptions were made. Successful models can be used to extrapolate and generalize laboratory measurements. High-quality laboratory measurements can enhance interpretation of seismic data for applications to earthquake hazards reduction and environmental geophysics.
This work was performed under the auspices of the US DOE by the Lawrence Livermore National Laboratory under contract W-7405-ENG-48 and supported specifically by the Environmental Management Science Program of the Office of Environmental Management and the Office of Energy Research.
Monday P.M., May 3, 1999-Rainier Room Posters CTBT Research and Its Role in Earthquake Studies II
Using Three-dimensional Mantle Velocity Models in Teleseismic Event Location ANTOLIK. M., EKSTROM, G., and DZIEWONSKI, A.M., Department of Earth and Planetary Sciences, Harvard University, Cambridge, MA, 02138, [email protected]
We report on our continuing investigation of the utility of current three-dimensional (3-D) models of mantle heterogeneity to the teleseismic location problem. Such models, when used with sufficiently detailed corrections for crustal heterogeneities, can result in locations better than the stated 1000 km2 accuracy objective for moniroring the Comprehensive Test Ban Treacy (CTBT) for explosions with know epicentral parameters. On the other hand models with a higher degree of nominal resolution (parameterized by blocks with lateral dimensions
226 Seismological Research Letters Volume 70, Number 2 March/April 1999
of 5° or less as opposed to low-wavelength spherical harmonics), while producing a better fit to teleseismic travel time data, result in a smaller improvement in locations. This may be the result of less accurate representation of long wavelength anomalies by the higher resolution models, or ic may be a reflection of che differing types of data used to derive che models (i.e., striccly global body wave travel times versus a combination including surface wave and normal mode data). Although the locations derived from global 3-D models are very good, our previous research has shown chat they can be further improved through che use of empirical, sice-specfic station corrections.
Thus fat our work has concentrated on the use of ISC travel times, using only teleseismic P-wave data in the distance range 25-96°. We are now investigating the use of later arriving core phases, as well as conducting experiments using only subsets of the available data. These laccer experiments address che question of whether similar location improvements will result for smaller events recorded by all or only a few of the primary International Monitoring System stations.
Improvement in Seismic Location Using Non-stationary Bayesian Kriging StCJlhen C Myers, and Craig A. Schultz. Lawrence Livermore National Laboratory, L-205, Livermore, CA 94550, [email protected]
Monitoring the Comprehensive Test Ban Treaty (CTBT) will require improved methods for determining seismic location, particularly for low-magnitude events. Low-magmtude events are likely to be recorded on a sparse subset of stations at regional to upper mantle distances(< 30°), and sparse-network locations can be strongly effected by travel-time bias that results from path-specific velocity model inaccuracies.
In this study we test the improvement in sparse-network seismic locations achieved with travel-time correction surfaces that are determined using Bayesian kriging and teleseismically constrained calibration events. The test data set is the 1991 Racha aftershock sequence, which occurred in the Caucuses Mountains between the Black Sea and Caspian Sea. Six stations comprise the test network, which is meant to represent a typical station configuration for small events. Sparse network locations, with and without corrections, are compared to well-constrained epicenters determined with a dense local network. When no travel time correction was applied, the mean horizontal distance between the local and sparse network locations is 43 km, and there is a distinct bias in sparse-network locations towards the north northwest. The mean difference between local and sparse network locations is cut to 13 km when corrections are applied, and the bias in location is significantly reduced. When corrections are not applied, none of the locally determined locations lie within the associated 95 % confidence ellipse determined with the sparse network. However, by using travel-time corrections and estimates of model uncertainty determined using kriging, representative error ellipses are obtained. The Racha test study is an important demonstration of the improvement in sparse-network location that can be achieved using kriged correction surfaces. With the demonstration of the kri~ing technique established~ we are continuing to expand the number of stations for which correction surfaces are available and measure the incremental improvement in seismic location.
Work performed under the auspices of the U.S. Department of Energy by Lawrence Livermore National Laboratory under contract W-7405-ENG-48.
Calibration of the IMS Seismic Network by Surrogate Stations ENGDAHL. E.R., U.S. Geological Survey, Denver, CO 80225, USA, [email protected]. usgs.gov
Present or planned IMS seismic primary and auxiliary stations are in some cases co-located with or near stations that have a long recording history. In many areas one must rely on unique historical ground truth events recorded by these surrogate stations to calibrate stations and arrays in the IMS network. To identify these surrogate stations, the presently known coordinates for existing and planned IMS primary and auxiliary stations (Istvan Bandar, personal communication) were compared to the coordinates of all stations that have reported data to ISC and NEIC prior to 1995. For49 IMS primary and 76 IMS auxiliary stations there were 149 and 222 stations reporting data to ISC/NEIC, respectively, before 1995 that were within 50 km of stations in the IMS network. Characterization of the usefulness of the data reported from surrogate stations is accomplished by rigorous analysis of median teleseismic station residuals for several phases (P, Sand PKP) as a function of time (1964-1998). Median residuals over time are expected to be constant, but at many stations systematic variations are observed which may be due to changes in station location or recording equipment, flaws in the timing of the data or biased picking of arrival times
Statistical Analysis of Travel Time Residuals Applied to the Analysis of Station Quality WiJliam G. Hanley, Craig A. Schultz, Stephen C. Myers Lawrcnci: Li\'cr111on.: National Laboratory'. L-206, Livermore, CA 94551, [email protected]
Improving the accuracy and precision of cvcnl epicenters in :,;upp<~rl of the_ Comprehensive Nuclear-Test-Ban Treaty (CTBT) can be accomplished by 111akrng use ol empirical travel-lime corrections from well constrained calibration events. This technique requires :1. spatially extensive set of epicenters for which locations a~ul individual a_niv,tf picks an=- a..:curatcly determined. In this study. we develop t~chn_1qt11:":-. to ~ta11s~1:·•~Ily characti.·ri.r.c the pt,pulation of affivai-tlmc pick~ at ;.m inthvitlual :-.ta111m. thu"' 1di.."11tl1y1nv poor quali1y :-1:itinns and/or individual outlii:r anival pit:ks. MyL-r, anti S1..:hult1 I 19~8) c111plrkally lklllllllS\ratcJ. via a Baycsian k1iging 1ci.:hniq111.:. lh;1t 1r;1\·cl-11111c 111{1d_d1ng error:-.. n .. •latin: 111 a sindL" :-.iation and takt:'n over shorl thl..' 1h,1anlL' ran~c"'. lyp1call) t:nnslitult: a slowlv \'.ll"\'il;!.! tri:nd. '~/c use this ob~e1Yatinn to rcp1cst.·n1 lllL· lll{l(kl nror in rL·gion~ of l'lu:,;1Jr1..·d :ci;mkity by introducing a low onkr li111..·ar 111ndd. S1:~1istical charac11..~ri1.a1io11 i~ accomplished hy using clusters or cvcnls 10 scpara11..· a~ul lkln11~1!1c the ~palial mudding errors. 1111..·asun.:mcnt e1Tors and timing c1Tor:-. al each st:ll1011: SJ'>l."cil1ca_lly. for any gin·n ~,a1ion and an associatt>d collection of eh~sti.:rL'd ohservatwns. m11!11plc regression 111cthodnlog:y is applk:d to produce n low order l,nc.u· rnndd 1hat n:prcsents the cmT1..·spondi11g: 111otlding c_rnw for 1hat clus1cr. The alg.rni~)1m \H! pro1_:,n~c works lo cnsun.· !hat th1..· model 1..·1T1)f solulHlll is stahlt' and docs nol o,·erlil or undcrlll lhl· dala. Once the mndd nrnr i:-. cs1ima1t:d. ,,·1..· can anrihu1c the remaining error~ to mi:asurcmenl and station am1111alil':,.,. By s1udying lhc slatistical propenies of tl~is r~111ain!ng l!rrnr Wl! :!ssc_s~ the rda1iv1..· quali1y or in<lividuul station~. and ~vork to 1dcnnfy highly suspcl.'l 1mhv1dual observation~. Curr~ntly. 1hcs1..· analysis techmques arc being devdopcd an<l dcnmn~lratcd on du.sins nf cvi.:n1s tak~n from the Zagros region of the Middle East. En:ntually. we inlcml 10 ucn..:raliz..: tlK' dc,·clopcd methodology to run on a set nf glohal clusters.
1T.l1i..; 11..'Sl'atd1 was lll!rforn1t.•d under 1he auspices of th~ U.S. Di:p,\nm1..'nl ~1f h11..·rgy by I :J\\ft'llCt"
I .1\wmor1..· l\:uional L:1bnratory under con1rnt1 num~r W-7-105-EN(i--18.
Noise Characteristics for Borehole Stations with and without Sand ASTIZ. Luciana. IGGP-SIO, UC San Diego, La Jolla CA 92093-0225, [email protected]
The objective is to find how much noise reduction (if any) was found at borehole stations where sand had been added, using the "characteristic" noise power spectral estimates (PSE) of noise at each station without sand and after sand had been added to the boreholes. This comparison can only be made at three IRIS stations: ANMO, SNZO, VNDA. I used a few hundred spectral windows for all estimates.
For ANMO there is an improvement at high frequencies (> I Hz) of up to 4 db, at long periods the improvement was between 3-6 db between 20-200 s for the vertical (Z) channel. For the horizontal channels the resulcs were mixed. Unfortunately, the instruments in 1992 and 1997 were different: when ANMO had no sand in the borehole ic had a CMG3T when the sand was added a new KS54000 was installed in ics place. The face that the instrument was not the same may render the comparison invalid. At SNZO and VNDA, the exact same instrument has been recording before and after sand was added in the borehole.
For SNZO at high frequencies (> 1 Hz) there is no great improvement, however, a few picks that appear in the PSE before are gone, some of them had amplitudes up to 10 db. At longer periods the vertical channel does improve by about 1 db beyond 300 s. For the horizontal channels the results are mixed once more. At VNDA the improvement in the horizontal channels is trully expectacular. However, a spurious peak appears around 400 s in the horizontal PSE that could not be detected before. At high frequencies (> 1 Hz) there is some improvement in the vertical channel. In the microseismic band there is a small increase between 1 and 2 seconds. The vertical channel improves by about 2-4 db between 100-1000 s. The improvement in the horizontals is about 30 db above 300 s.
Cluster Analysis for CTBT Seismic Event Monitoring CARR. D.B., YOUNG, C.J., and HARRIS, J.M., Sandia National Laboratories, MSl 138, Albuquerque, NM 87185, [email protected]; ASTER, R.C. and ZHANG, X., New Mexico Institute of Mining and Technology, Socorro, NM 87801, [email protected]
Mines at regional distances are expected to be continuing sources of small, ambiguous events which must be correctly identified as part of the CTBT monitoring process. These events have parametric characteristics (explosive sources, shallow depths) which make them difficulc to identify using traditional discrimination methods. Fortunately, events from che same mines tend to have similar waveforms, making it possible to identify an unknown event by comparison with characteristic archived events that have been associated with specific mines. In this study, we investigate the use of Cluster Analysis (CA)techniques to facilitate this comparison. Previous seismic event studies have used CA to classify event catalogues (Israelsson, 1990; Rivere-Barbier & Grant, 1993), but have only provided a cursory view of the richness of the discipline.
We compare waveform processing methods and group similarity calculation methods using archived regional and local distance earthquakes and mining blasts recorded at two sites in the western U.S. with different tectonic and instrumentation characteristics: the three-component broadband DSVS station
Seismological Research Letters Volume 70, Number 2 March/April 1999 227

in Pinedale, Wyoming and the short period New Mexico Tech network in central New Mexico. In each case, the events are divided into training and test sets to tune and evaluate the various CA strategies. Different group similarity measures are evaluated (single linkage, complete linkage, group mean, centroid, and Aexihle) using various waveform processing techniques (phase winclowing. filtering, envelope transform). The methods are ranked with regard to computational efficiency as well as overall effectiveness.
This research was supported by the U.S. Department of Energy under Contract DE-AC04-94AL85000. Sandia is a multiprogram laboratory operated by Sandia Corporation, a Lockheed Martin Company, for the U.S. Department of Energy
Modeling Ripple Fired Explosions from the Centralia Mine, Southwestern Washington ROHAY, A.C., Pacific Northwest National Laboratory, Richland, WA, 99352, [email protected]
One of the outstanding issues associated with the Comprehensive Test Ban Treaty is the discrimination of large mining explosions from nuclear tests. The Centralia coal mine is a significant source of seismic events in southwestern Washington. Some of the mine explosions have reported magnitudes as large as 3.5. We have assembled a set of waveform data from these explosions, derived from the Pacific Northwest Seismic Network and from broadband stations operated near the mine. These same stations also recorded nearby single explosions from the PASSCAL Southwest Washington Reflection/Refraction Experiment.
Detailed information on the geometry and delay pattern of the explosions was used to simulate the mine signals. The most common set of delays was 25 and 84 ms within and between rows, respectively. This leads to a spectral reinforcement at 12 and 40 Hz. The use of 500 ms down-hole delays introduces an additional ±3.5 ms scatter in the delay times, reducing but not eliminating the spectral peaks in the simulations.
The blast simulations also predict spectral modulations resulting from the total blasting duration and the aspect ratio of the blast geometry (square vs. rectangular). A similar spectral modulation is observed in binary spectrograms and cepstra of many of the mine-generated signals. These spectral characteristics occur at lower frequencies than those related to the delay times, and so could be useful in identifying ripple-fired explosions at regional distances. A model that includes the effects of spall (material being lifted and re-impacting the surface), and additional geometric effects, such as the location of blast initiation, direction of blast sequencing, and the orientation and position of the free face, is being applied to improve the spectral matching of the simulations to the data.
SURFACE WAVE MEASUREMENTS ACROSS THE MIDDLE EAST AND NORTH AFRICA
PASY ANOS, Michael S William R. Walter, Lawrence Livermore National Laboratory, Livennore, CA 94551, [email protected] Hazier, Shannon E., University of Colorado, Boulder, CO 80309
We present result::. from a large scale study of surface wave group velocity dispersion across the Middle East and North Africa. Our database for the region is populated with seismic data from regional events recorded at permanent and portable broadband, ?,~component, digital s1ations. We have measured the group velocity using multiple narrow-band filters on deconvolved displacement darn. A conjugate gradient method is used in the subsequent group velocity tomography. Our current results include bo1h Love and Rayleig:h W(IVC inversions across the region fr>r periods rnn~ing from 15 10
I 00 seconds.
Prel1m111ary results find that short period structure is sensitive to till' low vclocitic~ associated with t,1rgc sedimentary features such as the Mcditen-:mcan Sea and tile Mesopolamian rorcdccp. We find long period Rayleigh wave structure sensitive to changes in crustal thickness, such as fast velocities under the oceans and !-.low velocities along th~ Zagros Mts and Turkish-Iranian Plateau. Accurate group velocity maps can be used 10 construct phase matched filters along any given path. The filters can improve weak $urface wave signals by compressing the dispersed signal. The signals arc tht::n used to calculate regionally determined Ms measurements, which we hope can be used to extend the threshhold of mb:Ms discriminants down to lower m~1gnitudc kvds. \~.Jc will be testing the performance of the phase matched filters fo, regional C\'t.:-nl discrimination
This work was pcrfonned under the auspices of the U.S. Department of Energy by Lawrence Livennore National Laboratory under contract no. \\1- 7405-ENG-48 for the Otlice of Research and Development, NN-20, within the Office of Nonproliferation and National s~i.:urity. NN-1.
REGIONAL WAVEFORM MODELING IN SOUTHWESTERN ASIA: TECTONIC RELEASE FROM THE MAY 11, 1998 INDIAN NUCLEAR TESTS
William R. Walter. and A11hur .I. Rodgers, Lawrence Live,morc National Laboratoiy, Gcophy ... ic'i and Global Security Division, L-205. Livermore. Ca. {)45~ 1. bwaltcrro Jin I.gm·
The !-.Clsrnic .... ignal from the May 11, 1998 underground nuclca1 cxplos,on~ in \1./C!-.tcrn India pro\·idc nc,1.,• data to test regional event analysis techniques that provide v;_ilu.Jhle insight into both tectonic processes and for monitnring the Comprehensive N111.:lcar-Tcst-Ban Treaty (CTBT). One such technique is regional waveform modelini; which can provide infomrntion about both the source of seismic wave, and the strnctun.: they pa:-.\ 11lrou~h. The technique matches 1eflcct1vity µcncratcd synthetic scismograms !O data, and i!-. mo!-.I effective if either the source or structure is known independently so the 01hct can he determined by goodness of waveform fit. S1a11ing with a large May 21, \l)97 C\ cni in central India wilh a tclcscismical\y wcll-con!-.traincd depth and focal mcdian1.'\lll. we have u .... cd rcglonal waveform modclrng Jl1 the I 0-100 s pcnod range tn dctcnrnnc the average velocity strncturc to stations NIL LSA and HYB. In a bootstrap proccs_... of filling. canhquakes progressively farther away and at smaller magnitudes and sho11er periods we refined both the models and the regions over which the models arc valid.
l.hing our bc:-.t models for western India and a pure explosion source we find the Rayleigh waves from the May 11, 1998 tests have the opposite polarity over the 10-50 s period b:rnd than expected at NIL. Such reversed Rayleigh waves indicates significant tectonic rclea\c with a stress release moment greater titan the- explosion "moment .. Rc\'Crscd R.i:vlcigh wa\·cs have been observed prev10ui;ly in <)!hct nuclear tC\tS, notably m Ka1akhs1an m the mi<l 1980',; by Rygg and other!-. fixing the .... 1Lc of the explosion fiom rhc mh v,c use 1hc v,•,1veform fit to find the size and mechanism of the tectonic 1clca:-.c. wllicli appca1s consistent with the tectonics. \Ve arc i..:urrcntlv invcstit!ating what effects, ir,111y. thi:-. tectonic release has on discriminant.., u<.;crl to idcnlif), cxrl~sion;
··1111 ... r,·~,·.urli w,1, p,:1formcd un<lcr the auspice~ ofth..: \.i.S l1,·p.11tn1,·n1 ill l·:1w1.~1\' hv I ,1w1c11n: l.1,,·1111n1r i\'.1111111.111 ahrnwrn) undc1 nm!ract number \\'-7405-E'.\.(,-J.;,i
Amplitude Corrections for Regional Seismic Discriminants TAYLOR, S.R., VELASCO, A.A., HARTSE, H.E., PHILLIPS, WS., Seismic Research Center, Los Alamos National Laboratory, Los Alamos, NM 87544, WALTER, WR., and RODGERS, A.J., Lawrence Livermore National Laboratory, Livermore, CA 94551
We present an update on seismic event identification methodologies being investigated as part of the Department of Energy CTBT R&D program. A fundamental problem associated with event identification lies in deriving corrections that remove source and path effects on regional phase amplitudes used to
construct discriminants. Our goal is to derive a set of physically based corrections that are independent of magnitude and distance, and amenable to multivariate discrimination by extending the technique described in Taylor and Hame ( 1998). For a given station and source region, a number of well-recorded earthquakes are used to estimate source and path corrections. The source model assumes a simple Brune (1970) earthquake-source that has been extended to handle non-constant stress drop. The propagation model consists of a frequency-independent geometrical spreading and frequency-dependent powerlaw Q. A large-scale search is performed simultaneously at each station for all recorded regional phases over stress-drop, geometrical spreading, and frequency-dependent Q to find a suite of good-fitting models that remove the dependence on mb and distance. Seismic moments can either be inverted for or fixed and are tied to mb through two additional coefficients. We also solve for frequency-dependent sire/phase excitation terms. Once a set of corrections is derived, effects of source scaling and distance as a function of frequency are applied to amplitudes from new events prior to forming discrimination ratios. Thus, all the corrections are tied to just mb and distance and can be applied very rapidly in an operational setting. Moreover, phase amplitude residuals as a function of frequency can be spatially interpolated (e.g. using kriging) and used to
construct a correction surface for each phase and frequency. The spatial corrections from the correction surfaces can then be applied to the corrected amplitudes based only on the event location. The correction parameters and correction surfaces can be developed offiine and entered into an online database for pipeline processing providing multivariate-normal corrected amplitudes for event identification.
An Unusual Seismic Event from Qinghai Province, China HARTSE, H.E., and VELASCO, A.A., Seismic Research Center, Los Alamos National Laboratory, Los Alamos, NM, 87545, [email protected], [email protected]
On December 6, 1997 at near 04h53m GMT a seismic event with mb near 4.5 occurred in a mountainous region of the east-central Qinghai Province, China. The event was detected at regional and teleseismic distances and was located by rhe Prototype International Data Center (PIDC) and by rhe National Earthquake Information Center (NEIC). Both organizations fixed the depth when estimating the event's location. We do not have China Seismological Bureau
228 Seismological Research Letters Volume 70, Number 2 March/April 1999

(CSB) bulletins from 1997, but earlier Chinese and NEIC catalogs indicate that the event occurred in a region of high seismicity, where earthquakes with mb's near 5.5 occurred in the late 1980's and early 1990's. The PIDC estimated an mb of 4.2 and an Ms (using only 2 stations) of 3.4 for this event. Using the PIDC mb:Ms event screening criteria this event falls within the earthquake population. We obtained waveforms for this event from Chinese Digital Seismic Network (CDSN) stations and from stations in adjacent countries. In general, signal-to-noise ratios are poor for body waves at frequencies above about 2 HZ, except at stations WMQ (1350 km NE) and MAKZ (2000 km NE). We merged arrival times from the CDSN stations with times from the NEIC and PIDC bulletins and relocated the event using correction surfaces that we have developed for events within China. Our relocation moved the event about 10 km further south, but we could not constrain depth. Surface waves at periods between about 15 and 25 seconds generally have good s/n ratios at most regional stations. Because we do observe dear surface waves, we assume the event was not unusually deep. At WMQ we observe that Pn above 1 Hz is unusually strong relative to the shear phases Sn and Lg, and Pn is also unusually strong relative to the Love and Rayleigh waves. We do not know the cause for these observations. The event could be some type of a large mining explosion, or it could be an earthquake with an unusual source radiation pattern. Nearby earthquakes do not exhibit unusual levels of Pn energy relative to accompanying shear and surface waves. Hence, we rule out path effects as the cause of these observations. We are currently calibrating surface wave paths using larger nearby earthquakes in preparation to estimate a moment tensor solution for this event.
A Preliminary Regionalized Velocity Model ofthe Pakistan/India Region for Use in Seismic Monitoring Applications BERNARD, M., REITER, D.T., and RIEVEN, S.A., Weston Geophysical Corporation, Northboro, MA 01532, USA, [email protected].
We present a preliminary three-dimensional velocity model for the region of central and southern Asia that includes Pakistan, western India, Afghanistan, central-Asian states of the former Soviet Union, and eastern Iran. Data and results of existing studies have been collected and integrated to derive a preliminary velocity model of the region that has the most complete and coherent coverage presently available. This preliminary model will be used in a joint tomographic inversion for improved high-resolution velocity models and locations of regional and teleseismic events from the area. High resolution velocity models are important for accurate location estimates, which are critical to the successful monitoring of a Comprehensive Test Ban Treaty. Accurate velocity models also provide the foundation for other projects such as realistic synthetic seismogram generation for specific wave paths, accurate focal depth determination, and phase blockage prediction.
In most studies of the region surrounding Pakistan, the focus has been on the generation of models for the Hindu Kush and Tien Shan regions. While these studies provide valuable information on crust and mantle structure in sections of the Pakistan/India region, there has not yet been a concerted effort devoted to defining a unified 3-D regional model suitable for seismic monitoring applications. For areas deficient in previous research that defines a velocity model, we have built an estimated model based upon other sources of information such as structure, geology, and other types of geophysical measurements (e.g., density) that can be related to the seismic wave velocity.
Amplitude Tomography for Regional Seismic Verification PHILLIPS, W.S., HARTSE, H.E., TAYLOR, S.R., VELASCO, A.A. and RANDALL, G.E., Seismic Research Center, Los Alamos National Laboratory, Los Alamos, New Mexico, 87545, USA, [email protected]
We apply tomographic techniques to amplitude and amplitude-ratio data to quantify regional phase path effects for use in discrimination studies. After removing source-scaling effects based on mb, we solve for resolvable combinations of attenuation, source-generation, site and spreading terms. Least-squares solutions, including resolution and covariance, are obtained using a Jacobi conjugate gradient, sparse matrix solver. First difference regularization is used to remove singularities and reduce noise effects, with weighting chosen to balance variance reduction and model smoothness. We applied the technique to a data set of 1393, 0.5-1.0 Hz, Pg/Lg amplitude ratios from 11 stations for paths inside a 30 by 40 degree box covering western China and surrounding regions. Variance was reduced 58% from a Hat model by inverting for spatially varying Pg/Lg relative attenuation and 61 % after including relative spreading terms. Relative site effects were excluded from the inversion after tests showed little variation amongst well resolved site terms and a marked tradeoff between poorly resolved site terms and attenuation. We find the lowest Pg/Lg attenua-
tion associated with the Tibetan Plateau and moderately low values with the Ordas, Tarim and Junggar basins and the Qilian Shan and Tien Shan ranges. High Pg/Lg attenuation is found for Mongolian island arcs and stable regions to the north, as well as the Guangxi platform. Relative spreading follows a distance power law with exponent -0.2 our to 1200 km and +0.5 beyond. The -0.2 spreading rate is reasonable for Pg/Lg, while the +0.5 rate may reflect a transition from Pg to P coda and the influence of mantle P at large distances. Interpolated (kriged) tomography residuals show coherent geographical variations, indicating unmodelled path effects. The residual patterns often follow geological boundaries, which could result from attenuating zones that are too thin to be resolved or that have anisotropic effect on regional phases. Such patterns suggest directions for technique development. In addition, the interpolated residuals can be combined with tomographic predictions to account for path effects in discrimination studies.
Ground Truth Source Parameters and Locations for Earthquakes in Central Asia WOODS, B.B., SAIKIA, C.K., and THIO, H.K., URS Greiner Woodward Clyde Federal Services, Pasadena, CA 91101, [email protected].
We have determined focal depth and source parameters (Mo and mechanism) for 26 earthquakes in central Asia for use as ground truth information for calibrating this region. These results will furnish ground-truth information for seismic discriminant portability and regional calibration studies. We are using this information to better refine crustal models for this region which will be used to relocate these events and to provide better Green's functions for analyzing and locating future events. Source information was obtained through a combination of regional waveform inversion and modeling of releseismic P-wave depth phases. This latter method was the primary means of determining source depth. P-wave modeling of short-period records allowed analysis of smaller events and yielded better resolution of waveforms than did displacement records. The re!eseismic P-wave analysis provides good depth resolurion, and the source mechanisms are compatible with the CMT solutions for 25 of 26 the events studied, suggesting that these results are accurate. The teleseismic depths are shallower than CMT values by 8.0 km, on average. Our initial regional model did not fit all paths we!!, therefore the regional waveform inversion results are considered tentative. To refine the regional crustal models, source depths and mechanisms for the large, or "master", events determined from the te!eseismic analysis will be used to help constrain waveform fits. With these improved regional models we will relocate these events. The refined regionally-determined locations we obtain from modeling these events will provide improved data for constructing regional phase travel-time surfaces and other such calibrations.
Path Corrections, Kriging, and Regional Seismic Event Location in China STECK, L.K., VELASCO, A.A., and COGBILL, A.H., Seismic Research Center, Los Alamos National Laboratory, Los Alamos, NM 87545, USA, [email protected]
To improve the regional location of seismic events in western China, we have developed empirical propagation path corrections (PPCs). We have concentrated on corrections to observed P arrival times for shallow events (depths less than 33 km), using observations available from the USGS ED Rs, the ISC catalogs, depth-constrained events from waveform modeling, well-located nuclear explosions at Lop Nor, and our own picks from regional data. We relocate events from a region encompassing most of China. Initially using a global travel-time model and a method that permits us to separate measurement error from modeling error, PPC surfaces are constructed from residuals of welllocated events. Bayesian kriging is used to fit a surface to the residual data, and to interpolate in regions oflimited data coverage. We find that the isotropic variogram model does not fit our observations we!!. As a result, we limit our blending range to an ad hoc maximum of 6 degrees and only use variogram information within that range if evidence supporting its use is compelling. The modeling error is defined as the travel-time variance of a particular model as a function of distance, while measurement error is defined as the picking error associated with each phase. We estimate measurement errors for arrivals from the EDRs based on round-off or truncation, and use signal-to-noise for our travel-time picks from our waveform data set. Most of the events we use to construct our PPC surfaces are estimated to be GT20, that is, we believe them to be located to within 20 km. To account for these errors we propose to calculate an error for each event based on its location covariance matrix, assuming a location error of 20km. Standard global velocity models produce a distance bias in the travel-time residuals for the China region. We have eliminated this bias by constructing a new 1-D model for China based on published velocity cross-sec-
Seismological Research Letters Volume 70. Number 2 March/April 1999 229

tions for the region. We compare our 1-D model with other models for Asia from both Western and Chinese researchers.
Monday P.M., May 3, 1999-Rainier Room Posters Earthquake Hazards and Risks
Hokusai's "Great Wave" is Not a Tsunami BERGLOF. W.R., University of Maryland, Asian Division, Unit 5060 Box 0100, APO AP 96328-0100, [email protected]
The "Great Wave," a woodblock print by Katsushika Hokusai (1760-1849), is one of the best known works of Japanese art; it has been reproduced repeatedly. Because it includes a spectacular wave is has provided an attractive illustration for writings about tsunamis. Some of these have suggested, without elaboration, that the print shows "a tsunami." However, it is not likely that Hokusai intended to portray a tsunami, especially a specific event. He began producing scenes of waves as early as 1797, more than thirty years before publication of the Great Wave (around 1830), and probably borrowed the original wave idea from another artist. He included waves, often similarly exaggerated and stylized, in numerous works, along with so many other views of water in various forms (e.g., waterfalls), chat he is often called the ''.Artist of Water." Japanese catalogs of tsunamis do not include events in his lifetime chat obviously would have inspired him, although he could have known about others. Much attention has been focused recently on a tsunami that apparently struck Japan in January, 1700, originating from an earthquake in the Cascadia subduction zone. le is not a likely inspiration for Hokusai as it occurred about 100 years before he began experimenting with waves. The Great Wave is one of a series of prints entitled "Thirty-six Views of Mount Fuji" (acrually forty-six), and should not be viewed in isolation from the rest of the series. Mount Fuji has long been an object of veneration in Japanese culture; although it appears in the background in the Great Wave, it was the unifying theme of the series, which includes ocher wellknown prints such as the "Red Fuji" in which the mountain is much more prominent. Hokusai was a prolific artist who produced some 30,000 works in his seventy-year career and drew ideas from many sources. The Great Wave print is best viewed as the culmination of a thirty-year series of artistic experiments but not as a classic depiction of a tsunami.
Probabilistic Seismic Hazard Maps for the Central United States HERRMANN, Robert B., AKINCI, Aybige, and ORTEGA, Roberto, Department of Earth and Atmospheric Sciences, 3507 Laclede Avenue, Sr.Louis, MO, 63103, USA
We present initial results for new probabilistic seismic hazard maps for che Central United States as part of an effort to update the 1996 NEHRP probabilistic seismic hazard maps for the region, by incorporating for the effects of deep alluvial sediment deposits which sometimes exceed of 1000 m in the Mississippi Embayment. The problem of the soil amplification is a particular importance to much of the Central United States since 96-NEHRP hazard maps give expected ground motion for single nationwide site 'BC-Boundary".
We estimated more realistic site effects within the Mississippi Embayment, by prototyping shear-wave velocity and Qs models for nominal 600m thick deposits as a functional relationship that fits estimates of soil column attenuation and shallow (NUREG/CR-0985, 80) and deep borehole (USGS Linda Well) velocity logs in the Embayment. The site amplifications are computed by using the quarter-wavelength approximations, introduced by Joyner er al., (1980) in the frequency range from 0.2 to 20 Hz.
The hazard analysis uses ground motion magnitude-distance tables constructed by combining the soil thickness amplification with the 1996 USGS ENA model to produce maps at 2%, 5% and 10% probability of exceedance in 50 years. The effect of soil thickness is so profound that che use of the 1996 maps is in question for many CUS sires.
A Methodology to Estimate Site-specific Seismic Hazard for Critical Facilities on Soil or Soft-rock Sites LEE, R.C., M.E. MARYAK, Westinghouse Savannah River Co., Aiken, SC 29808, [email protected]; and J. KIMBALL, Department of Energy, Washington, DC 20874, [email protected].
Site-specific probabilistic seismic hazard assessments (PSHAs) and associated seismic design bases are critically dependent upon the local geological and geo-
technical model. For reactor and critical non-reactor facilities on soil or softrock sites exhibiting strain-dependent behavior, estimates of site response can change significantly as site measurements and inferred structure evolve. Consequently, use of those PSHAs for hazard and risk assessments are problematic if the site response is out of dace As an alternarive, a PSHA can be computed for a hard-rock outcrop horizon (at depth) then a sire-specific amplification function can be used to compute a site-specific surface PSHA. In this paper, we describe an application of an exact approach to obtain a soil or soft-rock surface PSHA from an available hard-rock PSHA, and site-specific amplification functions.
The methodology to compute site-specific soil surface hazard requires a disaggregation of hard-rock hazard for a range of bedrock motions and selected oscillator frequencies. First-differences are taken of the disaggregation elements between adjacent levels of hard-rock motion, resulting in disaggregation matrices for che probability of occurrence of the mean bedrock motions. For each of a selected range in surface soil motions, probability of exceedance of the surface morion is computed using the appropriate distribution of the site amplification functions and this is summed for each bedrock motion and for every magnitude and distance in the disaggregation. This process is repeated for each surface motion to form a surface hazard curve (Cornell and Bazzurro, 1997).
This analysis results in a site-specific PSHA for soil or soft-rock sires by continuing the hazard from bedrock to the soil surface using derailed soil response functions. Earthquake magnitude and ground motion level dependence of the site response is accommodated by developing sire response functions consistent with the distribution of earthquake magnitude and ground motion levels obtained from dissaggregating the bedrock uniform hazard spectrum. Examples of hazard curves will be shown chat illustrates the effect of soil strain dependence on che shape of the hazard curve.
Geologic Hazards Assessment for U.S. Navy Installations, Western United States WELLS, D.L., CHASE, E.G., POWER, M.S., and BEUKELMAN, G., Geomatrix Consultants, 100 Pine Street, 10th Floor, San Francisco, California ([email protected], [email protected], [email protected])
Seismic-geologic hazards, including surface-fault rupture, soil liquefaction, soil differential compaction, earthquake-induced landsliding, and earthquakeinduced flooding, were evaluated at 12 U.S. Navy installations in the western U.S. as part of the Navy's program for seismic evaluations of buildings. These studies assessed whether significant (life-threatening) hazards existed or whether additional data are necessary to evaluate potential hazards. An additional objective of the studies was to identify the NEHRP soil profile type. The studies were performed using only existing information, and conservative screening and simplified evaluation procedures. The procedures enabled rapid and cost-effective evaluation of hazards for large numbers of buildings. The nature and extent of the potential hazards identified varied greatly from installation to installation. Where potential significant hazards were identified, they typically were limited to localized areas at most installations. Widespread potential hazards were identified adjacent to coastal waters at a few installations. For the installations evaluated during this study, the most important hazard in terms of buildings affected and life-safety concerns was soil liquefuccion. Alternative schemes for hazard mitigation were described for buildings where potential seismic-geologic hazards were identified. Because these evaluations were based only on existing information, additional studies should be performed to confirm che severity of the hazards and to collect daca for developing site-specific hazard remediation plans.
A "Floor" for Seismic Ground Motions for the Most Stable Part of Canada ADAMS, T., HALCHUK, S., Geological Survey of Canada, 7 Observatory Crescent, Ottawa KIA OY3, Canada, [email protected]; and FENTON, C.H., URS Greiner Woodward-Clyde, 500 12th Street, Suire 200, Oakland 94607-4014, CA, [email protected].
The 4th Generation seismic hazard model of Canada (see WWWseismo.nrcan.gc.ca) will form the basis for the first Canadian building code revision of the new millennium. The model uses the Cornell-McGuire method with two complete earthquake source models to represent the uncertainty in where (and why) earthquakes will happen. However, about half of che Canadian landmass has roo few earthquakes co define reliable seismic source zones, and on prior maps the hazard shown came only from distant external sources, even though international examples suggest large earthquakes might occur anywhere in Canada (albeit rarely). For a reliable estimate of hazard for the Canadian shield, we determined the rate of worldwide seismicity for geologi-
230 Seismological Research Letters Volume 70, Number 2 March/April 1999

cally-comparable regions, as this provides a better estimate of the long term seismic behaviour of an average shield. For 50 million square km of shield we determined N(>=M) = 13800 * exp(-l.84*M) * (l-exp{-1.84*(7.0-M))), a rate of 0.004 Ms >= 6.0 per annum per million square kilometres. Using North American data alone underestimates the rate by 30%.
We compute the hazard {5% damped specttal values for selected periods), using eastern strong ground motion relations, at the centre of a large octagonal source zone with this per-area activity level. For hard-rock at the 2% in 50 year probability level, it is: PSA0.1=7.9%g; PSA0.2=5.5%g; PSA0.3=3.8%g; PSA0.4=2.7%g; PSA0.5=2.lo/og; PSA1.0=0.7%g; PGA=5.3%g; PGV=0.014 mis. Our selection of comparable shield areas was conservative, so these values are expected to be the lowest likely for any part of Canada, and so form an appropriate "floor" for seismic design. Use of the floor eliminates the lowest contour from many of the prior hazard maps. The 2% in 50 year probability level (approx. 1/2500 years) is now considered to provide a better basis for achieving a uniform level of building safety across Canada.
TRIGGERING OF EARTHQUl\l<ES BY EARTHQUAKES: PREDICTION POSSIBILITIES IN GREECE PAPADOPOULOS, G.A., In:;titute of Geodynamico, National Ob::;ervatory of Athen::;, 118 10 Athen::;, Greece, g.papad@egelado~.gein.noa.gr
ob~ervation:; made in California, Greece and el~ewhere about earthquake clu::;tering::; occurring beyond chance in adjacent or spatially isolated ::;ei::;mic zones, at di::;tancej ranging u::;ually between 200 km and 900 km, indicate that ::;ome earthquake:; are triggered by other earthquakes. When thi::; domino-like phenomenon takes place as a systematic synchronization between two particular zone::;, then the trig:;,ering earthquake i::l bearing a precursory nature to the triggered one. A geophy::;ical mechani::;m has been developed to explain (i) how after ::;ome initiation the proces::; is accelerating leading to the clu::.tering by rupturing a number of near to failure prest~ained regions, and (ii) why a preferential corre.spondance occurs in the case of synchronization. During the last years an effort was made in Greec::e to produce complete earthquake predictio~ statements, containing locat~o~-timemagnitude window::; of the anticipated event and the probability for it::; occurrence, on the basi3 of the synchronization process between several couples of sei.:lmogenic zones. Three out of three ::;hart-term and medium-term prediction::; were proved succe::;::;ful for earthquake~ chat actually occurred on 15 June 1995 (M=6.l),2 February 1996 (M=S.6) and 18 November 1997 (M=6.6). Thio io a contribution of the ASPELEA Project supported by EU-OGXII - Inca Copernicu::;, Contract n. IC-lSCT-97-0200.
The Memphis-Shelby County Seismic Hazard Mapping Project SCHWEIG, Eugene S., and GOMBERG, Joan S., U.S. Geological Survey and CERI, Memphis, TN 38152, [email protected].
The U.S. Geological Survey has embarked on a large-scale urban seismic hazard mapping project in Memphis, Tenn., one of three urban areas chosen for such efforts. Memphis was selected as typical of the central and eastern U.S., having a paucity of seismically engineered buildings and infrastructure and relatively low regional attenuation. Memphis has a dense urban population near major faults and a high probability of a moderate earthquake in the near future. A sound scientific foundation has already been established in the region.
We consider the early inclusion of potential users and critics of the maps as critical to creating useful products. Thus, we created an Advisory Board of users and researchers, comprising earth scientists, engineers, emergency managers, city planners, utilities, and others. With the Board's input we put together a plan that will result in a series of products through 2002. The major products envisioned include surficial geology maps, subsurface geological and geotechnical databases, liquefaction and landslide susceptibility maps, ground motion amplification maps, and deterministic and probabilistic ground motion maps. All products will be accessible digitally. The area covered by the maps is about six 7.5-minute quadrangles.
During the course of this project, the USGS and its parrners in the MidAmerica Earthquake Center, the external USGS-NEHRP program, the Central U.S. Earthquake Consortium, the Organization of CUSEC State Geologists, and at universities will be collecting and analyzing data to better define earthquake recurrence, attenuation, and site effects. Recurrence studies underway include mapping of paleoliquefaction features and regional GPS surveys. Studies focusing on the Memphis area include geologic mapping of surficial deposits, definition of shallow shear velocity structure using seismic reflection methods, and in situ measurement of both microtremors and earthquakes to characterize variations in site amplification. In addition to the hazard maps and derivative products, the project already has begun serving as a focal point for research on fundamental scientific questions, for community outreach, and for mitigation activities.
Near-surface Shear-wave Refraction and Soil Velocity Measurement WANG. Z., Oregon Department of Geology and Mineral Industries, 800 NE Oregon Street #28, Suite 965, Portland, OR 97232, [email protected].
Shear-wave velocity is the most commonly used parameter to quantify seismic hazards due to local soil condition. An effective and reliable shear-wave velocity measurement is an important element in seismic hazard evaluation. Near-surface shear-wave refraction has been widely used for shear-wave velocity measurements in regional seismic hazard evaluation, but not in site-specific evaluation. The purpose of this study is to compare this near-surface refraction method with down-hole shear-wave measurement, which is commonly used in site-specific seismic hazard evaluation. In this study, the shear-wave (SH) was generated with a 1.5-ft section of steel I-beam struck by a 4.5-kg sledgehammer horizontally. The 30-Hz horizontal component Mark Product geophones were used to record refraction signals with geophone spacing of 5 ro 1 Oft. OYO medol-3315 three component geophone was used to record the down-hole signals. The data was collected using a 12-channel Bison 5000 seismograph. The data from 15 down-hole sites and 22 refraction sites collected in EugeneSpringfield and Klamath Falls areas, Oregon were used in this study. The results show that the surface refraction method can provide a reliable shear-wave velocity measurement for site-specific seismic hazard assessment. The method can also provide the subsurface information. The advantage of the refraction method is cost- and time-effective.
Radar Imagery of Fault Breaks in Soil: San Andreas and Hayward Faults, Central California KAYEN. R.E., BARNHARDT, WA., FUMAL, T.F., CARKIN, B., and MINASIAN, D., U.S. Geological Survey, Menlo Park, CA 94025 USA, [email protected]
We investigated the geometry and near surficial character (depth < 10 m) of breaks along the San Andreas (SAF) and Hayward faults (HF) using ground penetrating radar (GPR). The sites include a small alluvium-ponded depression behind a shutter ridge (Watsonville, SAF). a broad alluvial fan (Fremont, HF), and a sag pond (Oakland, HF). We ran GPR reflection surveys across and parallel to the faults ro evaluate the effectiveness ofGPR in identifying fault splays and possible offset piercing structures. A parametric analysis was undertaken to assess the importance of transmission frequency (50-100-200 MHz), antenna separation, shot step, shot-stack number, and post-process filtering in resolving features from the surface to several meters below reasonable trenching depths.
We found G PR was able to successfully identify fault traces, although differences in physical properties at each site greatly influenced the resolution potential of any given radar system configuration. The GPR system resolved a previously unidentified buried channel that crossed the SAF at a high angle, and was apparently offset by recent activity along this strand. This channel was subsequently revealed through trenching. We developed a preliminary set of three independent criteria useful for identifying individual fault splays, or broader zones of disruption expected of flower structures: I) clear dislocation and offset of reflectors, 2) sub-horizontal reflectors transitioning into a zone of chaotic reflectors, and 3) ponded ground water on one side of a fault resulting in differential radarsignal attenuation.
Internal Structure of Earthquake-induced Landslides in Anchorage, Alaska BARNHARDT. WA. and KAYEN, R.E., U.S. Geological Survey, Menlo Park, CA 94025, [email protected]
Ground-penetrating radar (GPR) was used ro investigate the internal structure of two earthquake-induced landslides that struck Anchorage in 1964. Our objective was to examine well documented landslides at Government Hill and Turnagain Heights, and thereby improve recognition of ancient examples in the geologic record. At each site, sand and gravel outwash overlies the Bootlegger Cove Formation, a silty clay unit of glacial-marine/lacustrine origin. GPR velocities in the surficial outwash range from 0.10 to 0.12 m/ns, as determined from common midpoint (CMP) surveys. These data indicate that outwash deposits are 5 and 12 m thick at the two sites, comparable to direct measurements made just after the earthquake. Both slides were translatory and failed along weak zones in the underlying clay, but the style of ground deformation is different. The Government Hill slide represents a relatively simple earth block glide with horst and graben structures, which remain practically intact. Normal faults on the margins of grabens exhibit 2-3 m of throw, offsetting the originally horizontal ourwash/clay contact. Ground cracks or fissures create anomalous reflections within the outwash, but the actual failure plane within the clay was not observed. The larger, more complex failure at Turnagain Heights is best
Seismological Research Letters Volume 70, Number 2 March/April 1999 231

classified as a disintegrative landslide. It exhibits a chaotic internal structure, probably a result of complete flow disintegration of the bluff during the earthquake. The observed morphology and incoherent stratigraphy is indicative of Just such an unlimited and highly destructive flow slide. Home construction has recently resumed on parts of the slide, yet the disrupted soils have not regained rheH peak strength. Indeed, remolding of the highly sensitive clay leaves the bluffs m a pre-weakened state, and may actually increase the potential for future failure.
Tuesday A.M., May 4, 1999-0lympic Room Ancient Earthquakes and Active Faults in the Pacific Northwest Presiding: Brian Atwater and Brian Sherrod
Seismotectonics of the Eastern Aleutian Subduction Zone: An Analog for Great Tsunamigenic Earthquakes in Southern Cascadia? PLAFKER, G., U.S. Geological Survey, Menlo Park, CA 94025, [email protected]; and CARVER, G.A., Dept. Geology, Humboldt State University, Arcata, CA 95521, [email protected]
Similarities in large scale structure of the eastern Aleutian and southern Cascadia subduction zones including shallow dips, continental margin settings, wide fold-and-thrust belts that extend onshore, and wide and complex transitions to transform boundaries allow comparisons to assess rhe potential seismotectonics of Cascadia. The eastern Aleutian subduction zone ruptured for 800 km during the great 1964 Alaskan earthquake (Mw 9.2), and smaller ruptures in 1979 and possibly 1899 broke onshore segments of the plate interface associated with crustal blocks near the transition to the transform boundary. During rhe 1964 earthquake upper plate splay faults on Montague Island and off Middleton Island accommodated at least 23 meters of slip, equal to most or all of the coseismic slip along the plate interface. Slip on the intraplare faults caused most of the seafloor uplift that generated the large tsunami that accompanied the earthquake. Similar seismotectonic processes at Cascadia would involve short segment ruptures at the structurally complex southern end of the subduction zone, and a great megarhrust earthquake associated with large displacements on the Little Salmon and related offshore systems of thrust faults to the north. Partitioning of much of the total slip onto steeply-dipping intraplate thrusts would result in vertical sea floor deformation and associated large tsunamis consistent with the extensive paleotsunami deposits found along the southern Cascadia coast.
Palynological Evidence for Crustal Subsidence during the Last Cascadia Subduction Zone Earthquake, Totino, Vancouver Island, Canada HUGHES, J.F. and MATHEWES, R.W, Simon Fraser University, Department of Biological Sciences and Institute for Quaternary Research, Burnaby, BC V5A 1S6, Canada, [email protected], [email protected]; and CLAGUE, J.J., Simon Fraser University, Earth Sciences and Institute for Quaternary Research, Burnaby, BC V5A 1S6, Canada, [email protected].
We _hypothesize that coseismic subsidence during great earthquakes at the Cascad,a subduct10n zone altered vegetation in Pacific coast tidal marshes from northern California to central Vancouver Island. Palynological and modern plant ecological studies of sediments at these marshes may provide estimates of the magmtude of subsidence during the earthquakes. Such studies have been undertaken at English Cove, southeast ofTofino on western Vancouver Island, British Columbia. The Tofino area subsided during the most recent Cascadia subduction zone earthquake in A.D. 1700. Stratigraphic evidence for rhe earthquake includes a buried marsh peat abruptly overlain by a sand sheer, presumably of tsunami origin. The sand, in turn, is overlain by intertidal mud which grade.5 up mto peat of the present-day marsh. These changes are reflected in foram1mferal, nmogen, carbon, and particle-size data. Preliminary palynological darn show that a well developed high marsh, indicated by pollen of Poaceae, Galium, and Potentilla, Achillea, and Angelica types, existed at the head of Er'.glish Cove prior to the A.D. 1700 earthquake. Following the earthquake, this vegetation was replaced by a low marsh environment due to subsidence. Comparison of the elevations of modern analog high and low marsh environmencs suggests that the amount of coseismic subsidence at English Cove was at least 0.5 m. Further development of the palynological and modern plant ecological records for this and ocher areas will provide a better understanding of the pattern and magnitude of subsidence accompanying great Cascadia earthquakes.
Paleotsunami Evidence from Northern California for Repeated Long Rupture (M 9) of the Cascadia Subduction Zone CARVER, G.A., ABRAMSON, H.A., GARRISON-LANEY, C.E., and LEROY, T., Department of Geology, Humboldt Stare University, Arcata, CA 95521 carver ak@hormailcnm
Sand sheets in the coastal marshes and ponds at 7 sites in northern California show that high run up-height tsunamis have repeatedly inundated the coast durin? the late Holocene. The sand layers exhibit stratigraphic, sedimentologic and m1cropaleontologic characteristics indicative of deposition by locally generated tsunamis. Multiple AMS 14-C ages from 4 sites indicate that 6 northern California tsunami deposits correlate with the chronology of Cascadia subduction zone earthquakes inferred from subsidence stratigraphy along the coast of Washington state. The California marsh sediments contain a single sand layer for each of the regionally recognized subduction zone events during the past 3 ka, suggesting segmented rupture of the subduction zone between northern California and Washington Seate did not occur during che last 6 seismic cycles. The paleotsunami evidence from northern California indicates the Cascadia subduction zone repeatedly produces long ruptures and magnitude 9 earthquakes.
Radiocarbon Dating of a Seattle Earthquake to A.O. 900-930 ATWATER, B.F., USGS at Univ. Wash., Seattle, WA 98195-1310 [email protected]
Ages from a Douglas fir log at West Point, Seattle, clarify the time of an earthquake previously dared to about A.D. 900-1000.
The log probably rode the tsunami from an earthquake on the Seattle fault (Science 258, 1614-1617 [1992]). Ar West Point this tsunami deposited sand on a bulrush marsh chat subsided during the earthquake. The log flattened bulrush stems as it came to rest on the sand.
The log had not been dead for long. It had not been rotting in a forest or rolling on a beach, for in 1992 it retained bark around all but its top side. Moreover, the log's outer 15 rings gave an age (1100+/-15; QL-4644) similar to chat of bulrush stems from the subsided marsh (1108+/-l 6; QL-4623) (radiocarbon years before A.D. 1950; lab number). . The time of tree death has now been narrowed to AD. 8. This range mcludes the 95-percent confidence interval. It is based on QL-4644 (death after 899) and on the age of wood 35-45 rings inward from bark (1225+/-15; QL-4949; death before 928). Older wood gave ages of 1212+/-15 (rings 55-65; QL-4950) and 1205+/-15 (rings 75-85; QL-4679) that track a plateau in radiocarbon rime. To convert to calendar time I used an error multiplier of 1.6 (Radiocarbon 28, 805-838 [1986]) and new calibration data (Radiocarbon 40, 1041-1083 [1998)).
A round-number range of A.D. 900-930 probably applies nor only to the subsidence. and tsunami at West Point bur also to complementary uplift along the south side of the Seattle fault. It further applies to strong shaking in Seattle 1f, as mferred from cree-rmg pattern marching (Science 258, 1621-1623 [1992]), the dated log died during the same year and season as did trees char rode landslide blocks to the bottom of Lake Washington.
Special thanks to Minze Sruiver, Phil Wilkinson, Paula Reimer (daring); Bryce Eipert, Boyd Benson (sampling); Kevan Sharp, Ihah Kilfeh (access).
Evidence for at Least Three Moderate or Larger Earthquakes near Everett Washington, Since about A.O. 800 ' BOURGEOIS,]., (Department of Geological Sciences, University of Washington, Seattle, WA 98195-1310; [email protected]); JOHNSON, S.Y, U.S. Geological Survey, MS 966, Box 25046, DFC, Denver, CO 80225; [email protected])
Curbanks along distriburaries of the lower Snohomish River delta in the Puget Lowland of Washington State show evidence of at least three liquefaction events, at least one tsunami, and at least one abrupt land-level change since about AD 800. The most distinctive, broadly correlative unit is a couplet typically comprising a thin (0.5-3 cm), commonly laminated, fining upward sand bed overlain by 2-10 cm of gray clay. We interprer the sand bed as a tsunami deposit. Sand dikes and sand-filled cracks (as wide as 1 m) terminate upward (in some cases feeding sand volcanos) at the stratigraphic level of the couplet horizon. Vegetation and sediment-color changes in strata below and above the couplet indicate an abrupt lowering of the marsh surface by as much as 50 cm. Cl4 ages from the couplet and associated features are AD 700-1000, overlapping the AD 900 age of a large earthquake on the Seattle fault 50 km to the south.
At least two younger secs of liquefaction features-sand dikes that locally feed sand volcanoes-are present higher than the couplet in rhe cutbank sec-
232 Seismological Research Letters Volume 70, Number 2 March/April 1999

tion. Cl4 ages of AD 800-1100 on the older set also overlap the age of the large Seattle fault paleoseismic event. Lower bracketing ages on the younger set (AD 1400-1600) are slightly older than the great AD 1700 Cascadia subduction zone (CSZ) earthquake. Possible evidence of other earthquakes in the cutbanks includes a sharp lithologic change (c. AD 1200), perhaps caused by coseismic subsidence of the delta, and one or more older, distinctive coarse sand laminae (AD 300-500 or older), which may be tsunami deposits.
Possible sources for earthquakes affecting the Snohomish delta, other than the Seattle fault and Cascadia subduction zone, include nearby crustal faults such as the South Whidbey Island fault ( l 0-15 km SW) and Devils Mountain fault (35 km N), and deep-crustal structures in the downgoing slab. Much more paleoseismologic data from the Puget Lowland will be needed before all the paleoearthquakes recognized in the Snohomish River delta and at other sites can be widely correlated and tied to specific sources.
A Fault Scarp of Probable Holocene Age in the Seattle Fault Zone, Bainbridge Island, Washington BUCKNAM, R.C., U.S. Geological Survey, Golden, CO 80225, [email protected]; SHERROD, Brian L., Department of Geological Sciences, University of Washington, Seattle, WA 98195, [email protected]; and ELFENDAHL, Gerald, 7823 Westerly Lane NE, Bainbridge Island, WA 98110, [email protected].
A recent aerial survey of Bainbridge Island done for the Kitsap Public Utilities District, Washington, highlights a previously unrecognized lineament in the Seattle fault zone. The new laser technology used for the survey is effective in mapping the ground surface in heavily wooded areas. Digital shaded relief maps derived from the laser data show a sharply etched, nearly continuous, 2-kmlong east-trending lineament crossing southern Bainbridge Island, 2. 5 km south of Eagle Harbor. The lineament lies near and parallels one strand of the Seattle fault zone mapped by the U.S.G.S. from marine seismic reflection surveys. South-facing scarps along the lineament are 1.5 m to 10 m high. Relief along the lineament, which we infer to be a fault scarp, probably reflects cumulative offset during a series of surface-faulting earthquakes.
Southern Bainbridge Island is bordered by an uplifted Holocene marine platform formed during an earthquake 1100 years ago. Uplift from that earthquake extends at least 12 km south from the northernmost strand of the Seattle fault zone at Eagle Harbor to Dolphin Point on Vashon Island. The shoreline uplifred during the earthquake is commonly 5 to 7 meters above present high tide, but on the north, uplifted side of the lineament, beach gravel and a second uplifted shoreline are as much as 9 m above present high tide. This second shoreline suggests that some of the uplift north of the lineament is the result of fault slip along the lineament. No scarp similar to chat along the lineament is visible on its projection on to the shoreline platform at Blakely Harbor or Rich Passage, and the lineament is truncated at the eroded shoreline at Blakely Harbor, suggesting that fault movement predates the earthquake 1100 years ago.
Holocene Surface Faulting in the Seattle Fault Zone, Bainbridge Island, Washington NELSON, AR., PEZZOPANE, S.K., and BUCKNAM, R.C., USGS, MS 966, Box 25046, Denver, CO 80225, [email protected]; KOEHLER, R.D., NARWOLD, C.F., and KELSEY, H.M., Dept. of Geology, Humboldt State University, Arcata, CA 9 5 5 21; LAPRADE, W.T., Shannon & Wilson, Inc., Box 300303, Seattle, WA 98103; WELLS, R.E., USGS, MS 975,345 Middlefield Rd., Menlo Park, CA 94025; and JOHNSON, S.Y., USGS, MS 966, Box 25046, Denver, CO 80225
Stratigraphy and structure exposed in rwo backhoe trenches across a south-facing scarp along a strand of the Seattle fault on southern Bainbridge Island shows a long history of folding and faulting. In the 20-m-long Saddle trench, Miocene bedrock has been steeply cilted and highly fractured, probably over thousands to millions of years. The heighr (3 m), slope, and east-west continuity of the scarp bisected by the trench suggest that the scarp formed by thrust faulting and folding within the past few tens of thousands of years. The most prominent fault in the Saddle trench thrusts bedrock and old hillslope sediment over late Holocene hillslope sedimenr. Near the tip of the thrust, A-horizon sediment filling root casts was sheared and overridden by much older sediment during a large earthquake. Multiple 14C ages on charcoal from the sheared sediment demonstrate that the most recent movement on this fault was <3-4 ka.
About 160 m to the west where the scarp is 1.7 m high, the 13-m-long West trench exposes massive bedrock overlain by outwash, diamiction, and proglacial lake deposits associated with the 13-ka retreat of the Puget ice lobe. The glacial sequence has been folded into a monocline 1 m high; a north-dipping thrust fault probably lurks beneath the monocline. A l 4C age from pond/alluvial
deposits near the base of the monocline may indicate that folding is older than 6.7 ka, but the arch-like geometry of a thick, day-rich soil above the monocline suggests folding throughout most of postglacial time. A fissure up to a meter wide extends vertically through all sediment but the modern forest soil in the middle of the trench. An age of 1.2 ka from a cedar needle at the base of the fissure shows that it opened about the time of the earthquake that caused dramatic uplift ofBainbridge Island 1100 years ago. (Access and support provided by Porr Blakely Timber, Inc.)
New Tree-ring Evidence Suggests That at LeastTwo Major Rock Avalanches Were Approximately Contemporaneous with Fault-scarp Damming of Price Lake in the Southeast Olympic Mountains about 1000 Years Ago PRINGLE, Patrick T. 1; LOGAN, Robert L. (Josh) 1; SCHUSTER, Robert L. 2;
PALMER, Stephen P. 1: 1 Washington Division of Geology and Earth Resources,
P.O. Box 47007, Olympia WA, Pat.Pringle, Josh.Logan, and [email protected]; 2US Geological Survey, Box 25046, Denver CO 80225, [email protected]
Both landslide and fault damming can cause submergence or burial of vegetation, which allows both preservation of trees and determination of their times of death. At least six major rock avalanches dammed valleys and killed trees about 1000 radiocarbon years ago in the southeast Olympic Mountains (Schuster and others, I 992). Nearby, Price Lake was formed by fault damming (Saddle Mountain East fault) at about the same time, and a 3-m high fault scarp of unknown age (Canyon River fault) is also proximal (Logan and others, 1998).
We identified characteristic tree-ring patterns in Douglas fir snags from one of the landslide-dammed lakes, Lower Dry Bed Lake (LDBL), and an exhumed forest (1020 +-50 yr B.P.) that was killed by landslide damming and buried by alluviation in the Middle Fork Satsop River about 9 km northwest of LDBL. Matching of indicator rings among the samples also showed that a subfossil tree (having bark) from Price Lake, located about 25 km from the other two sites, died about the same time. However, the extremely fine outer rings of the Price Lake tree prevented positive correlation to the exact year. The outer sequence of narrow rings on all of the samples suggests that the trees had endured a period of drought for at least 5 years prior to their death.
The close correlation of these events, particularly during a drought, strengthens the case that they were triggered by seismic shaking, possibly on the Saddle Mountain Ease fault. New growth cells adjacent to bark in the LDBL and possibly in the Middle Fork Satsop samples suggest that the earthquake that killed the trees occurred in the spring. Similar ring patterns on snags from nearby Lena and Spider Lakes suggest that the landslides damming chose lakes may have been induced by the same seismic event.
Earthquake-induced Subsidence about 11 DO Years Ago around Southern Puget Sound, Washington Brian L. SHERROD, Department of Geological Sciences and USGS (1994-1998), University ofWashington, Box 351310, Seattle WA 98195 [email protected]
Forests and marshes subsided abour 1100 years ago, probably during an earthquake, in two areas at the latitude of Olympia, WA. One area is located south of Shelton (at Little Skookum Inlet), and the other about 30 km to the east on the Nisqually delta (sites along Red Salmon Creek, Nisqually River, and McAllister Creek). The evidence for subsidence consists of forest and marsh soils that appear to have been abruptly submerged in tidal water. At Little Skookum Inlet and Red Salmon Creek, Douglas-fir stumps in growth position are covered by salt marsh peat. Along McAllister Creek and Nisqually River, soils of high salt marshes are overlain abruptly by laminated tideflar mud.
Liquefaction coincided with subsidence at McAllister Creek. Sand erupted through the salt-marsh soil and formed a small volcano. The flanks of the volcano rest directly on the soil surface and beneath the tideflat mud that subsequently buried the soil.
Amounts of subsidence were estimated from fossil seeds and diatoms, and the timing of subsidence indicated by radiocarbon ages. On this basis, the subsidence was greater at Little Skookum Inlet (about 3 m) than at the Nisqually delta localities (0.5-1.2 m). The subsidence took place around A.D. 900. Conventional radiocarbon dates of plant remains suggest that it happened between A.O. 690-1160. High-precision radiocarbon dates of Douglas fir stumps narrows the timing of subsidence to A.D. 860-940 at Red Salmon Creek and AD. 800-970 at Skookum Inlet.
Several alternatives exist for inferring which fault caused the subsidence. A low-angle thrust fault conrinuous with the Seattle fault is among the possibilities because all the above age ranges include 900-930, the probable time of a
Seismological Research Letters Volume 70, Number 2 March/April 1999 233

large earthquake on the Seattle fault. However, the Seattle fault approaches the surface some 75 km to the north of the subsided areas. An alternative explanation invokes the 'Legislature fault' located just south of the subsided area (fault is known mainly from gravity and magnetic mapping).
Character and Age of Tectonically Deformed Pleistocene Deposits in the Central Puget Lowland, Washington State BOOTH, D.B. and TROOST, K.G., Department of Geological Sciences, Box 351310, University ofWashington, Seattle, WA 98195, [email protected] and [email protected]; and HAGSTRUM, J.T., U.S. Geological Survey, 345 Middlefield Road, MS 937, Menlo Park, CA 94025, [email protected]
Recent geologic mapping in the lowlands of Puget Sound has revealed a complex, heretofore undated, and deformed sequence of glacial and nonglacial deposits. Although processes of glacial loading, unloading, and Holocene landsliding have surely created a variety of localized structures in once-horizonral sediments, the regional pattern of inclined deposits suggests a series of west to west-northwest trending fold axes in the oldest exposed sediments, which mimic the current geophysical model of the crustal structure beneath this part of the Puget Lowland.
The age of these structures can be inferred from their expression in deposits of differing ages. We discriminate five broad age categories of Pleistocene deposits: (I) reversely magnetized and so presumably >780,000 yr; (2) normally magnetized but beyond radiocarbon dating range, 780,000-45,000 yr; (3) pre-lastglacial advance of finite radiocarbon age, 45,000-16,000 14C yr B.P.; (4) deposits of the last glacial advance, 16,000-13,000 14C yr B.P.; and (5) Holocene deposits. Among these five categories, deformation is most pronounced in the oldest (I) and also common, though typically less well developed, in (2). Sediments less than 45,000 yr B.P. in age less commonly display deformation of unequivocal tectonic origin. Their distribution, however, is locally influenced by demonstrable Pleistocene and Holocene movement along the Seattle Fault zone. Any widespread interpretations of fault offsets or crustal warping are complicated by abundant unconformities, which have juxtaposed sediments of widely different ages to produce large discontinuities without any corresponding structural influence. Thus more detailed and precise dating and stratigraphic correlation of exposed deposits, another major focus of our work, is pivotal for unraveling the history and patterns of tectonic deformation.
High-resolution Seismic Images of the Ancestral Columbia River Valley and Recent Faulting beneath the Portland-Vancouver Urban Area, Oregon and Washington PRATT, T. (USGS, School of Ocean., Univ. of WA, Seattle, WA 98195; 206-543-7358; [email protected]); ODUM, J., STEPHENSON, W, WILLIAMS, R., DADISMAN, S. (USGS, MS 966, Denver Federal Cenrer, Denver, CO 80225); HOLMES, M. (School of Ocean., Univ. ofWA, Seattle, WA 98195); HAUG, B. (Dept. of Geology, Pordand State Univ., Portland, Oregon)
High-resolution seismic reflection profiling for earthquake hazard assessment in the Portland-Vancouver area of Oregon and Washington has imaged: 1) the ancestral Columbia River channel, 2) unconsolidated near-surface deposits that could amplify shaking during an earthquake, and 3) faulting of a late Pleistocene unconformity. These seismic data, which consist of marine profiles along 40 km stretches of both the Columbia and Willamette Rivers and two 1.5-kmlong land profiles, image strata in the upper 150 m. The profiles show a strong reflector varying from 0- to 85-m depth. This reflector correlates with the base of unconsolidated sediments penetrated in drill holes. There is a large contrast in seismic velocities between the unconsolidated sediments (200 mis S-wave, 650 mis P-wave) and the underlying strata (750 ml sec and greater S-wave, estimated 1700 to 2000 mlsec P-wave). This contrast could amplify and crap seismic energy in the shallow layer during an earthquake. A 1.5-km-wide, up to 85-m deep paleochannel filled with unconsolidated sediments marks the ancestral Columbia River's course. The paleochannel probably formed during late Pleistocene Hoods emanating from glacial Lake Missoula. Vertical displacements of up to 5 m in the late Pleistocene unconformity at the East Bank fault and perhaps greater displacement at the Portland Hills fault zone are consistent with late Pleistocene or Holocene faulting beneath the area now occupied downtown Portland. No displacement of the late Pleistocene unconformity is apparent at the location of the inferred Frontal Fault zone. These results indicate the East Bank and Portland Hills faults may represent a significant seismic hazard to the Portland-Vancouver urban area, and that further characterization of the shallow strata is crucial to estimating the shaking po ten rial in the area.
Tuesday A.M., May 4, 1999-Lopez Room Earthquake Sources and Fault Mechanics: Observations and Insights T Presiding: Gregory Beroza and Chris Marone
Stress Triggers, Stress Shadows, What Have We Learned and Where Do We Go from Here? HARRIS, Ruth A., U.S. Geological Survey, M.S. 977, 345 Middlefield Rd, Menlo Park, CA 94025, [email protected]
Following the Mw7.3 1992 Landers, California earthquake, calculations of static stress changes became a common method for estimating earthquake hazard. The simple calculations which assume elastic earth behavior and Coulomb failure are not new. Instead scientists have been performing such determinations for more than 20 years. What is new is that these calculations are starting to enter probability estimates for future earthquake hazard. There are still many questions about the utility of the static stress change estimates and some propose that the method is just roo simple-minded to be accurately applied to realearth problems. These scienrists would prefer a more complex view of faulting and constitutive parameters than is afforded by the Coulomb approach. Alternatively; Coulomb failure does appear to explain how following a great earthquake there can be a decades-long silence of large earthquakes on faults with specific slip-directions. This has been witnessed for the great 1857 Ft. Tejon and 1906 San Francisco, California earthquakes.
Applications of the Coulomb method to both static and dynamic earthquake triggering and to smaller earthquakes seems a bit more complex. Small and moderate-size earthquakes de occur in regions where the simple models predict they should not occur, and vice-versa. There are often time-delays between the triggering stress and the subsequent earthquake. How might one explain this delay? Rate-and state-dependent constitutive formulations appear as one solution. This model seems to fit laboratory simulations of earthquakes. There are also proponents of other physical mechanisms, such as bubble physics (in magmatic regions) and fluid How. And, even among those who believe in simple Coulomb failure mechanisms, there is still the big question about the role of pore-pressure and whether or not all faults are equivalent in strength. We now have abundant examples that demonstrate correlations between stresschanges and earthquake occurrence, but questions about the mechanics of earthquake generation remain unsolved.
Effects of Stress History on Earthquake Timing BLANP!ED, M.L. (l], GOMBERG, J. [2], BEELER. N.M. (l], DIETERICH, J.H. [l], KILGORE, B.D. (l], and BODIN, P. [3]. [IJ USGS Earthquake Hazards Team, Mail Stop 977, 345 Middlefield Rd., Menlo Park, CA, [email protected]. (2] USGS, CERI, Memphis, TN 38152. [3] CERI, Memphis, TN 38152.
We compare predictions of earthquake timing from a Coulomb model and a rate-state friction model. Clock advances and delays denote changes in failure time due to coseismic static stress changes or transient loads (e.g., due ro seismic waves) added to constant-rate background loading. The Coulomb model assumes that failure occurs at a fixed stress threshold, that the clock change is independent of when a static stress step is applied, and that a transient perturbation has no effect on failure time (unless failure occurs immediately). It offers a convincing match to seismicity patterns, and is attractive because it requires a minimum of knowledge about the fault and its stress and slip history. Physically more realistic models, e.g., in which the fault surface obeys a rate-state friction equation, can simulate a fuller range of behaviors bur require information that is ofren absent. We study the ranges of model parameters and conditions over which each model is appropriate.
Steady loading of laboratory granite faults produced stick-slip with nearly constant recurrence interval and peak shear stress. In general, changes to the loading path caused clock-advances consistent with the Coulomb model. However, a sufficiently large stress step caused failure to occur early with lower peak stress, and a sufficiently large transient perturbation caused delayed failure with higher peak stress. Deviations from the Coulomb prediction depend strongly on when in the loading cycle the perturbations are applied; thus the failure criterion is time-dependent.
Our lab data are best fir using a rate-state relation proposed by Ruina (1983). Predictions asymptotically become equal to those of the Coulomb model for certain ranges of constitutive parameters, loading rate, elastic stiffness and assumptions about strength evolution. Only in certain circumstances are
234 Seismological Research Letters Volume 70, Number 2 March/April 1999

those differences likely to be large enough to invalidate the Coulomb model, given the uncertainty in field observables. However, the relationships between failure and the load path that precedes it are easily explored by means of analytic expressions or through numerical modeling, using constitutive models vetted in the laboratory and tested in the field.
Laboratory Measurements of Frictional Healing and Their Implications for Fault Healing MARONE, C., MIT, Dept. of Earth, Atmos., and Planetary Sciences, Cambridge, MA USA 02139 ([email protected], phone +617 253-4352, fax: +617 258-0620)
I summarize laboratory experiments on the mechanics of frictional healing. Layers of granular quartz were sheared at room temperature and at constant normal stress of 25 MPa. Stresses at particle contacts are high (- 10 GPa), limited only by plastic yield strength of quartz. Data indicate that static friction and related parameters vary systematically with hold time t1,, loading velocity V, and the nominal shear load during periods of quasi-static holding. In particular, static friction increases logarithmically with the product of t1, and V, such that a factor of 10 increase in V yields a numerically equivalent effect as a factor of 10 increase in th. Moreover, static friction and healing rate (defined as the change in static friction per unit change in log hold time) depend strongly on shear load. For a given t1,, static friction is significantly higher when shear load is removed, compared to tests in which shear load relaxes via frictional slip. Our data indicate that healing is closely related to gouge porosity. The effect ofV is predicted by rate and state friction laws, and constitutive modeling indicates that both slip- (Ruina) and time-dependent (Dieterich) evolution laws can fit data from individual tests. However, to fit static friction and healing rate over a range of t1, and V, the Dieterich law requires steady-state velocity strengthening (sliding friction increases with V), whereas our experimental measurements carried out during the same tests indicate velocity weakening. The Ruina law fits both data sets consistently. A consequence of the observed dependence of healing on V and shear load is that, other things being equal, seismogenic faults are expected to be stronger (have higher static yield strength) than aseismicallycreeping faults. Seismic estimates of fault healing will be discussed and compared with laboratory observations.
A Brownian Model for Recurrent Earthquakes MATTHEWS, M.V., Walden Consulting, Wayland, MAO 1778, [email protected], ELLSWORTH, W:L., and REASENBERG, P.A., U.S. Geological Survey, Menlo Park, CA 94025
Adding Brownian random motion to a deterministic relaxation oscillator generates a temporal model of cyclic loading and rupture on a recurrent earthquake source. The Brownian relaxation oscillator (BRO) combines the macromechanics of tectonic strain accumulation and seismic release with micromechanical effects represented as stochastic perturbations. This model leads to a natural description of time-dependent recurrence in terms of Brownian passage time (BPT) variables. The Brownain passage time distribution has the following noteworthy properties: 1. the probability of re-rupture soon after a characteristic earthquake is essentially zero; 2. the instantaneous hazard rate increases steadily from zero at t=O, reaches a finite maximum at about the mean recurrence time, and then decreases to a quasi-stationary level in which conditional probability of rupture ceases to change with elapsed time; 3. the quasistationary hazard rate is greater than, equal to, or less than the long-term mean hazard rate as the aperiodicity (coefficient of variation) is less, equal ro, or greater than 0.707. We will describe salient properties and implications of the BRO/BPT model, and illustrate calculations of"interaction effects" due to state perturbations by large earthquakes outside the target source.
Towards a Generic Earthquake Recurrence Model: Application of the Brownian Passage Time Distribution to a Global Earthquake Data Set ELLSWORTH, W.L., U.S. Geological Survey, Menlo Park, CA, 94025, [email protected], MATTHEWS, M.V., Walden Consulting, Wayland, MA, NADEAU, R.M., Lawrence Berkeley Laboratory, Berkeley, CA, NISHENKO, S.P., Federal Emergency Management Age'!cy; Washington, D.C., and REASENBERG, P.A., U.S. Geological Survey, Menlo Park, CA.
A physically-motivated point process model for earthquakes is used to derive a new generic earthquake recurrence probability distribution. The model is based on the Brownian relaxation oscillator that can be described by the steady rise of a state variable from the ground state to failure threshold as modulated by Brownian motion. Failure times in this model follow the Brownian passage time (BPT) distribution, which is specified by the mean time to failure, mu, and the
aperiodicity of the mean, alpha (equivalent to the familiar coefficient of variation). A global data set of 37 recurrent earthquake series with at least 5 recurrence intervals has been assembled to explore the applicability of the BPT probability distribution. These earthquake series range in size from M 9.2 (1964 Alaskan earthquake) to M -0.7 (Parkfield repeating microearthquake). We use adjusted maximum likelihood estimators that may include both closed and open intervals to determine unbiased values of mu and alpha for each series. The estimated alpha values are distributed as would be expected for the same number and sizes of sequences drawn at random from the BPT distribution with alpha=0.5. On this basis, we propose a provisional generic aperiodicity of alpha=0.5. For this aperiodicity, the hazard function (instantaneous failure rate of survivors) exceeds the mean rate for times> mu/2, and is -2/mu for all times > mu. Application of this model to the next M 6 Parkfield earthquake suggests a nearly constant annual probability of occurrence between 0.07 and 0.1. The conditional probability for a great earthquake in the Cascadia subuction zone in the next 30 years is approximately 0.05-0.08.
Paleoseismic Reconnaissance along the Great 1905 Bulnay, Mongolia Surface Rupture SCHWARTZ, D.P., HECKER, S., PONTI, D.J., US Geological Survey. Menlo Park, CA 94025, [email protected]; BAYASGALAN, A., Bullard Laboratories, Cambridge, UK, CB3 [email protected]; LUND, W.R., Utah Geological Survey, Cedar City, UT 84720, [email protected]; STENNER, H.D., Department of Geology, Arizona State University, Tempe, AZ 85287, [email protected]; ENKBAATAR, D., Informatics and Remote Sensing Institute, Ulaanbaatar 210644, Mongolia, [email protected]
Western Mongolia has been the location of 3 great earthquakes in the 20th century. The largest was the 1905 Bulnay sequence. This complex rupture was composed of two primary events: 1) the M7.4 130 km left-lateral Tsetserleg rupture (9/9/05) and 2) the MB 350 km left-lateral Bulnay and 50 km reverseoblique Teregtiyn ruptures (9/23/05). In September 1998 we initiated paleoseismological investigations of the 1905 ruptures as part of a larger study of earthquake clustering and rupture complexity in continental interiors. The 1998 expedition focused on the Bulnay fault and covered 250 km of the rupture length.
The 1905 faulting is expressed as a spectacular, almost continuous mole track, 1-2 m high and 4-10 m across, that represents both strike-slip faulting and folding. The rupture traverses elongate hills that have grown by repeated mole-track formation. It steps almost continuously left at a range of scales, commonly producing large (l Os of m deep by 1 OOs of m across) depressions on older surfaces. Offsets of gullies and terrace risers were measured at 22 sites. The largest 1905 offset, 10.8m, occurred on the eastern part of the fault; values along the central and western parts average -8 m. Six other sites have offsets between 12 and 20 m, providing evidence for one or more prior events. Our measurements of 1905 are, on average, smaller than those reported by Baljinnyam et al (1993; 10-11 m) and larger than those reported by Trifinov (1984; 6 m). Evidence of paleoearthquake recurrence from stream terrace profiles, scarp morphology, soil development, and hand-excavated trenches at 5 locations suggests long repeat times ( 1 OOOs of yrs) with perhaps only 3 events during the late Pleistocene-Holocene. In-progress radiocarbon dating should constrain penultimate event timing.
The 1905 Bulnay, 1957 Gobi-Altay (Mongolia), and 1811-1812 New Madrid earthquakes are geometrically complex ruptures (strike-slip, reverse, normal faulting) that release strain in a large volume of crust (l OOs of km long, 10s ofkm across) as sequences that can be weeks in duration. This type of faulting may characterize continental interiors where rates of deformation are low and faults have relatively small amounts oflong-term offset.
Three-dimensional Simulations of the Dynamics of Dipping Faults OGLESBY, D.0., ARCHULETA, R.J., Institute for Crustal Studies and Department of Geological Sciences, University of California, Santa Barbara, CA 93106, [email protected], [email protected]; and NIELSEN, S.B., Institute for Crustal Studies and Materials Research Laboratory, University of California, Santa Barbara, CA 93106, snielsen@q uake.crustal. ucsb.edu
Recent earthquakes on non-vertically dipping faults (such as the 1971 San Fernando and 1994 Northridge events) have indicated that the dynamics of dipping faults are quantitatively different from those of the vertical strike-slip faults that are commonly studied. Recent dynamic fault simulations have shown that the asymmetric geometry of such dipping faults greatly affects both the rupture times and slip distributions on the fault, and consequently the neatfield ground motion as well. We have used the three-dimensional finite element
Seismological Research Letters Volume 70, Number 2 March/April 1999 235

method to simulate the dynamics of thrust, normal, and strike-slip faults with varying dip, and have found that given the same initial stress magnitude and geometry, thrust faults produce stronger ground motion than normal faults, while strike-slip faults produce ground morion in berween these rwo extremes. In all cases, the hanging wall moves more than the foorwall. The asymmetry berween thrust and normal faulting 1s caused by che mceracnon berween the radiated waves reflecting off the surface with che rupture process on the fault. The asymmetry berween hanging wall and footwall is primarily caused by the mass difference berween the rwo sides of the fault near the free surface.
Fault Slip and Loading Rates at Depth from Recurrence Intervals of Repealing Microearthquakes NADEAU, R.M., McEVILLY, T.V, Berkeley Seismological Laboratory and Center for Computational Seismology, Lawrence Berkeley National Laboratory, University of California, Berkeley, CA 94720, [email protected] and [email protected]
Unique attributes in sequences of recurring microearthq uakes at Parkfield, CA and the distribution of large numbers of such sequences throughout the San Andreas fault zone there provide a means for inferring slip rate on the active fault surface from recurrence intervals berween the recurring events. Measured seismic moment-release rate and geodetically-determined tectonic loading rate are combined to estimate average rupture area, fault slip, recurrence interval and stress drop. These parameters exhibit systematic size-dependence following simple scaling relationships that describe a fault that is locally quire strong (kilobar stress drops) but weak at the crustal scale (Nadeau and Johnson, 1998). Analysis of the I I-year microseismicity record at Parkfield reveals systematic spatial and temporal variations in the slip race that were synchronous with earthquake activity and other independent indicators of fault-zone slip. The repeating sequences can thus provide a map of fault slip in both space and time. For the 2. 5 year period beginning in Oct 1992, our analysis defines a deformation pulse leading to and accompanying the series of M4.6 co M5 earthquakes that ruptured in the hypocentral region of the long-anticipated M6 event. The pattern is suggestive of a propagating slip epoch on the fault that moved through the study area, triggered the intense seismic activity, then moved on to the southeast as slip shut down in the M6 zone. An important question is whether repeating sequences exist elsewhere in sufficient numbers to permit more general application of our method. Preliminary results from the northern Hayward fault in the San Francisco Bay Area show that repeating earthquakes exist there and that joint inversion of these slip-rate estimates with surface and space based deformation measurements may prove useful for defining slip rate at depth on active faults.
Nucleation of Large Earthquakes: Effects of Spatial Variations in the Constitutive Law Parameters SHIBAZAKI, B., Dept. of Earth, Atmospheric & Planetary Sciences, Massachusetts Institute ofTechnology, Cambridge, MA 02139, [email protected]
We investigate how spatial variations of the constitutive parameters affect the nucleation process of large earthquakes using a slip-dependent friction law. We model the depth variation of the breakdown strength drop and the critical weakening displacement on the basis of the study by Ohnaka (1992). In this model, the breakdown strength drop increases linearly with depth in the brittle zone and decreases sharply in the brittle-ductile transition zone. On the other hand, the critical weakening displacement is almost constant in the brittle zone, and increases sharply with depth in the brittle-ductile transition zone keeping the fracture energy constant. The parameters of che constitutive law also change in the horizontal direction. Ito (1990) has reported chat large intraplate earthquakes appear to initiate where rhe cut-off depth of seismicity changes sharply. We examine the case in which there is a steep depth change in the brittle-ductile transition zone. The results of the simulation show that slip is gradually accelerated in the brittle-ductile transition zone and then rhe accelerated slip spontaneously concentrates on rhe region of a steep depth change in the brittle-ducrile
transition zone. We also examine the case in which there is a broad weak zone between two asperities. In chis case, slip is accelerated over the broad weak zone with the nucleation process preceding the main rupture.
Earthquake Source Parameter Scaling from Deep Borehole Observations in Long Valley, California PREJEAN, S.G., Stanford University, Dept. of Geophysics, Stanford, CA 94305, [email protected]; ELLSWORTH, WL., U.S. Geological Survey, Menlo Park, CA 94550; and ITO, H., Geological Survey of Japan, Tsukuba, 305, Japan.
While some earthquake source scaling studies suggest that constant stress drop and source dimension scaling breaks down for small earthquakes (less than M3), derailed borehole studies find that small magnitude earthquakes obey constant stress drop scaling (R. Abercrombie, J Geophys. Res., Dec. 10 1995). We rest this conclusion by calculating earthquake source parameters for 40 earthquakes, Mw 0.6 to 4.9, recorded at 2 km depth in the Long Valley Exploratory Well. The three-component data were recorded by a 10 Hz seismometer clamped in the basement rock at the center of the caldera. Events analyzed were recorded in September 1997 and June 1998, during rhe waxing and waning stages of the 1997-1998 seismic crisis. Ray distances range from 2 to 20 km.
Source dimensions determined from pulse width and rise rime measurements appear to violate constant stress drop scaling below approximately M 1 or source dimensions of about 60 m. We have yet ro resolve if the stress drop scaling breakdown is real or due to path effects. Since we observe strong crustal scattering on even very short paths to the borehole instrument (3 km), structural heterogeneity and attenuation may be distorting our source measurements. We are investigating chis possibility with empirical Green's function methods. We have also calculated radiated energy ro moment ratios of le-5 to le-7. Like Abercrombie, we have found that this ratio gradually decreases with decreasing magnitude. This observation could mean that small earthquakes are inherently less energetic than large events, or it could simply be the result of attenuation or band width limitations. We are testing these possibilities by studying rhe distance dependence of source parameter measurements and comparing these velocity data with wide band accelerometer recordings made in the same borehole in 1992.
Earthquakes Clustering as Driven by Local Interaction Geometry AMITRANO, D. lirigm, universite de grenoble, David.Amirrano@ujfgrenoble.fr, GRASSO, T.-R., !git, Observatoire de grenoble, [email protected]grenoble.fr
Damage processes of rocks include fracturing, which produces acoustic emission (AE). For brittle materials the macroscopic failure occurs due to cooperation of micro-cracks, i.e. damage localization, as experimentally mapped by AE source location (Lockner er al., 1991). Ductile behavior associated with diffuse damage can be obtained for the same materials by changing experimental conditions, e.g. confining pressure. It suggests a continuous transition from diffuse to localized damage. In all cases, the AE event distributions, in size and space domains, exhibit power law behavior. Using a local progressive damage law within a linear tensorial elastic model, we produce a continuous range of behaviors from ductility with diffuse damage to brittleness with localized damage. We simulate the negative correlation reported berween the AE b-value and the confining pressure during triaxial compression test on granite sample (Amitrano, 1999). This result suggests the b-value to be interrelated with the brittle-ductile transition. It is supported by the depth dependence of b-va!ue for Californian earthquakes (Mori and Abercombie, 1997). Thus the complexity of the brittleductile transition, including, damage geometry, exponents of power law distribution, shape of stress-strain curves, appears to be controlled by the internal friction angle which modifies the local interaction geometry. For different macroscopic behaviors, the model simulates a large variability of possible interrelations berween the b-value, rhe spatial correlation dimension and the damage type, in agreement with seismological observations.
236 Seismological Research Letters Volume 70, Number 2 March/April 1999

Tuesday A.M., May 4, 1999-Fidalgo Room Seismicity, Seismotectonics, and Structure Presiding: Michael Stickney and Bruce Schell
Effects of Shallow Mississippi Embayment Structure on Ground Motions from Teleseisms BODIN, P., HALL, J.L., HORTON, S., WITHERS, M., CERI, The University of Memphis, Memphis, TN 38152, [email protected]; and HERRMANN, R., Saint Louis University, St. Louis, MO 63103, [email protected].
The Mississippi embayment, a large (-300 km wide) gentle (- 1.4 km maximum depth) structural trough floored by hard Paleozoic rocks and filled with unconsolidated Cenozoic and younger sediment, gives rise to systematic shifts in the fundamental period of seismic site resonance. We have shown previously that the period of site resonance is revealed by horizontal-to-vertical (HIV) site spectral ratios of ambient microtremor. In this study we examine how the embayment structure affects releseismic P-wave waveforms. We compare broadband waveforms of earthquakes at various different azimuths and distances recorded at sites outside of, bur nearby to, the embayment with recordings made at deep soil sites within the embayment. Preliminary results reveal that waveforms are significantly and systematically distorted by propagation through the slow, lossy embayment sediments. The horizontal/vertical amplitude ratio of first arrivals outside the embayment generally are very small, while at sites within the embayment, the horizontal components are highly amplified and Hi V ratios greatly exceed unity. Moreover, systematic delays in the horizontal first arrivals relative to the vertical arrivals suggests that the former are actually PS converted phases. These effects vary depending on the frequency content of the arriving phase, being less evident for lower-frequency arrivals. Our observations can be used to constrain the propagation characteristics of the shallow embayment sediments, and have significance for seismic hazard and for other studies that use central US broadband waveforms.
Contemporary Deformations along the Southern Part of the Imperial Fault and its Relation with Subsidence and Seismicity in the Mexicali Valley (B.C., Mexico) GLOWACKA, E., GONZALEZ, J., DIAZ DE COSSIO, G., FARFAN, F. Depto. Sismologia, CICESE, km 107 Carretera Tijuana-Ensenada, 22830 Ensenada, BC, Mexico, [email protected], [email protected]
Vertical displacement with a mean velocity of a few cm/year (W side down) has been observed in the southernmost part ofimperial fault since 1977. At present four short leveling profiles are surveyed a few times per year across the fault, two crackmeters installed across the fault and two riltmeters insralled in its vicinity operate continuously.
The first results from this geodetic network show a maximum value of vertical slip rate (- 8 cm/year) observed in the place where the orientation of the fault changes from NW to SW, as can be expected for the Cerro Prieto-Imperial pull-apart basin. The vertical slip is released mainly in the form of slip events which are characterized by very small displacement velocity (mm/s) and migrate along the fault with a velocity of emfs. There is a possibility that some of the largest slip events were triggered by shallow earthquakes with a normal mechanism.
Comparison of the deformations mentioned above with subsidence in Mexicali Valley suggest that the contemporary vertical movement of the southernmost end of the Imperial fault, much larger than the expected tectonic one, may be induced by fluid extraction in the Cerro Prieto geothermal field, and that the Imperial fault may be an eastern boundary of a geothermal aquifer. How this fact can influence seismic hazard in Mexicali Valley is discussed.
Characteristics of Recent Seismicity in Southwest Montana and its Relation to Late Quaternary Fau Its STICKNEY, M.C., Montana Bureau of Mines and Geology, Montana Tech of the University of Montana, Butte, MT 59701, USA, [email protected]
P-wave travel times from explosions and earthquake arrival times recorded by the Montana Bureau of Mines and Geology regional seismograph network in southwest Montana were inverted to determine crustal velocity structure. The new velocity model was used to relocate hypocenters of over 12,000 earthquakes recorded since 1982, chat define the Intermountain Seismic Belt in west-
em Montana. Over 390 fault-plane solutions were determined from P-wave first motions. These fault-plane solutions suggest that areas of southwest Montana located north of Hebgen Lake or west of the Centennial Valley experience NE-SW-d1tected extension. This extension direction results in normal slip on NW-trending faults, strike-slip movement on NS or EW-trending faults, or oblique slip on faults with intermediate trends. In the Hebgen Lake/Centennial Valley region-the most seismically active part of Montana-fault-plane solutions _show greater variability but tend to have NNE-trending T-axes with many showmg EW-tren~mg P-axes. Normal slip on EW-trending faults and oblique slip on NW-trendmg faults are prevalent in the Hebgen Lake basin. A northeast alignment of epicenters along the lower reach of the West Fork of the Madison River and NE-trending nodal planes from four fault-plane solutions, suggest that an active_ fault controls this section of the river valley. Geologic mapping supports this mterpretat1on. About 20 fault-plane solutions indicate reverse slip along nort~erly trending faults in the Hebgen Lake/Centennial Valley region. On the basis of fault prox1m1ty and nodal plane orientation, less than six percent of the earthquakes with focal mechanisms determined during this study correlate with faults exhibiting late Quaternary surface rupture. Most recent seismiciry_does not occur at depth along mapped Quaternary faults. Apparently, large bur mfrequent, surface-rupturing earthquakes effectively release tectonic stresses along major faults, bur surrounding areas lacking large faults experience persistent, smaller magnirude seismicity to accommodate tectonic strain. Stress directions inferred from focal mechanisms are compatible with continued slip on mapped late Quaternary faults.
Microearthquakes of the Charlevoix Seismic Zone, Quebec, Canada Occur in Highly Fractured Zones Bounded by Regional Faults ' LAMONTAGNE, M., Geological Survey of Canada, 7 Observatory Crescent, Orrawa, Ontario, KlA OY3, [email protected]
Located on the St. Lawrence River some 100 km downstream from Quebec City, the Charlevoix Seismic Zone (CSZ) is the most active seismic zone of eastern Canada, with five historical earthquakes in the magnitude 6 to 7 range and continuous microearthquake activity. Contrasting with the general assumption that CSZ earthquakes occur on regional faults, hypocenters recorded between 1977 and 1999 reveal that most events concentrate in highly fractured zones bounded by regional faults.
The positions of regional geological faults are known from remote sensing, magnetic, gravimetric and seismic reflection data. Most of these faults trend parallel to the St. Lawrence River. Most earthquakes do not concentrate along these regional faults, bur regroup in seismically active volumes. Within these volumes, the orientations of the reactivated faults (and possibly the local stresses) vary. This is suggested by some 20 focal mechanisms (mostly reverse to reverse-oblique faulting) and by earthquake clusters and multiplets (found to represent less than 15% of the events between 1988 and 1997). Only one cluster of earthquakes (that may include some magnitude > 4 events and possibly the 1925 M 6.2 event) may correspond to a regional fault. A shallow seismic reflection profile that crosses the surface projection of this fault does not show any evidence of recent movement. Hence, the rate of large CSZ earthquake occurrences in the Holocene may be lower than that indicated by the historical record.
Does the Spatial Distribution of Smaller Earthquakes Delineate Areas Where Larger Earthquakes are Likely to Occur? KAFKA, A.L., Weston Observatory, Department of Geology and Geophysics, Boston College, Weston, MA 02493, [email protected]; and LEVIN, S.Z., Department of Earth Sciences, University of Southern California, Los Angeles, CA 90089, [email protected].
One component of the methodology used for developing the latest generation of National Seismic Hazard Maps involves using the spatial distribution of smaller earthquakes in the eastern United States (EUS) to forecast the locations of larger earthquakes in that region (Frankel, 1995). Variations of this hypothesis, that smaller earthquakes indicate where larger earthquakes are likely to occur, are found throughout earthquake studies. In a previous study (Kafka and Walcott, 1998), we tested this hypothesis for earthquakes in the northeastern United States (NEUS) to see how well the spatial distribution of smaller earthquakes recorded by seismic networks in the NEUS "forecasts" the locations of larger earthquakes that have already occurred. The purpose of this srudy is to exten_d that analysis into other areas of the world to obtain a more global perspective on this issue, and to see if a more global perspective helps to elucidate our understanding of this issue in the EUS. Here we report on an extension of this ongoing investigation to other areas, including: southeastern United States, the New Madrid Seismic Zone, southern California, northern California, Israel,
Seismological Research Letters Volume 70, Number 2 March/April 1999 237

Turkey, and the entire Eastern United States. Our results to date do, in fact, suggest that (in a variety of tectonic environments) the spatial distribution of small earthquakes delineates areas where larger earthquakes are likely to occur. In a number of cases where larger earthquakes were not forecast based on this approach, we suspect that the misses are, at least in part, due to incompleteness and quirks in the earthquake catalogues. At this point in our ongoing investigation, we are convinced that it is prudent to include the idea of proximity to small earthquakes as a component of seismic hazard mapping, particularly for places like the EUS where the processes that cause earthquakes are poorly understood.
Seismic Velocity Structure across the Boundary between the Insular and lntermontane Belts, Southwestern British Columbia ZELT, B.C. and ELLIS, R.M. Department of Earth and Ocean Sciences, University of British Columbia, Vancouver, British Columbia, V6T 1 T7, Canada, email: [email protected]
We use wide-angle seismic reflection/refraction data recorded during the 1998 SHIPS experiment to derive 2-D crustal velocity structure across the southernmost part of the boundary between the Insular and Intermontane Belrs of British Columbia. The recording profile comprises a roughly linear array of 14 landbased stations and three ocean bottom seismometers extending approximately 300 km from the southern-most tip ofVancouver Island north across the Strait of Georgia onto the mainland of British Columbia. In-line air gun shots are taken from a number of short segments of the ship track in both the Strait of Georgia (middle of the profile) and Juan de Fuca Strait (south of the profile). The limited shot coverage results in irregular ray sampling along most of the profile, and the short record sections make phase identification difficult. Beneath the Strait of Georgia, the shallow crust is well-sampled by rays. Our modeling therefore focuses on the detailed shallow crustal structure in this vicinity. We will compare the results of our traveltime inversion with the results of an earlier sonobuoy study from 1984 at nearly the same location. The authors of the previous study proposed that an offset in first arrivals arose from a local fault situated approximately halfway across the strait; however, because of positioning uncertainties, the dip and extent of throw on the faulr could not be strongly constrained. Our data, which also show evidence for an offset in first arrival travel times in this vicinity, allow us ro more strongly constrain the structure associated with the offset, as well as provide a more detailed image of che overall shallow crustal structure beneath the Strait of Georgia.
A New Crustal Velocity Model for the Monterey Bay Coastal Region BEGNAUD, M.L., Monterey Bay Aquarium Research Institute, Moss Landing, CA 95039, [email protected]; McNALLY, K.C., Department of Earth Sciences and Institute of Tectonics, University of California, Santa Cruz, CA 95064; STAKES, D.S., and GALLARDO, V.A., Monterey Bay Aquarium Research Institute, Moss Landing, CA 95039, [email protected], [email protected].
The historic lack of a sufficient number of seismic recording instruments in the vicinity of Monterey Bay (MB) and the use of velocity models from inland regions for earthquake hypocentral locations and focal mechanisms have led to uncertainties and inaccuracies for San Gregorio and Monterey Bay faulr zone seismic events, offshore of Central California. We have analyzed phases from earthquakes in the MB vicinity using a combination of ocean-bottom seismometers developed at the Monterey Bay Aquarium Research Institute (MBARI), coastal Reffek instruments obtained from IRIS-Passcal by UC Santa Cruz (UCSC), and the adjacent coastal stations of the permanent USGS network. Using the best-located events from within the bay that include -6750 phases, we have developed a new 1-D velocity model for the region. In the upper 2-6 km, we find velocities ranging from 4.2-5.0 km/s, slow relative to USGS models CST and LOM (-5-5.5 km/sat similar depths). We attribute these velocities to sheared Salinian Block granites that form the basement of MB. Velocities from 6-15 km are similar to the land-based LOM and PEN models (-5.8-6.3 km/s). From 15-22 km, our model displays intermediate velocities (-6.3-7.1 km/s, faster than USGS models) between upper mantle and normal continental crust that we attribute ro either asthenospheric upwelling or underplating of oceanic crust. At 25 km, all models display similar velocities (-7.3 km/s) increasing to -8.0 km/s at 30 km depth. The seismicity of the Monterey Bay displays a sparse distribution of events with a majority on the northern San Gregorio fault. The use of these new MBARI/UCSC data not only help ro constrain the velocity structure in the MB area, but also reduce the location errors and maximum azimuthal gap (by up to -45 degrees) typically observed for event locations in this region.
Location and Activity of the Hollywood Fault, Los Angeles County, CA SCHELL, Bruce A., Consulting Geologist, 3775 Carmel Av., Irvine CA, 92606
The Hollywood fault is a major faulr along the northern margin of the Los Angeles Basin forming the boundarv between the rocks of the Santa Monica Mo"untains on the no;th and the sediment fill of the basin. Although the fault has been known ro exist for decades, its exact location is obscured by urban development and a thick wedge of young sedinments shed from the high-standing mountains. Faulting in the West Hollywood area was investigated by drilling a series of closely spaced, continuously cored holes. Ground water and diotitic bedrock were encountered at depths of 9 and 15 m, respectively, in the northernmost borehole on the north side of Sunset Blvd. Boreholes a short distance away on !the south side of Sunset were drilled to 55 to 75 m+ without encountering ground water or diorite bedrock. These abrupt changes within such a short lateral distance are interpreted ro reflect the presence of a major young fault, the Hollywood fault, under Sunset Blvd. Geometric contraints indicate the dip of the faulr is more than 45 degrees ro the north. Borehole cores indicated three stratigraphic facies; 1) Holocene-latest Pleistocene colluvium in the uppermost 11 to 15 m, 2) Pleistocene alluvium interbedded with colluvium to a depth of36 to 43 m. amd 3) Pleistocene stream-channel alluvium below 40 m (+/-). The deepest sediments were the only units to contain material of other than diorite origin; these exotic pebbles are hard rocks reworked from Tertiary or older rocks now exposed east of the site near the crest of the mountains. There were no fragments of the Santa Monica slate, the dominant rock type in the mountains west of the site. Argillic B soil horizons correlated between boreholes suggest continuous unfaulred Holocene-late Pleistocene strata from Sunset Blvd to the southern most borehole about 90 m south. The nature of the soil horizns and the stratigraphy suggest periods of alternating landscape stability and instabiliy. These cyclic events do not correlate well to global weather cycles and thus may reflect lectonic disturbances upslope. If the cyclic deposition was due to surface fault displacemnts on the Hollywood fault, it suggests recurrence intervals of several thousand years (10,000-20,000) between major events.
Crustal Structure under the Coso Geothermal Field from Broadband Receiver Functions BHATTACHARYYA, J.. LEVIN, V., LEES, J. and PARK, J., Department of Geology and Geophysics, Yale University, New Haven, CT 06510, USA, [email protected]
In this study, we use teleseismic receiver functions (RFs) ro quantify the azimuthal variation of crustal structure in the Caso geothermal field. Presence of structural heterogeneity in the field can often be bound by sharp impedance contrasts and can give rise to strong mode conversions and reverberations in incident teleseismic P waves. Teleseismic receiver functions (RFs), computed for 60 events recorded at a broadband seismic station inside rhe Coso geothermal field (TERRAscope station JRC), contain numerous strong P-ro-S conversions on both radial and tangential components. We employ a genetic-algorithm modeling tool to expedite a search through model space, and to infer physical properties (thickness, velocity, etc.) of the Caso crust. These properties can be used to identify the presence of partial melt in this region. The RFs are grouped into five backazimuth bins at 125, 140,240,310, and 315 degrees. For radial RFs from the south, we observe a strong mode conversion at 1.2 s which can be modeled using a 1.5 km low velocity surface layer. We observe a distinct low velocity zone at a depth of about 10 km which might be related to the proposed heat source of the geothermal field. For the teleseismics arriving from the northwest, the RFs do not require the shallow sedimentary layer but are consistent with a low velocity zone at a depth of 12 km. In all radial RFs, we observe a distinct arrival at approximately 4.0 s, which corresponds to the P-to-SV conversion at the Moho at a depth of approximately 31 km. We find evidence for a 5 km thick low velocity zone in the lowermost crust. This deep crustal LVZ appears to be a broad regional scale structure.
Hotspot Effects on the Seismic Structure of the Lithosphere: Tomography in Hawaii TILMANN, F.J ., Bullard Laboratories, University of Cambridge, Cambridge, CB3 OEZ, UK, [email protected], BENZ, H.M., US Geological Survey, Box 25046, Denver, CO 80225, [email protected], PRIESTLEY, K.F., Bullard Laboratories, University of Cambridge, Cambridge, CB3 OEZ, UK, [email protected], and OKUBO, P.G., US Geological Survey, Hawaiian Volcano Observatory, Box 51, HI 96718, [email protected]
We examine the P-wave velocity structure beneath the Island of Hawaii using Pwave residuals from teleseismic earthquakes recorded on the Hawaiian Volcano Observatory seismic network. Our tomographic inversion incorporates a priori
238 Seismological Research Letters Volume 70, Number 2 March/April 1999

knowledge about the near-surface structure from the local tomography study of Okubo and Benz ( 1997). The station geometry and distribution of events allow us to image the velocity structure between -40 and 100 km depth with a lateral resolution of-15 km and a vertical resolution of-30 km. P-wave velocities are up to 3% slow in a region trending southeast-northwest underlying the island between the two lines defined by volcanic loci. No correlation between the magnitude of the lithospheric velocity anomaly and the current level of volcanic activity is apparent. In the case of the oceanic lithosphere beneath Hawaii, slow seismic velocities are likely to be related to magma transport from the top of the melt zone at the base of the lithosphere to the surface, suggesting the following interpretation. The velocity anomaly below the most active volcanos is caused by a large quantity of magma ascending through the lithosphere. The presence of a significant slow velocity anomaly beneath late stage or dormant volcanos in the northwest of Hawaii indicates that a significant volume of melt is possibly retained at depth.
Shallow Seismic Investigation of an Ancient Archaeological Site in Southern Egypt ALEXANDER. S.S., VASALANI, J.L., BROWN, S.M. and MONTAGUE, M., Department of Geosciences, The Pennsylvania State University, University Park, PA 16802, [email protected]
The ancient temple-town, Hierakonpolis, and its surrounding area near Edfu in southern Egypt has been investigated using shallow seismic observations from approximately 55 profiles and several 2-dimensional arrays. This temple-town, now buried in Nile silts beneath a shallow water table, was continuously inhabited from at least 3200 B.C. through Roman times and is believed to hold many important artifacts in addition to those found at the turn of this century. Typically 24- or 36-channel spreads were used together with shotgun-shell shallow sources at both ends and the middle of each profile. The high-quality data collected has been used: to map the depth of the water table over the site and in adjacent areas; to locate localized anomalies believed to be associated with buried man-made structures or objects; to discover a major reflecting boundary. interpreted to be an ancient channel of the Nile River, at a depth of approximately 100 m, shallowing towards a limestone/sandstone outcrop exposed in a wadi about 0.5 km to the South; to discover a prominent deeper reflector at a depth of approximately 150 m; and to discover a prominent shallow reflector at a depth of approximately 30 m, the origin of which is unknown. The watertable depth distribution over the site has been verified at approximately 50 locations along the seismic profiles where shallow boreholes were drilled. These boreholes provide calibration data for water depth determinations as well as soil moisture and soil composition that are very helpful in rhe seismic interpretation. Examples of the field observations and their interpretation will illustrate each of these major findings.
Tuesday A.M., May 4, 1999-Shaw Room Deep Earth Structure: New Results and Interpretations Presiding: Eddie Gamero and Sara Russell
The Nature of the Lower Mantle: Toward a Hybrid Convection Model Rob D. VAN DER HILST and Hrafnkell KARASON, Earth.Atmospheric and Planetary Sciences, Rm 54-514, Massachusetts Institute ofTechnology, Cambridge, MA 02139, [email protected]
Geochemical analyses of OIB and MOR basalts and the heat budget of Earth's mantle suggest that not the entire mantle is depleted and that enriched reservoirs exist. On the one hand, geodynamical modeling, estimates of the topography of the 660 km discontinuity, and seismological evidence for slab penetration into the lower mantle rule out long-term stratification at 660 km depth. On the other hand, the volume of the thermo-chemical boundary layer near the base of the mantle, the D" region, is too small to account for the isotope signature and the missing heat.
These basic observations suggest that mantle convection is more complex than expected from end-member layered- or whole mantle flow models. While D" may contain the most extreme heterogeneity, we review a range of seismological evidence that begins to suggest that compositionally distinct domains may exist in the bottom 1000 km or so of the mantle.
Structural complexity in the deep mantle is illustrated by means of results of joint interpretations of P and S data (Kennett et al., JGR, 1998) and by our latest model for lower mantle P wavespeed. Recently published whole mantle P wave models are based on routinely processed travel time data by either the ISC
or by Engdahl et al. (BSSA, 1998). We improved P-wave sampling in the deep mantle by incorporating routinely processed and waveform based differential travel-time residuals of core-refracted (PKP) and diffracted {Pdiff) waves. The waveform data were made available through collaboration with T. McSweeney, K. Creager, A. Souriau, and M. Wysession. Moreover, in order co constrain also the long wavelength variations of P wavespeed we used a spherical harmonic degree 6 model of P wavespeed constructed from normal mode data (Iishi and Tromp, AGU, 1998) as the reference for our inversions.
The new model confirms that in a wide depth range around 2000 km the long linear features that dominate the mid-mantle pattern begin to disintegrate with only some fragments of them connecting to heterogeneity near the very base of the mantle. The depth at which this happens coincides with changes in wavespeed ratios and, perhaps, with the onset of a region of super adiabatic temperatures. We discuss how these observations can be reconciled and speculate on the nature of the implied variations in mineralogy and phase chemistry at pressures in excess of 65 GPa.
Variations of the Lowermost Mantle beneath the Northeastern Pacific WYSESSION, M.E., Department of Earth and Planetary Sciences, Washington University, St. Louis, MO 63130, [email protected]; LANGENHORST, A., Department of Geological Sciences, Northwestern University, Evanston, IL 60208, [email protected]; FISCHER, K.M., Department of Geological Sciences, Brown University, Providence, RI 02912, [email protected]; and FOUCH, M.J., Department ofTerrestrial Magnetism, Carnegie Institute of Washington, Washington, DC 20015, [email protected].
Examples will be shown from several different studies of the lateral variations in the seismic characteristics of the base of the mantle beneath the northeastern Pacific Ocean. Data are taken from the Missouri-co-Massachusetts (MOMA) broadband seismic experiment, and consist of the P and S core-diffracted waves. To the first order, there is a very large difference in the seismic behavior of the lowermost mantle beneath Alaska and beneath the northern Pacific. This difference is observed in romographic models as the Pacific "Ring of Fire," and agrees with the paradigm of subducted slabs arriving at the core-mantle boundary (CMB). To a second order, however, there are many smaller variations. An analysis of the travel time delays across the MOMA array shows evidence for alternating slow and fast regions with a wavelength of roughly 250 km. Examinations of the dispersion of the core-diffracted waves also shows lateral variations in the vertical structure ofD". There is one region we sample beneath the northeastern Pacific that is well-modeled by a classical discontinuity structure (a discontinuous increase atop D", underlain by a negative velocity gradient). However, most of the sub-Pacific region we investigated did not show evidence of this kind of discontinuity structure. In general, P and S velocities varied in tandem in the sub-Pacific regions we examined, suggesting thermal variations as the source of the seismic variations. However, beneath the north Pacific rim (Alaska), there was a large departure from this, with P velocities slower than global averages, and S velocities faster than global averages. This is likely due to some combination of anisotropic fabric and chemical heterogeneity. MOMA data are also used to look at variations in the ultra-low velocity zone at the base of the mantle, where we see the large scale pattern ofULVZs beneath the Pacific, but not observable beneath the Pacific rim. Lastly, MOMA diffracted waves are also able co examine the presence of small-scale lateral variations in the D" seimsic anisotropy beneath the Pacific, where we see a predominance of SH faster than SV.
Improved Shear Velocity Structure of the Base or the Mantle (D") Using (ScS-S) and (Sdiff-SKS) Residual Travel Times CASTLE, J.C., MIT, Cambridge MA 02139, [email protected]; CREAGER, K.C., [email protected]; PRESTON, L., [email protected]; WINCHESTER, J.P., [email protected], Geophysics, University of Washington, Seattle, WA 98195.
We invert nearly 10,000 high-quality differential (ScS-S) and (Sdiff-SKS) travel times for the shear wave velocity structure in the lower 300 km of the Earth's mantle (D"). The complimentary coverage of the ScS-S data set and the SdiffSKS data set provides global sampling with few unsampled regions. Where the data sets overlap, the results are consistent. ScS-S provides high lateral resolution, while Sdiff-SKS provide robust averages over long paths. We correct times for ellipticity and estimates of 3D mantle structure above D". We parameterize models using spherical harmonics and find that "smallest" models produce ringing at high wavenumber while "smoothest" models are srable and robust. High correlation exists between Mesozoic subduction and fast anomalies, reaffirming
Seismological Research Letters Volume 70, Number 2 March/April 1999 239
that considerable slab material reaches D". Correlation also exists between hotspots and slow anomalies. We also investigate correlations of ultra-low velocity zones and our velocity models.
Comparison of Small Scale Structure in D" beneath Central America and the Central Pacific RUSSELL, S.A., LAY, T., Institute ofTectonics, UC Santa Cruz, Santa Cruz, CA, 95064, [email protected]
Russell et al. [ 1998] detected the presence of small scale lateral heterogeneity in anisotropic shear velocity structure at the base of the mantle beneath the central Pacific. Their analysis of ScSH-SH differential traveltime residuals and ScS waveform splitting indicates a lateral decrease in shear velocity and a 90 degree rotation of the fast polarization direction for ScS along a southwest to northeast transect across a localized region of D" southeast of Hawaii. These results have many dynamical implications and raise the question of whether such strong lateral gradients in D" structure are unique to the warm, upwelling deep mantle under the central Pacific or are common features of the D" boundary layer. We address this question by examining a localized region of D" beneath Central America using direct S and core-reflected ScS phases in the distance range of 70-85 degrees. Previous studies of D" below Central America indicate the presence of faster than average shear velocities and a strong reflector approximately 260 km above the CMB. There is also evidence for the presence of anisotropy, however due to previous data sparseness, detailed constraints on the anisotropic character of the region have not been made. We analyze this region because both abundant seismicity and a high density of digital broadband receivers provide a dense lower mantle raypath sampling comparable to that in the central Pacific study. The dataset is comprised of South American earthquakes recorded on the BDSN and TERRAscope digital broadband arrays in western North America. We examine lateral variability in Sand ScS travel times and anisotropic splitting for comparison with the central Pacific to further our understanding of D" at small scale lengths.
Compressional Wavespeeds of the Core Mantle Boundary Region from PcP-P Differential Travel Times BRADSHAW, j.A., CREAGER, K.C., and PRESTON, L.A. (Geophysics Program, Box 351650, University of Washington, 98195, [email protected])
Lateral variations in shear-wave velocities of the Earth's core mantle boundary (CMB) region have been well imaged using ScS-S and Sdiff-SKS travel times. Maps of compressional wavespeeds near the CMB are not nearly as well resolved. To improve these maps we are picking and analyzing PcP-P differential times. We reviewed about 3000 seismograms extracted from 1997 earthquakes in the IRIS FARM. Differential times were estimated from broadband records by filtering to a standard short-period response and cross-correlating the PcP and P waveforms. We find that about 10% of the seismograms exhibit very clear P and PcP arrivals allowing unambiguous estimates of differential times. An additional 15% show clear PcP arrivals, but differential time estimates undoubtedly contain some cycle skipping errors. Times were corrected for ellipticity and 3D manrle strucrure above D" using the model of van der Hilst and others (Nature, 1998). The sampling of our limited data set is not as good as ScS-S data sets. Where sampling coincides, the PcP-P and ScS-S data generally correlate well. However, there are two regions in which compressional wavespeeds appear slow and shear wavespeeds appear fast, namely under northeastern Siberia and under the continental United States.
The D" Discontinuity as a Change in the Statistics of Heterogeneity Scale Lengths CORMIER, V.F., Department of Geology and Geophysics, University of Connecticut, Storrs, CT 06269-2045, [email protected]
Body waves sample the lowermost mantle over a broad range of wavelengths and angles of incidence, with varying sensitivity to heterogeneity scale lengrhs in different directions. Observations of scattered precursors to short period PKIKP, for example, require a component of heterogeneity having isotropically distributed scale lengths to persist throughout the lower 1000 km of the mantle, bur have little sensitivity to heterogeneities having longer scale lengths in the horizontal direction. In contrast, long period S waves often detect the onset of transverse isotropy with a vertical axis of symmetry in the lowermost 250 km of the mantle, consistent with shape-preferred orientations of heterogeneities stretched parallel ro the core-mantle boundary. Pseudospectral modeling oflong period P and S waves finds a class of models that can reproduce both the signature of broadband precursors to PKIKP and the transverse isotropy of long
period S waves sampling D". These models have an exponential, isotropic, autocorrelation of heterogeneity having a length scale of 10 km and a P velocity perturbation of 1 per cent throughout the lower mantle, superposed in the lowermost mantle by an anisotropic distribution of heterogeneity having longer horizontal than vertical scale lengths and a 2-3 per cent P velocity perturbation. The numerical modeling shows that the wide-angle reflections intermittently observed from a discontinuiry 150-300 km above the core-mantle boundary can be satisfied by such a change in the heterogeneity statistics. This change in D" can be interpreted either as the signature of a transition to dominantly horizontal convective flow in a lower mantle that is intrinsically anisotropic, horizontally lying slab remnants, horizontally lying products of a core-mantle chemical reaction, or horizontally oriented lenses of partial melt.
Shear Wave Anisotropy near the Core-Mantle Boundary beneath the Central Pacific FOUCH, M.T., Dept. ofTerrescrial Magnetism, Carnegie Institution of Washington, Washington, DC, 20015, [email protected]; FISCHER, K.M., Dept. of Geological Sciences, Brown University, Providence, RI; WYSESSION, M.E., Dept. of Earth and Planetary Sciences, Washington University, St. Louis, MO; and SILVER, P.G., Dept. ofTerrestrial Magnetism, Carnegie Institution of Washington, Washington, DC
The goal of this study is to evaluate the strength, orientation, and location of shear wave anisotropy that exists in the deepest 150-300 km of the mantle known as D". We evaluate shear phases (Sdi{f) that traverse D" and diffract along the core-mantle boundary (CMB), providing unique information about the structure of the CMB region. Waveforms used in this study were recorded by a combination of temporary and permanent stations and sampled paths beneath the central Pacific Ocean.
We have analyzed Sdi{f phases that propagate from the Tonga/Fiji subduction zone to eastern North American stations, and calculated differential travel times for the radial and transverse components of Sdi(f (SVdiffSHdiff). These phases exhibit SVdiffSHdi{f splitting times that range from Oto 5 s, and for all phases in the data set SHdi{f arrives before SVdiff Average splitting for individual raypaths increases with path length in D", and indicates either lateral or vertical variations in the strengrh of D" anisotropy and/or differential sampling of an anisotropic region. Raypachs are similar on the receiver side; consequently, the bulk of the splitting variations are likely due to localized anisotropy on the source-side of the paths in D".
Because SHdiffin general arrives before SVdiff, the cause of the anisotropy may be transverse isotropy with a vertical symmetry axis. However, due to the limited range of Sdi{f polarizations in our current dataset, we cannot rule out the possibility that large-scale azimuthal anisotropy in D" exists in this region. To further constrain the geometry and extent of anisotropy in D" in this region, we will examine data from several temporary and permanent seismic arrays that provide a wider range of backazimurhal coverage of D" beneath the central Pacific. Determination of the character of anisotropy in D" will help constrain structure and flow at the base of the mantle, core-mantle interactions, and the style of mantle convection near the CMB.
Extremes in Complex Structures at the CMB HELMBERGER, D.V., SIDORIN, I., WEN, L., NI, S., RITSEMA, J., and GURNIS,M.
We investigate some small scale seismic zones embedded in the large scale circum-Pacific Belt (Down-welling) and some slow zones beneath Europe and Africa (Up-welling) as delimited by long wavelength tomography. Using the results from dynamic modeling, Sidorin et al. (1998, 1999), we can perform a mapping of tomographic models into a physical model containing localized velocity gradients and a superimposed 1 % phase change. This jump is temperature-dependent occurring 250 km above the CMB beneath the fastest regions (Caribbean, etc.) and drops ro less than a 100 km away from these regions. The observed seismic triplication data, Scd, is explained well by 2D synthetics generated from these models showing its intermittent character which is controlled primarily by local velocity gradients.
A review of the most anomalous seismic data and possible models associated with ultra-low velocity zones (ULVZ's) will be presented including distortions in SKS (SKPdS, etc.), precursors to PcP, ScS, PKP and anomalies in PKP branches. The African structure appears the most distinct with sharp features producing multi-pathed ScS and SKS behavior. Some 2D models are presented but these features prove difficult to constrain because of the overlying megaplume complexity. Using forward modeling, we estimate that this structure extends halfway to the surface with rapidly varyingULVZ's at its base. As dis-
240 Seismological Research Letters Volume 70, Number 2 March/April 1999

cussed in previous studies, some trade-offs occur in thickness but Gaussianshaped structures with lateral dimensions of 50 to 300 km prove effective.
A Broadband Seismic Study of the Lowermost Mantle beneath Mexico: Further Evidence of a Partial Melt Origin of Ultralow Velocity Zones REVENAUGH, T., HAVENS, E., and REASONER, C., Earth Sciences, University of California, Santa Cruz, 95064, USA, [email protected].
The recent discovery of thin lenses or zones of ultra-low velocity (ULV) at the base of the mantle is driving a rethinking of mantle and core geodynarnics and geochemical evolution. The scope and depth of this rethinking hinge on the origin ofULV mantle. Current thought focuses on three candidates: silicate partial melt, silicate-iron reaction products, and grain boundary infiltration of core fluid into the mantle. While the literature is too recent to express a strong bias, partial melt is gaining strength as the favored origin of ULV mantle. A primary diagnostic of melt is high dlnv/dlnvp. Theoretical considerations suggest a value near three with little dependence on the distribution of melt [ Williams and Carnero, 1996]. Existing modeling of PcP precursors [Revenaugh and Meyer, 1997] and SPdifJKS [Wen and Helmberger, 1998] favors values near three, but suffers from parameter trade-offs.
We perform broadband stacking of PcPwaves sampling a nearly 2000-km long, 500-km wide swath of the lowermost mantle beneath Mexico and the western Gulf of Mexico. The data contain evidence of a 10-15-km thick ULV zone on the western edge of the study area, tapering to the east to less than 5-km thickness over a distance of 200 km. Epicentral distances range from 20 to 60 degrees, for which the amplitude of topside reflections from the ULV zone depends strongly on dlnv/dlnvp. Sensitivity ro density is second-order in comparison. Reflectivity modeling strongly favors dlnv/dlnvp near 3, consistent with the theoretical prediction for silicate partial melt and little affected by trade-offs. Furthermore, we are not able to model the observations with diffuse CMB transitions. Thickness of the inferred ULV layer decreases in lockstep with increasing D" velocities, again favoring a thermal, rather than chemical, origin ofULV mantle.
On Detecting Structure and Roots of Plumes in the Lower Mantle GARN ERO, E.T., Dept of Geology, Arizona State University, Box 871404, Tempe, AZ 85287-1404, [email protected], and WEN, L.-X., Department of Terrestrial Magnetism, Carnegie Institution ofWashington, 5241 Broad Branch Road NW, Washington DC 20015, [email protected]
The geographical correlation between important tectonic features at Earth's surface, such as subduction and hot spots (or flood basalt provinces) with lower mantle high and low velocity features, respectively, have led to hypotheses of a core-mantle boundary (CMB) origin for mantle plumes. While it is quite plausible (and likely) that the thermal boundary layer at the CMB could give rise to plume initiation, only recently has there been evidence for lower mantle plumes from seismic modeling experiments. Furthermore, recent detection of ultra-low velocity zones (ULVZ) have been inferred to be the genesis of surficial hotspots via whole mantle plumes. Until very recently, many of the methods used in studies mapping D", ULVZ, or gross lower mantle structure (forward modeling or tomographic approach) have employed one-dimensional wave propagation methods. Here we demonstrate the importance in considering affects of nonlD structures on the wave fields of (1) SKS, SPdKS, SKKS, and (2) S, ScS. Using a 2-D hybrid method that couples traditional 1-D wave propagation code with a lower mantle zone of finite differencing enables us to make broadband predictions for a variety of structures. We test localized low velocity bumps and blobs on the CMB for a variety of horizontal and vertical length scales that may ostensibly relate to zones of elevated heat flow from the core, and thus forming a plume root. As shown previously, 2-D structures can act to enhance or diminish waveform and travel time anomalies. In this study, we show how corrugated topography on the CMB and ULVZ diminishes waveform amplitudes and coherency. If the origin of the ULVZ is partial melt, the viscosity is likely reduced, resulting in convection within the layer, enhanced heat flow into the lower mantle, and connection to upward mantle currents. While evidence at long wavelengths (> 3000 km) is robust for large scale low velocity zones in the lower mantle, the uncertainties in the seismic modeling make difficult constraining detailed (small scale) plume root features. Nonetheless, the compelling evidence for ultralow velocities beneath areas with lowered long wavelength lower mantle velocities suggests a connection between these structures and mantle upwellings.
The Effect of Deep Mantle Heterogeneity on PKP Differential Travel Time Residuals: Implication for Inner Core Structure Ludovic BREGER, Barbara ROMANOWICZ and Hrvoje TKALCIC (Seismological Laboratory, Univ. of California, Berkeley, CA, 94720, USA, email [email protected])
We have assembled a dataset of differential PKP(AB)-PKP(DF) differential travel time residuals traditionally used to study the deep inner core. Recent results based on the study of S wave data indicate the existence of strong lateral variations in D", in particular beneath the Pacific and Africa. We have modified a global tomographic model by saturating regions of low P velocity in D" of amplitude larger than 0.8% to 2%, and adding patches of Ultra Low Velocity Zones (ULVZ) where they have been documented in studies by Garnero and collaborators. We show that this modified model can explain most of the long wavelength trends as well as a large fraction of the dispersion in our global PKP(AB)-PKP(DF) dataset. In particular, our modified deep mantle model is able to explain the trend of travel time residuals with angle of the propagation path in the inner core with respect to the earth's rotation axis. The uneven distribution of data, with most polar paths sampling D" in the region of strong lateral gradients, biases the observations, leading to an apparent trend with angle that has been interpreted as an effect of anisotropy. We discuss how similar effects could explain the large and small scale trends observed in PKP(BC)PKP(DF) phases, and the different character of observations in the "western" and "eastern" hemisphere, as documented by Tanaka and Hamaguchi (1997), and Creager (1998). We infer that inner core anisotropy may have been highly overestimated, and that the strongly heterogeneous structure of the lowermost mantle may be largely responsible for the travel time anomalies observed.
Tuesday A.M., May 4, 1999-Rainier Room Posters Seismology in Education I
Seismology in Undergraduate Education: Opportunities and Resources Available through IRIS JOHNSON, C.L., IRIS, Washington DC 20005, USA, [email protected]
The past few years have seen an enormous growth in innovative and non-traditional educational efforts in the geosciences at universities and colleges nationwide. From individual faculty member efforts, to departmental-level restructuring, to national programs, these changes have been driven by many facrors including the need to make geoscience accessible to a diverse student audience and by a recognition of the importance of communicating scientific research to a wider population than the traditional scientific peer group. Geoscience consortia, such as the IRIS Consortium, can make unique contributions to education at all levels because of their focussed science objectives, yet broad institutional membership.
Many faculty (at IRIS institutions and non-IRIS-both 2-year and 4-year-institutions) have expressed interest in new and innovative approaches to undergraduate teaching and in increased research experiences for undergraduates. In response, IRIS E&O is currently pursuing activities at the undergraduate level which focus on increasing research opportunities for students, encouraging the integration of real research data into undergraduate classes, providing access to high quality teaching resources (software packages, information on recent research projects) and providing professional development for undergraduate faculty. IRIS is also working toward the generation of a newmembership category, chat of academic affiliate, to encourage involvement in IRIS by colleges whose primary focus is education rather than research. Several liberal arts and community colleges have expressed an interest in participating in IRIS in such a capacity and it is hoped that the academic affiiliates program will be formalized by the end of 1999.
In this talk I will discuss some of these core initiatives, highlighting ways in which faculty who teach at the undergraduate level can both benefit from, and participate in, IRIS E&O activities.
Wiggles-An Easy-to-use Seismogram Display/Processing Tool for Macintosh Computers AMMON, CHARLES j., Department of Earth and Atmospheric Sciences, Saint Louis University, St. Louis, MO, 63103, [email protected]
Wiggles is a Macintosh application designed to display seismograms and facilitate basic seismogram processing of seismic signals. The simple user interface
Seismological Research Letters Volume 70, Number 2 March/April 1999 241

enables chose with little time to master more complicated packages to study and explore seismograms. The application can read and write seismograms in binary SAC format and imports data stored in SAC ASCII, PEPP format (archive and single channel), as well as signals stored in the Public-Seismic Network format. The display Fearure.s include panel plots, overlays. and support zooming and absolute and relative rime-measurement. Basic processing funcrions include high- and low-pass Butterworth filters, integration, differentiation, Hilbert transforms, envelope, etc., and modules for water-level deconvolution (which allows receiver function and source time function estimation), pole-zero instrument deconvolution, and teleseismic P and SH wave synthetic seismogram generation (for a simple half-space structure near the source). The ease-of-use and seismogram computation features allow the development of interesting assignments for students ranging from introductory non-science majors ro beginning graduate students who have not yet mastered more powerful packages such as SAC. The application is free and available through the WWW at www.eas.slu.edu/People/C]Ammon/MacSoftware/ and will run on any power Macintosh Computer.
The Southern California Earthquake Center: Providing Unique Life-long Learning Experiences ANDREWS, J.A., TEKULA, S.A., BENTHIEN, M.L.; Sourhern California Earthquake Center, Los Angeles, CA 90089-0742.
At the Sourhern California Earthquake Center (SCEC), the Community Outreach Mission is to promote earthquake loss reduction and to actively engage the public at large in activities chat focus on earthquake-related education, research-based technology development and transfer, and systemic reform. To fulfill chis mission, our outreach efforts in earthquake-related education promote attention to National Science Education Standards and the National Mitigation Strategy, encourage public participation in and understanding of earthquake science, promote enhancement of its K-12 programs, and distribute original educational products that highlight SCEC scientific research. Activities that promote career development of earth science students, with special attention to minorities and women, are of utmost importance.
For knowledge transfer, we organize the growing knowledge bases of academic scientists, engineers, and social scientists and make sure chat their work is applied to reducing earthquake-related risks. We promote loss reduction through research-based technology development and transfer. We encourage societally-based systemic reform (e.g., better building practices, code upgrades, introduction oflegislative initiatives) through interactive workshops, symposia, and continuing education programs char target two audiences: the community of scientists and technical professionals working in related fields, and the general public.
This presentation will articulate how SCEC's unique contributions to earthquake science education provide interesting and exceptional learning experiences for people of any age and background. The session will accent the methods used, rather than a showcase of our contributions. Highlighted programs will be: SCEC Summer Internship Initiative, DESC On-line Education Modules, as well as our contributions to life-long learning through workshops and symposia for the variety of end users that rely on seismological information to succeed in their field.
Updates to the "Investigating Earthquakes Through Regional Selsmicity" Educational Module MARQUIS, T.. HAFNER, K., and HAUKSSON, E., Seismological Laboratory, California Institute ofTechnology, Pasadena, CA 91125, [email protected]
With support from the Sourhern California Earthquake Center (SCEC) Outreach Group, we have been developing an undergraduate-level earth science education module entitled, "Investigating Earthquakes through Regional Seismicity". In development over the last two years, the purpose of chis module has been to provide students with an opportunity to learn (via an "inquiry driven" approach) about earthquakes in an active tectonic region, i.e. Southern California. Because the module is web based, it is more than just a static educational product. The ability to learn about earthquakes using a continuously updated storehouse of the latest earthquake data provides an educational experience chat relates to the "real world".
Version 1.0 of the module, released on the WWW in October of 1998 consisted of one section, entitled "What is an Earthquake?". We expect to release the second section of chis module, entitled "The Distriburion of Earthquakes" in March of 1999. Each section consists of a sequence of text "pages" - with explanatory maps, diagrams, and ocher inline images - hyperlinked to activities, in which students can develop an understanding of the concepts in a more
interactive way. Many of these activities are, in turn, linked to separate on-line resources (e.g. fault maps), and interfaces that provide access to seismological data archived at the SCEC Dara Center. The content and format of this module have been reviewed by scientists and educators alike, and portions of the module have been field tested in high school and communirv college settings.
The modular design allows any future sections ro be easily appended. We will present the first two sections of the module, and a preview of the third section, "Measuring Earthquakes". In addition, we are developing a final assessment activity, in the form of an interactive game, to test the student's comprehension of material presented in the module. Students will run a simulation that will test, among other things, their knowledge of fault properties, their understanding of earthquakes, and their ability to project intensities, given a particular earthquake scenario.
Tuesday A.M., May 4, 1999-Rainier Room Posters Networks and Instrumentation
Automatic Picking of S Arrival Type Using a Nonlinear Filtering TASIE, I., LAPAJNE, J.K., Geophysical Survey of Slovenia, Ministry of the Environment and Physical Planning, Pot na Golovec 25, Ljubljana 1000, Slovenia, [email protected]
A progressive report on the procedure for the automatic picking of the S-wave arrival time from three-component local earthquake data is presented. An algorithm has been developed by using a multistage nonlinear filter based on the artificial neural network (ANN). In a few similar approaches for S-wave arrival rime picking already published, the authors have used multilayer artificial neural network (MANN) dominating in the neural network literature. In our study artificial neural network with radial basis function (ANNRB) has been used. Three component seismograms have been put in the system where six attributes have been calculated. They have been taken as an input for the nonlinear filter. The maximum value in the one-dimensional trace of rhe filter output has been declared as the arrival rime of the S-wave. The comparison of the results of the ANNRB algorithm with the results of some other approaches (MANN, template matching, threshold level, maximum value of characteristic function) on the same testing samples has shown that the results of ANNRB are essentially better. Nearly 70% of the picked S-wave arrival rimes differ less than plusminus 0.3 s from the analyzer's determinations.
An Affordable Broadband Seismometer: The Capacitive Geophone BARZILAI, A., Mechanical Engineering, Stanford University, Stanford, CA 94305, [email protected]; VANZANDT, T., PIKE, T., MANION, S., Jet Propulsion Laboratory, Pasadena, CA 91109; KENNY, T., Mechanical Engineering, Stanford University, Stanford, CA 94305
A new style of seismometer has been produced by transforming a geophone into a broadband seismometer. A conventional geophone has reduced sensitivity at low frequency, causing poor low frequency performance. This results from the electrical system of a geophone, which uses the motion of a spring supported coil in the field of a permanent magnet to generate an output signal. Rather than use chis inductive measurement, with a few simple and inexpensive modifications the motion can be measured capacitively.
A capacitive measurement of coil position yields an ourput rhar has constant sensitivity to ground acceleration at frequencies below rhe mechanical resonance. The device is operated as a closed loop seismometer by applying feedback forces via che coil magnet interaction. Using chis integrated actuator, a capacitive geophone can have flat response up to frequencies of 50 Hz or beyond. With its large low frequency sensitivity, a capacitive geophone's resolution can be roughly 2 orders of magnitude greater than that of a conventional geophone, on the order of 10 ng per root Hz.
New Developments at the Southern California Earthquake Center Data Center (SCEC_DC) http://WWw.scecdc.scec.org HAFNER, K. and CLAYTON, R., Seismological Laboratory, California Institute ofTechnology, Pasadena, Ca 91125, U.S.A., [email protected]
With the development of the TriNet Seismic System in the past two years, the SCEC_DC is entering a major period of transition. In addition to expanding its archive facility from a 0.6 Tbyte to a 5 Tbyte WORM mass storage system, the SCEC_DC is developing a new database/ archiving/ data retrieval system. This
242 Seismological Research Letters Volume 70, Number 2 March/April 1999

system will result in a more interdependent relationship between the SCEC_DC and the real-time data collection/ data analysis systems of the Southern California Seismic Network/TriNet, and will decrease the latency time, ro a few minutes, between the occurrence of an event and data availability.
The system under development is being designed with three primary missions: 1) to provide rapid access ro real-time parametric and waveform earthquake data, 2) to consolidate and maintain one authoritative database available to the real-time data acquisition systems, the data analysts and the users of the archive facility; and 3) to facilitate a seamless exchange of seismological waveform and parametric data with other seismological data centers. In the TriNet system, the real-time data collection system populaces a local database with parametric earthquake data. This data is "replicated" to a database on the SCEC_DC, where it is accessible within a few minutes of an event. Users will access the database via WWW interfaces on various internet and intranet sites. These interfaces will allow users ro search and extract data from the earthquake hypocenter and phase catalogs, view and request waveforms, and view such products as seismicity maps.
Once chis database comes on-line, it will provide "real-time access" for an average of 26,000 earthquakes/year, in addition ro storing the -400,000 events in thehiscorical Southern California earthquake catalog. In addition to the current archive of -600 Gbyces of triggered waveform data, the SCEC_DC will also begin archiving approximately 0.5 Terrabyces/year of 20 sample/sec continuous broadband data. These data will be made available in SEED format, as well as other commonly used formats.
Database Oriented Distributed Seismic Processing JOHNSON, Carl E., University of Hawaii, Hilo, HI, 96720, [email protected]; BITTENBINDER, A. and BOGAERT, B., US Geological Survey, Golden, CO, 80401, [email protected], [email protected]; DIETZ, L., US Geological Survey, Menlo Park, CA, 94025, [email protected]; and KRAGNESS, David, Katylyst Integration, Morgan Hill, CA, 95037, [email protected].
Recent advances in communications and computing have transformed the way we view the world and radically altered our approaches to complex problems. Witness the explosive growth of the World-Wide Web as one major example of such changes. Seismology, of course, is no exception, and the ease·by which data is collected and distributed is also undergoing revolutionary changes. IRIS/ DMC is one very clear example of how the integration of large scale, commercially available cools can provide access ro global seismic data that seemed impossible even 10 years ago. In the same vein, the Earthworm development team has approached the automation and integration of regional seismic networks based on distributed database technology and modern development tools. The first two phases of chis effort were focused on a serial integration of existing acquisition, processing, and analysis components via a DBMS. The current Phase III effort is directed at a DBMS-oriented approach for seismic data acquisition, data distribution, and seismic post processing. The Phase III design and accomplishments ro date will be presented for discussion and review.
Integration of GPS, Seismic, and Other Measurement Systems for Geophysical Research SHIVER, WS., MEERTENS, C., PERIN, B., STEIN, S., University NAVSTAR Consortium, Boulder, CO 80301, [email protected]
Studies of plate boundary processes, including earthquakes and volcanoes, which are at the interface between seismology and geodesy, are ripe for major advance because of advances in the observational cools. One key technology is the Global Positioning System, which can map the deformation field in space and time. UNAVCO is working with ocher organizations and investigators to combine GPS, seismic and ocher geophysical measurements, to reduce the cost of G PS data collection systems, and to create an international data communications infrastructure to permit rapid and low-cost return of data from remote locations to central data centers and archives. Integration of G PS and seismic data transmission has been completed under the leadership of investigators at the University of California at Berkeley, and IRIS and UNAVCO are collaborating to install combined seismic and GPS systems in several international locations. UNAVCO has developed a low-cost, single frequency GPS measure-
ment system to increase spacial sampling resolution. A proposed demonstration project to assess the technical and cost feasibility of a global Very Small Aperture Terminal (VSAT) capability offers the potential to have reliable, global, realtime data communications at an affordable cost. Combining GPS and atmospheric data through the integration of GPS receivers and a Meteorological Package (MetPack) permits surface-based GPS measurement of integrated precipitable water vapor. The ability rouse GPS-based atmospheric measurements to calibrate INSAR images to increase spatial resolution of surface deformation is being actively evaluated. Fusion of these measurement and data communications capabilities into an integrated system has significant potential to advance our understanding of Earth processes by making measurements on a significantly increased spatial scale more affordable.
Single-channel Recorder Test Results from Two Active Source Experiments PASSMORE, P.R., Refraction Technology, Inc., Dallas, Texas, 75220, [email protected]; KELLER, G.R. and MILLER, K.C., University of Texas at El Paso, Dept. of Geological Sciences, El Paso, Texas, 79968, [email protected] and [email protected]; LEVANDER, A.R., Rice University, Geology and Geophysics Dept., Houston, Texas 77005, [email protected]; MCMECHAN, G., University ofTexas at Dallas, Center for Lithospheric Studies, Richardson, Texas 75083-0688, [email protected]
The University of Texas at El Paso in cooperation with the Texas Universities Seismic Instrumentation Alliance and Refraction Technology, Inc. received a grant from the State ofTexas to develop and procure 200 active source recorders (Model 125, Texan). The first 10 Texans have been deployed and tested on two active source experiments: 1) an explosion survey in the White Sands area, New Mexico, and 2) a vibroseis survey in Medicine Bow National Forest, Wyoming. Final specifications for the Texan and test results from the two surveys will be presented. UTEP has received additional grants from the Department of Defense and National Science Foundation for the purchase of at least 450 Texans.
The Evaluation of the Wilmot Seismoscope Response Assigned to the 1861 Mendoza, Argentina, Earthquake Tuan S. CARMONA and Raquel P. DE CARMONA, Earthquake Engineering Research Institute, National University of San Juan, 5400 San Juan, Argentina; [email protected]
The response of the Wilmot Seismoscope assigned to the earthquake which destroyed Mendoza City, Argentina, on March 20, 1861 is evaluated. The records of strong earthquake motions obtained on these simple, low-cost, reliable, and easy-to-maintain instruments, period 0.7 seg and damping 10%, of which more than 200 have been installed in the western part of Argentina, have shown a good correlation with Mercalli Intensity values and therefore these records are a good tool ro evaluate the destructiveness of historical earthquakes by means of one simple value with significance for engineering.
Mendoza City is located in the western part of Argentina, over a plain at the eastern foot of the Andean Mountains, and its present population is one third of a million inhabitants if the suburbs are included. In its surrounding area there is an important intraplate superficial seismic activity with focus also close to the city. The most destructive earthquake known in the four centuries of the history of Mendoza City occurred on March 20, 1861, when it was completely destroyed and nearly one third of its ten thousands inhabitants died.
For the 1861 Mendoza earthquake the authors have analyzed the reports written by the survivors and visitors about both the perception of the motion and the description of the damage to different constructions, houses being principally builc of adobe and churches of unreinforced masonry. From this a Mercalli Intensity value larger than IX results. Subsequently, these data have been compared to and correlated with those of recent Argentine destructive earthquakes-1967 (IMM=VII) and 1985 (IMM=VIII) occurred in Mendoza and 1977 (IMM=IX) in San Juan-in which records on Wilmot Seismoscopes have been obtained.
From chis analysis the resulcing Wilmot Seismoscope Acceleration Spectum value assigned to the March 20, 1861 earthquake which destroyed Mendoza City in the western part of Argentina is in the range SA(ws) = 0.8 - 1.0 g.
Seismological Research Letters Volume 70, Number 2 March/April 1999 243

INSTALLATION AND CALIBRATION OF FIVE NEW BROADBAND DIGITAL TELEMETRY STATIONS IN UTAH PECHMANN, J. C., Nava, S.J., and Arabasz, W.J., University of Utah, Department of Geology and Geophysics, 135 S 1460 E Rm 705, Salt Lake City, UT 84112-0l I l; [email protected]; [email protected]; [email protected]
tnsta!1auon of 1ive new broadband digital telemetry :,tations in Utah <luring i 99-; d.nJ 1998 has more than doubled the number of such stations in the state. The new stations strategically complement stations of the U.S. National Seismograph Network (USNSN), resulting in an ! I -station broadband network covering the southern lntermountain Seismic Belt between 37" and 43· N latitude with a station spacing of I 00 to 200 km or better. The new stations in Utah, installed by the University of Utah with funding from the U.S. Geological Survey (4 stations) and Lawrence Livermore National Laboratory (I station), are presently equipped with REF TEK 72-A07 24-bit digitizers and Guralp CMG-40T seismometers. Three-component data from these stations are transmitted continuously to the University over radio and microwave links using REF TEK digital telemetry. From there, the data are sent via an Internet link to the USNSN data center in Colorado. The data are publicly available via the USNSN AutoDRM system.
We analyzed observed and predicted outputs from remotely-generated step function calibration inputs to check and revise manufacturer-supplied instrument response parameters for these stations. This simple method produced reliable results for periods longer than one-twentieth of the seismometer free periods. The results revealed some significant deviations from the manufacturer-supplied parameters for the 18 seismograph channels calibrated ta date: (I) measured gain factors ranged from 15.0% below to 4.8% above the manufacturer's values, (2) measured damping factors ranged from .659 ta .715, compared to the nominal values of .707, and (3) measured free periods ranged from 20.1 to 21.8 sec, compared to the nominal value of 20.0 sec. These results indicate that field calibration of this type of equipment, which is typical of many lower-cost broadband digital installations. is essential for applications requiring knowledge of instrument responses to an accuracy of helter than 15%. The software we used for our step function calibrations (a Seismic Analysis Code macro) is available via anonymous FTP ta ftp.seis.utah.edu, in the file pub/misc/calcheck.m.
Tuesday P.M., May 4, 1999-0lympic Room Opportunities and Initiatives in Seismology Presiding: Joseph Henton and Anthony Qamar
Opportunities and Initiatives in Seismology SIMPSON, D.W., the IRIS Consortium, Suite 800, 1200 New York Ave Washington, DC 20005, MELTZER, A., Dept. of Earth & Environmental Sciences, Lehigh University, Bethlehem, PA 18015
Over the past fifteen years, IRIS, NSF and USGS have worked closely with other federal and international partners to provide enhanced resources for observational seismology. AB IRIS begins development of a proposal for a fourth five-year agreement with NSF, there are a number of emerging opportunities for further development of both facilities and research programs in seismology. In GE0-2000, the Geophysics directorate of NSF is undertaking a long range review of programs in the Geosciences. The EAR Division of NSF has requested the Board of Earth Sciences and Resources of the National Academy of Sciences for a review of Future Research Opportunities in the Earth Sciences, and the Board is completing a study of the Science of Earthquakes. The USGS, in cooperation with the Council of the National Seismic System, has responded to a request from Congress for a assessment of the needs of regional and national earthquake monitoring networks. The International Decade of Natural Disaster Reduction (IDNDR) and the PPP-2000 (Public Private Partnerships) workshops have helped to heighten the interest of federal agencies and the private sector in mitigation of natural hazards. Many federal and university groups are responding to public interest in earthquakes through the development of programs in education and outreach. The federal government is paying increasing attention to the support of basic and applied science. In this climate of broad interest in the Earth sciences and enhanced opportunity for support of research, the university community and the federal agencies should stress the development of coordinated programs for the advancement of research and observation in seismology and earthquake studies.
USARRAY MELTZER, AS., Lehigh University, Bethlehem, PA, 18015, [email protected], EKSTROM, G.A., Harv:ud University, Cambridge, MA, 02138; HUMPHREYS, E.D., University of Oregon, Eugene, OR, 97403, LEVANDER, A.R., Rice University, Housron, TX, 77005; and SHEARER, P.M., Scripps Institution of Oceanography, University of California, San Diego, La Jolla, CA 92093.
USArray is a proposed facility for investigating the structure and evolution of the North American continent. The heart of the facility is a transportable dense array of seismometers which will improve the quality of seismic images of the
continental lithosphere and deeper mantle by an order of magnitude. AB the array moves, it will systematically image structure beneath the continental US and will serve as the core of an integrated field laboratory involving a wide spectrum of multidisciplinary geoscience investigations. In addition, a densified network of permanent ,;;eismic nhservarorie.'li will improve che location and
quantification of seismic sources in the US, and provide a stable array for imaging details of deep Earth structure on a global scale. Additional geophysical and geologic studies can be undertaken simultaneously and integrated with the seismic observations to substantially improve our understanding of the solid e:uth, lithospheric dynamics, and evolution of the North American continent. In addition to advancing integrated research in basic Earth structure, the facility will improve seismic hazard assessment in the US and enhance Earth Science education and outreach.
The USArray concept has many compelling advantages as an umbrella for Earth science studies in continental evolution as the US continent encompasses many diverse tectonic regimes. The array concept: (1) provides continuity of scale between regional and global scales, (2) provides a suitably structured yet still flexible organization for the study of many fundamental processes in earth science, (3) provides context and integration of a diverse suite of measurements, (4) builds on the concept of shared and coordinated resources, (5)produces data that are readily and openly available to all, ( 6) can involve most institutions of higher learning in the US, and (7) has high potential for impact on K -12 science education and general science literacy. Seismic data recorded by the array can be integrated with other geologic studies providing a geoscience information system.
Integration of Geodetic and Seismic Observations for Plate Boundary Studies STEIN, S., Department of Geological Sciences, Northwestern, University, Evanston, IL 60208, [email protected]; SILVER, P., Carnegie Institution of Washington, 5241 Broad Branch Rd. NW, Washington DC, 20015; BURGMANN, R., ROMANOWICZ, B., Department of Geology and Geophysics, University of California, Berkeley, CA 94720
Although plate motion is responsible for most of the world's seismicity, the physics of this relationship remains obscure. Only a fraction of this deformation results in earthquakes, with the remainder being distributed between slow or silent fault motion, and permanent aseismic deformation. We know little about what controls this deformation budget, and particularly the process by which steady plate motions induce discrete, episodic earthquakes. Simil:uly, we know little about the mechanics of the plate boundary system itself. We are unsure how stresses and strains are distributed within the boundary zone in space and time. As a result, we have only simple models for fault behavior before, during, and after earthquakes.
This area of research, at the interface between seismology and geodesy, is ripe for major advance because of advances in the observational tools. High-precision geodesy using the Global Positioning System is mapping the large-scale deformation field in space and time. INSAR represents a complementary means of mapping deformation over broad areas and resolving fine details and complexities of the surface deformation. New generations of seismometers are giving our best look ever at the earthquake process, including the crucial initial stages of rupture initiation. Strainmeters give us the ability to measure shortterm aseismic transients, with nanostrain sensitivity, that may provide insight into the process of earthquake occurrence. Significant technological advances are taking place in instrumentation, data collection, and data communication. These advances permit integrated systems that can build upon existing infrastructure in tectonically active areas like California, and may ultimately result in the implementation of full-fledged Place Boundary Observatories, such as one extending along the Pacific-North American plate boundary zone.
Tuesday P.M., May 4, 1999-0lympic Room Pacific Northwest Crustal Deformation and Tectonics Presiding: Anthony Qamar and Joseph Henton
GPS Constraints on Plate Coupling in Central Western Oregon GOLDFINGER, C. College of Oceanic and Atmospheric Sciences, Oregon State University, Corvallis, OR 97331, [email protected]; MCCAFFREY, R., Dep:utment of Earth and Environmental Sciences, Rensellaer Polytechnic Institute, Troy, NY, 12180; MURRAY, M., Department of Geophysics, Mitchell Building, B76, Stanford University, Stanford, CA 94305; ZWICK, P., Department of Earth and Environmental Sciences, Rensellaer Polytechnic
244 Seismological Research Letters Volume 70, Number 2 March/April 1999

Institute, Troy, NY, 12180; NABELEK, J ., College of Oceanic and Atmospheric Sciences, Oregon State University, Corvallis, OR 97333, SMITH, C.L., NOAA, National Geodetic Survey, P.O. Box 12114, Salem, OR 97309; JOHNSON, C., Department of Earth and Environmental Sciences, Rensellaer Polytechnic Institute, Troy, NY, 12180
We have been using GPS data from permanent sites and campaigns in 1992 and 1994 by USGS, and in 1996, 1997, and 1998 by OSU, RPI, and NGS to examine the variability and landward extent of interplate coupling in central Oregon. We established two permanent sites and a campaign network in central Oregon to investigate potential strong variability of the coupling signal suggested by earlier leveling studies. The earlier results showed little or no landward tilt of the coast range at 45 deg. N, while other arc-normal transects showed landward tilts. The earlier data have been variously interpreted as either poor coupling at this latitude, or as a coupled zone offshore, with the lack of tilt fulling within the survey error. New GPS results indicate a probable locking signal in the central Oregon corridor, with station vecrors consistent with an elastic signal from JDF-NOAM coupling. Vectors are also rotated toward arc-parallel from the NUVEL IA vector, suggesting motion of a forearc sliver. GPS measurements also suggest that rapid surface displacement related to plate coupling extend further landward than would be expected from a locked zone lying entirely offshore. Preliminary elastic dislocation models suggest that plate coupling may extend beneath the Oregon Coast Range. The anomalous lack of landward tilt in earlier uplift data might be related to broader distributed coupling beneath the coast range/Siletzia terrane. The relative lack of uplift in the same corridor is supported by geologic evidence spanning several time scales, suggesting both an elastic and anelastic response of the upper plate to coupling stress.
Earthquake Hazards in Western Washington: What Have We Learned from Continuous GPS Measurements? QAMAR, A., KHAZARADZE, G., Geophysics Program, Box 351650, University ofWashington, Seattle, WA 98195-1650, [email protected]
Western Washington state is vulnerable to damaging earthquakes from three sources: megathrust earthquakes on the Cascadia subduction zone, earthquakes on shallow faults in the crust, and deep earthquakes in the subducting Juan de Fuca plate. For the last 3 years we have analyzed data from continuous and temporary GPS sites in western Washington in order to study the processes responsible for these earthquake sources.
Observed motions at 7 GPS sites can be mostly explained by the 42 mm/yr convergence of the Juan de Fuca plate and North America. Observed rates (relative ro stable North America) are 9-11 mm/yr on the coast and 3-4 mm/yr in the Puget Sound (azimuth 54-65 deg). The observations match dislocation models of the subduction process as long as the width of the locked zone between the plates is 200 km under NW Washington and I 00 km under Canada and Oregon, a result in agreement with what is known about the plate geometry from earthquake studies.
Up to several mm/yr of the observed site velocities can not be explained by the subduction process. A slowly accumulating NS compression (approx. 0.01 microstrain per year) of western Washington is also required to account for the GPS data. We believe this result is consistent with the fact that most crustal earthquakes in western Washington have focal mechanisms with NS axes of maximum principal stress.
One of the permanent GPS stations in the Puget lowland (WHDl on Whidbey island) has an anomalously high velocity of 6 mm/yr. Preliminary results from campaign GPS studies suggest that other sites in the Puget lowland may also have anomalous velocities. If these calculated velocities reflect actual motions rather than uncertainties in GPS data processing caused by the short time period of our study, there may be a more complex strain field in the Puget lowland than previously believed.
GPS Monitoring of Crustal Deformation on Vancouver Island HENTON, I.A., DRAGERT, H., HYNDMAN, R.D., WANG, K., and SCHMIDT, M., Pacific Geoscience Centre, Geological Survey of Canada, 9860 West Saanich Road, Sidney, BC, Canada V8L 4B2, [email protected].
Vancouver Island, located in southwestern coastal British Columbia, overlies the northern portion of the Cascadia Subduction Zone. The region exhibits very active seismicity and high earthquake hazard, including infrequent M-9 great events. Crustal deformation measurements have been carried out in this region since 1978 using various geodetic field techniques: levelling, tide gauges,
precise gravity, laser ranging, and most recently, GPS. These earlier survey data have provided key constraints for slip dislocation models of the Cascadia subduction thrust. The models provide estimates of the maximum rupture area for great earthquakes. Velocity estimates based on both campaign GPS network surveys and up to 7 years of data from continuous GPS sites are consistent with strain accumulation expected from a locked subduction fault. However, at the north end of the Cascadia Subduction Zone, they also provide evidence for crustal strain that is not fully accounted for by current elastic models of a locked subduction thrust fault. The northwesterly motion of the station HOLB, located on northern Vancouver Island adjacent to the Juan de Fuca-North America-Pacific triple junction, is more consistent with the shear strain expected from margin parallel Pacific/North America interaction across northwest trending strike-slip faults.
Implications of Thermal Modeling for Shallow and Intermediate Seismicity of the Southern Cascadia Subduction Zone? McKENNA, J.R., BLACKWELL, D.D., Department of Geological Sciences, Southern Methodist University, Dallas, Texas, USA,75275, [email protected], [email protected]
We investigated the influence of temperature along the very young (<8 Ma), presently seismically quiescent southern Cascadia subduction zone (CSZ) to gain insight into hypothesized great (Mw>8) subduction zone thrust earthquakes. Thermal cross-sections of the gently dipping, subducting Juan de Fuca lithosphere, the overlying accretionary complex and adjacent backstop are used to characterize the shallow decollement (£30 km) within this youngest segment of the subduction zone. 8 new heat-flow determinations were used with existing heat-flow data and a theoretical surface heat-flow value at the deformation front to establish a surface heat-flow profile across the CSZ in Oregon (40°N). A similar heat-flow profile north of the Mendocino Triple Junction ( 45°N) utilizing existing heat-flow data and a theoretical deformation front heat-flow value was also constructed to emphasize the thermal effects of subduction of the even younger Gorda plate.
Thermal cross-sections were constructed. Heat-generation was removed from these surface heat-flow profiles via the linear heat-flow/heat-generation relationship to obtain a basal heat-flow boundary condition. 2-dimensional, finite element calculations utilizing this boundary condition model the forearc thermal regime of the CSZ from seaward of the deformation front to 25 km and 55 km landward of the coast.
Pressure-temperature (P-T) trajectories constructed from decollement temperature profiles underscore the uniqueness of the CSZ and suggest that the decollement experiences greenschist, rather than the expected blueschist, metamorphism at shallow decollement depths. This unusual situation is the result of 3 factors: a well developed, low thermal conductivity accretionary complex; an initial shallow decollement dip; and the very young age of the subducting lithosphere itself. The weak dependence of decollement metamorphism on the age of the subducting lithosphere is not readily apparent, but is dearer when placed in the context of P-T diagrams. Pressure along the decollement is so low that even relatively old lithosphere is warm enough to generate the low P-T ratios required for shallow subduction zone greenschist metamorphism.
Consequences of mapping P-T trajectories on subduction zone decollement paths are 3fold. 1st, generation of blueschist metamorphic conditions suggests minimal sediment cover of the subducting lithosphere. 2nd, the shallow decollement dip must be steep, otherwise the pressure is insufficient to rotate the PT path into the blueschist conditions range. 3rd, decollement P-T trajectories place constraints on the intermediate thermal structure of the subducting slab and any phase-change-induced seismicity at these depths.
Cascadia Subduction Zone Segmentation in the Mendocino Triple Junction Region CARVER, G.A., Dept. Geology, Humboldt State University, Arcata, CA 95521 [email protected], PLAFKER, G., U.S. Geological Survey, Menlo Park, CA 94025 [email protected]
Plate interaction at the Mendocino triple junction is distributed across a broad region where wide, complex plate boundaries intersect. The San Andreas transform leg of the triple junction is made up of three principal fault zones separated by 30-50 km wide splinters of continental crust. The Mendocino transform leg includes the Mendocino fault and a broad zone of deformation that encompasses the southern part of the Gorda plate. The Cascadia megathrust and the 70 km wide Little Salmon and Mad River thrust systems in the upper plate accommodate plate convergence across the Cascadia subduction zone (CSZ). The intersection of the two wide transform boundaries with the 70 to 100 km wide southern end of the subduction zone results in changes in con-
Seismological Research Letters Volume 70, Number 2 March/April 1999 245

vergent vectors and rates and produces at least two kinematically-defined subduction zone segments in the Mendocino triple junction region. The southern of these, the Petrolia segment, ruptured in 1992 producing the Ms 7.2 Petrolia earthquake. The northern Eel River segment has not ruptured historically, but high-precision 14-C ages of tree ring series from trees killed by salrwarer immersion due to coseismic subsidence in the lower Eel River valley suggest the last rupture of this segment occurred in the early 1800s, about 100 years after the last rupture of the main CSZ to the north.
Deformation and Mass Transfer at the Mendocino Triple Junction: What Gorda Gives Up, North America Receives HENSTOCK, T.J ., and LEVANDER. A., Geology and Geophysics Department, Rice University, Houston, TX, 77005, [email protected]; MELTZER, A.S., and GULICK, S.P.S., Department of Earth and Environmental Sciences, Lehigh University, Bethlehem, PA 18015, [email protected].
A variety of seismic data types from the Mendocino triple junction region suggest that the buoyant oceanic crust of the Gorda plate is detaching from the rest of the subducting plate at relatively shallow depths in the southernmost part of the Cascadia subduction zone and entering the San Andreas fault (SAF) transform regime to the south where it is added to the base of the North American accreted terranes. Seismicity patterns, focal mechanisms, and marine and land seismic reflection and refraction data indicate that the Gorda plate is deforming throughout the crust and upper mantle. Seismicity is concentrated in the Gorda and North American plates, north of the Mendocino transform fault. Alongstrike land seismic data supports a model of Gorda fragmentation. Marine and onshore-offshore profiles centered on the triple junction region across Cape Mendocino show a strong Pacific plate buttress against the deforming Gorda plate. Marine-land seismic profiles across the continental margin and the SAF system where it is -2 Ma old show a -6km thick mafic lower crust beneath the entire margin. This layer is deformed to the Moho by the S~F and '."1aaca~a fault, suggesting that the lower crust west of the SAF proper 1s genetically different from that to the east. Although the seismic data image magma bodies in the lower crust onshore beneath the transform system, melt production calculations indicate that melt volumes are insufficient to produce an entire 6km thick mafic layer. The melt calculations agree with the approximate volume of melt bodies we image.
We propose that -60% of the lower crustal layer and part of the upper mantle are derived from Gorda fragmentation during subduction. If this tectonic scenario is correct, the oceanic crust of the Gorda plate (or remnants of the Farallon plate) then form a significant fraction of the mafic lower crustal layer observed beneath the SAF system throughout coastal California as far south as the Transverse Ranges. Additional basaltic components are added to the crust in the form of mantle derived melts supplied through the asthenospheric window opening beneath the northernmost part of the developing SAF system by subduction of the rest of the Gorda lithosphere.
Thermal and Dislocation Modeling and Great Thrust Earthquakes of the Queen Charlotte Transform Margin SMITH, A.T., 1· 2 HYNDMAN, R.D., 1•
2 WANG, K., CASSIDY, J.F., 1
DRAGERT, H., 1 SCHMIDT, M., 1 1 School of Earth and Ocean Sciences, University of Victoria, Victoria B.C., Canada 2 Pacific Geoscience Centre, Geological Survey of Canada, Sidney B.C., Canada [email protected]
The Queen Charlotte Transform Fault runs from the Queen Charlotte triple junction off northern Vancouver Island to the Southern extension of the subduction thrust system off the coast of Alaska. The fault marks the mainly strikeslip plate boundary between the Pacific and North America Plates. Since the early Pliocene (-5 Ma} plate motion models have inferred oblique transpression. The discrepancy between the plate boundary and the direction of relative motion is about 20 degrees. This implies convergence of approximately 20 mm/ yr and a total convergence since the Pliocene of 80 to 100 km. This study uses thermal and elastic dislocation modelling to define the potential for great thrust earthquakes beneath this margin. Structural modelling based on seismic reflection, seismic refraction and gravity data has produced two tectonic models. The first involves the component of convergence being taken up in deformation and shortening of the Pacific and North America Plates, and has little or no underthrusting. The second has underthrusting of up to 100 km of oceanic crust. The preferred model is underthrusting of the Pacific Plate, but it is unknown whether the Queen Charlotte Fault extends down to cut off the underthrust oceanic lithosphere from the Pacific Plate. Two different analysis techniques were used to determine the present tecronic environment. The first involves the comparison of finite element thermal modelling with heat flow data for the
fault zone. The thermal models constrained by heat flow data allow estimation of the seismogenic width of the fault zone and thus put constraints on the maximum thrust earthquake magnitude. Secondly, elastic dislocation modelling was done for the fault zone with crustal deformation velocities calculated for the six sites of an initial Queen Charlotte Islands GPS campaign survey. Future GPS site measurements should provide deformation velocities that may help distinguish between the tectonic models and help determine whether the thrust fault is locked and whether the Queen Charlotte Fault cuts through the underthrusting oceanic lithosphere.
Tuesday P.M., May 4, 1999-Lopez Room Earthquake Sources and Fault Mechanics: Observations and Insights II Presiding: Gregory Beroza and Chris Marone
Fault Fabrics/Earthquake Mechanics from Precise Relative Earthquake Locations RUBIN, A.M., Department of Geosciences, Princeton University, Princeton, NJ 08544, [email protected]; GILLARD, D., Exxon Production Research Company, Houston, TX 77027; and GOT, J.-L., Laboratoire d'Instrumentation Geophysique, Universite de Savoie, 73376 Le Bourget-duLac, France
We use waveform cross-correlation ro relocate large numbers of microearthquakes in order to image fault-zone strucrure on a regional scale. Results from faults in California and Hawaii show that microearthquakes tend to be aligned in streaks that are nearly parallel to the direction of slip. Our best dataset stretches from the southern edge of the Loma Prieta rupture in the north to the creeping section of the San Andreas southeast of San Juan Bautista in the south. We relocated 75 percent of a total of 3300 earthquakes with waveforms that may be accessed from the NCEDC that occurred from 1984 to 1997. The microseismic lineations extend for up to 3 km along strike and many are less than 200 m high; several contain nearly 100% of the local seismicity.
We presume that the lineations represent regions of stick-slip failure surrounded by km-scale regions undergoing creep. Possible causes of the linear fabric include ( 1) large-scale striations along the fault surface, (2) fault offsets, and (3) resistant blocks of rock that either get smeared out along the fault or that plow through the gouge zone. Many lineations have a res?lvable. dip that is indistinguishable from that of the fault zone as a whole, argumg .a~amst (1) and (2). A small number oflineations have trends that appear to be d1snnct from the slip direction, arguing against (1) and (3).
While our results suggest that microseismic lineations are a common feature of creeping faults, the fact that the 20-km section of the San Andreas north of San Juan Bautista had until recently been considered locked (it slipped by 2 m during the 1906 San Francisco earthquake, exhibits no measurable creep at the surface, and produced little microseismicity prior to Loma Prieta) suggests that they might be a common feature of faults when they creep, even if the fault is largely seismogenic over long time scales.
Slip-parallel Seismic Lineations on the Hayward Fault and the San Andreas Fault near Parkfield, California WALDHAUSER, F., ELLSWORTH, WL., and COLE, A., U.S. Geological Survey, 345 Middlefield Rd., Menlo Park, CA 94025, [email protected]
High resolution relative locations of the complete catalog of earthquakes recorded between 1984 and 1998 on the Hayward fault and San Andreas fault near Parkfield define narrow (25-100 m), near vertical fault zones for both faults. The most striking features are horizontal lineations of hypocenters that extend along the fault zones and are embedded within a diffuse pattern of offfault activity. The lineations are most dominant on the northern Hayward fault in earthquake clusters near Berkeley and El Cerrito. The vertical range of centroids within each lineation is limited, typically, to only a few 100 mover a horizontal distance of one ro several km. Most lineations persist over the 15 year observation interval implying a localized condition on the fault where the conditions for brittle failure are met and sustained. The temporal pattern of activity within individual clusters includes examples of repeating earthquakes. Where the fault is locked, the repeat rate is low, and where it is creeping the rate is several times higher for events of the same magnitude.
The pronounced linearity of some multiplets suggests a mechanical origin because the alignment is co-linear with the horizontal slip direction of the Hay-
246 Seismological Research Letters Volume 70, Number 2 March/April 1999

ward fault and the San Andreas fault near Parkfield, respectively. A possible explanation for such a horizontal alignment would be a wear process in which localized deposits of frictionally unstable material are smeared out along the fault zone as a consequence oflong-term fault displacement. Thus, these eanhquakes may define very long-lived seismic strucrures that persist through many earthquake cycles.
Source Parameter Inversion Using 3·D Green's Functions: Application to the 1979 Coyote Lake, California, Earthquake ARCHULETA. R.J. and LIU, P.C., Institute for Crustal Studies, UCSB, Santa Barbara, CA 93106, [email protected]
Waveform inversions have been successfully applied to calculate kinematic parameters of earthquake rupture histories from strong ground motion records. One of the primary limitations of these studies is that they were restricted to laterally homogeneous {1-D) velocity models. With the recent advent of computational technology and improved knowledge of crustal structure, it is now possible to include 3-D wave propagation effects in the determination of eanhquake rupture process on a finite fault by inverting seismic waveforms. The 3-D Green's functions play key role in this kind inversion. By using reciprocity relation for Green's functions, we apply a point force at the observer location and evaluate Green's functions (actually the tractions) on the fault. The finite element (FE) method is used to calculate the Green's functions because the freesurface boundary conditions are naturally included in FE scheme. As an application we have studied the 1979 M 5.9 Coyote Lake, California earthquake. The ground motions recorded at six stations (five stations of the Gilroy array and Coyote Lake dam) and a 3-D crustal model recently developed by U.S. Geological Survey was used in this study. We applied a global nonlinear inversion method to solve for the two components of fault slip, rise time, and rupture time for each subfault. The comparisons between the new inversion result with that determined previously using 1-D synthetic Green's functions is presented.
Dramatic Reduction in Friction of Quartz at Rapid but Subselsmic Slip Rates GOLDSBY, D.L., and TULLIS, T.E., Dept. of Geological Sciences, Brown University, Providence, RI 02912, [email protected]; [email protected]
The shear resistance of faults at seismic slip velocities of -1 mis affects the magnitude of dynamic stress drops, heat generation, and strong ground motion. Reductions in dynamic resistance can cause ruptures co propagate as self-healing slip pulses. Very few rock friction data relevant to chis problem exist, due t0
the difficulty of simultaneously attaining fast slip rates and large displacements at high normal stresses in the laborarory. We can overcome these difficulties in our high-pressure rotary shear apparatus, in which we can attain a rapid steady slip rate of -3 mm/s. We have conducted such rapid sliding experiments on bare surfaces of natural quartzite, and on simulated gouge layers of quartz.
In both cases, we observe an extraordinary reduction in frictional resistance with shear displacement. The magnitude of this weakening increases with normal stress over the range 25-112 MPa. At 112 MPa, the friction coefficient for initially bare quartzite surfaces drops from 0.8 to 0.14 in -1.5 m of slip. A similar trend is observed for simulated gouge layers, though the effect is more dramatic; a larger drop in friction occurs at lower normal stress and afrer even less displacement. Microstructural observations of initially bare surfaces and simulated gouge layers suggest that melting occurred on the fault surfaces.
The extraordinary frictional weakening we observe is likely caused by lubrication of the fault surface by confined melt. This weakening at even a modest sliding velocity of 3 mm/s is sufficient ro satisfy the heat How constraints for the San Andreas fault. We expect that weakening due to melt lubrication may be even more dramatic at higher sliding velocities during eanhquakes.
Distributed Flow vs. Localized Slip in Late Cenozoic Low-angle Fault Zones, Death Valley, California COWAN, D.S., Geological Sciences, University of Washington, Seattle, WA 98195-1310, [email protected]; and MILLER, M.G., Geological Sciences, University of Oregon, Eugene, OR 97403-1272, [email protected]
One comparison chat can be made between experiments on gouge and field observations of natural fault rocks concerns whether slip progressively localizes onto discrete surfaces, parallel to the boundaries of the fault zone, as total displacement accrues. On the basis of our observations of fault rocks in mature, brittle shear zones in Death Valley, we propose that throughout the history of these fault systems, which developed about 10-15 my ago and have slipped as
recently as 600,000 y ago, slip was partly accommodated by distributed mesoscopic How in very fine-grained gouges. Evidence that How of gouge occurred during the most recent displacements includes centimeter- to meter-scale intrusions of gouge into hanging walls composed of Quaternary sediments, and centimeter-scale lenses of hanging-wall gravels incorporated into the gouge. Evidence that localized slip proceeded contemporaneously with chis How includes How-banding in gouge and intrusions of gouge in the hanging wall char are cut by the well-defined primary sliding surfaces themselves. Moreover, merer-long striated slip surfaces are present in and wholly surrounded by gouge. Where these surfaces splay off of the main fault, they typically terminate within the gouge.
Assuming rhat the results of experiments are applicable tO natural faults, we argue that these observations are consistent with the hypothesis chat the nonlocalized How represents velocity-strengthening behavior and, by inference, periods of stable slip in these fault zones. Total slip on these fault systems is conservatively estimated to be at least 10 km. Some part of this slip was very likely accommodated aseismically.
3·D Rupture Dynamics with Kinematic Constraints: The 1992 Landers Earthquake OLSEN, K.B., Institute for Crustal Studies, UC Santa Barbara, Santa Barbara, CA 93106-1100, [email protected]; MADARIAGA, R., Laboratoire de Geologic, Ecole Normale Superieure, 24 rue Lhomond, 75231 Paris Cedex 05, France, [email protected].
We use results from kinematic slip inversion to compute prestress and constrain frictional parameters and dynamic rupture propagation for the 1992 magnitude 7.3 Landers, California, earthquake. The earthquake is modeled kinematically and dynamically with a three-dimensional finite-difference method. The kinematic model uses fixed, prescribed rupture parameters from the kinematic slip inversion and the dynamic models generate spontaneous ruptures controlled by a prestress distribution computed from the slip distribution used in the kinematic simulation. The dynamic ruptures that produce a moment, duration and near-fault radiation similar to that for the kinematic simulation are characterized by propagation along a complex path with highly variable speed and rise time, and they reprod uce the general slip pattern used to compute the initial stress distribution. The stress drops and slip weakening distances for the dynamic ruptures are to a large extent constrained by the amplitudes and arrival times of the waves observed in the kinematic radiation. These dynamic simulations are characterized by rupture energy releases of 5-10 MJ/m2
, a stress drop ofless than about 120 bars, and relatively large slip weakening distances (0.5-3 m). We find that spatial variations of the prestress and lateral variations in the slip weakening distance are primarily in control of the correlation between kinematic and dynamic radiation, while velocity weakening tend to play a secondary role. Discrepancies at specific stations between ground motion synthetics for the kinematics and simulations of dynamic ruptures with a simple friction law suggest that modeling of the prestress and frictional parameters by fitting kinematic and dynamic radiation can lead to improved knowledge of the rupture process of the Landers earthquake.
On the Resolvability of Fault Frictional Parameters from Wave Form Inversion of Strong Ground Motion Data GUATTERI, M., Dept. of Geophysics, Stanford Univ., Stanford CA 94305 USA [email protected], SPUDICH, P., U.S. Geological Survey, Menlo Park, CA 94025 USA [email protected]
Two major goals of seismology are the discovery of the stress conditions on faults before and during earthquakes, and the inference of an applicable constitutive law for real faults, i.e. a relationship that specifies the relation between stress, fault slip, slip rate and other relevant physical and chemical properties of the fault. Recently, constitutive parameters such as strength excess and slipweakening distance De have been estimated for some moderate earthquakes by authors using wave form inversions. Estimates of De are particularly interesting: Ide and Takeo (1997) infer De - 1 m for the shallow part of the Nojima fault for the 1995 Kobe earthquake, and they estimate De <= 0.5 m on the deeper part of the fault, while Olsen et al. (1997) estimate De = 0.8 m for the 1992 Landers earthquake.
We show that wave form inversion of a synthetic strong motion data set from a hypothetical M 6.5 event resembling the 1979 Imperial Valley earthquake cannot resolve both strength excess and De. Specifically, we find two rupture models, Model A having De= 0.3 m and Model B having De= 1 m, which produce wave forms that are essentially indistinguishable when viewed within the 0-1.6 Hz frequency band.
Seismological Research Letters Volume 70, Number 2 March/April 1999 247

The fundamental difficulty is chat a trade-off exists between strength excess and De in controlling rupture velocity. However, fracture energy might be relatively stably estimated from wave form inversions. Our models A and B had very similar fracture energies. If the stress drop is fixed, the rupture velocity is .... untrul~cJ by fr,h.,lUit energy.
Regions of high strength excess are often used to slow or stop rupture in modelling observed earthquakes, but our resulcs indicate chat regions of long De and lower strength excess might alternately explain the slowing of rupture. One way to constrain De would be to model ground motion spectra at frequencies higher than those at which wave form modelling is possible. A seco~d way to discriminate between regions of long De and large strength excess might be to assume chat De is long where there are no aftershocks.
Coseismic and Postseismic Stress Histories Inferred from Focal Mechanisms: A Review MICHAEL, A.J. and BAWDEN, G.W., USGS, MS 977, 345 Middlefield Road, Menlo Park, CA 94025, [email protected] and gbawden@omega7. wr. usgs.gov.
Coseismic and poscseismic stress and strain hisrories are useful for inferring the physics of the seismogenic process, but as most observations are made at the surface they are not optimally close to the source region. Another possibility is to infer these histories from the mechanisms of background seismicity and aftershocks. The proximity of these events to the mainshock source may reveal new parts of the earthquake process. In chis study, we review the findings of several researchers and will seek physical explanations for them.
For some sequences the background seismicity and aftershocks are so similar that no coseismic stress change can be inferred from the mechanisms. Such earthquakes include the M6 1966 Parkfield and the M6.2 1984 Morgan Hill events. However, for some large events with a stress drop that approaches the pre-existing stress level, e.g. for the 1989 M7.l Loma Prieta and the 1992 M7.3 Landers events, the mainshock seems to create a very heterogeneous stress field near the area of greatest slip. .
The most perplexing patterns observed so far are coseismic and postseism1c rotations of the principal stress axes. For the M6.7 1994 Northridge earthquake the most compressive stress axis was at N30°E before the mainshock. The coseismic change rotated it 20° CCW to N 1 O"E and then it rotated back to about N35"E over the next 2 years. Similar postseismic rotations were observed for the M6.7 1983 Coalinga and the M5.4 1986 Oceanside earthquakes, bur a lack of background seismicity prevented observing the coseismic changes. Coseismic and postseismic changes with opposite senses are very different from postseismic geodetic strain observations, which generally continue in the same direction as the coseismic changes. Thus explaining these observations remains a worthwhile challenge.
OBSERVATIONS OF EARTHQUAKES IN OCEANIC INTRAPLATE LITHOSPHERE WITH EXCEPTIONALLY INTENSE SEISMIC-ENERGY RADIATION A. McGarr and George L. Choy, U.S. Geological Survey, Menlo Park, CA 94025, [email protected]; U.S. Geological Survey, Lakewood, CO 80225, [email protected].
Choy and Boatwright UGR, 1995) analyzed globally radiated seismic energies E,
and seismic moments M0
for 397 shallow earthquakes distributed globally and
noted that the highest apparent stresses (GE/M, where G is the modulus of rigidity) are associated with strike-slip earthquakes that occur at oceanic ridge -ridge transform faults and in intraplate environments seaward of island arcs. A more detailed investigation, using an additional 653 large shallow earthquakes that occurred since 1991, reveals that earthquakes with the highest apparent stresses tend to share the following characteristics: (1) They occur in oceanic intraplate lithosphere adjacent to transform faults. (2) Their focal mechanisms are strike slip, but, neither nodal plane is parallel to the nearby transform fault. (3) Their P axes are nearly perpendicular to the transform fault. (4) Thelf hypocentral depths are generally between 10 and 20 km. Notable examples include large events in the Gulf of Alaska in late 1987 and early 1988, the second large aftershock of the April 1992 Cape Mendocino, California, sequence, and the March 1998 BalJeny Sea earthquake within the Antarctic plate. The high apparent stresses for these types of events, sometimes in excess of 20 MPa, are interprete.d here as indicating very high lithospheric strength in these seismogen1c environments. This interpretation is consistent with oceanic lithospheric strength estimates based on laboratory evidence.
Tuesday P.M., May 4, 1999-Fidalgo Room Seismology in Education II Presiding: Catherine Johnson and Charles Ammon
NSF Support for Undergraduate Geoscience Education MAYHEW, M.A., Directorate for Geosciences, National Science Foundation, Arlington, VA 22230, [email protected]; and STOUT, D.L., Division of Undergraduate Education, Directorate for Education and Human Resources, National Science Foundation, Arlington, VA 22230, [email protected].
The National Science Foundation has made reform of undergraduate science education a special agency priority. This means supporting innovative application of modern pedagogies which engage students in the process of scientific discovery. Undergraduate geoscience education represents a special need and opportunity because of the inherent interest of natural processes to students and the public at large, the availability of large real-time and archive data sets from the natural world, and the need to bring the Earth and Space Science component of the National Science Education Standards on a par with the physical and biological sciences. Seismology represents a particularly attractive vehicle for innovation in geoscience education. NSF's Directorate for Geosciences (GEO) and Division of Undergraduate Education (DUE)/Directorate for Education and Human Resources are placing special emphasis on undergraduate geoscience education, separately and collaboratively. Programs of these ~nits and other funding opportunities at NSF for geosc1ence educators are descnbed. We particularly highlight a new collaborative effort in application of digital libraries to undergraduate geoscience education, in which we see the seismology community as having a particularly valuable role.
The SAGE (Summer of Applied Geophysical Experience) ProgramIntegration of Education and Research in Geophysics BRAILE, Lawrence W, Dept. of Earth and Atmos. Sci., Purdue Univ., West Lafayette, IN 47907, [email protected]; JIRACEK, George R., Dept of Geol. Sci., San Diego State Univ., San Diego, CA 92182, [email protected]; BALDRIDGE, W Scott, Earth and Environ. Sci. Div., Los Alamos Natl. Lab., Los Alamos, NM 87545, [email protected]; FERGUSON, John R., Prog. in Geos., Univ. ofTexas at Dallas, Dallas, TX 75083, [email protected]; BIEHLER, Shawn, Dept. of Earth Sci., Univ. of California, Riverside, CA 92521, [email protected]; and GILPIN, Bernard J., Inst. of Sci., Health and Phys. Educ., Golden West College, Huntington Beach, CA 92647, [email protected].
The SAGE program is a 3-4 week, intensive summer course in geophysics for advanced undergraduate and graduate students in geology and geophysics. Nearly 400 students have participated in the program during the past 16 years. Students' home institutions range from small liberal arts colleges to large research universities. Seismic refraction and reflection, electromagnetic, gravity and magnetic, and geological data are collected and interpreted. The students and the faculty are involved in all phases of the data acquisition, computer analysis and interpretation. At the end of the program, each student prepares a written report on one or more aspects of the data and student teams present an integrated oral report on their project. Additional data analysis, interpretation and writing of the results for eventual publication are accomplished during a January follow-up workshop. A focus of the SAGE program has been investigating the nature of the boundaries of the Rio Grande rift which have been imaged using CMP seismic reflection profiles and other geophysical data. Recently, near surface, environmental sites have also been studied using a variety of geophysical methods to delineate the boundaries of the sites and infer the nature of fill material. These geophysical applications provide the students and faculty with interesting and relevant problems for both learning and research.
Experiences in Building Interactive, Web-based Learning Environments: Introduction to Geophysical Exploration BOYD, T.M., Colorado School of Mines, Golden, Co, 80401, [email protected]
Web-based learning resources are the latest craze in educational technology. Many web-based learning resource sites, however, are used for little more than electronic distribution of traditional learning materials (i.e., outlines, syllabi, notes, figures, etc.). While there are good reasons for using this media to distribute traditional materials, I have taken the approach that the new computing and networking technologies offer distinct opportunities to enhance the learning
248 Seismological Research Letters Volume 70, Number 2 March/April 1999

process that are not possible with traditional materials. In this talk, I describe the motivation for, and the development of a non-traditional learning. Everything that I have developed is freely available at http://www.mines.edu !fi_homel tboyd!GP311.
While the site includes the content expected in an introductory geophysics course (i.e., notes), it was developed primarily with an emphasis on providing an on-line resource to facilitate learning by allowing students to gain an understanding of exploration geophysics by becoming actively involved in designing and conducting geophysical surveys, and then interpreting the observations from these surveys. To accommodate these activities students interact with the site, and the site interacts with them, through a variety of web-based tools. The implementation is based on a generalization of the well-known case study approach. Unlike traditional case studies, in chis environment, students control all of the important decisions within the case. So, instead of students simply examining the results of a particular project, my approach has been to set up a problem and then allow students to decide how to proceed in solving chis problem. The site not only allows, but facilitates student control over all decisions related to survey design and field acquisition, data reduction, and data interpretation.
In completing this course, students develop an intuitive understanding 1) for the underlying physics, 2) for when specific geophysical techniques are appropriate, 3) for the inherent uncertainties associated with geophysical investigations, and 4) for how decisions made during the completion of an investigation can influence the outcome of the investigation.
Tectonic Geodesy Involves Undergraduate UCSB Students in Meaningful Seismological Research SYLVESTER, Arthur Gibbs, Department of Geological Sciences, University of California, Santa Barbara, CA 93106-9630; [email protected]
Tectonic geodesy is a splendid vehicle by which to introduce undergraduate students to the rigor, tedium, and thrill of seismologic field research. We have about 100 geodetic arrays of various kinds across active and potentially active faults in southern California, western Nevada, and western Wyoming. The arrays require periodic resurveys to determine if surface slip has occurred on the faults, whether that slip be pre-seismic, co-seismic, post-seismic, or interseismic. Students use sundry surveying instruments, including the GPS, the total station distance meter, and the digital level; they learn standard surveying techniques prescribed for tectonic first-order surveying; they learn techniques for data analysis; they even learn how to install bench marks designed for a halflife of 100 years. More than just how to do things, they learn chat research is hard work if it is done carefully and thoroughly. Thus they learn attention to detail, teamwork, responsibility, and dependability. The rewards include the realization of contributing meaningfully to a long-term research effort, and the rare thrill of discovering that a fault has slipped or that a fold has grown. Each year's research team bonds into a highly effective and competent unit that takes pride in trying to achieve more precise results than achieved by teams in previous years. Pride is displayed with a distinctive T-shirt that identifies them as a member of"Seismotectonic Prognostications, Ltd", and by being a co-author on an abstract or paper. An annual newslecrer assures students that their efforts in yeats past are still being built upon today. Of the approximately 105 UCSB students who have worked on the project in the last 30 years, we can identify more than 70 who have taken advanced degrees in geosciences or medicine; a few have gone into tectonic geodesy as a professional career.
Seismology for Future Decision-makers VAN DER VINK, G.E., IRIS Consortium, Washington, DC 20005 and Department ofGeosciences, Princeton University, Princeton, NJ 08544, [email protected]; and ALLEN, R.M., Department of Geosciences, Princeton University, Princeton, NJ 08544, [email protected]
While only a few students will have careers as professional scientists, essentially every student will be a future consumer of scientific information. To develop scientific literacy, many universities are now developing science courses that are designed for students pursuing careers in fields such as law, business, public policy, and international affairs. Such courses expose students to the nature of scientific information and its use in concert with engineering, economic, political, and social considerations. In addition to the traditional disciplinary material, the courses are designed to have students experience such concepts as valid inference, representative sampling, uncertainty, signal-vs.-noise, and decisionmaking with ambiguous or conflicting data.
Seismology is well suited for such courses because of its application to hazards mitigation and the monitoring of nuclear weapons testing programs. These complex issues are permeated with social, economic, and national security con-
cerns, requiring students to analyze the scientific arguments, evaluate the data upon which they are based, and determine the scientific credibility, political feasibility, and economic consequences of the various options. We will show how traditional seismological exercises can be enhanced into intellectually stimulating exercises for a broad student audience. Examples that have been developed at Princeton University through sponsorship of their Council on Science and Technology will be presented.
Earth Observatories: A Mechanism for Educating Future Scientists and Citizens MELTZER, A.S., and ZEITLER, P.K., Lehigh University, Bethlehem, PA, 18015, USA, [email protected]
At Lehigh University we have established an Earth Observatory, operated largely by undergraduate students with faculty and graduate student mentors. The Observatory provides a unique mechanism to involve a large group of students in research-based, cooperative learning, as well as bring new relevance to material taught in more traditional curricula. Challenging students with the operation of a facility that meets real-world needs, exposes them to a wide range of content, and develops technical, analytical, and communication skills. Comprehensive insight into how earth and environmental systems impact human society requires expertise not only in environmental science and engineering but also in such areas as public policy, sociology, communication, and economics. While attracting students with interests in the earth and the environment, the observatory reaches beyond the traditional bounds of science, drawing students (and faculty) from diverse fields attracting them to participate in observatory activities.
An integral component of the Earth Observatory is a broadband seismic station. We recently installed a Guralp CMG3-T on campus. A 24-bit digitizer and GPS unit are attached to the sensor and data packets are transmitted serially over the campus communication lines in near-real time to the seismology lab. Undergraduate students participated in all aspects of this project, from the initial planning stag through the installation and development phase. Students maintain, operate, and manage the seismic station on a day-to-day basis, analyze earthquake data, and serve as a resource in the Lehigh Valley and Eastern Pennsylvania for information about earthquakes, locally as well as globally. The station contributes data to the Lamont Cooperative Network and the USGS in Golden. Data recorded by the station is used in both introductory and advanced classes. While Earth and Environmental Science majors and minors are clearly well poised to participate in this project, we have brought together students with diverse backgrounds. We have attracted students from a variety of disciplines including: computer science, engineering, graphic arts, English, history, and international business.
Beyond Locating Epicenters: Incorporating Quantitative Seismology in Introductory Geoscience Courses KROEGER, G.C., Department ofGeosciences, Trinity University, San Antonio, TX 78212, USA, [email protected]
Increasingly, college and university curricula are emphasizing the integration of quantitative skills in introductory science courses. Seismology provides numerous examples ideal for meeting these goals in courses intended primarily for non-science majors. Incorporating quantitative seismology in these courses can be difficult, in part due to poor or inaccurate coverage in textbooks, and in part because these courses are usually taught by our colleagues in the geosciences who often have limited experience in seismology.
I will discuss a set of common problems and misconceptions encountered in teaching seismology in introductory courses and some actions the seismological community can take to address these problems and improve the quality of seismology in introductory geoscience courses. I will also present some successful approaches to incorporating quantitative seismology topics in introductory geoscience courses.
Analysis of refraction seismic data has proven an ideal experience for an introductory course. It emphasizes graphical interpretation and provides physical meaning to the quantities of slope and intercept. For more daring students, minimizing travel time with the calculus leads to travel time equations as well as the critical angle. A common problem in teaching refraction seismology is misunderstanding of head wave among geoscientists as well as physicists. The relationship between source-receiver distance and the character of earthquake seismograms is not usually addressed in introductory courses or texts, but is easily taught using web based exercises. Without this understanding, discussion of the differences between Richter and moment magnitude, or the differences between seismograms from earthquake and explosive sources is difficult. Finally, even the principles of tomographic inversion are not beyond the grasp of intro-
Seismological Research Letters Volume 70, Number 2 March/April 1999 249
ductory students when presented in the form of puzzles that they have already encountered.
AN UNDERGRADUATE COURSE IN EARTHQUAKES FOR NONMAJORS YEA TS, ROBERTS., Dcp,. of Gcosctences, Oregon Siate Umver,;11>, Cor.allis, OR 97331, [email protected]
The baccalaureate core curriculum at OSU requires all undergraduates to take a synthesis course relating science, technology, and society. A Geosciences course, Li~ing with Earthquakes in the Pacific Northwest, now in its third year, meets this reqmrement, enrolling> 150 students per class. No previous science course is necessary beyond that required for all students. I begin with geologic time, pla~ tectonics, faults, and . earthquakes, followed by the 3 earthquake environments ID the Northwest: subduction zone, slab, and crustal events. Students learn about tsunamis and the effects of strong ground motion, liquefaction, and landslides. Other topics include probabilistic forecasting, earthquake insurance. retrofits of homes and larger structures, the role of.the federal, state, and local government, including building codes, zoning, and grading ord1Dances, and finally individual earthquake preparation.
I wrote a textbook with the same title (Oregon State University Press, 1998) which includes a glossary or terms, addresses of principal data sources, and earthquake-related websites. I ask each student to write a 5-page term paper using websites as data sources. Although a daunting task for the instructor, it has the satisfaction or getting feedback from the large class. Common term paper topics include: retrofitting your house, a home disaster plan, lesson plans for elementary and middle-school children, tsunami escape routes for those living on the coast, proposed legislation to strengthen the state role ID earthquake preparedness, and models that demonstrate how buildings are damaged by earthquake waves. The K-12 lesson plans are most gratifying because ii ensures that earthquake understanding and preparedness will be taught in schools. The key to the class is presentation in an interesting way, without jargon and equations, so that the public can understand what we do and why it is important.
Technology in Introductory Geophysics: The High-low Mix KLOSKO, E., DELAUGHTER, J., STEIN, S., Department of Geological Sciences, Northwestern University, Evanston, IL 60208, [email protected]
Geophysical concepts are challenging to teach at introductory levels because students need to understand both the underlying physics and its geological application. To address this, we are upgrading an introductory course with a mix of "high" and "low" educational technology. The primary focus is "low" technology, using class demonstrations and experiments to demonstrate underlying physical principles and their geological applications. We integrate these into the course, together with the "high" technology of computer simulations and the vast resources of the World-Wide Web, using a course webpage (http:/ /www.earth.nwu.edu/people/seth/B02). The "high"/"low" mix provides students with different representations of the same concept. We hope that using both methods helps students to better visualize concepts from class. Simulations and demonstrations also serve as a break from a steady diet of equations and make the class more fun for instructors and teaching assistants to teach.
Tuesday P.M., May 4, 1999-Shaw Room Strong Ground Motion: Observing, Predicting, and Engineering Applications III Presiding: Steven Kramer and Kim B. Olsen
1-D and 2-D Analyses of Weak Motion Data in Fraser Delta from 1966 Duvall Earthquake FINN. WD.L., ZHAI, E., THAVARAJ, T., HAO, X.-S. and VENTURA, C.E., Civil Engineering Department, Universiry of British Columbia, Vancouver, B.C. Canada V6T 1Z4
The Geological Survey of Canada (GSC) has been concerned about the potential for large amplification of ground motions due to the soft sediments in the Fraser Delta in South-Western British Columbia. Field studies by the GSC to 1997 revealed a complex buried topography with rapidly varying thicknesses of Holocene and Pleistocene deposits over irregular bedrock. This data caused concern about the applicability of 1-D analysis. Therefore, the GSC commissioned the present study to evaluate the applicabiliry of 1-D analysis in the Delta. The present study is based on soil properties from deep boreholes, extensive geophysical work giving shear wave velocities in the Holocene and Pleistocene sediments, and a good definition of the Holocene/ Pleistocene boundary, and the surface of tertiary bedrock. In the present study, site response analyses were conducted at strong motion stations in the Delta which were triggered during the 1996 Duvall earthquake. Computed and recorded responses were compared to assess whether 1-D analyses are adequate for evaluating potential seismic response in the Delta. A well-defined cross-section of the Delta was also analysed using 2-D models to see what the effects of buried topography may be
and to investigate whether 2-D analysis gives a better definition of site response. This paper focusses on the most important issue for design, how well computed response spectra compare with measured spectra. 1-D response analysis gave a good indication of the period of peak response. Response spectra computed by 1-D analysis did not compare well with recorded spectra except at very deep sites. The use of2-D analyses to include buried topography generally improved the predictions of site response spectra at the shallow sites. However, for the shallow earth sites, the recorded motions showed a strong spectral response at short periods in the range ofO.l s to 0.25 s. Neither 1-D nor 2-D analysis predicted this response.
Investigation of Earthquake Ground Motion Amplification in the Olympia, Washington, Urban Area PALMER. S.P., WALSH, T.J., and GERSTEL, WJ., Washington Department of Natural Resources, Geology and Earth Resources Division, Olympia, WA 98504-7007, [email protected]
We are currently investigating earthquake ground motion amplification in the Olympia, Washington, urban area. The primary goal of this study is to produce an earthquake ground motion hazard map for this part of the Puget Sound region. Our approach is to relate ground motion amplification to the Quaternary and bedrock geology within the study area. Extensive measurements of shear wave velocity performed as part of this investigation allow the assignment of characteristic velocities to the various geologic units. Geotechnical borings, water well logs, and geophysical data are used in conjunction with recent geologic mapping to develop a three-dimensional geologic model for the study area.
The equivalent linear, one-dimensional wave propagation modeling code SHAKE-91 is used to investigate the relation of ground motion amplification to the underlying geology. The characteristic shear wave velocities are combined with the three-dimensional geologic model to develop a suite of soil profiles representative oflocal geologic conditions. Input time histories for the SHAKE-91 modeling are scaled to be consistent with current building code design ground motions and are propagated through this suite of representative soil profiles. Bedrock-to-surface amplification facrors are calculated in spectral bands centered on 1 and 3 Hz and are compared to amplification factors specified in current building design codes. This comparison can be used to establish criteria for delineating areas subject ro elevated earthquake ground shaking.
Results of the SHAKE-91 modeling indicate significant amplification of seismic ground motion where late Pleistocene glaciofluvial and glaciolacustrine sands and silts overlie either older Pleistocene deposits or bedrock. These results are consistent with previously published studies that established a correlation of enhanced modified Mercalli intensities from Puget Sound earthquakes and elevated weak-motion amplification with the outcrop pattern of these late Pleistocene glaciofluvial/lacustrine deposits. The SHAKE-91 modeling shows that the magnitude of the spectral amplification in the 1 and 3 Hz bands is strongly dependent on the thickness of this unit.
Variation in Ground Motion in Greater Vancouver, Canada CASSIDY, T.F., and ROGERS, G.C., Geological Survey of Canada, Pacific Geoscience Centre, P.O. Box 6000, Sidney, BC, V8L 4B2.
Three-component, digital records from strong motion recorders of two recent moderate earthquakes (the 1996 M=5.l Duvall, Washington and the 1997 M=4.3 Georgia Strait) provide new insight into the response to seismic shaking in the greater Vancouver area, particularly on the sofr soils of the Fraser River delta, just to the south of Vancouver. The 1996 earthquake triggered nine instruments and the 1997 earthquake 17 instruments in networks operated by the Geological Survey of Canada and BC Hydro. These suites of accelerograrns have relatively low amplitudes (maximums of 0.015g for the 1996 records and 0.024g for the 1997 records). The 1997 data set is significant as it contains the first three-component recordings made on bedrock in greater Vancouver. Using the method of spectral ratios, we estimate the site response for each of the strong motion instrument soil sites. On the Fraser River delta amplification is observed over a relatively narrow frequency range of 1.5-4 Hz (0.25-0.67 s period), with peak amplification of 4-10 (relative to competent bedrock) for the thick soil delta centre sites, and about 7-11 for the delta edge sites. Relative to firm soil, the peak amplification ranges from 2-5 for the thick soil delta centre sites, and 2-6 for the delta edge sites. At higher frequencies, little or no amplification, and in many cases slight attenuation is observed. The 1996 earthquake (about 170-l 90km distant) presents a simpler and more predictable picture of ground motion variation than the 1997 earthquake (30-50km distant).
250 Seismological Research Letters Volume 70, Number 2 March/April 1999

DETERMINATION OF SITE AMPLIFICATION FACTOR FOR ANCHORAGE, ALASKA, USING SPECTRAL RATIO METHODS
MARTIROSYAN A., DUTTA, U., and BISWAS, N., Geophysical Institute, University of Alaska, Fairbanks, AK 99775, [email protected]; DRAVINSKI, M , University of So. California, Los Angeles, CA 90089; and PAPAGEORGIOU, A., University of New York, Buffalo, NY 14261
Site Amplification Factors (SAF) were determined for 22 sites in Anchorage, Alaska, using IRIS-PASSCAL short-period (4.5Hz) 3-component weak motion sensors and Reftek recorders; the network was operated for about 6 months in 1996. During this period, 114 local earthquakes with magnitudes from ML 1.5 to ML5.5 were recorded with good signal-to-noise ratio. Site responses were estimated using Standard Spectral Ratio (SSR) and Horizontal to Vertical Spectral Ratio (HVSR) methods. We considered the direct S wave packet, including the peak amplitude part in a 20-sec time window for the spectral computations. The spectra were smoothed using a 0.5Hz wide triangular window. The results obtained following the above two methods show good correlation. In most cases the site amplification factors calculated by HVSR method have higher values than those obtained using SSR method, especially for the frequencies greater than 6Hz. Error analysis showed that HVSR method yield more stable results: an average log error for SAF in this case is about 0.09, while for SSR it is about 0.14. In both cases minimal errors for SAF were obtained for the events with focal depths H>50km. Spatial distribution of SAF shows considerable variation. The general pattern for low frequencies (<3Hz) significantly increases for site amplification by factor of 3-4 from the eastern part of Anchorage (Chugach Mountains) to the western part. These results are in good agreement with the available results obtained in the past and the surficial geology of the Anchorage Basin.
Site Response Analysis in the Lanyang Plain from Earthquake and Microtremor Data WEN, K.L., PENG, H.Y., CHANG, C.L., and LIU, L.F., Institute of Earth Sciences, Academia Sinica, Taipei, Taiwan 115, R.O.C., [email protected]
A dense strong motion observation network is operated by Seismological Observation Center of Central Weather Bureau and belongs ro one part of the Taiwan Strong Motion Instrumentation Program (TSMIP). Totally, 66 accelerometers were installed on the free field of the Lanyang plain area. Each station includes one strong motion instrument and a recording room. Strong motion instrument is a force-balance accelerometer, can record the ground motion within plus and minus 2g. It has 16 bits' resolution and has pre-event and postevent memory. Each strong ground motion station has the same design. A small fiberglass house covered on a concrete plate. All stations have AC power. When the power system shutdown by earthquake or other problem, the DC powers of the recording system still can operate about 4 days. This network had recorded several earthquakes. Events triggered more than 20 stations were used ro srudy the characteristics of the site effects on ground motions. Totally, 25 earthquakes are selected during the period from January 1994 to July 1997. One station near the plain boundary was selected as referent site. In this srudy, the characteristics of the soil responses are analyzed by the S-wave spectral ratio on the station pairs of soil and referent sites. At the same time, a non-referent site method was also used to realize the site effects in each station. The results from the S-wave analysis are also compared with that from the microtremor survey.
Application of Site Characterization Studies to Ground Motion Prediction: Analysis of Vertical Array Data from Well Characterized Sites in California STEIDL, J.H., ARCHULETA, R.J., and BONILLA, L.F., Institute for Crustal Studies, UC Santa Barbara, Santa Barbara, CA, 93106, USA, [email protected]
Borehole arrays at well-characterized sites provide new insights and opportunities for understanding the effects of surface geology on seismic ground motions. We present a synopsis of borehole arrays in California where there has been a concerted effort by numerous agencies to expand the number of borehole sensors. We examine the use of geotechnical and geophysical site characterization information for predicting the near surface effects on observed ground motion. The emphasis on characterization of strong motion sites in California provides a wealth of information with which to test our numerical methods for predicting ground motion and site response. Very recently some of these sites also have been instrumented with borehole sensors providing the input motion for testing, validating, and improving our linear and non-linear wave propagation codes. We present ground motion modeling results from well characterized engineering test sites in Southern and Central California, from strong motion sites which have recently been characterized and instrumented with a single downhole sensor in Southern California, and from strong motion sites which been characterized but have no downhole instrumentation. The NEHRP recommendations for seismic regulations put a great deal of emphasis on the aver-
age shear wave velocity in the upper 30 meters to classify sites and to assign site response correction factors. We present results on the analysis of site response using past earthquake observations at strong motion sites that have measured shear-wave velocities in the upper 30 meters. We find that there is little correlation between site response and the average shear-wave velocity in the upper 30 meters for these sites. Large variability in site response from earthquake to earthquake, and from site to site, due to effects from the source and path are the most likely cause for this lack of correlation. This variability and the paucity of near-source large amplitude strong motion data make evaluation of the NEHRP site response correction factors difficult.
SURFACE GROUND MOTION MAPS OF OREGON WANG Yumei, Oregon Department of Geology and Mineral Industries, 800 NE Oregon Street #28, Portland, OR 97232, [email protected] (Sponsor: Zhenming Wang)
Surface ground motion maps of Oregon have been produced using the recently released FEMA HAZUS 97 software. Bedrock ground motions were applied to a soil hazard layer, which depicts soil types from the 1997 Uniform Building Code (UBC) This layer was created using GIS tools by combining the 1 :500,000 digital data of the state surficial geology and agricultural soils maps. The UBC soil types were assigned based on measured and correlated shear wave velocity profile data. Both deterministic and probabilistic earthquake ground motions were calculated. The deterministic study is based on a magnitude 8. 5 event occurring along the Cascadia margin, trending roughly parallel to the Oregon coastline. The probabilistic study is based on bedrock motions developed by the lJ S Geological Survey for a IO % probability of exceedance in 50 years The resulting ground motion maps are displaced using census tract boundaries and include expected peak ground acceleration (PGA), peak ground velocity (PGV), as well as spectral accelerations (Sa), spectral velocities (Sv), and spectral displacements (Sd) for periods of0.3 and I O seconds. The highest PGA values for the M8.5 deterministic and 500-yr probabilistic studies are 0.44 and 0.45g. Map results were applied within HAZUS to estimate regional damage and loss. Expected losses for the M8.5 include almost 8,000 casualties, over 30,000 buildings severely damaged, and over $12 billion in economic losses
Finite Fault Source Inversion Using 3D Green's Functions GRAVES, R.W:, URS Greiner Woodward Clyde, Pasadena, CA, 91101, [email protected]; WALD, D.J., USGS, Pasadena, CA, 91106, [email protected]; KAWASE, H., Kyushu University, Fukuoka, 812-8581, Japan, [email protected]; and SATO, T., Shimizu Corporation, Tokyo 100-0011, Japan, [email protected]
We have developed a methodology to perform finite fault source inversions from strong motion data using Green's functions calculated for a 30 velocity structure. The 30 Green's functions are calculated numerically by inserting body forces at each of the strong motion sites and then recording the resulting tractions along the target fault surface. Using reciprocity, these Green's functions can be recombined to represent the ground motion at the site for any (heterogeneous) slip distribution on the fault. The reciprocal formulation significantly reduces the required number of 30 finite difference computations to just 3*NS, where NS is the number of strong motion sites used in the inversion. We have first validated the numerical procedure using a series of point source experiments with both ID and 30 velocity structures. The results of the 30 reciprocal source inversion technique are in excellent agreement with results calculated for the forward problem using both finite difference and frequency wavenumber methods. As a further test of the inversion procedure, we are now performing controlled experiments utilizing both 10 and 30 inversions for hypothetical rupture models in order to I) analyze the ability of the 30 methodology to resolve tradeoffs between complex source phenomena and 30 path effects, 2) test the adequacy of the 1 D Green's function method when propagation effects are known to be 30, and 3) address the sensitivity of the inversion results to uncertainties in the 30 velocity structure. Analyzing the significance of each of these issues represents an essential step in the validation of rhe 30 inversion methodology, and must be performed prior to undertaking the more complex task of applying the procedure to actual strong motion data.
Differences among Microtremor, Coda, and S-wave Amplifications SATOH, T., Ohsaki Research Institute, Fukoku-seimei Bldg. 2-2-2. Uchisaiwai-cho, Chiyoda-ku, Tokyo, 100-0011, Japan, [email protected]; and KAWASE, H., Department of Urban Design, Planning and Disaster Management, Graduate School of Human-Environment Studies, Kyushu University, 6-10-1, Hakozaki, Higashi-ku, Fukuoka, 812-8581, Japan, [email protected]
We examine the differences of empirical site characteristics among S-wave, Pwave, coda, and microtremors using records at 20 sites in Sendai, Japan and interpret them theoretically. The horizontal to vertical spectral ratios (HIV) for early P coda rapidly deviate from H/V for P-wave and quickly converge to H/V
Seismological Research Letters Volume 70, Number 2 March/April 1999 251

for microtremors at soft soil sites. The H/V for early S coda gradually converge ro HN for late S coda within 15 s after the S-wave arrival and approaches to H/ V for microtremors in the frequency range lower than 3 Hz at soft soil sites. In contrast at one rock and several hard soil sites HN for S coda agree with H/V for S-wave. The soil-to-rock spectral rations for horizontal (H/H) and vertical (VIV) components for early S coda are larger than those for S-wave at soft soil sites. When we use deep underground structures above the bedrock, theoretical H/V for the fundamental mode of Rayleigh wave agrees with HN for microtremors and theoretical HN for an obliquely incident SV-wave agrees well with HN for S-wave. Theoretical S-wave site amplification factor agrees well with H/H for S-wave, bur does not with H/V for microtremors.
Our results indicate that so-called Nakamura's technique based on HN for microtremors is not valid as a method to estimate empirical S-wave site amplification. We conclude that HN for microtremors are useful to estimate the deep S-wave structures if we estimate the structures to fit the peak frequencies of the H/V to theoretical ones for the fundamental mode of Rayleigh wave. Concerning coda we interpret that Rayleigh wave contamination in coda is significant in the frequency range lower than 3 Hz at soft sediment stations. Therefore, at soft sediment stations coda amplification factors cannot be regarded as S-wave amplification factors.
Evaluation and Application of the Horizontal-to-vertical Ratio in Taipei Basin PENG, H.Y., WEN, K.L., Institute of Earth Sciences, Academia Sinica, Taipei, Taiwan 115, R.0.C.,[email protected]; and LIU, H.J., Central Geological Survey, Taipei, Taiwan, R.0.C.
Spectral ratios between soft soil and a referent site are often used to predict the sedimentary site response to earthquake. In this study, we try to compare the horizontal-to-vertical ratio at surface with the spectral ratio of surface to different depth station pairs. The earthquake and microtremor data recorded by the downhole arrays which were installed by Central Geological Survey in Taipei basin are used in this study. By comparing the spectral ratio from microtremor with from earthquake shown that horizontal-co-vertical ratio of the earthquake data could obtain deeper structure response. But the resonance frequency of the first mode from the horizontal-co-vertical ratio of microtremor represents the shallow layer response. Analysis the horizontal-to-vertical ratio of microcremor in whole Taipei basin, we found the response of horizontal-to-vertical ratio are consistant with the shallow soft soil structure of Taipei basin.
Tuesday P.M., May 4, 1999-Rainier Room Posters Seismological Characterization of the Continental Upper Mantle I
Modeling of Teleseismic Waves in Dipping Anisotropic Structures FREDERIKSEN, A.W and BOSTOCK, M.G., Department of Earth and Ocean Sciences, University of British Columbia, Vancouver, B.C., Canada, V6T 1Z4, [email protected]
The existence of seismic discontinuities within the continental upper manrle has long been recognized, with more recent studies often indicating an association with elastic anisotropy. The near vertical sampling of teleseismic P, S, and SKS waves provides a convenient means of characterizing manrle discontinuities, bur computationally efficient methods of calculating synthetic seismograms are required for structures that exhibit lateral variability. We consider mantle lithospheric models consisting of planar, homogeneous anisotropic layers with arbitrary dip. The travel time equation of Diebold ( 1987) for dipping, plane-layered media is adopted as the basis for a high-frequency asymptotic method that does not require ray tracing. Travel times of plane waves in anisotropic media are calculated from simple analytic formulae involving the depths of layers beneath a station and associated vertical components of phase slowness. Amplitudes are computed using the reflection and transmission matrices for planar interfaces separating anisotropic layers. Preliminary results from simple models indicate that upper-mantle seismic responses depend in a complex fashion on both layer dip and anisotropy, particularly in the case of converted phases. This method has been successfully employed to fit Ps conversion data from the Yellowknife array, which show evidence for both dipping and anisotropic layers; applications to Sp and SKS data are also considered.
VSS Analysis of the Transition Zone Thickness beneath Several GDSN Stations Nathan SIMMONS and Harold GURROLA, Department of Geosciences, Texas Tech University, Lubbock, TX 79409-1053, [email protected]
This abstract reports VSS analysis to determine upper manrle velocities and depths to the 410 and 660 km discontinuities (Z4IO and Z660, respectively) beneath a subset of the GDSN stations available through the IRIS DMC. VSS analysis identifies combinations ofVp, Vs, and depth that maximize the stacked amplitudes of Ps phases. The most robust application of VSS is to search for velocity models that maximize the sum of the amplitudes of P4 l Os and P660s. This results in an estimate of transition zone thickness (TZT) that is nearly independent of assumed velocities. Velocities determined by simultaneously stacking P4 l Os and P660s phases are nearly identical to those found for independent VSS analysis of P660s. Estimates of Z4 l O are, however, more strongly correlate with inferred Vp/Vs ratio than do estimates of Z660.
Thermal anomalies computed using VSS estimates of TZT correlate well with those estimated from independently determined transition zone velocity anomalies. We also find that variations in Z660 and TZT are correlated while estimates of Z4 IO and TZT are anticorrelated. This suggests that thermal anomalies may be consistent across the transition zone and that both discontinuities are the result of phase changes. Variations in Z410 and Z660 are, however, anticorrelated at only about half of these stations. This suggests that Z4 l 0 and Z660 can frequently be correlated bur that depth variations in Z660 are larger. The apparent relationship between Z4 l O and the V p/V s ratio suggests that Z4 IO are more closely related to shallower structures than are Z660. We do find a strong correlation between TZT and tectonic province. Most of the stations with TZT less than 240 km are on islands or rifts while stations with TZT greater than 240 km are located near subduction or cratonic regions.
Imaging the Upper Mantle Transition Zone beneath California Using Teleseismic Ps Receiver Functions Nathan SIMMONS and Harold GURROLA, Department of Geosciences, Texas Tech University, Lubbock, TX 79409-1053, [email protected]
We generated a three-dimensional image of the upper mantle beneath Southern California and the surrounding area using receiver functions from 23 G DSN stations available through the IRIS DMC. Some of these stations have been deployed for more than 10 years providing as many as 750 useable receiver functions. As a result we were able to stack more than 4500 receiver functions to produce an image of the upper mantle beneath California, western Arizona and Northern Baja California.
We ray-trace through the IASPI velocity model to place receiver function amplitudes at the expected Ps piercing points. We define the grid as a set of nodal points and use an expanding search radius until a desired number of stations were included in a stack. The smallest bins and greatest resolution is expected beneath regions sampled by the greatest number of stations. Errors due do variations in near surface velocity result in a need for static corrections (which we will be addressing). As a result the most coherent signal was observed in regions sampled with a search radius of more than 0. 5 degrees rather than 0.25. The larger bins are comparable in size co the Fresnel zone at transition zone depths.
The 520 km discontinuity is visible over large portions of the image region with greatest coherence in the southern part of our study area. We are uncertain at this point if the absence of the 520 km discontinuity in the northern part of the array is the result of poor data coverage or an absence of a strong discontinuity. We observe strong P410s and P660s phases that exhibit more than 30 km of topography over regions of less than 2 degrees. The 660 km discontinuity appears to be deepest off the coast of Southern California, thinning abruptly near the shoreline. The 410 km discontinuity appears to dip the most near the California-Arizona border.
Broadband Upper Mantle Structure near the East Pacific Rise MELBOURNE, T.l. Central Washington University Ellensburg, WA 98926-7418 [email protected], HELMBERGER, D.V., California Institute of Technology, Pasadena, CA, 91125 [email protected]
We model whole seismograms containing triplicated S, SS, and SSS to identify systematic variations in upper mantle structure along the East Pacific Rise. The data consists of western North American broadband recordings of transform events which form a continuous record section from 8 to 82 degrees distance. We find no discernible variation in Transition Zone structure over distances of up to $ 1000 Km orthogonal to the ridge axis, which provides an independent verification of previous studies showing that the Rise is not supplied directly
252 Seismological Research Letters Volume 70, Number 2 March/April 1999

with local lower mantle material. In the shallowest mantle, the arrival times of the AB triplication branch constrain the growth rates of the lithospheric high velocity zone, or Lid, with distance from the ridge axis. The Lid evolves away from the Rise as a progressivly thickening layer 3. 5 percent faster in shear velocity than the corresponding velocity of the model TNA, reaching 70 Km in thickness over approximately 400 Km laterally. A much more rapid Lid formation is observed along the western Margin of the North American continent, appearing as a velocity increase of 3. 5 percent over 150 km laterally. For raypaths near the Gulf of California, there is no correlation of the lateral boundaries of this Lid with the Baja California peninsula, indicating that the surface expression of the peninsula is not simply related ro the uppermost mantle velocity immediately below it. The sharp lateral velocity gradient here likely reflects the juxtaposition of the Pacific-Farallon spreading center with the North American plate at the cessation of subduction at 15Ma.
Three Dimensional Structure of the Mantle Transition Zone beneath the Tanzanian Craton and Surrounding Mobile Belts, East Africa OWENS, T.J., Dept. of Geological Sciences, University of South Carolina, Columbia, SC 29208, [email protected], GURROLA, H., Dept. of Geosciences, Texas Tech University, Lubbock, TX 79409, [email protected], NYBLADE, A.A., and LANGSTON, C.A., Dept. ofGeosciences, Penn State University, University Park, PA 16892, [email protected]
We utilize receiver functions calculated from teleseismic P and PP phases recorded during the 1994-95 Tanzania Broadband Seismic Experiment to image the structure of the mantle transition zone in and around the Archean Tanzanian craton. 21 stations were deployed for a period of 12 months in two crossing profiles; an east-west profile from the western rift to the Indian Ocean, and one north east-southeast from the southern end of the eastern rift to the southern end of the western rift. The natural distribution of tele seismic events relative to Tanzania affords us excellent coverage of the transition zone in the eastern part of the craton, the eastern rift and the Indian continental margin. To produce the image, we converted the each receiver function ro a depth function by assigning amplitudes ro the appropriate P-ro-S conversion point utilizing the IASPl91 velocity model. We then use a variable bin-size stacking method to average amplitudes of nearby conversion points. This allows us to ensure uniform sampling in the stack and to examine the effects of bin size, number of stations, and number of events on the stacked images. The resulting images indicate the existence of upper mantle discontinuities at depths of 260, 410, and 670 km. The 260 km discontinuity is deepest beneath the craron. The 410 discontinuity appears ro get deeper beneath the eastern rift. There is also evidence in our highest frequency images that the 410 discontinuity is transitional in nature beneath the eastern rift and sharper on either side. The 670 km discontinuity appears ro have less topographic relief across the region than either the 260 or 410 boundaries. The dear change in the character of the 410 discontinuity as it crosses the eastern rift zone suggests that its transitional nature may be induced by thermal effects or perhaps even material flux across the interface.
Seismic Images of Archean/Proterozoic Differences across the Cheyenne Suture COOK, S.W, DUEKER, K.G., SHEEHAN, AF., Geology Department, University of Colorado, Boulder, CO, 80309.
The Cheyenne Suture is formed by suturing of the Wyoming Archean and Colorado Proterozoic aged provinces. The purpose of this research is to determine if seismically detectable differences exist between these two provinces and what these differences, or lack thereof, tell us about the process of suturing and the tectonic environments that formed the provinces. The natural source component of Deep Probe, an array deployed in 1997 consisting of 88 PASSCAL broad band and short period seismic sites in Colorado, Wyoming and Utah, is used for gathering data across the suture zone. The teleseismic P-wave travel time residuals have been picked using cross-correlation and are inverted to determine the compressional wave velocity structure. On preliminary investigation, the amplitude of teleseismic P-wave residual variations throughout the array is less than one second. Such small variations suggest no fundamental upper mantle velocity difference between the provinces. Similarly, the slope of P-wave residual with respect to offset across the suture is near zero, which also suggests no fundamental seismic difference between the provinces. The lack of major azimuthal variation in teleseismic P-residuals indicates a mostly shallow (crustal) origin for the observed P-residuals. However, there is a trend roward later arrivals at the sourhern stations coming from sourhern earthquake sources. This trend coupled with a reversed effect for northern sources, whose arrival times get earlier for southern stations, indicate modest compressional velocity variations at depth. After inverting for the upper mantle velocity structure, min-
era! physics relations will be used to infer the temperature and composition of the upper mantle.
Western U.S. Mantle Strain Provinces Inferred from S-wave Splitting SCHUTT, D.L., HUMPHREYS, E.D., CROSSWHITE, J.C., Department of Geological Sciences, 1272 University of Oregon, Eugene, OR, 97403-1272, [email protected], and DUEKER, K.G., CIRES, Campus Box 399, University of Colorado at Boulder, Boulder, CO, 80309-0216, [email protected].
Three tectonic provinces lie near the Yellowstone Hotspot: the Yellowstone Swell, deformed by the passage of the hotspot; the extensional Basin and Range; and the Precambrian craton. Of these three provinces, only the Yellowstone Swell produces shear wave splitting measurements that are easily explained. In this region, the fast polarization direction of the SKS phase is nearly constant, and is most reasonably explained by a single layer of anisotropy produced by the simple shear of the Yellowstone Hotspot asthenosphere as the North America plate moves southwesterly with respect to the more stable interior of the Earth.
In contrast, newly analyzed data from two arrays crossing the craton in Wyoming and Colorado, as well is previous studies done on the Colorado Plateau and the Great Basin (Sheehan, et al., 1997; Savage, et al., 1996), show complex anisotropy, and imply that the Swell is a distinct anisotropic province within the western United States. Our new data show fast axis orientation changes with back azimuth at individual stations, and also changes from station to station for a given event. That no obvious strong anisotropic fabric has developed beneath much of western North America, particularly in the Basin and Range where the asthenosphere should be well-developed, suggests that the upper mantle is not deforming in a simple, homogeneous manner.
3-D Velocity Tomography of the Southern Part of Korean Peninsula and Its Vicinity KIM, S.G. and LI, Q., The seismological Institute, Hanyang Univeristy, Ahnsan, Korea 425791 Lanzhou Seismological lnstiture, SSB, Lanzhou, China 730000
Pg, Sg, PmP, SmS, Pn, and Sn arrival times of 44 events with 554 seismic rays are used to invert 6*6*8(0.5deg.*0.5deg.*4km thickness) blocks of the model. We found (1) the average velocity and thickness of the sediment are 5.05 km/s and 3-4 km, and the velocity of the basement is 6.11 km/s, (2) the velocities fluctuate strongly in the upper crust, and those of the lower crust appear horizontal, (3) the average depth and velocity of Moho are 30.4 km, and 8.01 km/ s, ( 4) we also found a low velocity zone near the Kyongju area at a depth of 10-15 km, indicating that it may be related to the Kyongju earthquake source ofJune 25, 1997, (5) the deep faults of oblique reverse-type near the Ulsan area are found at depth of 10-15 km, (6) the density model derived from Bouguer gravity anomalies well accord with the seismic tomography near Kyongju and Ulsan areas.
From 3-D velocity tomography in the upper mantle, the Benioff-Wadati subduction zones are found to dip with abour 30 degree up to 700 km in the east side of the Korean Peninsula. We also note that there are low velocity anomalies in the upper mantle, especially near Mt. Paektu indicating that they may be related to the low velocity bodies of partial melting. 660km and 410km discontinuities appear in the inner continent and near the East Sea(Japan Sea), respectively.
Characterization of the Upper Mantle beneath the Archean Slave Craton Using Teleseismic Methods BANK, C.-G., BOSTOCK, M.G., ELLIS, R.M., Department of Earth and Ocean Sciences, University of British Columbia, Vancouver, BC V6T I Z4, [email protected]; and CASSIDY, J., Pacific Geoscience Center, Geological Survey of Canada, Sidney, BC, [email protected].
A temporary array, consisting of 13 broadband seismic stations, recorded teleseisms between November 1996 and May 1998. This data set has been augmented by recordings from the Yellowknife seismic array.
The objective of our study is to determine upper mantle structure below the Archean Slave craton, site of the oldest known rocks on Earth and numerous diamondiferous kimberlites, and thence to gain an understanding of early crust formation and kimberlite genesis.
Tomographic travel-time inversion indicates variations in P-wave velocity of up to 3%. A high velocity anomaly underlies much of the oldest portion of the Slave craton (the Anton terrane), and extends to near 250 km depth. We interpret this to represent the approximate thickness of the cool subcratonic lithosphere, in agreement with results from magnetotelluric and petrological studies.
Seismological Research Letters Volume 70, Number 2 March/April 1999 253

Low velocities occur along an E-W trending corridor near 65N, and may be associated with kimberlite magmatism in the Lac de Gras area. SKS-spliccing analysis yields moderate delay times {- ls), and fast directions at all stations char are approximately parallel to rhe plate motion of North America. This direction i, oblique to the Rathutsr Fault and MacKenzie dike .swarms. suggesting that neither continental collision to the east nor plume interaction to rhe north has had major effect on the bulk lithospheric fabric beneath the Slave province. A scatter in splitting direction of30 degrees for events from varying azimuths may be due to complex anisotropic stratification known to occur in the mantle beneath Yellowknife. Simultaneous deconvolution of P-coda for receiver functions reveals a Moho depth ranging from 36 to 42km within the Slave craton. P-to-S conversions from the 410 km and 660 km discontinuities can be identified at several stations and where present are $\sim$1 s faster than predicted by 1ASP91. This is in accordance with high absolute velocities generally observed for upper mantle beneath cratons.
Seismic Velocity Structure in Western China from Surface Wave Dispersion* KETTER, B.S., St. Louis Universiry, St. Louis, MO 63103, [email protected]; VELASCO, A.A. and RANDALL, G.E., Los Alamos National Laboratory, Los Alamos, NM 87545, [email protected], [email protected]; and AMMON, C.J., St. Louis University, St. Louis, MO 63103, [email protected].
We examined signals from 26 earthquakes recorded from 1987 to 1996 to investigate the crustal structure of the Tien Shan region in western China. The events were chosen based on the availability of moment-tensor and depth estimates, relative location to the Lop Nor nuclear test site, and signal-to-noise quality. Fundamental-mode Rayleigh and Love waves were analyzed using a phase-matched filtering to isolate the fundamental mode for accurate estimation of surface-wave group velocity. The observations allowed the measurement of group velocities ranging in periods from 8 to 100 seconds. Group velocities range between 2.5 and 3.75 km/sec and show a pronounced Airy phase arriving at about 20 seconds. The observations show strong path dependence where paths crossing the Tarim and Junggar Basins are as much as 0.6 km/sec slower than those that do not cross a basin. Rayleigh-wave group velocities are better constrained than Love waves because of the laterally complex crust rhat may cause scattering of the ray paths. Phase velocities were calculated for the 26 events using the singe-station method assuming source corrections from available moment-tensor and depths estimates. Phase velocities also show considerable path dependence with basin paths being slower and vary between 2.8 and 4.5 km/sec. Comparing group and phase velocities from several events with similar paths confirms these observations. Dispersion measurements are used to invert for one-dimensional velocity structures applicable to propagation paths in the study region. Preliminary results show that a four-layer model can approximate this region with a total crustal thickness between 50-60 km with the crust thickening toward the Tien Shan Mountains. *Sponsored by U.S. Department of Energy, Office of Nonproliferation and National Security, Office of Research and Development, Contract No. W-7405-ENG-36.
Tuesday P.M., May 4, 1999-Rainier Room Posters Pacific Northwest Crustal Structure: SHIPS Results
Structure and Reflectivity of lhe Subducling Juan de Fuca Plate beneath lhe Straits of Juan de Fuca and Northern Olympic Peninsula TREHU, A.M. (Oregon State Un., Corvallis, OR 97331; [email protected]), BROCHER, T.M., FISHER, M.A., PARSONS, T. (U.S. Geological Survey, Menlo Park, CA); HYNDMAN, R.D. (Pacific Geoscience Center, Sydney, BC, Canada); SPENCE, G. (Un. ofVictoria, Victoria, BC, Canada)
We present a crustal transect along the Straits of Juan de Fuca (SJdF) based on multichannel seismic reflection and large-aperture onshore/offshore seismic data collected in March, 1998, as part of SHIPS. The results of conventional multichannel seismic processing, tomographic inversion of large-aperture first arrivals, and inversion of secondary wide-angle reflections interpreted to be from the Moho of the Juan de Fuca place lead to the following conclusions: I) The subducting plate has an apparent dip of 8-10 degrees beneath the western end of the SJdF, similar to the dip observed elsewhere beneath the continental shelf. 2) Apparent dip of che subducting plate decreases to approx. 0 degrees beneath the central part of the SJdF, and comparison to Lithoprobe data sug-
gests that the place arches beneath the Olympic peninsula in response to the bend in the North American plate edge. 3) Apparent dip increases abruptly co >20 degrees east of Port Angeles, consistanc with the SHIPS results beneath Puget Sound; upper plate seismicity increases east of rhis location. 4) The inferred top of rhe crust of the Juan de Fuca plate (assumed to be approx. 6 km above Moho) is correlated with a 5-10 km chick band of high reflectivity beneath the SJdF, which we interpret as a zone of distributed shear corresponding to the NA/J dF plate boundary. This wide zone of reflectivity contrasts with a narrow zone of reflectivity thought to mark the NA/JdF place boundary at similar depth beneath northern CA. These results confirm earlier suggestions that an arch in rhe plate underlies the Olympics. The results also suggest that the depth to the plate boundary may be somewhat shallower than previously thought, based on a comparison with recent Lithoprobe estimates.
Structure beneath Southern Vancouver Island and Juan de Fuca Slrail from Onshore-offshore and Two-ship Wide-angle Seismic Data GRAINDORGE, D. (Observatoire Oceanologique, Villefranche-sur-mer, France), SPENCE, G. (U. ofVictoria, Victoria, BC, Canada, [email protected]), MOSHER, D., HYNDMAN, R. (Geo!. Surv. Canada, Sidney, BC, Canada), CHARVIS, P., COLLOT, J.-Y. {Observatoire Oceanologique, Villefranche-sur-mer, France), TREHU, A. {Oregon State U., Corvallis, OR)
During the 1998 SHIPS (Seismic Hazards Investigations in Puget Sound) experiment, 16 Reftek seismographs deployed in southern Vancouver Island recorded wide-angle arrivals from a large airgun array (capacity either 6730 or 4840 cu. in.) fired along profiles in Juan de Fuca Strait. Several expanding spread profiles (ESPs)about a fixed center point were also acquired in western and eastern Juan de Fuca Strait, by recording the airgun signals on a short streamer behind a second ship. The objectives of this work were to determine the depth of the Eocene-age Crescent terrane as well as the base and/or top of the subducting Juan de Fuca plate. A subset of 6 seismographs along rhe Juan de Fuca Strait was selected for 20 rraveltime inversion using the ray trace method ofZelt and Smith (1992), with additional constraints provided by the ESPs. Strong first arrival p-waves (apparent velocity 6.0-6.5 km/s)were observed out to the maximum offsets of -100 km, and strong converted s-waves (apparent velocity -3.5 km/s) were also recorded; these correspond to turning rays within the accreted Crescent basalts. Prominent secondary p-wave arrivals from an eastward-dipping reflector were observed. These were particularly strong in the central Juan de Fuca Strait, where they extended to vertical incidence times of -7.5 s (22-25 km depth) and where the dip of the reflector is likely very small (<5 degrees). On the ESP profile in the eastern Strait, a strong reflection band occurred at at a time of more than 16 s (-60 km depth). These deep reflections beneath the Strait may represent the base of the crust of the subduccing plate, or they may be related to a shear zone between the subducting and overriding plates similar to the 'E' zone reflector band previously observed on Lithoprobe data.
Crustal Structure beneath Pugel Sound, Washington, from Coincident Seismic Refraction and Reflection Data TEN BRINK. U.S., MOLZER, P.C., U.S. Geological survey, Woods hole Field Center, Woods Hole, MA 02543, [email protected]; FISHER, M.A., BROCHER, T.M. PARSONS, T., U.S. Geological Survey, 345 Middlefield Rd., MS 977, Menlo Park, CA 94025; CROSSON, R.S., CREAGER, K.C., Dept. of Geophysics, Box 351650, University of Washington, Seattle, WA 98195
We present a P-wave velocity model for a 125-km-long profile extending along Puget Sound, Washington, from Whidbey Island in the north, to 25 km south ofTacoma. The data were collected during the 1998 Seismic Hazards Investigation in Puget Sound {SHIPS) experiment. The 4840 cu. in. airgun array of the RIV Thompson firing at 50 m interval along Puget Sound served as a sound source. Six USGS Ocean Bottom Seismometers deployed along the ship's track, 5USGS land seismometers on Whidbey Island and 5 University of Washington seismometers in the Tacoma area recorded the shots. A velocity model was derived using the forward ray tracing model of Zele and Smith (1992) with the interactive RayGui of Loss et al. (1998), and was verified using the non-linear tomographic inversion of Zhang et al. (1998). The velocity model was used for depth migration of a coincident seismic reflection profile, afterwhich the velocity model was plotted in color on the migrated reflection profile for a joint interpretation of the reflection geometry and seismic velocity. Preliminary interpretation suggests that the Seattle Fault, which serves as the southern boundary of the Seattle Basin, is a south-dipping thrust fault extending to a depth of at least 15 km. The velocity model indicates that the upper 4 km sec-
254 Seismological Research Letters Volume 70, Number 2 March/April 1999

tion of the fault wne may be split into several synthetic and antithetic faults over a 10-km-wide zone south of Restoration Point. Strong reflections which separate velocities < 5 km/s from deeper higher velocities probably represent the base of the Seattle basin at a depth of ~ 10 km. The deeper sedimentary and basement units north of the fault may have been dragged upward by fault motion. High-velocity (5-6 km/s) crust almost reaches the surface along the southern half of the profile. Depth to crystalline basement north of the Seattle basin is variable, but is not as great as under the Seattle Basin. The lower part of the crust appears to be laterally homogenous.
30 Reflection Imaging of the Puget Lowlands, Cascadia PRESTON. L.A., Geophysics Program, Box 351650, University of Washington, Seattle, WA, 98195-1650; email: [email protected], CREAGER, K.C., CROSSON, R.S., Geophysics Program, Box 351650, University ofWashington, Seattle, WA, 98195-1650, PRATT, T.L., WEAVER, C., U.S. Geological Survey, PO Box 351650, University ofWashington, Seattle, WA, 98195, FISHER, M.A., PARSONS, T., BROCHER, T.M., U.S. Geological Survey, 345 Middlefield Rd., Menlo Park, CA 94025
The 1998 Seismic Hazards in Puget Sound (SHIPS) experiment used closely spaced airgun sources and uniformly distributed seismometers to gain a better understanding of the crustal structure of the densely populated Puget Sound region, Washington. The Seattle Basin is an area of low-velocity sediments up to 10km thick underlying the metropolitan area and Puget Sound. Evidence for large earthquakes on the Cascadia subduction zone and on regional fault systems underscores the need to know the 3D structure of the Seattle Basin to assess the hazards due to reverberation and seismic focusing. 3D tomography and borehole sonic logs have shown that the compressional-wave velocities within the Seattle Basin are as low as 2-3 km/s. 2D reflection profiles, collected along the waterways of Puget Sound, have provided a high resolution image of the shape of this basin along a north-south section. During the SHIPS experiment, 6500 airgun shots within Lake Washington, Puget Sound, and Hood Canal were recorded at an array of 150 onshore seismometers spaced about 10km apart in the Puget Lowlands. We are using a 3D seismic reflection software package to produce a high resolution image of discontinuities within the Puget Lowlands crust. These low-fold 3D reflection images will improve and extend the lateral and vertical resolution of the Seattle Basin and other crustal features previously studied using 3D seismic tomography and 2D seismic reflection.
A Model for Localization of Selsmicity in the Central Puget Lowland, Washington CROSSON. R.S., Univ. ofWashington, Geophysics Program, Box 351650, Seattle, WA, 98195-1650, USA, [email protected], SYMONS, N.P., Sandia National Laboratory, P.O. Box 5800, MS-0750, Albuquerque, NM, 87111, USA, [email protected].
One of the outstanding problems in Cascadia tectonics is ro understand the mechanism of concentration of diffuse crustal seismicity in the Puget Sound lowland. Crustal imaging through seismic tomography indicates that much of this seismicity occurs within the Siletz/Crescent formation which forms the Tertiary basement complex of the Puget lowland. Recent geodetic measurements combined with mechanical modeling suggests that the Cascadia forearc block from about central Washington south is being loaded into arc-parallel compression, presumably driven by oblique convergence of the North American and Juan de Fuca plates. However, this loading by itself is insufficient to explain the localization of Puget Sound seismicity. The Siletz formation appears to form the relatively strong component of the forearc crust that "transmits" tectonic stress parallel to the arc. Recent seismic imaging results suggest that the Siletz unit has reduced arc-normal cross-section in the vicinity of the Olympic upwarp compared to the region of southwest Washington and western Oregon. This structural feature (embayment) requires that the magnitude of arc-parallel tectonic stress be correspondingly increased within the region of reduced cross-section, giving rise to increased local strain and earthquake generation in the vicinity of the Puget lowland. This model is also consistent with the prevailing P axis orientation for crustal earthquakes in the Puget lowland and vicinity. We estimate the possible tectonic stress enhancement resulting from the Olympic embayment, and suggest that it may either contribute to or be the primary cause of crustal seismicity localization in the Puget lowland.
Optimal Utilization of Suboptimal 30 Wide-angle Data ZELT. C.A., Department of Geology and Geophysics, Rice University, Houston, TX 77251, [email protected].
The acquisition of 3D wide-angle data in land, marine and onshore-offshore settings has become quite popular, for example the SHIPS experiment. It is well known that using reflected arrivals in addition to refracted arrivals provides greater constraint on velocity and interface structure. 3D reflection times are normally used to constrain interface structure, either after the velocity structure above has been determined using refracted arrivals, or by alternating berween solving for velocity and interface depth using refracted and reflected arrivals, respectively. The disadvantages of these approaches are: (1) the reflection data have not been used to help constrain velocity, and (2) a minimum-structure model can only be obtained by minimizing an objective function that measures the refraction and reflection data misfit as well as the structure of velocities and interfaces simultaneously. I present an application of 3D simultaneous seismic refraction and reflection tomography for velocity and interface structure. The inversion technique and method for developing a suitable starting model are specifically designed ro get the most out of relatively sparse wide-angle data acquired across strongly varying earth structure by using prior information and a regularized inversion. The data were recorded in a region of seamount subduction on the central Chilean margin and consist of seven ocean bottom hydrophones and ten intersecting airgun profiles over a 90x90 km area allowing imaging to about 25 km depth. The tomographic method and the final model are assessed through a comparison with the large-scale geologic features of the margin and a checkerboard resolution test. The 3D model shows the Valparaiso forearc basin, the accretionary wedge, the backstop, the subducting oceanic crust and Moho, and possibly the top of a subducted seamount. Our results demonstrate the potential of relatively sparse 3D wide-angle data that may result from instrument failure, poor data recovery, limited resources or site access, or a survey primarily intended to acquire 2D data.
Tectonic Analysis of the Northern Cascadia Subduction Zone in Western Washington State Using Velocity and Deformation Models STANLEY. D., VILLASENOR, A., and BENZ, H., U.S. Geological Survey, Box 25046, MS966, Denver Federal Center, Denver, CO 80225, [email protected]
Three-dimensional P-wave velocity models developed using local earthquake tomography forms the background for an extensive tectonic study of the Cascadia subduction zone in western Washington. Neotectonic behavior was studied using the velocity models and anelastic (creep) deformation models based on thin-plate, finite-element techniques developed by Peter Bird, UCLA. The deformation models predict anelastic strain rate, stress, and velocity for given rheology, crust and lithosphere thickness, heat flow, and elevation inputs. Large faults in western Washington and the main Cascadia subduction thrust were incorporated in the modeling process.
The three-dimensional velocity structure reveals details of an arch in the subducting Juan de Fuca plate previously studied with teleseismic tomography. The axis of the arch is oriented in the direction of current subduction and deformed on the north by contact with a buttress beneath Vancouver Island. Details of the buttress are also mapped in the velocity models. Thick, lowercrustal, mafic rocks in a mantle wedge occur just above the subduction thrust and exhibit a joint deformation pattern with the arch, suggesting strong subduction thrust traction in the Puget Sound region at depths >30 km. Such traction forces are possible if brittle-ductile transition temperatures for mafic rocks on both sides of the thrust are assumed.
The deformation models show that dominant north-south compression in the coast ranges of Washington and Oregon is controlled by a highly mafic crust and low heat flow, allowing efficient transmission of margin-parallel shear from Pacific-North America plate interactions. Northeast principal stress directions from focal mechanism P-axes in the southern Washington Cascades are simulated in the model. Northwest oriented P-axes in the North Cascades and northern Columbia Plateau require a concentration of northwest shear north of the Olympic-Wallowa lineament. The preferred model shows that crustal faults with the greatest horizontal shortening are the Devils Mt. fault (average of 2.2 mm/yr) and east end of the Seattle fault(~ 1mm /yr}. The Devils Mt. fault and Olympic-Wallowa lineament have significant strike-slip motions.
Seismological Research Letters Volume 70, Number 2 March/April 1999 255

Velocity Structure in the State of Washington from Local Earthquake Tomography VILLASENOR, A., STANLEY, D., and BENZ. H., U.S. Geological Survey, Box 25046, MS 966, Denver, CO 80225, [email protected].
We have obtained three-dimensional images of the P- and S-wave velocity strucrure beneath the State of Washington by iterative inversion oflocal-earthquake, first-arrival times recorded by the Pacific-Northwest Seismic Network (PNSN). The results provide detailed constraints on the geometry of the subductingJuan de Fuca plate and the crustal strucrure of western Washington, adding new insights into the region's structural development, tectonics, and deformation.
Between the coast and the Puget Sound region, the Juan de Fuca plate dips 10-12 degrees with the dip increasing sharply to 3 5 degrees beneath Puget Sound. Relocated intra-slab seismicity and the three dimensional velocity structure clearly show an arch on the Juan de Fuca plate beneath the Olympic Mountains and northern Puget Sound, with its axis oriented in the direction of subduction.
In the upper crust, a prominent velocity contrast occurs between the Crescent Formation and the thick, low-velocity accretionary sedimentary rocks in the Olympic Peninsula. Basalts that make up the Crescent Formation encircle the sedimentary rocks and form the backstop required for tectonic thickening. The velocity model also outlines details of a mantle wedge structure above the Juan de Fuca plate, and a buttress in the North Cascades and Vancouver Island that controls north-south compression. In general, relatively slow lower-crustal velocities occur beneath the Cascades and western Columbia Plateau, possibly due to thermal effects and/or a depleted crust.
Tuesday P.M., May 4, 1999-Rainier Room Posters Pacific Northwest Earthquake Hazards
The Seattle Urban Seismic Hazard Mapping Project: A USGS Contribution to Seattle's Project Impact WEAVER, C.S., U.S. Geological Survey, Geophysics Program, Box 351650, U. ofWash., Seattle, WA 98195, [email protected]; TROOST, K.G., BOOTH, D.B., Dept. of Geological Sciences, U. ofWashington, Seattle, WA 98195; FRANKEL, A., U.S. Geological Survey; Denver, CO 80225; WELLS, R.E., U.S. Geological Survey, Menlo Park, CA 94025; MULLEN, J. and NOLAN, T., City of Seattle, Seattle, WA 98121.
The U.S. Geological Survey has selected Seattle, Oakland, and Memphis as three cities for developing "urban seismic hazard maps". In each city; the USGS will support creation of digital geologic maps and geotechnical databases to underpin large-scale seismic hazard maps. Because use of urban seismic hazard maps is not established, the uses is working with local groups to help hone the project goals and products. The USGS picked Seattle in part because the Ciry was also selected by FEMA as one of the seven pilot cities under Project Impact. The urban seismic hazard maps are one USGS commitment to Seattle's Project Impact.
The Seattle seismic hazard mapping project consists of three primary tasks. The first task is to produce a surficial geologic map, a supporting digital geotechnical database, and a 3-D subsurface model. The compiled geotechnical data will be used to revise existing liquefaction susceptibility maps and prepare landslide susceptibility maps for earthquake ground shaking. The second task involves collecting, analyzing, and modeling strong ground motion data; ultimately the modeling will use the new geologic map as a primary constraint. Third, the USGS is using local partnerships and collaborations to assist in developing new products and uses for geologic and seismological data collected under the first two tasks. The USGS is using Seattle's Project Impact as one way of developing the local links needed for this task.
Work on the geologic map began in December 1998, and a technical advisory group has been established to enhance the quality and usefulness of the geotechnical database. Early results of ground motion data show amplification of weak ground motions on soft soils of as much as 5 times that observed on stiff soils or rock. Local discussions have generated interest in possible regularory use of the final maps as well as developing products as business planning tools.
GEOLOGIC/GEOPHYSICAL DATABASE TO CHARACTERIZE SITE RESPONSE IN THE SEATTLE, WASHINGTON, METROPOLITAN AREA WONG. I. G., Seismic Hazards Group. URSG Woodward-Clyde Federal Services, 500 1th Street, Oakland, CA 94607, [email protected]; SPARKS, A. and METCALFE, R., formally at URSG Woodward-Clyde, Seattle, WA 98101; WRIGHT, D.H., URSGWCFS; KA..! p,J"iK! ~ E. STOKOE. K H anC BRO\\':'J", LT, l 1niversity of Texas, Austin, TX 78712: and YOUNT, J.C., U.S. Geological Survey, Denver, CO 80225
As part of the first stage in developing GIS-based ground shaking microzonation maps for the ground surface in the Seattle metropolitan area, we have compiled and augmented a geologic/geophysical database to characterize local site response effects on ground motions. Thus information on the spatial extent and the physical and dynamic properties of both unconsolidated sedimentary and glacial deposits and shallow rock are required to estimate their impact on ground motion. Our efforts consisted of compiling available data and infonnation, performing shallow shear·wave velocity (Vs) measurements, and interpreting the collected data. The surficial geology of the metropolitan area was compiled from USGS and Washington Department of Natural Resources geologic maps and for King County from a digital database. Logs for 694 water wells and 37 geotechnical boreholes generally deeper than 30 m were collected Sixly·two geologic cross·sections interpreted from water well and geotcchnical borehole data by other researchers were also compiled. Vs data from 46 locations principally in the do\\ntown area were also collected. This data included measurements made by the USGS at 13 sites as part ofa site response evaluation (Williams et al., 1999). We augmented the Vs data by pcrfonning measurements at nine sites using the Spectral·Analysis·of.Surface·Waves technique. Targeted geologic units included the Vashon till, Esperance sand, Lawton clay, recessional and advance outwash, and alluvium. We focused our efforts on sites where we could sample units which had a small number of measurements in the existing database. The surficial geology, water well and geotechnical boreholes, geologic cross·sections, and Vs measurement sites are displayed in map form. A second map was developed by combining two USGS depth•to--bedrock maps for the metropolitan area and revising it based on new USGS marine seismic reflection data. Based on the data collected in this study, we intend to define a suite of generalized site categories which will include unit thicknesses, Vs, densities, and straindependent shear modulus reduction and damping curves. Amplification factors for each or these categories will be computed as a function of input rock ground motion levels and will include non·linear effects.
PROBABILISTIC AND EARTHQUAKE SCENARJO GROUND SHAKING MAPS FOR THE PORTLAND, OREGON, METROPOLITAN AREA WONG, I. G .. Seismic Hazards Group, URSG Woodward-Clyde Federal Services. 500 I th Street, Oakland, CA 94607, [email protected]; SILVA, W.J., Pacific Engineering & Analysis, El Cerrito, CA 94530; BOTT, J.D.J .. WRJGHT, D.H., THOMAS, P.A., and SOJOURNER. A., URSG Woodward-Clyde Federal Services; GREGOR, N. J. and LI, S., Pacific Engineering & Analysis; MABEY, M.A., Brigham Young University, Provo, UT 84602
We have developed both probabilistic and earthquake scenario ground shaking maps for the Portland, Oregon metropolitan area. A total of 12 maps have been produced including scenario maps for a M" 9 event on the Cascadia subduction zone and a crustal earthquake of Mv 6.8 on the Portland Hills fault zone and probabilistic maps for return periods of 500 and 2.500 years. The GIS·based maps display peak horizontal acceleration and 0.2 and LO sec spectral accelerations at the ground surface.
Seismic sources characterized for the probabilistic analysis included theCascadia megathrust and intraplate zone, 38 crustal faults within the Portland Basin and adjacent regions, three zones of localized crustal seismicity (e.g., St. Helens zone), and five regional crustal source zones in southwestern Washington and northwestern Oregon (see Wong et al., this volume). In addition to the areal source zones, Gaussian smoothing of the historical seismicity was also performed to account for the hazard from non·unifonn background seismicity. The most significant contributors to the hazard in Portland are the Cascadia megathrust, Portland Hills and Oatfield faults, and the non•unifonn background seismicity.
The maps incorporate (I) the effects of the near.surface geology based on downhole geologic and sht:ar-wave velocity data collected by the Oregon Department of Geology and Mineral Industries and (2) region-specific characteristics of seismic attenuation in both the crust and the Cascadia subduction zone. Stochastic numerical ground motion modeling was used to develop region-specific attenuation relationships for both crustal and Cascadia megathrust earthquakes as well as nonlinear site amplification factors. We used the stochastic attenuation relationships together with recent empirical attenuation relationships to compute the earthquake scenario and probabilistic ground motions. Based on our characterization of seismic sources, path and site effects, ground motions were computed for grid points at about I km spacing and then colorcontourcd. The highest scenario ground motions are from the Portland Hills fault M..v 6.8 earthquake with peak horizontal accelerations up to I g. The 500· and 2500-year probabilistic maps display peak accelerations up to about 0.3 and 0.8 g. respectively.
Lithology and Sile Response in Eugene/Springfield, Oregon PERRY. S.C. and WELDON, R.J. II, Department of Geological Sciences, University of Oregon, Eugene, Oregon, 97403, [email protected], [email protected].
We have made empirical measurements of ground motion in Eugene/Springfield, Oregon to quantify the contributions ro site response of alluvium thickness, soil type and other lithologic parameters. The study area, at the southern end of the Willamette Valley, is simple geologically bur complex geometrically, with a few Quaternary alluvial units filling troughs up to 120 m deep. We deployed 10 broadband and short period seismometers on the valley Boor, and installed a reference site on dacitic basement, ro record moderate earthquakes at regional distances. Shaking ratios were measured from Fourier spectra in velocity and pseudo-acceleration domains. Due to the size and distance of our earthquakes, most of our input energy lies between 2-4 Hz. Yet some sites show significant response above 4 Hz, with shaking up ro 4 times that at our reference site. There are clear differences in overall spectral signal between alluvium and rock sites, bur our shaking ratios have only weak statistical correlation with alluvium thickness. The ratios approximately double per 30 m increase in alluvium
256 Seismological Research Letters Volume 70, Number 2 March/April 1999

thickness. When we group our shaking ratios according to Uniform Building Code (UBC) soil types, there is little or no statistical significance to the groupings, with one notable exception. The youngest sediments (designated UBC category 5£), consistently shake less than better indurated units. The UBC overpredicts response in these young deposits by about one UBC category. We infer rhat this occurs because the youngest sediments are very coarse river gravels. We speculate that locally thick clays within alluvial deposits, deeply weathered bedrock, and bedrock ropography cause most of the variability we have measured.
Reducing Earthquake Losses in the Pacific Northwest-A USGS National Earthquake Hazard Reduction Program Internet Home Page at http:// geohazards.cr.usgs.gov/pacnw/ RHEA, Susan, and COX, Jonathon (USGS, Box 25046, MS 966, Denver, CO 80225, USA, email: [email protected])
This Web page supports USGS project scientists and assists others in finding information about and contacts for earthquake hazards research in the Pacific Northwest. USGS project tasks are designed to increase understanding of the earthquake hazards in the Pacific Northwest, improve awareness among businesses and individuals of earthquake hazard risk, and to develop information used to mitigate losses experienced in a earthquake. This web page is linked to online reports and data for research on a variety of subjects, for example active faults in the Puget Sound, paleoseismology, subduction zone dynamics, earthquake site response, real-time strong motion instrumentation, and seismic hazard maps. For example, the site includes reports of paleoseismology investigations in the Puget Lowland using a dynamic interactive map, preliminaty interpretations of active tectonics in the eastern Strait of Juan de Fuca region, P- and S- wave velocity information from the Seattle uplift and Seattle basin, and extensive information on dynamics of the subduction zone. Links are provided to related web pages, such as the Pacific Northwest Seismic Network, Urban Corridor Hazards, tsunami hazard information, Cascadia Region Earthquake Workgroup, SHIPS, volcano seismicity, and FEMA project IMPACT. A directory of Puget Lowland investigators is provided to encourage communication among interested workers.
Site Response in West Seattle, Washington CARVER. David, HARTZELL, Stephen, FRANKEL, Arthur, CRAN SWICK, Edward, U.S. Geological Survey, MS 966, Denver Fed. Ctr., Denver, CO 80225, [email protected], and NORRIS, Robert, U.S. Geological Survey, Seattle, WA98195
The largest recorded earthquakes in the Puget Sound area occurred in 1949 (mb 7.1) and 1965 (mb 6.5). Although the 1949 event occurred near Olympia and the 1965 event was 25 km south of Seattle, both earthquakes caused widespread damage in Seattle. For both earthquakes, the worst damage (Modified Mercalli VIII) was at Harbor Island and West Seattle. Harbor Island is man-made fill, so the high intensities are easily explained, but the high intensities in West Seattle are more difficult to explain. Frankel and others (in press) found amplifications of 3.5 to 5 at 2.5 to 4 Hz. This high site response agrees with the intensities bur cannot be easily explained by the surficial geology. Complicating the situation is the south-dipping Seattle thrust fault that strikes east-west under the northern end of the peninsula with the sediment-filled Seattle basin north of the fault. The large phases observed in West Seattle may be incident S-waves converted to surface waves at the edge of the sedimentary basin.
We deployed seismographs to help explain the West Seattle damage. Six were installed in a 2.2 km long north-south line with 440 m spacing. A tripartite array with 150 m spacing was located with its center 440 m east of the midpoint of the north-south line. The array recorded 47 pops of the SHIPS air gun as the ship passed around the West Seattle peninsula from the south into Elliot Bay. The ship's motion provided us with records from sources over a 180-degree azimuth range. The array also recorded a magnitude 3.1 ML earthquake near Bremerton. We used all of these records in a linear inversion for source and siteresponse spectra constraining site response at the rock site on Alki Point to be approximately 1.0. We calculated site response as a function of back-azimuth to the soutce. Preliminary results show greater amplification of ground motion for sources to the north.
S-wave Velocities for Specific Near-surface Deposits in Seattle, Washington WILLIAMS. R.A., STEPHENSON, WJ., ODUM, J.K., and WORLEY, D.M., U.S. Geological Survey, Geologic Hazards Team, DFC MS966, Box 25046, Denver, CO 80225, [email protected]
We determined the compressional- and shear-wave velocities (Vp and Vs) to about 40-m depth at 25 locations in the Seattle urban area from high-resolution P- and S-wave seismic-refraction and reflection data. Seventeen sites were located where portable digital seismographs recently recorded earthquakes or airgun shots from the 1998 SHIPS experiment. A 3.6-kg sledgehammer source was used to generate linear, reversed seismic profiles up to 177-m in length at each site. The profiles consisted of30 vertical (8 Hz) and 60 horizontal (4.5 Hz) sensors spaced at 3 and 1.5-m intervals, respectively. These data identify distinct Vs for near-surface deposits in Seattle including the Pleistocene Lawton Clay (300-400 mis), Esperance Sand (~400 mis), and Vashon Till (600-900 mis), and help explain the observed variation in earthquake ground motion (site response). From our measurements, we have determined that a near-surface Vs inversion will exist in areas where Vashon Till overlies Esperance Sand and Lawton Clay. The association of a distinct Vs with specific surficial deposits will allow extrapolation of site response to areas not measured for Vs. Sites with the lowest measured Vs correlate with highest ground motion amplification in the 1-10 Hz frequency band, relative to a reference rock site. These sites, such as at Harbor Island and in the industrial area south of the Kingdome, are located on artificial fill and have an average Vs in the upper 30 m of 150-170 mis. Such low S-wave velocities classify these sites as NEHRP soil profile type E (average Vs less than 180 mis). The Vs of the Blakely Formation bedrock sandstone is much higher in the upper 30 min West Seattle at Alki Point (abour 1200 mis) than at Seward Park (about 500 mis). This velocity structure would produce a higher impedance contrast between bedrock and the overlying Pleistocene deposits in West Seattle than in the vicinity of Seward Park and may help explain part of the increased site response observed in West Seattle during earthquakes.
SIMULATION OF A M6.5 EARTHQUAKE ON THE SEATTLE FAULT USING 3D FINITE-DIFFERENCE MODELING
STEPHENSON W J , and A.D. FRANKEL U.S. Geological Survey, Geologic Hazards Team, Box 25046, MS 966, Denver, CO 80225. [email protected], [email protected]
Three-dimensional finite-difference model simulations of a moderate-sized (M 6.5) thrustfaulting eanhquake on the Seattle fault suggest several surface effects across the Seattle Basin. The model area includes the cities of Seattle, Bremerton and Bellevue. For these simulations, we use a recently developed detailed 3D velocity model of the Seattle Basin that was developed from: (l) data compiled on depth-to-the-base of Quaternary (S. Johnson. USGS); (2) depth to basement from gravity inversion (R. Blakely, USGS); (3) limited borehole velocity information (T. Brocher. USGS); and (4) near-surface P- and S-velocity measurements (R. Williams, USGS). The model used in these simulations extended to 20-km depth and assumed rupture on a finite fault with random slip distribution. Preliminary results from simulations of frequencies 0.5 Hz and lower suggest amplification can occur at the surface of the Seattle Basin because energy becomes trapped in the Quaternary sediments. Surface waves generated within the basin appear to contribute to amplification throughout the modeled region. Several factors apparently contribute to large ground motions in downtown Seattle: (1) directivity from the ruptuie; (2) amplification and resonance within the Quaternary sediments; and (3) energy focussed by velocity gradients within the Seattle Basin.
MODELING OBSERVED GROUND MOTIONS IN SEA TILE USING THREE-DIMENSIONAL SIMULA TIO NS FRANKEL A.D. and STEPHENSON, W.J. U.S. Geological Survey, Geologic Hazards Team, MS 966, Bo• 25046, DFC. Denver, CO 80225, [email protected], [email protected] In order to reliably predict strong giound motions from future large earthquakes, it is first necessary to accurately model observed seismograms. We model seismograms recorded on an array of digital seismographs deployed by the USGS in Seattle. We use a 3D model of the velocity structure of the region and a velocity.stress finite.difference program. We modeled waveforms from the Bremerton mainshock (ML 4.9) and aftershocks of June 1997 and the February 1997 south Seattle earthquake (ML 3.7). We generally find good agreement between the peak amplitude and duration of the synthetics and observed waveforms for frequencies of 0.5 Hz and lower, the frequency limit for the 3D synthetics. The waveforms of the Bremerton mainshock and aftershocks are dominated by surface waves in this frequency range. Aftershocks at depths of less than 2 km show prolonged surface wave arrivals whose durations are similar to those of the simulations. Sites on artificial fill have similar waveforms in this frequency band to nearby sites on stiff soil, indicating that they have similar S-wave velocity structure at depths below about 30m. At higher frequencies (> 1 Hz), resonances are often observed at sites where artificial fill overlies stiff glacial deposits. We model these resonances using horizontal layers. One site in West Seattle exhibits a large phase after the S-wave for several of the Bremerton aftershocks. This phase appears to be generated by the edge of the Seattle Basin.
Seismological Research Letters Volume 70, Number 2 March/April 1999 257

Tuesday P.M., May 4, 1999-Rainier Room Posters Advances in Seismic Wave Propagation Theory and Modeling I
Elastic Wave Radiation from a Line Source of Finite Length ALDRIDGE, D.F., Geophysical Technology Department, Sandia National Laboratories, Albuquerque, New Mexico, 87185-0750, [email protected].
Straightforward algebraic expressions describing the elastic wavefield produced by a line source of finite length are derived in circular cylindrical coordinates. The surrounding elastic medium is assumed to be both homogeneous and isotropic, and the source stress distribution is considered axisymmetric. The timeand space-domain formulae are accurate at all distances and directions from the source; no far-field or long-wavelength assumptions are adopted for the derivation. The mathematics yield a unified treatment of three different types of sources: an axial torque, an axial force, and a radial pressure. The torque source radiates only azimuthally polarized shear waves, whereas force and pressure sources generate simultaneous compressional and shear radiation polarized in planes containing the line source. The formulae reduce to more familiar expressions in the two limiting cases where the length of the line source approaches zero and infinity. Far-field approxmimations to the exact equations indicate that waves radiated parallel to the line source axis are attenuated relative to those radiated normal to the axis. The attenuation is more severe for higher frequencies and for lower wavespeeds. Hence, shear waves are affected more than compressional waves. This frequency- and direction-dependent attenuation is characterized by an extremely simple mathematical formula, and is readily apparent in example synthetic seismograms.
The theory leads to improved understanding of (i) radiation patterns of borehole seismic energy sources, (ii) elastic waves produced by long cylindrical explosive charges used for seismic prospecting, and (iii) far-field waves generated by explosively-loaded elongated cavities or tunnels. Previous numerical computations of elastic radiation produced by nuclear explosions within elongated axisymmetric cavities are consistent with the present theoretical predictions.
Work supported by US DOE under contract DE-AC04-94AL85000. SNL is operated forDOE by Sandia Corporation, a Lockheed-Martin company.
On Evaluation of 3D Green's Functions for Anisotropic Media DRAVINSKI, M., and ZHENG, T., Department of Aerospace and Mechanical Engineering, University of Southern California, Los Angeles, CA 90089-1453
A new method for numerical evaluation of 3D time-harmonic Green's functions for nonisotropic media is proposed. The key feature of the meathod is that by dealing with entire elastodynamic state vector repeated evaluation of the common parts of the integrands can be avoided. This results in a more efficient algorithm when compared to standard sequantial integrands evaluations. Consequently, this approach may be useful in numerical modeling of scattering of elastic waves in anisotropic media.
A Mode Coupling Mechanism for Scattering of Quasi-Love and QuasiRayleigh Waves in Heterogeneous Anisotropic Media SOUKUP, D.T., Geophysics Program University of Washington, Seattle, WA 98195-1650, [email protected]; ODOM, R.I., Applied Physics Laboratory University of Washington, Seattle, WA 98195, [email protected]; and PARK, Jeffrey, Department of Geology and Geophysics Yale University, New Haven, CT 06520-8109, [email protected]
We apply a local mode analysis ro laterally heterogeneous layered anisotropic media. The velocity model can accommodate thickness variations in fluid and solid layers, and hexagonally symmetric anisotropy with arbitrary symmetry direction in the solid layers. We focus on the scattering of anisotropic elastic modes enhanced by the presence of lateral heterogeneity. We examine the energy distribution between neighboring modes of the same wave type, as well as between quasi-Love (qL) and quasi-Rayleigh (qR) modes. Rayleigh and Love waves propagate independently in TI media. The energy redistribution is limited to modes of the same wave type (Love or Rayleigh), and remains dominated by nearest neighbor interactions. Tilting the symmetry axis within the xz-plane retains the decoupled propagation of the Rayleigh and Love modes. Using the formalism of Maupin(l 988) and the Bond transformation for the matrix repre-
sentation of elastic moduli, we investigate the rotation of the symmetry axis out of the xz-plane. Dispersion curves of phase velocity vs. symmetry axis angle reveal strong coupling occurs when phase velocities are closely matched. The coupling becomes induced by any lateral heterogeneities within the medium. We classify a mode that begins as a Rayleigh mode in the TI medium as a qR mode, and a qL mode begrns as a Love mode in the TI case on the dispers10n curve. The qR mode eigenfunctions gain y-displacement and the qL modes gain x, z-displacement as the energy redistributes. The combination of lateral heterogeneity and anisotropy appears to be effective at scattering a signal, and energy is redistributed broadly among all of the propagating modes. Therefore scattering under anisotropic conditions differs greatly from isotropic or TI conditions. The distortion of the local stress-strain relation induced by a tilted axis of symmetry causes strong mode conversion.
The Stochastic Crust and Its Seismic Response LEVANDER, A., LA FLAME, L.M., ZELT, C.A., and HENSTOCK, T.J., Geology and Geophysics Department, Rice University, Houston, Texas, 77005, [email protected].
Geologically and petrophysically the crystalline crust is heterogeneous at all scales relevant to crustal seismic exploration. The complexity of geologic exposures is matched by the complexity of crustal reflection data. The range of scales in crustal structure suggests that the seismic reflection image is a band limited representation of the broader bandwidth heterogeneity spectrum of the crust. We relate the crustal heterogeneity spectrum to the seismic reflection spectrum using a statistical approach, and using the crustal exposures as constraints for seismic models. Statistical analysis of many geologic maps of crystalline exposures shows that they are self-affine, with the 2-D autocorrelation function describing the 2-D spatial fabric. For seismic wave propagation, the other important statistical measure is the seismic velocity probability density function. Over the set of maps that we have examined, the pdfs show considerable variation from binary (two distinct velocities), to quasi-Gaussian (normal continuous velocity variation). Seismic response is a predictable result of the scale parameters of the fabric function, the velocity pdf, and the seismic acquisition parameters. Measurement of the statistical parameters allows us to classify the crust according to wave propagation regime, and to assess the use of different common seismic imaging methods. The statistical model allows us to pose the inverse problem to estimate the stochastic parameters from seismic data. At present we can estimate the fractal dimension and the lateral scale parameter directly from exploration data. The vertical scale parameter is difficult to estimate due to the typically limited seismic bandwidth and unknown seismic wavelet. Full waveform finite-difference synthetic seismograms of both crustal reflection and refraction data from a number of locations (Basin and Range, northern and southern California, offshore southwest Britain) for which we have developed stochastic models reproduce most measurable quantities in the wavefield: travel-times, relative amplitudes of phases, reflection density, and lateral correlation properties.
Anomalous Phases in the Records of Alaskan Subduction Zone Earthquakes: Observations and Modeling RATCHKOVSKY, N.A. and HANSEN, R.A., Geophysical Institute, University of Alaska, Fairbanks, Fairbanks, AK 99775-7320, [email protected]; and ORREY, J.L., Oja Solutions, 2888 Bluff, Suite 400, Boulder, CO 80301, [email protected]
Records of subduction zone Alaskan earthquakes are analyzed to identify anomalous phases. We use data recorded by four short-period seismic arrays located in the Interior Alaska. Three arrays are 5-element and one is a 20-element array with one 3-component seismometer. Frequency-wavenumber (FK) analysis is applied ro identify apparent velocities and back azimuths of the coherent arrivals. Back azimuths of the first arrival are compared to the AEIC (Alaska Earthquake Information Center) hypocenter locations.
We observe two prominent anomalous arrivals in the earthquake records. The first phase arrives with a 1-2 s delay after the first P-wave arrival and has higher apparent velocity and larger amplitude than the first arrival. This phase is observed at all four arrays. The second phase arrives with a 8-12 s delay, has lower apparent velocity and lower frequency content than the first P-wave arrival. This phase is not observed at the array closest to the slab. We exam the following possible explanations for the occurrence of these phases: (1) conversion/refraction at crustal discontinuities; (2) complexity of the source; (3) conversion/refraction at boundaries near the source; (4) wide-angle reflection/ refraction off the upper surface of the slab; (5) dispersion.
Based on apparent phase velocity and variations in back azimuths, we interpret the earlier phase as a wide-angle reflection off the upper surface of the slab.
258 Seismological Research Letters Volume 70, Number 2 March/April 1999

The later phase may be a P-to-S conversion at a crustal discontinuity, possibly the Moho. 3-D ray tracing failed to provide meaningful results for interpretation of the observed phases and showed poor convergence for the Alaskan subduction zone velocity model and given location of the sources and receivers. A 3-D generalized Fourier pseudospectral method is being used to simulate the wave-field from the earthqualte sources in the slab and to identify propagation paths of the anomalous phases.
Modeling Surface Topography in Seismic Wave Field Methods with Application to the Generalized Fourier Method ORREY, J.L., Ojo Solutions, Boulder, CO, 80301, [email protected]
We have developed and implemented a method of incorporating surface topography into numerical methods of seismic wave propagation. The method allows for arbitrary, smooth topography of both the free surface and internal layers. le is based on the methods of Fornberg (1988) for internal boundaries and Tessmer, Kosloff and Behle (1992) for free surface topography. Topography is included by applying a coordinate transformation to an otherwise regular Cartesian computational grid to generate irregular interfaces. It can be used to model free surface and internal interface topography as well as for optimizing sampling of a wave field in regions where fine scale sampling is required for accuracy( e.g. low velocity zones ) .
The topography scheme is applied to a new pseudospectral method of wave field computation, the Generalized Fourier Method. This method was initially formulated in Cartesian coordinates, and therefore admits material discontinuities only on coordinate planes chat traverse a rectangular volume. Irregular interfaces are incorporated by applying a coordinate transformation chat maps the irregular interfaces in the physical space into coordinate planes in a Cartesian computational space. Quantities in the computational space are related to their associated quantities in the physical space by an inverse transformation. We incorporate a mapping between Cartesian and general curvilinear coordinates by transforming the equations for momentum conservation from the physical space into the computational space for solution. The method has been tested with comparisons to analytic solutions for a planar free surface interface and for improving the accuracy of reflections from internal interfaces. We discuss how the method can be readily applied to other numerical wave propagation methods.
Elastic Coarse-graining of Memory Variables: Memory Efficient Q Simulation for Finite Difference Methods. BRADLEY, C.R., Los Alamos Seismic Research Center, LANL, Los Alamos, NM 87545, [email protected], DAY, S.M., Department of Geological Sciences, San Diego State University, San Diego, CA 92182, [email protected]
Increases in our ability to simulate elastic ground motion over relevant bandwidths for calculating damage to structures from earthqualtes, regional to teleseismic propagation effects and exploration seismology problems have forced us to consider anelastic losses. Current finite difference methods of anelastic wave propagation require several memory variables for each stress component at each node in order to simulate constant Q wave propagation over a wide computational bandwidth. This requirement prohibits anelastic simulation oflarge scale problems.
We present here the results of extending the coarse-graining theory of Day, 1998, to fully elastic three dimensional finite difference wave propagation modeling. The method requires only a single memory variable for each stress component at each node reducing the 3D memory requirements by a factor of 8.
Broadband plane wave simulation tests are run for a number of different Q simulations and compared with analytical results. Finally, a test of "Lamb's Problem" is shown for a large scale problem (23 million nodes) and compared with reflectivity and Cagniard de Hoop methods. This generalization of Day's acoustic coarse-graining theory to elastic modeling agrees to within a few percent of the analytic methods. Future extension of chis method will include specific declaration of frequency dependent Q by optimizing the weighting scheme of the relaxation times.
High Frequency Waveform Inversion for Velocity and Attenuation Structure KEERS, Henk, VASCO, Don, and JOHNSON, Lane, Center for Computational Seismology, Lawrence Berkeley Laboratory, University of California, Berkeley, CA 94720
Seismic waveforms are inverted using an asymptotic method. The model parameters are both the acoustic velocity and Q The asymptotic method cakes nonstationary raypachs into account when computing the waveforms, and thus
is an extension of Geometrical Ray Theory. The inclusion of Q prohibits the application of the Chapman-Maslov integration technique. Instead the frequency integral is evaluated first and numerically. The difference in computation time however is negligible. We compute the partial deriviatives of the data with respect to the model parameters. As expected these partial derivatives (or sensitivity functions) are concentrated along, but not confined to, raypaths. Using the sensitivity functions the waveforms are inverted. The inversion is applied to a synthetic crosswell experiment and a laboratory crosswell experiment. The synthetic model shows the advantages of che waveform inversion method over conventional travelcime inversion methods. Boundaries of anomalies are better defined and smearing is reduced. The waveform inversion gives a much better misfit reduction than the traveltimes inversion. The goal of the laboratory crosswell experiment was the detection of a non-aqueous phase liquid (NAPL) in water saturated sand. Using the waveform inversion method low velocity anomalies were imaged chat correlate well with pose-experiment determination of NAPL concentrations. It turns out chat the inclusion of Q in reducing the misfit between data and synthetics.
Three Dimensional Distribution of Scattering Strength Determined from Inversion of Seismic Coda CHEN, X.Q. and LONG, L.T., School of Earth and Atmospheric Sciences, Georgia Institute of Technology, Aclanta, GA 30332-0340, [email protected].
A coda-envelope-inversion technique is developed and used to image the threedimensional distribution of scattering strength in the vicinity of the Norris Lake Community, GA, earthqualte swarm of 1993. An approximation to a damped least squares inverse solution was found by using the Algebraic reconstruction Technique (ART), which works well for both underdecermined and overdetermined problems. Although the inversion model is based on a single scattering coda model, it can be used to characterize the scattering potential when multiple scattering makes significant contribution to the generation of coda. A codaenvelope inversion applied to the Norris Laite Communiry earthquake swarm indicates chat the spacial distribution of scattering potential is considerably nonuniform. The laterally inhomogeneous distribution of scattering potential was principally at depths shallower than 3 km, and the strong scattering zones identified at these shallow depths are highly correlated with the earchqualte hypocenters and changes in topographic relief. Moreover, the scattering potential at shallow depths shows sttong frequency dependence: the scattering potential at higher frequencies is stronger than chat at lower frequencies. Ac about 7 km in depth, a strong reflecting layer was identified which corresponds to the base of the overchrust cruse also identified is COCO RP reflection data. The inhomogeneous distribution of scattering strength obtained in chis study argues strongly against the observation-based assumption chat scatterers are uniformly distributed in the crust. This non-uniform distribution of scatterers may cause the details in the coda decay and, consequencly, the determination of coda Q co depend strongly on small changes in the hypocenter rather than on temporal changes in the surrounding materials.
Wednesday A.M., May 5, 1999-0lympic Room Seismological Characterization of the Continental Upper Mantle II Presiding: Michael Bostock and Ken Dueker
Small-scale Anisotropic Heterogeneity in the Continental Upper Mantle JORDAN, T.H., SALTZER, R.L., Department of Earth, Atmospheric and Planetary Sciences, MIT, Cambridge, MA 02139, GAHERTY, J.B., School of Earth and Atmospheric Sciences, Georgia Institute of Technology, Aclanra, GA 30332
Various seismological observations (as well as geological intuition) suggest chat the continental upper mancle is anisotropic and heterogeneous across a broad range of spatial scales. This heterogeneity is now being imaged at horizontal resolutions down to a few hundred kilometers by tomographic techniques. While heterogeneities of smaller dimensions are difficult to map deterministically, they can be represented stochastically. We have formulated stochastic models that specify the small-scale heterogeneity of the upper mancle as samples of a random field of fourth-order elasciciry censors with local hexagonal symmetry. The random field has a characteristic horizontal wavenumber (assumed to be independent of azimuth), a characteristic vertical wavenumber, a parameter specifying the distribution of the anisotropy symmetry axis in the vertical plane, and a
Seismological Research Letters Volume 70, Number 2 March/April 1999 259

self-affine scaling at high wavenumbers specified by a fractal dimension. We have used comparisons between model predictions of effective wave velocities and several types of seismic data to constrain the stochastic parameters. In particular, we note that in regions such as Australia and southern Africa, the splitting of vertically propagating shear waves is often weaker than the splitting of horizontally propagating shear waves. We speculate that this behavior may be caused by anisotropic structures in which the vertical correlation lengths are significantly smaller than the horizontal correlation lengths. This type of laminated anisotropic strucrure appears to be consistent with other seismological observations, such as the shingling of first arrivals in long-range refraction profiles and the anomalously high velocities observed for short-period Sn waves.
Splitting and Relative Delays of Teleseismic Shear Waves in Northeastern U.S. LEVIN, V, Dept. of Geology and Geophysics, Yale University, New Haven, CT, 06520, [email protected]; MENKE, W, LDEO, Palisades, NY, 10964, [email protected]; PARK, J., Dept. of Geology and Geophysics, Yale University, New Haven, CT, 06520, [email protected].
Competing explanations for the origin of seismic anisotropy in stable continental regions are a fabric "frozen" within the lithosphere, and a fabric imposed by active deformation processes. Shear-wave splitting observations throughout the Northeastern US suggest that both mechanisms contribute to the signal. Fastaxis direction measured from SKS, SKKS and PKS waves varies systematicaly with event back-azimuth. The pattern is similar at all sites examined, and suggests a two-layer system with sub-horizontal anisotropic symmetry axes pointing west (top) and northeast (bottom). By contrast, relative S-wave travel time delays vary over 100-km distances in the region, and roughly correlate with tectonics. The most robust feature is a slow anomaly beneath the region of exposed Grenvillian basement-the Adirondack Mountains. At most sites there is no apparent relationship between shear-wave splitting and relative travel time delay. Clearly, these findings favor the active deformation mechanism for seismic anisotropy. However, two depth regions with strongly distinct deformation directions need to be present under the srudy area to fit the variation of splitting with back azimuth. Moreover, the details of the back-azimuth splitting pattern vary with tectonic region, most clearly between the Adirondack sites and those in western New York and Pennsylvania, both atop the Grenvillian basement. Also, relative S-delays at these groups of stations display some dependence on the event back-azimuth and source distance. This behavior favors the "frozen fabric" hypothesis, although variations are not large. Northeastern US anisotropy may have a dynamically-generated asthenospheric anisotropy source beneath a frozen tectosphere fabric. The near uniformity of the tectosphere anisotropy may stem from repeated east-west collision and rifting events over 2 successive Wilson cycles.
Downward Continuation of Teleseismic Wavefields and Anisotropic Lithospheric Stratigraphy al Stations of the Canadian National Seismograph Network BOSTOCK. M.G., Department of Earth and Ocean Sciences, University of British Columbia, Vancouver, BC, V6T 1Z4, Canada, [email protected]
A comprehensive dataset of teleseismic P-waveforms from the Canadian National Seismic Network (CNSN) has been assembled to examine shallow upper mantle structure beneath a variety of tectonic environments which constitute the Canadian landmass. Waveforms are grouped in bins of back azimuth and epicentral distance which represent approximately constant intervals in differential P-slowness below the shallow, receiver-side upper mantle. Seismograms within individual bins are wavefield decomposed and simultaneously deconvolved to estimate the S-wave contribution to the Earth's early impulse response. The resulting record sections reveal a lithospheric mantle characterized by a well-developed, anisotropic stratigraphy. Precambrian terrains, in particular, show evidence for near-horizontal layering within the top 100 km of mantle that may be attributed to the presence of shallowly subducted oceanic lithosphere. Younger regions exhibit a similar layering but with more obvious expression oflateral heterogeneity.
The near-horizontal layering observed at a number of CNSN stations prompts investigation into the potential of 1-D direct waveform inversion for the retrieval of anisotropic, elastic parameters as a function of depth within the lithosphere. The proposed inversion scheme involves examination of the upward-propagating wavefield at its first instant of motion to extract information on local elastic parameters. This information may then be used to iteratively downward continue the wavefield and deduce elastic parameters at deeper
levels. Unlike classical layer stripping procedures (e.g. Bube and Burridge, 1983) which reconstruct acoustic impedances from estimates of the reflection coefficient, implementation in the teleseismic case involves inversion of the relative amplitudes of transmitted upgoing P and S-wave components. In isotropic media rhi.,;; infnrmarinn j,;; prnvided rhrn11gh ::m:1Jy,;;i,;; of particle motion~ in the sagittal plane, with a sensitivity primarily to variations in shear modulus. The anisotropic case is more complex, however, and requires fitting of both radial and transverse wave vectors to transmission coefficient surfaces as functions of the (2-component) horizontal slowness vector. Examples of synthetic and real data inversions will be presented.
Seismic Reflection and Refraction Imaging of the Upper Mantle: Examples from Canada's Lithoprobe Project RON M. CLOWES (Li tho probe and Department of Earth & Ocean Sciences, Universiry of British Columbia, 6339 Stores Road, Vancouver, BC, V6T 1Z4, Canada, [email protected]), with contributions from many other Lithoprobe seismologists
Lithoprobe, Canada's multidisciplinary, geoscience research project, was established to develop a comprehensive understanding of the evolution of the northern North American continent. Lithoprobe's 10 transects (study areas) span the country and 4 Ga of geological time. Seismic reflection and refraction/wideangle reflection (R/WAR) srudies are primary scientific components and have included imaging of the sub-crustal lithosphere. Here, we illustrate results and their significance from 3 transects. In N Quebec, the Archean Abitibi greenstone belt is bounded to the north by the Opatica plutonic belt. A reflection profile across the region shows N-dipping reflections extending from the Moho to ~ 70 km depth. Interpreted as remnant oceanic crust or delaminated Abitibi lower crust thrust beneath Opatica crust, the results provide direct evidence for modern-style tectonic processes being active in the Late Archean. In central Canada, the Paleoproterozoic Trans-Hudson Orogen is the 400-km-wide collisional zone between the Archean Superior and Hearne cratons. R/WAR data recorded along N-S and E-W profiles show prominent phases at offsets greater than 450 km, which are interpreted as representing imbricated sequences of peridotite and eclogite at depths of75-160 km. This and other unusual mantle features may be the result oflithospheric convergence of bounding cratons and closure of the intervening ocean basin. In the SW Northwest Territories, the Archean Slave craton is bounded to the west by the Paleoproterozoic Wopmay Orogen, comprising a series ofN-S trending domains. Reflection and R/WAR data recorded along a 750 km profile across the region illustrate delamination of the lower crust of the western domain and shallow eastward thrusting of that crust laterally for at least 150 km to depths of 90 km. Subhorizontal layering at depths of 70-80 km extends for 300 km below the eastern domain and Slave craton. Wide-angle reflections at offsets of 300 to 700 km, when normal-moveout-corrected to vertical incidence, image the same subhorizontal layers. These may represent deformation in the upper mantle resulting from lithospheric collision of the eastern Wopmay Orogen with the western Slave craron.
New Results on Upper Mantle Structure at Collision Zones from Seismic P to S Converted Waves KIND, R., YUAN, X., SOBOLEV, S., LI, X. and GOSSLER, J. GeoForschungsZentrum Potsdam 14473 Potsdam, Germany, kind@gfz.potsdam.de
P to S converted teleseismic waves underneath seismic stations are used since a long time to image discontinuities of physical parameters in the crust and upper mantle. Such images provide important information about geological processes. This technique resembles closely the steep angle reflection technique in applied seismics. If data from networks of broadband stations are available, we can use methods from applied seismics like moveout corrections or migration to produce Migrated Receiver Function (MRF) images from the crust to the mantle transition zone. We apply this technique to image collision and subduction processes in Tibet, the Andes, the north-west Pacific subduction zone and the Tornquist-Teisseyre Zone in northern Europe. Many new details about the ongoing geological processes in these structures are obtained. In Tibet we see north- and south-dipping lithospheric mantle detachments down to 250 km, in the Andes we see the oceanic slab only partly converted to eclogit down to 120 km, in the Andean crust we see a 350 km long west-dipping boundary possibly marking the top of the underthrusted South American crust, in Central JapanChina we see the subducted Pacific slab continuing through the upper mantle transition zone down to about 900 km depth (in contrast to most tomographic images), in northern Europe we locate the intracrustal boundary between phanerozoic and paleozoic Europe directly at the Tornquist Zone.
260 Seismological Research Letters Volume 70, Number 2 March/April 1999

Inherited Structure and Mass Balance in the Archean and Proterozoic Lithosphere of Western North America: The 1995 Deep Probe Experiment LEVANDER, A., and HENSTOCK, T.J., Geology and Geophysics Department, Rice University, Houston, TX 77005, [email protected]; CLOWES, R.M., and GORMAN, A.R., University of British Columbia, Vancouver, BC V6TlZ4, [email protected]; KELLER, G.R., and SNELSON, C.M., University ofTexas at El Paso, El Paso, TX 79968, [email protected];
The 1995 Deep Probe active source seismic experiment conducted by Lithoprobe and several US universities extended along a N-S line from southern New Mexico to Great Slave Lake. We have produced a 2600-km-long velocity model showing large-scale crustal and upper mantle structure from the Colorado Plateau to the Hearne Province.
We have identified 3 distinct crustal structures along the profile, with the crustal structure transitions at Archean and Proterozoic aged sutures rather than physiographic boundaries. The Archean Hearne province crust in Alberta is 35-40km thick with a simple vertical velocity gradient. The Archean Wyoming province crust is 50-55km thick with the lowermost 25km consisting of a distinct high velocity layer (7.0-7.3km/s). The Proterozoic accreted terranes of the Colorado Plateau have a crustal thickness of 40-45km, and can be described using a simple vertical velocity gradient.
A major change in upper mantle strucrure occurs near the boundary between Archean and Proterozoic crust in southern Wyoming. The Proterozoic Colorado Plateau crust is underlain by mantle with seismic velocities of 7.9-8.0km/s and a P-wave low velocity zone centered at 75km depth that is 45km thick. In contrast, the Archean terranes are underlain by mantle that is typically faster (8. l-8.2km/s), and has a strong positive velocity gradient. Full wavefield finite-difference modeling shows that the transition between these two upper mantle structures is the less than 150km wide.
Although the provinces along the profile have had geologic histories with different degrees and expressions of deformation, present crust and mantle strucrure still correlates with initial continental assembly. Despite 1.5km of elevation difference and 20km of crustal thickness variation, the entire region is isostatically compensated within the uppermost mantle, probably as shallowly as 55km depth, supporting the isopycnic hypothesis.
New Seismic Images of the Western U.S. from Crust to 660 km DUEKER, K.G., Univ. of Colorado, Boulder, Co. 80309, [email protected]
New results from the recent natural source Deep Probe and Ladore seismic deployments constrain variations in the lithospheric structure between the Archean Wyoming and Proterozoic Colorado provinces. Common conversion point stacking of converted S-waves reveals that a surprisingly large amount of topography is present on the Moho, 410 and 660 km discontinuities. Yet, variations in teleseismic P-time residuals are relatively small and clearly show that no large mantle velocity difference exist between the two different provinces. Thus, while it is true that many ancient sutures do manifest sharp variations in lithospheric velocities; nonetheless, this suture does not. Furthermore, two recent surface wave images of this region confirm that the Wyoming and Colorado Provinces are not underlain by high velocity (i.e., cratonic) mantle, but low velocity mantle. We suspect that a long history of subduction volitalization beneath this circum-cratonic region along with late-Cenozoic upwelling of warm mantle is responsible for both the low upper mantle velocities and the eradication of any step in mancle velocities between these two provinces. The case for active upwelling of heat beneath this region derives from a new tomographic teleseismic P-time image of the western US down to a depth of 660 km. This image show that profound low velocity features observed in the upper 200 km, in some cases, do root down into the transition zone. Given that two recent global images both show low velocity material in the uppermost lower mancle beneath the western US, we suggest that warm currents are moving heat from lower to upper mantle beneath the western US. Thus, our emerging view is chat the late Cenozoic tectonics of the western US is a complex system: resulting from the interplay of plate forces, lithospheric potential energy variations, and active mancle upwelling.
Teleseismic Investigation of the Yellowstone Swell: A Summary of Results HUMPHREYS, E.D., 1272 University of Oregon, Eugene, OR, 97403-1272, [email protected]; DUEKER, K.G., CIRES, Campus Box 399, University of Colorado at Boulder, [email protected]; SCHUTT, D.L., University of Oregon, [email protected]; SALTZER, R.L., MIT, [email protected]; PENG, X., University of Oregon.
The PASSCAL teleseismic investigation across eastern Idaho resolves the crust and mantle structure left in the wake of the Yellowstone hotspot. The seismic array occupied about 55 sites arranged in a line array trending SE for 550 km, crossing the entire Yellowstone swell and, co the SE, slightly beyond into SW Wyoming. From receiver function studies, we image a simple crust away from the hotspot track (the eastern Snake River Plain, SRP). The SRP is underlain by a "basalt sill" previously imaged by Sparlin et al., which extends up to a depth of 10 km. The Moho, which is relatively Bae at about 40 km depth across the entire swell, deepens abruptly to about 50 km beneath the SW Wyoming Rocky Mountains. Isostatic calculations imply that the generally high topography across the swell is maintained by a very buoyant mantle, and that the SRP is held low by the dense basalt sill.
Elevation of the SW Wyoming Rocky Mountains result from a 50 km-thick crust and a relatively dense mantle. Tomography images a mantle that is very slow to P and S waves only beneath the SRP, with low velocities extending depths of more than 160 km. These low velocities and a corresponding high Vp/Vs indicate that partial melt is the primary origin of the velocity depression. The only reasonable explanation for the buoyant but relatively high velocity mantle beneath the swell away from the SRP is that this mantle is both hot and depleted of basalt. We interpret chis mantle to be the mancle residuum of Yellowstone magmatism.SKS splits indicate a remarkably consistent SW fast-axis orientation, interpreted to result from North America motion over a simply straining Yellowstone asthenosphere. SKS arrivals SE of the swell have relatively small split times and are erratic in orientation, as is typical of most of the western U.S. away from the Yellowstone swell.
EVIDENCE FOR A MANTLE PLUME IN EAST AFRICA FROM THE TANZANIA BROADBAND SEISMIC EXPERIMENT J\IYBLADE A.A and LANGSTON, CA., Dept. ofGeosciences, Penn State University, University Park. PA 16802, [email protected]; OWENS, Tl, Dept. of Geological Sciences. University of South Carolina. Columbia, SC, 29208; GURROLA, H. Dept of Geosciences. Texas Tech University, Lubbock, TX 79409; RJTSEMA. J . Seismological I.ab. Caltech. Pasadena, CA 91 125
Data from the Tanzania broadband seismic experiment, which recorded local, regional and telese1smic earthquakes across East Africa for one year ( 1994-1995) using 20 stations, provide compelling new evidence for a mantle plume beneath the Eastern Branch of the East African Rift System in Tanzania. The tectonic framework of East Africa is comprised of an Archean craton surrounded by Proterozoic mobile belts that have been disrupted by the two branches (Western and Eastern) of the Cenozoic East African Rift System. The Eastern Branch terminates in an area of incipient rifting in northeastern Tanzania characterized by a wide zone of block faulting, volcanism, and seismicity extending some 200-300 km east to west across the Mozambique Belt. Travel time analyses of Pn and Sn phases from regional events yield fast uppermost mantle velocities beneath the craton and rifted mobile belt, indicating that the uppermost mantle beneath the incipient rift is undisturbed. However, tomographic images obtained by inverting teleseismic P and S wave travel time residuals show anomalously slow (i.e., warm) mantle structure beneath the incipient rift at depths between I 00-500 km The depth extent of the warmer mantle is supported by receiver function analysis of Ps converted phases from the 410 and 660 km discontinuities which suggest that the 4 l O km discontinuity is depressed beneath the incipient rift in northeastern Tanzania. The existence of warmer mantle material extending from the transition zone to a depth of about I 00 km beneath an incipient rift is consistent with the presence of a mantle plume and cannot be easily reconciled with passive rift models.
Seismic Structure and Tectonics of Southern Africa: Progress Report SILVER, P.G., Carnegie Institution of Washington, DTM, Washington D.C., 20015, USA, [email protected], GAO, S.S., Arizona State University, Tempe, AZ, 85287, JAMES, D.E. Carnegie Institution ofWashington, DTM, Washington D.C., 20015, USA. [email protected], KAAPVAAL SEISMIC GROUP, http://mantle.ciw.edu/kaapvaal
The Southern African Seismic Experiment (SASE), designed to sample the crust and mantle beneath southern Africa, consists of nearly 80 recording sites and spans a 2000km northeast-southwest section that extends from Capetown to Zimbabwe. The experiment is part of a multidisciplinary research project by the CIW, MIT, and several southern African institutions. Results to date suggest that upper mantle structure is closely related to geologic structures at the surface. Body and surface-wave tomography reveal a high velocity mantle root beneath the Kaapvaal craton that extends ro at least 200km depth. Shear wave splitting in SKS is observed at most of about 80 sites, indicative of deformationinduced anisotropy within the upper mantle. The orientation of the fast polar-
Seismological Research Letters Volume 70, Number 2 March/April 1999 261

ization directions show significant lateral variations that closely follow the orientation of the ancient surface geologic deformation and appears to represent Archean mantle deformation. Both mantle velocity and the magnitude of mantle anisotropy are reduced beneath the 2Ga Bushveld layered igneous intrusion, suey:esting that this igneous event has perturbed mantle structure.
There are significant variations in crustal thickness beneath the array, with the thickest crust (about 40km) in the northern Kaapvaal and Limpopo regions. Comparison with surface topography suggests that high elevations are not isostatically compensated by thickened crust. The compensation may be deeper in the mantle or dynamic.
Concerning deeper structure, non-linear stacking of about 1000 receiver functions finds clear P-ro-S conversions from transition zone discontinuities (400 and 660km). There are apparent lateral variations in both discontinuities, but these may be due ro unmodeled upper mantle heterogeneity. Transition zone thickness averages about 255km with no resolvable lateral variations.
The Upper Mantle beneath Australia: Results from the SKIPPY Seismometry Project Rob D. VAN DER HILST, Frederik J. SIMONS, andAlet ZIELHUIS, Earth, Atmospheric and Planetary Sciences, Rm 54-514, Massachusetts Institute of Technology Cambridge, MA 02139, [email protected]
Global seismological models and tectonic regionalizations suggest a positive correlation between the thickness of the high wavespeed continental 'tecrosphere' and the age of the overlying crust. In general, however, significant crustal variations occur at length scales that have not (yet) been not resoled by global inversions, and it is unclear how these relate ro the seismic signature of the "tectosphere".
Australia is well suited ro address this issue: it is favorably located with respect to zones of active seismicity, which provide ample sources so that a variety of seismic imaging techniques can be used, and the geological makeup of the continent is varied: lithosphere stabilization ages range from Archaean to Phanerozoic.
This situation is exploited by the Australian SKIPPY project, which involved the deployment of 6 temporary arrays of up ro 12 broad-band instruments. In addition ro the permanent observatories in the region (IRIS, GEOSCOPE, and AGSO) the continent-wide array thus synthesized produced a very dense spatial and spectral data coverage.
We present our latest model of 30 variations of shear waves peed in the Australian upper mantle, obtained with Partitioned Waveform Inversion. PWI uses path-averaged velocity profiles (obtained by fitting waveforms) in a tomographic inversion. We used both the fundamental and the higher modes of Rayleigh waves of nearly 1600 source-receiver combinations. The lateral resolution is better than 250 km in central and eastern Australia, and the higher modes provide good sensitivity throughout the upper mantle and the transition zone.
At long wavelengths, the velocity anomalies corroborate the patterns deduced from global models. Until 150 km depth, wave speed deviations vary in agreement with the surface pattern of lithospheric formation ages, i.e., fast wave propagation in the Precambrian and slow in the Phanerozoic. However, there are notable deviations from this general pattern and, in particular, there are variations on smaller scales that suggest a complex relation between lithospheric thickness and crustal age.
Some Proterozoic subregions are marked by velocity highs to depths exceeding 300 km. Surprisingly, the Archaean units do not seem to penetrate that far down: beneath 250 km depth, the wave speeds are, in fact, rather similar ro the average wavespeeds beneath the Phanerozoic. The eastern edge of the Proterozoic craron, cannot be associated unequivocally with a contrast in seismic properties, and ro depths of about 150 km high wavespeeds continue well east of the Tasman line.
We present the robust features of the model and discuss their implications for the presence and evolution of the continental 'tectosphere'.
Structure of the Lithosphere beneath the Siberian Shield PRIESTLEY, K., and McKENZIE, 0., Bullard Laboratories, University of Cambridge, Cambridge, CB3 OEZ, UK, [email protected], [email protected]. uk
We have developed a one dimensional model for the lithosphere beneath the Siberian shield which is constrained by both seismic and petrological data. The velocity model of the crust is constrained by seismic refraction results and by receiver function modeling. The mantle velocity model is constrained by the inversion of fundamental mode surface waves phase velocit~es and the modeling of multimode surface waveforms from regional distance range earthquakes. The low frequency (100-200 mHz) Rayleigh wave phase velocities measured for the
Siberian shield are similar ro those reported by Brune and Dorman (1963) for the Canadian shield and marginally faster than that measured for the shield in southern Africa. Below the -45 km thick crust of the Siberian shield there is a -150 km thick upper mantle lid. The P- and S-wave velocities at the top of the lid are 8. 10 and 4 65 km/s. respectively. and the velocity gradients in the lid are -0.00ls-1 and positive. Below the lid there is a moderate shear wave low velocity zone, with the shear wave velocity dropping from -4.80 km/sat the bottom of the lid ro -4.45 km/sat 270 km depth. We have combined the geothermometer and geobarometer results for the upper mantle nodules from the Udachnya kimberlites with rhermal models of the lithosphere ro obtain the thickness of the mechanical and thermal boundary layers beneath the Siberian shield. This gives a 199 km thick mechanical boundary layer, similar ro the thickness of the seismic lithosphere, a 38 km thick thermal boundary layer, a 220 km thick thermal lithosphere, and a mantle heat flow of 20 mW/m-2
•
Wednesday A.M., May 5, 1999-Lopez Room Advances in Seismic Wave Propagation Theory and Modeling II Presiding: Robert Odom and Margaret Hellweg
Generalized Screen Propagators and One-return Approximation for Seismic Wave Modeling and Imaging WU, R.S_., Modeling and Imaging Laboratory, Institute ofTectonics, University of California, Santa Cruz, CA 95064, [email protected]
One return approximation is a first order approximation of the generalized Bremmer series for wave propagation in heterogeneous media. The approximation is a multiple-forward-single-backward scattering (MFSB) approximation first introduced by De Wolf (1971) by neglecting the reverberations between heterogeneities. Generalized screen propagator (GSP) is introduced (Wu, 1994) to extend the applicability of the traditional phase screen propagator to wideangle waves for one-way propagation or one-return modeling. The difference of GSP from the traditional phase screen propagaror (split-step Fourier method) is the extra operation in wavenumber domain to correct the phase error for largeangle waves. The GSP method is several orders of magnitude faster than finitedifference methods with a similar accuracy for certain problems due to the fast dual domain implementarion using FFT. Successful applications of GSP methods include subsurface seismic imaging (depth migration), elastic wave synthetic seismograms, and Lg propagation and scattering in complex crustal waveguides. Because its efficiency, the GSP method is especially useful for large scope, long range wave propagation simulation in random media to study the influences of random heterogeneities to waveform, energy flow and attenuation, and mode coupling. In the talk, a summary of theory, methods and recent progress will be given with examples from various applications.
Mixture Theories for Anisotropic Poroelasticity with Application to Estimating Effects of Partial Mell on Seismic Velocities BERRYMAN, J.G., and BERGE, P.A., Lawrence Livermore National Laboratory, Livermore, CA 94550, [email protected], [email protected].
Mixture theories for rocks can be applied to seismic velocity data to estimate parameters such as amount of partial melt present in a low velocity zone, crack or fracture concentration in regions where such weak zones lower velocities, and porosity in sedimentary rocks. Mixture theories relate properties of solid and fluid constituents to overall properties of heterogeneous rock. Such methods developed in geophysics mainly in the petroleum industry and have been most commonly applied ro active-source seismic data. Nevertheless, mixture theories are potentially powerful tools for interpreting earthquake data. Potential applications include understanding magma source regions, estimating the amount of partial melt present in the mantle (e.g., Anderson, 1970), characterizing geothermal fields, and investigating evolution of porosity for accretionary prisms in subduction zones.
Two very important results commonly used in rock analysis are due ro Eshelby (195 7) and Gassmann ( 195 1). Eshelby showed that che strain inside an ellipsoidal elastic inclusion embedded in an otherwise homogeneous elastic medium is uniform if a uniform external strain is applied to the host medium. Eshelby shows further how ro compute this uniform inclusion strain based on knowledge of properties of the host and inclusion. This result is very powerful, since it permits us to construct simple algebraic expressions that capture most of the behavior of constituents in composite elastic media. On the other hand, Gassmann's relation is often used to relate velocities in dry poroelastic rock to
262 Seismological Research Letters Volume 70, Number 2 March/April 1999

saturated rock velocities. Many earthquake seismology applications require considering earth materials to be both anisotropic and poroelastic. The work to be presented shows how to combine Eshelby's results with Gassmann's results to produce useful formulas for analysis of velocities in partially melted rock.
This work was performed under the auspices of the US Department of Energy by the Lawrence Livermore National Laboratory under contract No. W-7405-ENG-48 and supported specifically by the Geosciences Research Program of the DOE Office of Energy Research within the Office of Basic Energy Sciences, Division of Engineering and Geosciences.
Lattice BGK Method for Modeling Acoustic Wave Propagation in Strongly Heterogeneous Viscous Media HUANG, L.-J., and PEHLER, M.C., Los Alamos Seismic Research Center, Los Alamos National Laboratory, Los Alamos, NM 87545, USA, [email protected], [email protected]; and HE, X., Complex Systems, Group T-13, Theoretical Division, Los Alamos National Laboratory, Los Alamos, NM 87545, USA, xyh@t!3.lan1.gov.
The commonly used finite-difference solutions to the wave equation have difficulty simulating wave propagation in strongly heterogeneous media such as those with strong-contrast inclusions or cavities, and those with large surface topography. Some other numerical methods such as the discrete wavenumber and boundary integral methods may be able to simulate waves in such media, but they have limitations on the sizes and shapes of heterogeneities. We have recently developed a lattice Boltzmann-based method with the FHP-I (FrischHasslacher-Pomeau-I} collision operator for ·modeling acoustic wave propagation in strongly heterogeneous media (Huang and Mora, 1994a, b: GJI, vol.117, p529-538; vol.119, p766-778). The method termed the phononic lattice solid by interpolation (PLSI) simulates the microscopic physical processes of wave propagation including transportation, reflection/transmission, and collision processes of quasi-particles carrying wavefields. We have demonstrated that the method can accurately simulate wave propagation in strongly heterogeneous media (Huang and Pehler, 1998, AGU Fall Meeting). However, the computation of the FHP collision processes is time-consuming, particularly in 30 cases. To improve the computational efficiency, we adopt in this study the Bhatnager-Gross-Krook (BGK) single relaxation collision operator to replace the FHP-I operator in the PLSI method. Preliminary studies using the lattice BGK-based (LBGK) method show that the relaxation time due to collision must be larger than 0.55 and less than 3.33 to to ensure an isotropic wavefront (the viscosity is zero when the relaxation time is equal to 0.5). We numerically demonstrate that the LBGK method is capable of accurately simulating wave propagation in strongly heterogeneous viscous media.
Polarization of Volcanic Tremor: Source or Medium? HELLWEG, M., Institut fur Geophysik, Universitat Stuttgart, RichardWagner-Str. 44, D-70184 Stuttgart, Germany, I 12052.3440@ compuserve.com
Unlike earthquakes and explosions, the source of volcanic tremor is continuously active for long periods of time. While signal polarization is often used in earthquake seismology to determine the wavetype and the direction to the source, its interpretation is more difficult for volcanic tremor recordings. These recordings are often the product of a narrowband wavefield propagating through the heterogeneous volcanic edifice. While the polarization of narrowband tremor may be due to complicated source mechanisms or an extended source, simple models for scattering, superposition and surface reflection can qualitatively explain its complexity. If the source is impulsive, propagation through a three-dimensional acoustic model of random scatterers reproduces the well-known shape of volcanic shocks and local earthquakes, with the density of the scatterers controlling the length and the relative amplitude of the coda. While the polarization of the initial arrivals depends only on the direction between the source and the receiver, the polarization of the coda is random and changes for each realization of the medium. Continuous narrowband signals, simulated by a sine wave, produce a transient following the first arrival, during which the scattering space is filled by waves. When the scattering space has been saturated, the polarization at the receiver remains constant, but apparently unrelated to the source-receiver direction. Small changes in the frequency or location of the source may cause large changes in the polarization. For a wavefield such as that generated by harmonic tremor, both the polarization and
amplitude of the individual spectral lines depend strongly on their frequency. Similarly, superposition of continuous, narrowband P- and S-waves or the effects of reflection at the receiver produce an initial transient and then a constant wavefield polarization with little relationship to the source-receiver direction. The polarization of continuous, narrowband signals tell more about the medium than the source.
Spectral Mode Diffusion in Heterogeneous Media ODOM, R.I., Applied Physice Laborarory and Geophysics Program, University ofWashington, 1013 NE 40th Street, Seattle, WA, 98105, [email protected]
A seismic signal propagating in a heterogeneous surface crustal waveguide is scattered and attenuated as a result of interaction with medium heterogeneities. An initial signal consisting of a few modes will spread in time linearly with propagation distance as energy is redistributed among available modes due ro mode coupling. Over longer propagation distances in a random waveguide, modal energy reaches equilibrium, and the average modal energy becomes constant. (The modes are of course subject to geometric spreading, intrinsic attenuation and radiation losses, but it is assumed that all modes ate equally affected so that, locally, the energy per mode is a constant.) Energy propagates at a velocity that is an average of the group velocities for individual modes. The pulse width grows mores slowly now as thesquare root of the propagation distance, rather than linearly. This transition to square root broadening in randomly perturbed multi-mode fiber optic waveguides is well known and observed. Employing a diffusion equation for the modal energy in an elastic waveguide with random fluctuations, heterogeneity induced pulse broadening is investigated.
Seismic Waves Converted from Velocity Gradient Anomalies in Earth's Upper Mantle BOSTOCK. M.G., Department of Earth and Ocean Sciences, University of British Columbia, Vancouver, BC V6T JZ4, Canada, [email protected]
Modelling of elastic wave propagation in one-dimensional (1-0) structures is frequently performed using reflectivity techniques in which the Earth's velocity profile is approximated by stacks of homogeneous layers. The complete reflection/transmission (R/T) response of a zone with arbitrary 1-D depth variation (including both gradients and discontinuities in material properties) can, however, be calculated using invariant imbedding techniques. Results from an earlier study (Tromp and Snieder, 1989) are here extended to derive exact expressions for R/T matrices in arbitrary, 1-D anisotropic media using a form of Born approximation valid for thin scatterers and which does not assume small perturbations in material properties. The R/T matrices are solutions to a system of non-linear, ordinary differential equations of Ricatri-rype and may be manipulated using standard R/T matrix algebra. In an equivalent description, the wavefield within the heterogeneous zone is considered in terms of depth dependent contributions from up and downgoing waves propagating within the imbedding reference medium, and may be efficiently computed using R/T matrices of the heterogeneous stratification and portions thereof. This description may be considered a "reference mode" formulation; it is further demonstrated that a similar set of Ricatti equations may also be derived for the R/T matrices using a "local-mode" analysis wherein the wavefield is viewed in terms of contributions form up and downgoing waves defined by the local elastic parameters (e.g. Ursin 1983).
Mode conversion of teleseismic P- and S-phases from velocity gradients is examined by way of examples and comparison with three-component data from broadband stations of the Yellowknife seismic array. The frequency dependence of such wave interactions depends on the differences in vertical slowness between incidenr and scattered modes.
It is shown that significant energy is converted from transition zones with an extent of less than one half the P-wavelength, a broader interval than will generally produce intramode reflections. A layer structure identified from $Ps$ conversions near 75 km depth below the Slave craton is shown to be compatible with a JO km thick gradient zone in which anisotropy increases from ambient levels to dVp=+i-5%, dVs=+i-2.5%, at a discontinuous upper boundary. This characterization supports a previous interpretation as the upper strata of a former oceanic plate juxtaposed with overriding lithosphere during an ancient episode of shallow subduction.
Seismological Research Letters Volume 70, Number 2 March/April 1999 263

Envelope Broadening or Outgoing Waves in Random Media: A Comparison between the Markov Approximation and 20 Numerical Simulations FEHLER, M.C., Los Alamos Seismic Research Center Los Alamos National Laboratory, Los Alamos New Mexico 87545 USA, [email protected], SATO, H, Department of Geophysics, Graduate School of Science, Tohoku University, Auba-ku, Sendai-shi, 980-8578, Japan, [email protected], a~d HUANG, L.-J., Los Alamos Seismic Research Center Los Alamos National Laboratory, Los Alamos New Mexico 87545 USA, [email protected].
Observations of seismic waves from earthquakes at depths between 100 and 200 km beneath Japan show that the initial S-wave arrival packet has greater duration than can be accounted for by the earthquake source-time duration. The observed long duration of S-waves has been explained as being caused by multiple forward scattering through random inhomogeneities between the source and receiver. Observations of Lg waveforms using arrays have also shown char multiple forward scattering is an important influence on Lg waveform character. Multiple forward scattering has been modeled using the Markov approximation for the parabolic wave equation, which allows analytic calculation of seismogram envelopes in statistically-characterized random media. We have performed numerical calculations of wavefields in random media and compared their envelopes to those calculated using the Matkov approximation. Wavefields for several realizations of random media were averaged to calculate envelopes. We calculated wavefields using approximations to the parabolic wave equation, which only models forward scattered energy, and by finite difference solution of the acoustic wave equation, which gives complete wavefields. The envelope calculated using the numerical solution of the parabolic wave equation is nearly identical to that calculated using the Markov approximation. The envelope calculated using finite difference differs from the solutions of the parabolic wave equation bur the difference is relatively minor. Our results show that the Markov approximation provides reliable information about envelope shapes for forward scattered wavefields but that the influence of wide-angle scattering and backscattering have some influence on envelope shapes and should be considered when analyzing data using random media models.
30 Elastic Wave Modeling of Air- and Water-filled Voids BARTEL, L.C., ALDRIDGE, D.F., and WALCK, M.C., Sandia National Laboratories, MS-0750, Albuquerque, NM, [email protected], [email protected], and [email protected]
Seismic methods have been used to detect and characterize subsurface voids such as tunnels, voids associated with Karst geology, ere. with varying degrees of success. Often the analysis of field data utilizes approximate methods and lacks comparison to full 30 simulation of results. This paper addresses particle velocity and acoustic pressure responses using a variety of source types to characterize air- and water-filled voids. The computational algorithm is based on the velocity-stress system of 30 isotropic elasrodynamic equations, a set of nine, coupled first-order partial differential equations. Solution gives the three components of the particle velocity vector and the six independent components of the stress tensor. Acoustic pressure is subsequently obtained from the trace of the stress tensor. The equations are numerically solved with an explicit, rime-domain finite-difference method possessing 4th-order spatial accuracy and 2nd-order temporal accuracy. Both force and moment (dipoles, couples, torques, and explosive) sources are allowed. The algorithm generates all seismic arrival types in trace or time-slice formats. Modeling results show that arrivals are delayed if the void is between the source and receiver. Additionally, modeling demonstrates "ringing" of the void structure and surface waves on rock-void interfaces. The wave propagation results that include a void structure with overlying topography are particularly interesting because of the reflections due to the topographic relief. Results will be shown for reflection and refraction scenarios, as well as sources in or near the voids. Particular attention is focused on sources within the voids to assess the potential of characterizing the voids using surface receivers. This work was supported by the US DOE under contract DE-AC04-94AL85000. Sandia is a multiprogram laboratory operated by Sandia Corporation, a Lockheed Marrin Company, for the US DOE.
The Effects of Near-source 30 Velocity Heterogeneity and Topography on Teleseismic Body Waveforms KANG, 0., and LANGSTON, C.A., Department ofGeosciences, The Pennsylvania State University, University Park, PA 16802, [email protected].
The effects of near-source 30 velocity heterogeneity and topography are incorporated into computations of releseismic body waves for earthquake sources. One objective is more fully quantify the effect of heterogeneity on inversion of
teleseismic body waves to determine source parameters. There is evidence that near-source heterogeneity can have significant effects on radiated waves from earthquakes and that these effects may map back into inverted source parameters such as the distribution of fault slip or radiation pattern. Velocity heterogeneity also produces frequency-dependent coda waves which serve to mask coherent structure arnva1s or later source tuncnon arnvals 1n relese1smic waveforms. In regions containing strongly heterogeneous media or topography focusing and defocusing of energy become significant. Computations are centered on the use of the seismic reciprocity principle. The releseismic response of a buried moment tensor point source in 30 media can be efficiently computed by using the result of the reciprocal problem of an incident P or S plane wave from beneath the structure. The 30 heterogeneity problem is solved using staggered-grid finite difference algorithms. Teleseismic waveforms for sources near and in the Los Angeles basin are computed to determine the magnitude of nearsource scattering, coda generation, and waveform distortion compared to plane layered earth models.
Boundary Conditions for Free Surface Topography in Finite Difference Seismic Wave Modeling HESTHOLM, S.O., Rice University, Dept. of Geology and Geophysics, P.O. Box 1892, MS 126, Houston, TX 77005-1892, USA, [email protected]; and RUUD, B. 0 ., University of Bergen, Dept. of Solid Earth Physics, Allegaten 41, N-5007 Bergen, Norway, BentOle.Ruud@if)f.uib.no
We present exact boundary conditions for arbitrary free surface topography in two-dimensional (2-D) and 3-D elastic and viscoelastic media. The boundary conditions are expressed as a closed system for the particle velocities and hence are commensurate with velocity-stress versions of the full wave equations. Eight order finite-differences (F-D) in space and a leap-frog technique and the CrankNicholson method in time are used for discretizing wave equations in the medium. We use second order F-Ds to discretize the boundary conditions. These we solve for the upper values in the terms of the vertical derivatives, while their lower values as well as the horizontal derivatives are considered known from the previous time step. This procedure leads to an explicit, unconditionally stable system of equations for the particle velocities at the free surface. Hence the method is a robust and accurate technique for F-D wave modeling with surface topography in seismic media.
The viscoelastic codes exhibit improved absorbing boundaries along the numerical grid edges compared ro the elastic codes, as well as visible attenuation and physical dispersion in the wavefield inherent in viscoelastic modeling. We simulate plane waves to represent earthquakes and teleseismic explosions incident on 3-D real topography. Point sources and sinusoidal ropography are used in 2-0 exploration examples. Topography on homogeneous media is shown to generate significant scattering, particularly in 3-D, where all our-of-plane effects are included. We show additional effects of layers in the medium, with and without randomization using van Karman realizations of apparent anisotropy. Synthetic snapshots and seismograms indicate that prominent surface topography can cause back-scattering, mode conversions and complex wave pattern which are usually discussed in terms of inter-crust hetetogeneities.
Seismic Wave Field Modeling on Parallel Computers with the Generalized Fourier Method ORREY, J.L., Oja Solutions, Boulder, CO 80301, jeffo@ojoso!.com, and ROBINSON, G., Arctic Region Supercomputing Center, University of Alaska, Fairbanks, AK 99775, [email protected]
We present a new method of 30 seismic wave field synthesis and discuss its implementation on parallel computer architectures. The method is a generalization of the Fourier pseudospectral method. In the standard Fourier method, a wavefields's spatial dependence is approximated by a truncated series of harmonic functions and the expansion coefficients are integrated in time using finite differencing. In the new method, the expansion set is supplemented by a finite set of functions, called discontinuity functions, which are not infinitely differentiable with continuous derivatives like the harmonic functions. With the discontinuity function set included, the generalized Fourier method is capable of accurately representing high frequency wavefields in media with surfaces of discontinuity. The discontinuity functions synthesize the discontinuous or rapidly varying portion of the wavefield's spatial dependence.
Comparisons of the new method's modeling results with analytic and other numerical solutions for both elastic and anelastic media with discontinuities shows an exceptional level of accuracy without significantly increasing the computational requirements compared to the standard Fourier method. We find that the new method produces surface wave solutions comparable in accuracy to those of a fourth order finite difference solution when between one half and one
264 Seismological Research Letters Volume 70, Number 2 March/April 1999

fourth as many grid points per minimum wavelength are used with the new method.
We have configured an efficient implementation of the code on parallel computer architectures in which planes of the computational grid are distribued among individual processors for the computation of differentials in the equations of motion. We discuss the efficiency of the parallel implementation and show examples from an application of the method to the study of anomalous phases from subduction zone earthquakes in Alaska.
Crustal Complexity from Regional Waveform Tomography: Landers Aftershocks HELMBERGER, D.V., SONG, X.J., Seismological Laboratory, California Institute ofTechnology, Pasadena, CA 91125, USA
We construct a 2D velocity section sampling the Mojave crustal block in Southern California by modeling shear-wave (SH) seismograrns. Our approach utilizes individual generalized rays computed from a layered model. The model is divided into blocks with variable velocity perturbations such that ray responses are allowed to shift relative to each other to maximize fits to data. An efficient simulating annealing algorithm is implemented in chis search. The technique is applied to a collection of 25 Landers aftershocks as recorded at two stations, GSC and PFO, separated by about 200 km which bracket the event population along the Landers fault. The events are assumed to have known mechanisms and locations. However, both their depths and origin times are allowed to vary. The results indicate considerable variation, especially in the top layer ( up to ±
13%) which mirrors surface geology. Best fitting models contain a low velociry zone in the lower crust. This feature appears compatible with the shallow seismogenic zone found in the northern end of chis section. There is also evidence for a jump in lateral velocity across the San Andreas of several percent with the faster velocities on the west.
Wednesday A.M., May 5, 1999-Shaw Room Seismic Hazards and Seismic Risk Presiding: Roland Laforge and John Boatwright
On-site Test of an Earthquake Disaster Risk Index (EDRI) in the Caspian and Latin American Regions BABB. Carmen, Blume Center, Stanford Universiry, Stanford, CA 94309, [email protected]; TRUMBULL, Sam, KHALTURIN, Vitaly, GeoHazards International, 200 Town & Country Village, Palo Alto, CA 94301, [email protected]; and DAVIDSON, Rachel, Universiry of North Carolina at Charlotte, Charlotte, NC, 28223, [email protected].
On-site tests of two regional Earthquake Disaster Risk Indices (EDRI; Davidson, 1997) in a total of thirteen ( 13) cities in the Caspian and Latin American Regions were carried out to determine the accuracy of available library data and the suitabiliry of the EDRI to cities of developing countries.
The Earthquake Disaster Risk Index is a composite index that allows comparison of the relative overall risk of disaster due to an earthquake among cities and describes the relative contributions of various factors to that overall risk. Six (6) cities were tested in the Caspian Region: Baku (Azerbaijan), Yerevan (Armenia), Tblisi (Georgia), Almary (Kazakhstan), Bishkek (Kyrgiscan), Tashkent (Uzbekistan); and seven (7) cities in Latin America: San Juan (Argentina), Antofagasta (Chile), Bogota (Colombia), Santo Domingo (Dominican Republic), Quito (Ecuador), Kingston (Jamaica), and Tijuana (Mexico).
On-site tests involved evaluation of (a) the accuracy of library data, (b) the reliabiliry of the indicators, and (c) the correlation of perceived to predicted disaster risk according to the following factors: hazard, vulnerabiliry, exposure, external context, and emergency response and recovery. These three principle evaluations were conducted through analysis of local sources' statistics, interviews with experts in various fields, and visits to significant risk contributing structures or sites.
While specific sources that contribute to the overall disaster risk of the cities are not accounted for in the EDRI used, and while the reliabiliry of the data available varies, the index does appear to differentiate relative partial, if not overall, risk faced by the cities in chis study. By publishing the results, the authors hope to receive comments that will lead to improvement of the EDRI and its eventual application to earthquake risk management.
Seismic Hazard Mapping in Slovenia by Spatially Smoothed Seismicity Modeling and Seismic Source Zone Modeling LAPAJNE, ].K., ZABUKOVEC, B., SKET MOTNIKAR, B., and ZUPANCIC, P., Geophysical Survey of Slovenia, Ministry of the Environment and Physical Planning, Ljubljana 1000, Slovenia
Recent probabilistic seismic hazard assessment and mapping in Slovenia is based: (1) on the Poissonian temporal earthquake process; (2) on five spatial models of expected seismiciry defined by a seismological database of mainly non-instrumental data and a simple quant icacive seismocectonic model of Slovenia and the surrounding region; (3) on a doubly-truncated exponential recurrence relationship; and (4) on two attenuation models. A mulcimodel approach is used due to the rather high uncertainties of input data.
The spatial modelling of expected seismicity is based on che assumption that future earthquakes will cake place in the viciniry of past earthquake locations or past seismic energy releases. Spacial models of expected seismiciry are thus obtained from the corresponding spatial models of past seismicity in a twostage Gaussian smoothing procedure. The derived spatially-smoothed models of expected seismiciry are either directly used for the calculation of seismic hazard maps, or as a basis for the delineation of seismic source zones. The calculation of seismic hazard can be performed by using point sources (epicentres) or faults. In the latter case, the seismotectonic model is used to define the azimuth, type and rupture length of supposed faults. Uncertainties in che determination of faults are also incorporated into the calculations.
Different ground-motion attenuation relationships have been tested; two of them are used. Using the Ambraseys, Simpson and Bommer attenuation relationship, higher PGA values are obtained in comparison to the Sabetta and Pugliese relationship, although the spatial distribution of high and low PGA values remains essentially the same.
Seismotectonics and Seismic Hazard of Western Iberia FONSECA, j.F.B.D., and VILANOVA, S.P., Physics Department, Institute Superior Tecnico, Lisbon, 1049-00 I, Portugal, [email protected]
The Lusitanian Basin (Western Iberia) is an aborted rift of significant intraplate seismiciry. This activiry, which includes damaging historical earthquakes in 1909, 1858 and 1531, is related to the reactivation of Late Hercynian basement faults by the current compressional stress field, caused by the convergence berween Africa and Eurasia. However, the seismogenic processes are poorly constrained.
The continental margin to the West of Iberia is also under compressional deformation, as evidenced by the very strong-and poorly understood-Lisbon Earthquake of 1755. To the South, continental convergence leads to further seismiciry in the Algarve Basin and in the South of Spain. The seismic hazard in Portugal is conditioned by this complex tectonic setting.
In this paper, we describe a current effort towards the quantification of seismic hazard at several sites in Portugal, with emphasis on rhe difficulties caused by the lack of reliable data and by the uncertainties on the seismotectonics. We follow a "space for time substitution" approach to benefit from the investigations carried out in other passive continental regions, in order to "complete" the limited strong-motion data for the region. In particular, a parallel is drawn with the situation in Central and EasternNorth America.
Finally, we describe a project of microseismic instrumentation of the Lisbon area presently starting, which aims at the clarification of rhe local seismogenic processes.
Errors, Myths, Cover-ups, and Reality in Fatality Figures for Devastating Earthquakes in the Past KHALTURIN, V.I., GeoHazards Int. & Lamont-Doherty Earth Observatory, Palisades, NY 10964-8000, [email protected].
Existing data on death toll (D) of devastating earthquakes contains many discrepancies, mistakes, errors, and false reports. Our goal is to study the patterns of those errors and to determine more reliable data for earthquake disasters with D>50,000.
We categorized several main sources of errors: I. Different authors offer very different figures. For example the value of D
for the Messina 1908 event varies from 55,000 to 160,000. The values of D reported for Ashkhabad 1948 are as low as 400 and as high as 110,000
2. Later publications repeat the errors of the initial authors such as, Milne (1911), Sieberg (1932), Davison (1960). For example the D value for the China 1730 event was repeatedly reported as 100,000 instead of 300. For the Japan 1703 event D was misreported as 200,000 rather than 5,000.
Seismological Research Letters Volume 70, Number 2 March/April 1999 265

3. In ancient times the errors typically resolved from exaggeration. Most significant was the 1201 Middle East event with 1,100,000 reported deaths.
4. The opposite tendency exists in official data for modern earthquakes. In some countries such as FUSSR (1948), Iran (1990), and China (1976)
rhe official estimates are much lower than those of independent experts 5. The human loss attributed to an earthquake is often a result ot other
events accompanying the earthquake. For example, 1737 Calcutta event fatalities were caused by a typhoon; Java, 1983, by a volcanic eruption.
6. There are several cases of false reports of casualties without any connection to a definite earthquake (China, 1662 & 1932; Japan, 1730)
On average, more then 30% of large earthquakes with D>50,000 mentioned in the popular summaries had mistakes like those mentioned above. More accurate estimate of the human losses was made for large earthquakes worldwide with fatalities of more then 50,000.
Probabilistic Seismic Hazard Analysis for Carraizo and LaPlata Dams, Puerto Rico LAFORGE, R., U.S. Bureau of Reclamation, Denver, CO 80225, [email protected]; McCANN, W.R., Earth Scientific Consultants, Westminster, CO 80021, [email protected]
A probabilistic ground morion analysis for a range of response frequencies was conducted for two concrete dams located in northeastern Puerto Rico. Seismic sources considered relevant to the structures were the shallow and deep portions of the Puerto Rico subduction zone (maximum magnitudes of -8 and 7.5, respectively), the Muertos shallow subduction zone (magnirude -7 3/4), and five faults in the Mona and Anegada Passages, northwest and southeast of the island, respectively, all judged capable of generating magnitude 7 + events. Random seismicity rates for events up to magnitude 6.5 were computed for the northeast and southwestern parts of the island, the zonarion based on surface geology and seismicity patterns. Prior distributions on magnitude distribution and activity rares were estimated for the fault source. The results indicate that for high frequencies (PHA-.3 sec) random seismicity dominates the hazard, decreasing to a 50% contribution at a return period of 10,000 years. At this level deep subduction zone earthquakes contribute about 30%, and shallow Puerto Rico subduction and Anegada Passage faults contribute the remaining 20%. At 1.0 sec period subduction zone earthquakes dominate the hazard for return periods of -1000 years and greater.
Short-term Exciting, Long-term Correcting Models for Earthquake Catalogs SCHOENBERG, F.R., Department of Statistics, UCLA, Los Angeles, CA 90095-1554, [email protected]; and BOLT, B., Department of Geology and Geophysics, University of California at Berkeley, Berkeley, CA 97420, [email protected]
A class of probability models for earthquake occurrences, called Short-term Exciting Long-term Correcting (SELC) models, is presented. These models encompass features of different models presently used to characterize earthquake catalogs, such as that of Omori. They offer the potential for a unified approach to the analysis and description of different types of earthquake catalogs. Sample SELC models are shown to provide satisfactory fit to a catalog of microearthquakes occurring in Parkfield, California and a longer seismicity sequence from the San Andreas fault zone in Central California. Inferences on seismicity patterns and mechanisms are discussed.
Low Slip Rates versus High Erosion Rates: Recognition and Characterization of Active Faults in a Tropical Environment FENTON, C.H., URS Greiner Woodward Clyde Federal Services, Oakland CA 94607, [email protected]; CHARUSIRI, P., Department of Geology, Chulalongkorn University, Bangkok 10330, Thailand; and HINTHONG, C., Geological Survey Division, Department of Mineral Resources, Bangkok 10400, Thailand
Recent seismic hazards studies in Thailand have identified a number of active faults which appear capable of generating large-magnitude (Mw > 6.8) earthquakes despite the absence of such events in the 2,000-year-long historical record. Northern Thailand is characterized by 'basin and range' extensional tectonics with north-south-striking, normal and normal-oblique faults, while western Thailand is dominated by north-northwest- to northwest-striking, right-lateral strike-slip faults. The faults were initially recognized as prominent lineaments on satellite and aerial photographic imagery. Extensive erosion, especially in the upland areas, also produces similarly-oriented, prominent linear escarpments that may be misidentified as active faults. Ground reconnaissance investigations showed that the active faults are marked by typical active
fault geomorphology, including fault scarps, wine glass drainages, faceted spurs, and laterally-deflected drainages. However, these morphotecronic features are often developed in bedrock. Recency of faulting is implied by the youchful appearance of these features, despite the high erosion rares in chis tropical climate. A lack of widespread Quaternary deposits hampers accurate age-dating and, as a consequence, estimates ot fault acnv1ty. Estimates of nming of the most recent event, slip rate, and slip-per-event were obtained from very limited fault zone exposures, fault scarp morphology, and offset peneplain surfaces. The ages of the sparse Quaternary deposits were calculated from estimated rates of soil profile development, the uplift rates ofTertiary peneplains, and denudation rates of the present day drainages. Although this age-dating is far from precise, it has allowed at least a first-order estimate of the rates of fault activity in this hitherro little studied region. In northern Thailand, basin-bounding normal faults have late Quaternary slip rates of up to 0.6 to 0.8 mm/yr and vertical displacement-per-event of 1.0 to 1. 5 m. In western Thailand, the right-lateral strike-slip faults have slip rates in the range 0.5 ro 4.0 mm/yr. Our preliminary investigations have not yielded any data on slip-per-event in this region.
The U.S. Geological Survey Partnership with Project Impact in Oakland, California john BOATWRIGHT. US Geological Survey, Menlo Park, CA 94025, on behalf of 23 members of the staff of the U.S. Geological Survey, Menlo Park, CA 94025
Oakland is one of seven cities chosen as pilot Project Impact sites by FEMA. In 1998, the USGS became a full partner with the Oakland OES and FEMA in the effort ro make Oakland more resistant ro earthquakes and rainfall-induced landslides. This abstract summarizes the USGS work undertaken in Oakland.
The seismic risk in Oakland is dominated by the possibility of large earthquakes on the Hayward fault. We are trenching this fault at five sites as part of an effort to determine the paleohistory of the SF Bay area and constrain recurrence for the northern and southern segments, and the time of the last earthquake on the northern segment.
The seismic risk is conditioned by ground motion amplificarion and susceptibility to liquefaction and landslides. We are assembling six 1 :24,000 digital geologic maps in the east bay and using cone-penetrometer testing ar -80 sites in Oakland ro obtain a complete geotechnical sampling of rhe fills and Quaternary sedimentary units. S-wave velocities are measured to 30 m at most sites. This sampling will be used to map amplification and liquefaction potential at 1:24,000 scale.
Landslides are a critical hazard in the Oakland Hills. We have photogeologically mapped the landslides in six 7.5'' quads and obtained 10-m DEM's. Slopes and other terrain measures will be combined with the geology and landslide inventory. In addition, the Oakland East 7.5" quad is being used as a test area to evaluate methods of predicting landslides triggered by earthquakes.
Finally, we are installing 13 low-cost TREM OR accelerographs equipped with CDPD modems that transmit ground motion data to Menlo Park via the Internet in 1-2 m after a large event, allowing us to map intensity throughout Oakland in 10 m. All 7 instruments deployed during the 12/4/99 M=4.l event in Richmond triggered, recorded, and transmitted data back to Menlo Park.
Holocene Uplift and Paleoseismology of the San Joaquin Hills, Orange County, California GRANT, L.B. and BALLENGER, L.J., Dept. of Environmental Analysis and Design, 262 SE I, University of California, Irvine, CA 92697-7070, [email protected]
The San Joaquin Hills (SJH) have been rising at a rate of approximately 0.21-0.24 m/ka during the late Quaternary (Grant et al., 1998). Geomorphic evidence suggests that the most recent uplift occurred during the Holocene. Stevenson (1954) described a "bench of ancient marsh deposits" around the margins of upper Newport Bay in the northern SJH and proposed that it was created by tectonic uplift of late Holocene-age marshland. We reviewed aerial photos, maps and reports, and surveyed upper Newport Bay on foot and by kayak to map undisturbed remnants of marsh bench for sampling and analysis. Radiocarbon dating is in progress. There are remnants of marsh bench at the base of cliffs on the west side of upper Newport Bay, immediately above the present shoreline angle. Where exposed, the marsh bench consists of fossiliferous unconsolidated sediments in sharp contact with underlying shale bedrock. The contact is approx. 42 cm (average of 36 measurements) above the active shoreline angle. The rop of the unconsolidated sediments is approx. 102 cm (average of 24 measurements) above the shoreline, consistent with Stevenson's average measurement of 96 cm "above the present marsh on the western shore". By confirming Stevenson's measurements along the western shore, we conclude
266 Seismological Research Letters Volume 70, Number 2 March/April 1999
that his elevation measurements of the marsh bench (average 157 cm) on the eastern shore (now paved) are reliable. Topography and stratigraphy of the marsh bench are best explained by 1.0-1.6 m tectonic uplift of late Holocene salt marsh by growth of a northwest plunging anticline. Geometry of the inferred anticline is consistent with late Quaternary growth of the SJH anticline as described by Grant et al (1998), implying that the last significant earthquake on the underlying SJH thrust generated at least 1.6 m max. uplift along upper Newport Bay.
Slow Deformation and Implied Long Earthquake Recurrence Intervals from GPS Surveys across the New Madrid Seismic Zone NEWMAN, A., STEIN, S. Department of Geological Sciences, Northwestern University, Evanston, IL 60208, [email protected], WEBER,J., Department of Geology, Grand Valley State University, Allendale, MI 49401, ENGELN, J., Department of Geological Sciences, University of Missouri, Columbia, MO 65211, MAO, A., DIXON, T., Rosenstiel School for Marine and Atmospheric Sciences, University of Miami, Miami, FL 33149
New Global Positioning System (GPS) measurements across the New Madrid Seismic Zone (NMSZ) in the central United States show little, if any, differential motion across the seismic zone, in contrast to previously published results. Data from a local geodetic network, which extends to bedrock far from the seismic zone, show I +/- 2 mm/yr of fault-parallel motion. These results are consistent with analysis of continuously recorded GPS data away from the NMSZ, which also show no motion within uncertainties. Hence the recurrence interval for great earthquakes with the 5-10 m slip inferred for the 1811-1812 earthquakes should exceed 5,000-10,000 yr, significantly greater than often assumed. A longer recurrence interval is consistent with the frequency-magnitude relationship for seismicity in the region, which predicts recurrence times for magnitude 8 earthquakes in excess of 10,000 yr. Alternatively, the geodetic data may be consistent with paleoseismic observations if slip during both the 1811-1812 earthquakes and those in the paleoseismic record were less than assumed, with these earthquakes having magnitude 7. Such earthquakes, with slip of a few meters, should recur approximately every 1,000 yr. The GPS data hence imply that the hazard posed by great earthquakes in the New Madrid seismic zone has been significantly overestimated and that the predicted ground motions used in building design should be significantly reduced.
Horizontal to Vertical Ground Motion Relations for Eastern Canada BENT, A.L., Geological Survey of Canada, 7 Observatory Cres., Ottawa, Ont., Canada KIA OY3, [email protected]
Earthquake damage more often results from horizontal than from vertical ground motion. Historically, seismograph networks have consisted primarily of short-period vertical instruments. Thus, the assumed ratio of horizontal to vertical morion is ofren based on sparse data sets or data recorded at large distances. With the increasing availability of three-component broadband data it is possible to re-evaluate these relations using larger data sets, which include earthquakes recorded at closer distances. Using data recorded at the station at Glen Almond, Quebec (GAC) for earthquakes within 250 km of the station the horizontal to vertical ground motions are studied as a function of frequency, distance and magnitude. For peak amplitudes the mean ratios are 1.5 for acceleration and 1. 7 for velocity but there is considerable scatter. GAC is located in the western Quebec seismic zone and close to two major metropolitan areas: Monrreal and Ottawa. It is assumed that the relations obtained for this station are applicable to hard rock sites in these cities.
Benefit of Local Seismic Monitoring for Hazard Assessment in Context of Induced Seismicity BARD, P.-Y., GRASSO, 1.-R., !git Observatoire de grenoble, France, KOLLER, M., Resonnace Ingenieurs-Conseils SA, Geneve, Suisse, LAHAIE, F., !git, Observatoire de grenoble, VOLANT, P., IPSN, CEA, Fontenay aux Roses, France, FOURMAINTRAUX, D., ELF EXploration Production, Pau, France
The typology of earthquakes triggered by geomechanical activities is now well described. Nevertheless, the prediction of the seismic response of a site to exploitation appears to be as complex as for natural earthquakes. Here we test a methodology that uses the continuous seismic monitoring of a gas field during its production to evaluate the seismic hazard. First we review the possible mechanisms of triggered seismicity (60 MPa depletion over a 20 yr. period). Second we identify the relevant mechanism, i.e. poroelastic stressing, in the time period and area involved in the hazard assessment. Third, we use the poroelastic model to predict the area where production promotes failure. Fourth, we use the frequency-magnitude distribution of triggered earthquakes to extrapolate the
recurrence rate of any earthquake magnitude. The catalog shows an apparent change in scaling above m=3, that agrees with a finite size effect induced by the brittle-ductile stratigraphic sequences surrounding the reservoir level. Accordingly we choose a bi-modal probability distribution function for earthquake sizes. The history of surface leveling surveys allows us toestimate that the seismic deformation just contributes to a maximum of 10% of the whole deformation. Because the remaining deformation appears as elastic as predicted by the poroleastic model, we cannot use this information to lower the maximum possible earthquake size. Then using local small event accelerogramms, we estimate the ground motion induced by local earthquake by using empirical green functions. We compare the response spectra of (i) the regional safety maximum event (SME), and (ii) the maximum event due to seismicity locally triggered by hydrocarbon recovery. The envelope of these two responses are used to evaluate the local ground motion of the studied zone to which the classified industrial facilities of the Lacq industrial field are exposed. A recently reported correlation between production rare and b-value suggests the possibility to minimize seismic hazard by controlling production rate.
Improved Corrections for Epicentral Distance and Focal Depth for use in the Estimation of mb Magnitudes MURPHY, T.R., BENNETT, T.J., BARKER, B.W and COOK, R.W., Maxwell Technologies, Inc., Reston Geophysics Office, Reston, VA, 20191, j [email protected]
A database of approximately 220,000 single station mh observations recorded from some 25,000 earthquakes reported in the Prototype International Center Revised Event Bulletin (REB)has been statistically analyzed in an attempt to reassess their dependences on epicentral distance and focal depth over the range of epicentral distance extending from 2 to I 00 degrees. The results of this analysis indicate that the Veith/Clawson (VIC) corrections used in estimating the REB mh values are remarkably accurate (plus or minus 0.05)in the teleseismic distance range extending from 23 to 92 degrees, where they are clearly superior to the Gutenberg/Richter (G/R) corrections currently employed by the U.S.G.S. and !SC. However, the V/C corrections are found to be less satisfactory at both shorter and longer distances, with systematic discrepancies of more than 0.5 magnitude units observed at distances of less than 5 degrees. Revised corrections are described which are applicable over the entire epicentral distance range extending from 2 to 100 degrees. Comparisons with corresponding Harvard moment estimates indicate that the VIC corrections also provide more consistent measures of relative source size as a function of focal depth than do the G/R corrections, at least for events with focal depths less than about 400 km. However, there seems to be some inconsistency between the Harvard longperiod attenuation model and the short-period attenuation models implied by both the V/C and G/R corrections below this depth which will require further investigation.
Wednesday, 8:30 A.M.-11 :45 A.M.-Rainier Room Posters Earthquake Sources and Fault Mechanics: Observations and Insights III
Finite Fault Inversion in the Wavelet Domain ~' Seismological Laboratory, California Institute of Technology, Pasadena, CA 91125, [email protected]; and WALD, D.J., USGS Pasadena office, 525 S Wilson Ave, Pasadena, CA, 91106, [email protected]
The spatial distribution and character of slip heterogeneity on the fault plane influences not only the frequency content of the outgoing seismic wave, but also when such effects appear on seismograms. However, conventional finite-fault inverse procedures work exclusively in either the time domain or the frequency domain. In order to extract more information about slip heterogeneity, it is best to simultaneously consider both the time and frequency characteristics of the waveforms. To this end, we introduce a wavelet transform approach for studying the spatial and temporal slip history of significant earthquakes.
The wavelet transform (Mallat, 1998) allows us to decompose the seismogram into wavelets, each of which has a particular frequency content and a specific time shift. This method is useful for obtaining the time-frequency localization on the seismogram, i.e., it enables one to study features of the seismogram, concentrating on specific variations of frequency content in time. Such variations are typically poorly resolved in least-square fir, time-domainwaveform comparisons.
Seismological Research Letters Volume 70, Number 2 March/April 1999 267

First, we transform both data and synthetic seismograms into wavelets which are then separated into several groups based on their frequency content. For each group, we use a correlation function to compare the wavelet amplitude variation with time between data and synthetic seismograms; the final objective function is the weighted sum of these correlative functions. Subsequently, we JcvclvpcJ. "" fiuitc-f.J.ult inver.'>iun routine in the wavelet domain. Becau-'>e the inverse problem is nonlinear, we use a global nonlinear inversion method, simulated annealing, to search the finite-fault model which maximizes the objective function. It can simultaneously invert the slip amplitude, slip direction, rise time and rupture velocity. We have successfully tested this method using both numerical simulations and data from the 1994 Northridge earthquake.
Broadband Investigation of Recent Large Earthqukes in the Kamchatka Subduction Zone MALAGNINI, L., lstituto Nazionale di Geofisica, Rome, Italy, and Saint Louis University, St. Louis, MO, AMMON, C.J., Saint Louis University, St. Louis, MO, USA, VELASCO, A., Los Alamos National Laboratory, Los Alamos, NM, USA
We present the results of a broadband investigation of the rupture processes of three moderate-to-large-size (Mw = 7.5, 06/08/93; Mw=7.0, I 1/13/93; and Mw = 7.8, 12/05/97) earthquakes which occurred off the coast of Kamchatka. The events are located ro the north and south of the Great 1952 Kamchatka earthquake and the largest event may have ruptured much of the trench segment that failed in the 1915 Mw 7.4 earthquake. We investigated the rupture process (duration, spatial distribution of slip, relation to aftershocks, etc.) using data which span the period range from several-hundred to several seconds period. For each event, we performed a long-period spectral inversion of Rayleigh and Love wave observations to constrain the faulting mechanism and centroid. To refine these results we used Empirical Green's Function (EGF) technique to obtain the surface-wave Relative Source Time Functions (RSTF) and performed a directivity analysis of the RSTF's, to estimate the rupture duration and the optimal rupture direction. We also applied the EGF method to Pwaves, and used the Inverse Radon Transform (using a ribbon-fault approximation) to map the rupture process as a function of time and distance along strike. Finally, we inverted broadband body-waves using the method of Kikuchi and Kanamori to map the distribution of smaller subevents. For the event of 06/08/ 93, we found a rupture characterized by three pulses on a surface striking N55E. We found a complex history with several small pulses for the rupture of the 11 / 13/93, but have little resolution of rupture directivity for this moderate-size event. The largest event, from 12/05/97, was comprised of two large momentrelease pulses on a surface striking N40E.
Evidence for High-pressure Fluids in the San Andreas Fault Zone HARDEBECK, T.L. and HAUKSSON, E., Seismological Laboratory, California lnstirute ofTechnology, Pasadena, CA 91125, [email protected]
Some major faults, including the San Andreas in California, appear to be weaker than expected. Three classes of models have been proposed to explain their low shear strength: high fluid pressure, inherently weak materials, and dynamic weakening.
We introduce an observational method for discriminating between the proposed weakening mechanisms, based on the recognition that each model contains specific predictions about the orientation of the maximum principal stress axes. A fault zone weakened by high-pressure fluids is predicted to develop a stress state inside the fault zone distinct from that outside [Rice, 1992). The maximum principal stress should be at low angles to the fault (less than 60 degrees) inside of the high-pressure zone, and at higher angles (greater than 60 degrees) outside. A similar rotation is predicted for a fault containing inherently weak material, bur the rotation would be limited to the width of the zone of weakness. No stress rotation is predicted in the dynamic weakening case.
We use stress orientations determined from an extensive earthquake focal mechanism data set to look for observational evidence of a stress rotation across the San Andreas fault system in sourhern California. Profiles of stress orientation versus distance from the fault are determined for eight fault segments. The earthquakes along each profile are grouped with respect to perpendicular distance from the fault and inverted for principal stress directions. The observed profiles are most consistent with weakening due to high-pressure fluids.
The zone of apparent high fluid pressure is surprisingly wide, implying that high fluid pressures can extend into relatively intact rock. We propose a model in which repeated strain-related fracturing and crack sealing has created lowpermeability barriers which seal fluids into the network of currently active fractures.
Hybrid LG + RG and LG + SN Data at Regional Distances: Implications for Source Spectra and Inferred Seismic Moments HADDON, R.A.W, 32 Mahuta Road, RD2 Taupo, New Zealand; ADAMS, 1, Geological Survey of Canada, 7 Observatory Cres., Ottawa KIA OY3 Canada, [email protected]: and BUNGUM, H., NORSAR, PO Box 51, N-2UU7 Kjeller, Norway, [email protected]
At regional distances the surface waves and the Lg coda overlap, constituting hybrid data. Attempts to infer source spectra and seismic moments from vertical and/or randomly-oriented horizontal component data must recognize the commonly-large spectral amplitude contributions from the surface Rayleigh wave Rg for frequencies below about 1 Hz. We have computed synthetic wave trains containing Lg + Rg at regional distances for sources at various depths in layered crustal models using a precise f-k method and then computed their amplitude spectra. Green's function sources show prominent spectral humps due to Rg, with spectral amplitudes as much as ten rimes the associated Lg spectral amplitudes. The humps elevate low-frequency spectral levels and produce spectral "sags" which have nothing to do with real source spectra, bur are artifacts resulting from neglect of excitation, transmission, and surface transfer effects associated with Rg. For moderate distances (R>250 km, say) and high frequencies (f>6 Hz) the phases Lg and Sn cannot be separated, so Lg + Sn wave trains also constitute hybrid data. This can result in invalid Q models for Lg and significant invalid trade-off effect between inferred attenuation and inferred source spectra.
Important consequences of our interpretation are: (1) seismic moments calculated from the elevated spectral levels without regard to the physics pertaining to Rg may overestimate moment magnitude by up to one unit for large (M>6, say) events; (2) high frequency source spectral amplitudes proposed by some authors may be associated with magnitudes up to one unit lower; (3) significant systematic errors in both attenuation and source spectra result from the indiscriminate use of Lg + Sn hybrid data; and (4) claims that the Haddon (BSSA, 1996) source model overpredicts motions at all periods, are unfounded.
Estimates of Rigidity Variations with Depth along the Seismogenic Zone Interface in Subduction Zones BILEK, S.L., and LAY, T., University of California-Santa Cruz, Santa Cruz, CA 95064, USA, email: [email protected]
The largest earthquakes occur in subduction zones along the seismogenic zone interface, with sediment and rock material properties playing a large role in the earthquake rupture dynamics. One such property, rigidity or the resistance to shear deformation, is particularly important because of its influence on P and S wave velocities, as well as rupture velocities. Tsunami earthquakes are one likely consequence of rigidity variations with depth, as it is suggested chat these earthquakes can be caused by shallow rupture in low rigidity material along the plate interface or in the accretionary wedge. We estimate rigidity variations along the seismogenic zone interface by a systematic investigation of the depth dependence of earthquake source durations in six subduction zones around the Pacific. Using our determined depths and source durations, as well as reasonable parameters for average rupture dimension and density, we find that on average, rigidity increases with depth by a factor of approximately 5 over a depth range of 20 km. The rigidity variations are generally consistent for each individual subduction zone_ A comparison with PREM (Preliminary Reference Earth Model) shows similar values between 20-40 km, with significant deviations from PREM at shallow depths. Our rigidity estimates at shallow depths are consistent with previous models of recent tsunami earthquakes, which predict rigidities 3-4 times lower than PREM. While our estimates are averages over the volume of material in the seismogenic zone and thus not determine the precise mechanism causing the increase in rigidity, we feel that these estimates provide constraints on future fault zone and earthquake modeling endeavors.
Source Features of Shallow Repeating Microearthquakes in the New Madrid Seismic Zone XIE, T. Lamont-Doherty Earth Observatory ofColumabia University, P.O. Box 1000, 61 Route 9W. Palisades, NY 10964, USA, [email protected]
Microearthquake seismicity in the New Madrid Seismic Zone (NMSZ) tends to be clustered in time and location. Xie et al. (1997, JGR 102, 8187-8202) found evidence for en echelon fault patches that repeatedly ruptured near Ridgely, Tennessee, at depths of about 6 km. Recently we have been analyzing the PANDA data from more clusters, with varying geographic locations and depths. We have found a patch located near 36.518W and 89.539N, at a depth of about 4 km, that was repeatedly broken over a short time interval (no longer
268 Seismological Research Letters Volume 70, Number 2 March/April 1999

than 20 days). Of the seven events that ruptured this patch, five occurred within abour 100 meters and 48 hours, with magnitudes of about 1 to 2.6. The dimensions and stress drops of rwo larger events were estimated to be about 250 meters and 8 bars, respectively. A third event that has a smaller moment but wider source time function appeared to be composed of rwo subevents separated by no more than 0.02 second.
The repeated failures of this patch are likely caused by a transient pulse of either elevated pore fluid presure or elevated strain level. We are analyzing more clusters to see if we can distinguish the rwo possible causes, and if we can establish a depth dependence of the stress drops for the repeating microearthquakes.
Seismic Swarms and Surface Deformation in the Hengill Area, SW Iceland ARNADOTTIR. T., ROGNVALDSSON, S., AGUSTSSON, K., STEFANSSON, R., Icelandic Meteorological Office, IS-150 Reykjavik, Iceland; HREINSDOTTIR, S., Science Institute, University of Iceland, IS-107 Reykjavik, Iceland; VOGFJORD, K., and THORBERGSSON, G., National Energy Authority, IS-108 Reykjavik, Iceland.
Since 1994 there has been intensive seismic activity at the Hengill triple junction in SW Iceland. Besides horizontal shearing, the earthquakes have been linked to continuing uplift in the area, at a rate of about 2 cm/yr since 1993. The largest earthquake swarm to date started on June 3, 1998 and culminated with a magnitude 5.1 earthquake on June 4, followed by a flurry of aftershocks. GPS measurements were being done in the area at the time of the swarm, and repeated measurements begun on June 5. Surface displacements calculated from the GPS data have been used to construct a dislocation model of the largest earthquake. The model is a vertical N-S, right-lateral, strike-slip fault, about 10 km long, that agrees welt with the location of aftershocks and the main shock focal mechanism. Coseismic signals were also observed at volumetric strain stations in southern Iceland.
Another earthquake swarm started on November 13, 1998, with a magnitude 5.0 event, close to the southern termination of the June swarm. This swarm occurred within a 3 km wide and 15 km long E-W belt. Relative locations of earthquakes in the area before the swarm, focal mechanisms of the largest events in the swarm and mapped faults in the area suggest faulting on many N-S structures, rather than a single E-W fault. GPS observations in the area show small displacements from August to December, 1998, consistent with an over all E-W left-lateral motion in the area. The second largest shock, a magnitude 4.7 on November 14, was located at the eastern edge of the swarm. The seismic activity in that area shows a N-S lineation, which suggests that it occurred on the Nupa fault, that is believed to have ruptured in a magnitude 6 earthquake in 1896. These earthquake swarms could be similar to events that occur in the South Iceland Seismic Zone, where a M7 event is currently anticipated.
Fault Plane Solutions of the 1990 Romanian Earthquakes and the Regional Stress Pattern FAN. G.-W., Institute ofTectonics, Department of Earth Sciences, University of California, Santa Cruz, CA 95064, [email protected]; and WALLACE, T.C., Southern Arizona Seismic Observatory, Department of Geosciences, University of Arizona, AZ 85721, [email protected].
Intermediate-depth seismicity in the Vrancea region, Romania, is associated with plate collision and a dying subduction process. Several strong earthquakes have occurred in the Vrancea seismic zone in this century, including rwo major intermediate-depth events in May 1990. To better understanding the dynamics of continental collision, we examined the focal mechanisms of these rwo 1990 Romanian earthquakes. Teleseismic and regional body waveforms recorded at the global digital seismic nerwork were used in this study. Using the moment tensor inversion technique, our best-fit double-couple fault plane solutions for the two 1990 Romanian intermediate-depth events are consistent with the results from an analysis of the P-wave first motion data. Thrust faulting with steeply dipping T-axes and nearly horizontal P-axes for the rwo events are comparable with those obtained by Harvard CMT solutions. The compressive P axis, however, has rotated by about 50-55 degrees from trending NW for the May 30 event to trending NE for the May 31 events. Similar pattern was also observed for ocher moderate-sized intermediate-depth earthquakes in the Vrancea region. Nonetheless, Harvard CMT solutions and a number of P-wave firstmotion fault plane solutions suggested that the NW direction is the dominant trending direction of the P-axes for a majority of the moderate-sized intermediate-depth earthquakes in the region. An analysis of the strain rate tensor indi-
cared chat the seismic stress field in the Vrancea seismic zone is characterized by nearly horizontal, NW-SE trending compression, which is a control factor for dip-slip faulting and a driving force for a significant amount of the deformation in the collision zone. We believe that the change in trend of the compressive P axis for the 1990 Romanian earthquake sequence is mainly caused by the triplate interaction and the pre-existing zones of weakness. Both the deformation of the plate during the continental collision and the accumulation of the strain energy in the Eastern European Platform are important to the geodynamics of the Vrancea region.
Modeling of Observed Wave Propagation Changes in the San Andreas Faull Zone at Parkfield KORNEEV, VA., McEVILLY, T.V and KARAGEOGY, E.D., Center for Computational Seismology, Lawrence Berkeley National Laboratory, Berkeley, California, 94720, USA, [email protected]; Center for Computational Seismology, Lawrence Berkeley National Laboratory and Seismological Laboratory, University of California, Berkeley, California, 94720, USA, [email protected]; Center for Computational Seismology, Lawrence Berkeley National Laboratory and Enterprise Oil Exploration Limited Maroussi 151 25 Athens, GREECE, [email protected]
For ten years, as one element of the Parkfield, CA Prediction Experiment, the borehole seismographic network there was illuminated routinely by a large shear-wave Vibroseis from several source points in a study of the stability of wave propagation in the fault zone and the possibility for nucleation- related premonitory phenomena. Clear and progressive travel-time changes up to 50 msec were detected in the S-wave coda and localized to propagation paths through the fault zone southeast of Middle Mountain, the section of the fault where previous MG earthquakes have initiated. We model the observations successfully as interaction (reflection and transmission) of the shallow wavefield with a 200-meter-wide fault zone in which the velocity increases by 6% due, we hypothesize, to hydrological changes accompanying a significant pulse in strain and seismicity.
Whal Can lcequakes Tell Us about Earthquake Mechanics? HELMSTETTER, A., GRASSO, J.-R., BAUMONT, D., DIETRICH, M., GARAMBOIS, S., GUIGUET. R., HELLMAN, R., JANOD, F., LAHAIE. F., LAMBERT, M.S., MARTINOD. J., NOIR, J., THOMAS, J.-C., VAN-DERBAAN, M., !git observatoire de Grenoble, AMITRANO, D., lirigm, universite de grenoble
We analyze how icequakes and glacier deformation can be used as an analog to earthquakes and crustal deformation, in order to better constrain earthquake mechanics.
Seismic and geodetic surveys were performed on a French alpine glacier. We use 12 three components 2 Hz seismometers with a 500 Hz sampling rate, leveling survey and GPS receivers over a 300 m x 300 m area. We We analyze how icequakes and glacier deformation can be used as an analog to earthquakes and crustal deformation, in order to better constrain earthquake mechanics.
Seismic and geodetic surveys were performed on a French alpine glacier. We use 12 three components 2 Hz seismometers with a 500 Hz sampling rare, leveling survey and GPS receivers over a 300 m x 300 m area. We recorded an average of 10,000 events/station during a 10 day period. During that period the glacier displacement was about 1 m.
We present analysis of rhe statistical properties of the icequakes. We compare the icequake distributions to (i) the acoustic emission statistics that are recorded on ice samples during laboratory creep experiments, (ii) earthquake distributions. Preliminary results are: (i) power law distributions oficequakes in size and time domains (ii) similarities of these distributions with chose of laboratory ice sample and in-situ glacier; (iii) a strong diurnal component for icequake rate.Point (i) and (ii) argue for a scale-invariant feature of icequakes that mimics earthquake behavior. Scale-invariance for icequakes is recovered with displacement velocity for glacier orders of magnitude higher than those for tectonic plates, i.e. 30 m/yr. and 1-10 cm/yr., respectively.Nevertheless the glacier velocity remains low when compared to the icequake rupture velocity. Since power law distributions and slow driving are the arguments chat were used to propose that earthquake dynamics displays Self-Organized Criticaliry, our observations argue for icequakes dynamics to mimic earthquake SOC dynamics. We test how the geometry, the loading conditions, and the rheology of rockand ice- mass respectively, modify the relative contribution of brittleness and plasticity to the deformation, as well as the time periodicity of quake rate.
Seismological Research Letters Volume 70, Number 2 March/April 1999 269
A Delineation of Depth-dependent Structure of the Landers Fault Zone Using Trapped Waves LI, Y.-G., Department of Earth Sciences, University of Southern California, Los Angeles, CA 90089, [email protected]. VIDALE, J.E., and XU, F., Department of Earth & Space Sciences, University of California, Los Angeles, CA. '.)0095, ,i<[email protected],s.uda.edu.
Thus far, research into fault zone waveguides has documented the average properties and the continuity of the low-velocity fault zone. Properties of the fault zone may vary with depth, and possibly also vary laterally more than has been proven so far. Recordings of aftershocks of the 1992 Landers earthquake have allowed us to evaluate the average structure and continuity of the fault zone [Li et al., 1994a, b]. The Landers fault, to a depth of at least 10 km, is marked by a zone 180 m wide where the S-velocity is reduced by 30-40 percent, and Q is 30-50. Recently, the Landers fault zone structure in the upper 1-2 km has been refined with profiles from near-surface explosion data. The explosion-excited trapped waves are similar to those generated by aftershocks, but have lower frequencies and travel more slowly, suggesting that the fault zone has lower velocities, lower Q, and broadens as it approaches the surface. We measured group velocities and Q values from dispersive trapped wavetrains, and used these measurements as constraints in numerical modeling. The results reveal that the shallow Landers fault is marked by a zone 200-250 m wide where the shear velocity is 1-1.8 km/sand Q is 20-30. Calculation of finite-difference synthetics for a depth-varying fault structure show that these model parameters apply to the depth of 1-2 km. We then delineate the seismogenic-depth strucrure. of the fault zone using trapped waves generated by aftershocks occurnng at different depths (2 to 10 km) within the fault. We measured group velocities of crapped waves ranging from 1.9 km/s to 2.6 km/s in the frequency range of 1 to 5 Hz for the aftershock at the shallow depth, while ranging from 2.3 km/s to 3.3 km/ s for the afrershock occurring at deep level. We also measured path-averaged fault zone Q values increasing from 30 to 60 as the depth increases. We constructed a 2-D fault zone model with depth-variable velocity, Q value, and faulr zone width: the fault zone width decreases from 250 m to 100-150 m, shearvelocity increases from 1.0 km/s to 2.5 km/s, and Q value increases from 20 to 60 as the depth increases from Oto~ 10 km depth. The velonty and Q w1thm the fault zone are reduced by 35 to 45 percent from those for the surrounding basement rock. We are using the 3-D finite-difference computer code with damping factor given by Graves [1996] to estimate the uncertainty in our depth-dependent structure model in a systematic model paramerer-searchmg procedure.
Self-healing Pulses, Friction, and Faull Geometry: How to Scale the Characteristic Lengths? NIELSEN. S.B., Institute for Crustal Studies, University of California, Santa Barbara, CA 93106-1100. [email protected], CARLSON, J.M., Deparrment of Physics, University of California, Santa Barbara, CA 93106.
We investigate the propagation of self-healing rupture pulses in a three dimensional fault model, and its consequences on rhe dynamics of recurrent ruptures.
As the friction parameters are varied there is a crossover from narrow, selfhealing slip pulses, to crack-like solutions that heal in response to edge effects. For self-healing pulses, the system exhibits self-roughening which leads to dynamical complexity; this qualitatively confirms previous observations with other models (Shaw, 1994; Cochard and Madariaga, 1994). However, we nore that the dynamical complexity is also very sensitive to external geometrical factors, notably, the overall dimension of the fault and its aspect ratio.
If external lengths play an important role, we need to scale them somehow with respect to the intrinsic lengths that may arise in the elastodynamic problem of frictional instability. We investigate the nature of those intrinsic lengths, for example, the typical length of rupture pulse that we expect for a given set of parameters, and how they scale with respect to external lengths, i.e., the fault dimensions.
Wednesday, 8:30 A.M.-11:45 A.M.-Rainier Room Posters Seismicity and Seismotectonics
California North Coast Seismicity BAKUN, WH., U.S. Geological Survey, Menlo Park, CA 94025, USA, [email protected].
The California north coast is the most seismically active area of California. Six M7 north coast earthquakes have occurred since 1906: Ms = 7.3 on 22 Jan 1923, Ms= 7.2 on 25 Nov 1954, M = 7.4 on 8 Nov 1980, M = 7.0 on 17 Aug 1991, M = 7.2 on 25 April 1992, and M = 7.0 on 1 Sept 1994. The seismicity of the pre-instrumental period is poorly known and depends on analyses of seismic intensity data. I have reanalyzed 19th- and 20th-century north-coast seismicity by examining Modified Mercalli intensities (MMI) using the analysis strategy of Bakun and Wentworth (Bull. Seismal. Soc. Amer., v. 87, pp. 1502-1521). North coast earthquakes with a maximum MMI greater than or equal VII are located on land, or near land, and their MMI values can be unambiguously interpreted. Events with a maximum MMI less than VII are either M = 5-to- 6 1/2 shocks located on land or near land, or M = 6 1/2 or larger shocks located offshore.
Three M7 California north coast earthquakes occurred in the 50 years before 1906: I) an M 7 1/4 shock on 23 Nov 1873, located near the coast near the California-Oregon border; 2) an M 7+ shock on 9 May 1878, located offshore off Cape Mendocino; and 3) an M7 shock on 16 April 1899, located far offshore off Eureka. My solution for 3) is consistent with Ellsworth's (USGS Prof. Paper 1515, 1990) location and M 5 of7.0. Toppozada and Parke (CDMG Open-file Report 81-11 SAC, 1981) list I) as an M6.7 shock located near my preferred location, 2) as an M5.8 shock located onshore near Shelter Cove, and 3) as an M5.7 shock located offshore near Eureka.
The rate of M7 California north-coast earthquakes in the 19th and 20th centuries is the same: three M7 shocks in the 50 years before 1906, and six M7 shocks in the 90 years since 1906.
Application of Bayesian Inference to the Association of Earthquakes and Faults in the San Francisco Bay Region WESSON, R.L., U.S. Geological Survey, Denver, CO 80225, [email protected]; BAKUN, W.H., U.S.G.S., Menlo Park, CA 94025, [email protected]; UHRHAMMER, R.A., Berkeley Seismological Lab, University of California, Berkeley, CA 94720, [email protected]; OPPENHEIMER, D.H., U.S.G.S., Menlo Park, CA 94025, [email protected]; and PERKINS, D.M., U.S.G.S., Denver, CO 80225, [email protected].
Bayesian inference provides a method ro combine earthquake epicenter or hypocenter data and associated uncertainties, together with _geologic and seismologic data to make quantitative estimates of the probab'.l'.t.1es tha: specific earthquakes are associated with specific faults. These probabilmes are mtended for use in developing frequency-magnitude relations to characterize the faults. The method has been applied to the UCB-USGS earthquake catalogs for the San Francisco Bay region with special attention ro the catalog of the UCB Historical Earthquake Relocation Project for the period 1951-1997. Estimates of the standard errors of the spatial location parameters are used ro esttmate the probability that the earthquake is located in each grid cell of an array spanning the region. Information from geologic slip rates is used to estimate a set of "prior" probabilities that the earthquakes occurred_ in association wit~ each of the faults in the region. These priors are then combmed wJth the lo~atton probabilities to estimate the probability that specific faults are responsible for each event given the location information. The probabilities for each fault can then be summed in magnitude intervals to estimate frequency-magmtude relations to characterize the faults. Results from the associations of these catalogs of earthquakes will be combined with fault association estimates for large, preinstrumental earthquakes carried out previously. The previous estim~tes used a similar Bayesian inference scheme including location estimates denved from intensity data.
270 Seismological Research Letters Volume 70, Number 2 March/April 1999

Automated High-accuracy Hypocentral Relocation for Large Seismicity Catalogues ASTER, R.C., ROWE, C., Department of Earth and Environmental Science and Geophysical Research Center, New Mexico Tech, Socorro, NM 87801, PHILLIPS, WS., PEHLER, M., Los Alamos National LaboratoryM.S. D443. Los Alamos National Laboratory, Los Alamos, NM 87545
Many past studies of high-accuracy hypocenters in seismogenic zones display important structures that are invisible in routine locations due ro pick inconsistencies. We have developed an adaptive and largely auromated package to repick and relocate seismicity in large seismicity catalogues. The repicking technique requires a preexisting dataset of approximate picks, such as is typically present in large catalogues which have been processed by analysts and/or autopickers. Picks are corrected for consistency on a station-by-station and phase-by-phase basis using interevent lag constraints estimated in a two-step process. We first use discrete crosscorrelation of adaptively filtered seismograms which aligns signals in coherent frequency bands. For multicomponent data, correlation may be performed using the one-dimensional projection of the seismogram which maximizes joint linearity. A range of window lengths is searched during the discrete correlation to isolate the most similar waveform segment in the vicinity of the approximate pick. We next estimate a sub-sample lag term using the L-1 norm linear regression of the coherency-weighted cross-spectral phase. Lag standard errors are obtained via a resampling technique. We solve for consistent zeromean pick corrections from interevent lags using an iterative Ll-norm conjugate gradient technique. This solver minimizes memory requirements by taking full advantage of the sparseness of weighted system constraints, thus enabling the solution oflarge systems on typical workstations. In an example application, we show results for a data set of over 7000 induced microearchquakes recorded by borehole instruments during the Soultz, France hot dry rock geothermal project, a dataset which is known to exhibit dcamatic joint-controlled seismogenic structure from previous analyses of manually repicked event subsets.
Fluid Paths from Precise Microearthquake Locations at the Soultz Geothermal Site PHILLIPS. WS., Seismic Research Center, Los Alamos National Laboratory, Los Alamos, New Mexico, 87545, USA, [email protected]
I relocated two microearchquake clusters induced by hydraulic stimulation of a hot-dry-rock geothermal reservoir in the Rhine Graben near Soultz-sous-Forets, France. The clusters were chosen from concentrations of activity in a 16,000-event data set collected in September, 1993. I determined arrival times manually, choosing distinctive peaks if waveforms were similar at a given station, the more common situation, or first breaks if waveforms were emergent or nodal, judging weights accordingly. In both cases, relocation revealed two distinct planar structures, 100 to 200 m across, intersecting and truncating each other along a common edge. Linear patterns visible within the planar features likely result from cross-cutting, yet seismically inactive joints. In both clusters, the earliest activity occurs along the linear features. Thus, these features mark permeable zones that may be important components of the fluid-flow network. The duster structures can he validated using independent information. Orientations of seismically acrive planes are consistent with orientations found in core and logging studies. Jn addition, focal mechanisms obtained by constraining the slip plane indicate normal to right-lateral strike slip, consistent with the measured stress field. The improved locations rely on a ten-fold improvement in arrival time precision for phases that were similar. as estimated from RMS residuals before and after repicking. Only a two-fold improvement was noted for nodal phases. These results could be used to train automated clustering and relocation techniques, standard applications of which have been outperformed by manual techniques for data sets of this type.
Seismotectonics and Crustal Velocities in the Imperial Valley, California MAGISTRALE, H., Department of Geological Sciences, San Diego State University; San Diego CA, 92182-1020, [email protected]
The Imperial Valley, southeast California, occupies the Salton trough, a rifr that is the landward continuation of the actively spreading Gulf of California. The Imperial Valley contains an unusually thick sequence of sediments on top of a variety of basement rocks. I constructed, in a forward sense, a 3D seismic velocity model of the Imperial Valley area based on existing geologic and seismic surveys, and used the forward model to constrain an inversion of earthquake travel times. P-wave seismic velocity cross sections (based on seismic refraction lines) were digitized and converted into isovelocicy surfaces. The forward model is generated by a code rhat reads the isovelocicy surfaces and interpolates the velocity at any point of interest within the Salton Ttough. Outside the Salton
Trough, the code assigns velocities interpolated from a regional southern California tomographic model. An important aspect of the forward model is the explicit estimation of model errors, estimated to be 80 to 500 mis within the Salton Trough. The inversion used arrival rime data for about 20,000 earthquakes recorded by the southern California seismic network, and selected by quality and coverage criteria. The inversion model parameterizes the crust and upper mantle into blocks, a few km on a side, each having a certain slowness, initially determined by the forward model, and modified by the inversion. The inversion has produced high quality hypocenters and detailed 3D seismic velocity results that will be used to address these tectonic issues: 1. lower crustal and upper mantle structure of the eastern Peninsular Ranges adjacent to the Imperial Valley, 2. search for unrecognized faults carrying slip across the International border, and 3. distriburion of basement rock types below the Imperial Valley ar,d their influence on the distribution of earthquakes.
Historical Seismicity of New Mexico-1869 through 1998 SANFORD. A.R., LIN, K.W, JAKSHA, L.H., and TSAI, J.C. Department of Earth and Environmental Science, and Geophysical Research Center, New Mexico Institute of Mining and Technology, Socorro, NM 87801, [email protected].
We have prepared a 30 x 32 inch map sheet with text that summarizes our investigations of the historical seismicity of New Mexico. The principal map of this document shows locations and strengths of New Mexico earthquakes obtained from instrumental data gathered from 1962 through 1998. A smaller map depicts the quality of rhe instrumental locations. Also presented is a seismic hazard map based on the 37 years of instrumental recording. The data base for these three maps is a New Mexico Tech catalog of over 2000 earthquakes (1962-1998) with magnitudes of 1.3 or greater. The catalog is a collation of data from New Mexico Tech (79%), Los Alamos National Laboratory (13%). U.S. Geological Survey (7%), and the University ofTexas~E\ Paso (1 %) with a major effort made to have all magnitudes tied to a single New Mexico scale based on duration. Tests made on the catalog indicate that a lower cutoff magnitude of 2.0 assures completeness of data over the entire 37 year period and therefore maps appearing on our map sheet are from a listing of 581 earthquakes of magnitude 2.0 or greater derived from the general catalog. Augmenting the three maps based solely on instrumental data is a map and table of the 30 earthquakes exceeding magnitude 4.5 from 1869 through 1998. For the period preceding 1962, reported maximum intensicies were converted to magnitudes using a relation derived from New Mexico earthquakes. Procedures used in generating all the seismicity maps are presented in the text of the map sheer. Also discussed in the text are characteristics of the distriburion and strength of earthquakes and the levels of risk throughout the state. Among the prominent features reviewed is a tight cluster of earthquakes in the Rio Grande rift at Socorro that occupies! .6% of the total area of the state bur accounts for about 40% of the seismicity.
San Francisco Bay Region Historical Earthquake Relocation Project UHRHAMMER, R.A, FINK, J., FORD, S., Berkeley Seismological Laboratory, University of California, Berkeley, CA, 94720, [email protected]
The goal of the Historical Earthquake Relocation Project (HERP), using data from the original reading sheets and seismograms kept on store in the Berkeley Seismological Laboratory (BSL) archives, is to produce a uniform and seamless catalog of earthquake location and magnitude (including formal estimates of uncertainty) for the San Francisco Bay Region (SFBR) which is complete at the magnitude 3 threshold and which spans back as many years as possible. The initial task was to transcribe the BSL reading sheets co computer readable form BSL began recording amplitude data, for the determination of local magnitude (ML), on the reading sheets in 1951 so we decided ro concentrate our initial HERP efforts on systematically analyzing the posr-l 950 SFBR earthquakes. The re-analysis of the data is progressing backward in time, using the most recent data to calibrate the procedures. All local magnitude estimates are being systematically re-evaluated, and formal magnitude uncertainties are being calculated. Owing to temporal changes in the sparse network geometry, the re-analysis of the locations is the most difficult aspect of producing a revised SFBR catalog. We have developed a new location algorithm that uses an adaptive migrating grid search co find the minimum in an arbitrary normed objective function. This new algorithm results in significantly more robust location and uncertainty estimates, than any algorithm that is based upon variants of Geiger's method, and it is ideally suited for the HERP effort.
Problems encountered. A few events have no phases and some stations have only S-P times. Also, ML for the larger SFBR events prior to circa 1960 is based
Seismological Research Letters Volume 70, Number 2 March/April 1999 271
on Southern California observations and it appears to be biased high by about +0.2. This has a potentially significant impact on the probability estimates and it needs to be thoroughly investigated.
Contributions of the Puerto Rico Seismic Network toward Seismic Hazard Assessment, Awareness, and Emergency Response VON HILLEBRANDT-ANDRADE, C.G. and HUERFANO, V.A., Puerto Rico Seismic Network, University of Puerto Rico, PO BOX 9017, Mayaguez, Puerto Rico 00681-9017, [email protected]
The data and information of the Puerto Rico Seismic Network (PRSN) in the Dept. of Geology at the University of Puerto Rico, Mayaguez (UPRM), have enhanced the understanding of local seismic hazards, fostered a greater awareness of the regional seismicity and have become an integral component of the emergency response community.
Between 1903 and 197 4, only one seismic station was operational in Puerto Rico. For this time period, the detection threshold for events in the Puerto Rico region was around magnitude 4.5 and the seismic activity appeared to be limited mainly to the north of the island.
In 1974, as part of the seismic hazard evaluation required for the construction of nuclear power planes on the island, a local seismic network was established. With the data from chis network it soon became apparent that the island was seismically more active than had been previously believed. Within the island, the southwestern seismic zone appeared as an important feature. Digital seismograms of locally-recorded events are presently being used in a NEHRP project to constrain the attenuation relationship for the entire region. Unfortunately, these data often appear to be overlooked by researchers and hazard consultants. Yearly and monthly bulletins and special reports for felt events are distributed widely throughout the emergency response agencies, government and private offices and the educational community and are highlighted by the press. They have been a key player in creating and maintaining a seismic awareness throughout Puerto Rico and the Virgin Islands.
Although Puerto Rico has not experienced a devastating earthquake since 1918, 5-20 events of MM intensity III-V are felt annually. Many of these earthquakes, because of their shallow depth and small magnitude, are only picked up and reported by che PRSN. With the upgrades and expansions chat are being made to the network and have been funded by FEMA, UPR and regional emergency response agencies, che PRSN hopes to be able to give rapid and reliable information that aids the timely emergency response to larger earthquakes, including tsunami warnings; and provide critical data for improving regional hazard assessment.
Changes in the Southern California Earthquake Catalog Magnitudes HUTTON, K., KANAMORI, H., MAECHLING, P., Seismological Laboratory, California Institute ofTechnology 252-21, Pasadena CA 91125, [email protected], JONES, L., U.S. Geological Survey, 525 S. Wilson Av., Pasadena CA 91106
During the past decade, the Southern California Seismic Network's local earthquake magnitude computation procedure has undergone significant changes, necessitating caution on the part of catalog statisticians. Mw is currently used for all earthquakes above magnitude 6 and some of lower magnitude and has been applied retroactively to the catalog back to 1932. Prior ro 1990, local magnitudes (ML) were computed from actual Wood-Anderson seismometer readings at seven of the Caltech stations (PAS, RVR, PLM, BAR, SBC, HAI or CWC, TIN), and electronic simulated Wood-Anderson readings at two stations (ISA, GLA). After that date, synthetic Wood-Anderson readings computed from broadband seismometers, low-gain shore period seismometers, and FB.A'.s have been used instead. Station corrections at the traditional Caltech stations have been kept constant to prevent the magnitude zero point from drifting. Until the recent installation of large numbers ofTriNet broadband stations, the number of readings available has limited the events to which ML was assigned to those above 2.5 to 3.0, depending on the epicenter. Richter's tabular attenutation correction (from Elementary Seismology, 1958) was in continuous use, even though distance, and hence magnitude, dependent errors were known to be introduced. Last year, we commenced using a more accurate attenuation correction provided by Kanamori. This correction is a function ofhypocentral rather than epicentral distance, and its use seems to eliminate previously noted errors in the distance range O to 35 km. It also brings readings at distances greater than 300 km, previously too large by as much as 0.5 unit, into line with those closer to the event. Another change is that the number of digital TriNet stations now allows us to compute ML for some events as small as I. 5, depending on epicen-
tral location. The MLs are assigned automatically and later revised, if necessary, by deletion of bad readings. In the automatic algorithm, an initial estimate is made based on all available amplitudes, which are above the noise and not clipped, within 150 km of the epicenter. Using chat estimare, an appropriate distance cutoff (ranging from 20 km to 500 km) is assigned and the ML recomputed usmg available amplnudes w1thm that distance. Usmg events from January through July 1998, we have taken a preliminary look at the effect these changes may have on catalog statistics: there is no statistically significant change between ML3.0 and ML5.3. Smaller events are now up to 0.12 larger than they would have been underthe previous algorithm. This change will necessitate recalibration of coda magnitudeMc, which was and still is used for the other small events without sufficient synthetic Wood-Anderson readings. Retroactive revision of catalog magnitudes, from 1932 to the present time, may be required to produce a more uniform catalog.
Faulting within the Mountain Block South of Long Valley Caldera JOHNSON, P.A.B., Southern California Earthquake Center and U.S.G.S., Pasadena, CA 91106, [email protected]; and SEEBER, L., LamontDoherty Earth Observatory, Palisades, NY 10964
Since 1980, 100,000 earthquakes (M > O) have occurred in the Mammoth Lakes-Long Valley Caldera area. These earthquakes occur mainly in one of two regions: in the south moat of che Caldera or in a 15 km by 20 km area we refer to as "the mountain block'', which extends southward from the southern Caldera rim. Along the eastern boundary of the mountain block seismiciry runs the eastern Sierra Nevada bounding fault, the Hilton Creek Fault (HCF); continuing along the mountain front to the southeast lies the impressive fault scarp of the M 8 Owens Valley earthquake of 1872.
The mountain block has been continuously active with earthquakes for two decades. However, despite thousands of earthquakes that have occurred in the vicinity of the Hilton Creek Fault, including over a dozen M > 5 earthquakes, there has been surprisingly little seismicity associated with it. Even the aftershocks of the June 1998 M 5.1 earthquake, whose epicenter falls on the surface trace of the HCF, dearly trend obliquely to the fault. Our master event relocation study is resulting in a number of inreresting features. Within the mountain block, the relocated seismiciry reveals some previously unrecognized trends in seismicity and better resolve ochers. For instance, relocated evenrs define the area of the June 1998 M 5.1 earthquake by an intersection of at least two northeast- to east-dipping faults. We will illustrate this and additional seismicity trends with numerous maps and cross sections of relocated earthquakes. With the use of focal mechanisms and the knowledge that the mountain block is copiously faulted, based on the observation of numerous seismicity alignments, we evaluate the hypothesis that the area is responding to regional strain and transtension along the eascernSierra Nevada by rotation of a set of blocks clockwise about a vertical axis.
Estimation of Crack Density and Saturation Rate in the Source Area of the 1994 Northridge Earthquake ZHAO, Dapeng, Department of Earth Sciences, Ehime Universiry, Matsuyama 790-8577, JAPAN. (E-mail: [email protected])
Zhao and Kanamori [1995] determined a detailed 3-D P-wave velocity structure in the source area of the 1994 Northridge earthquake (Mw 6. 7) and found that there is a close relationship between the crustal heterogeneities in the fault zone and the aftershock locations and focal mechanisms. Zhao et al. [1997] detected a temporal rotation of the crustal stress field in the Northridge area before and after the 1994 Northridge earthquake and suggested the existence of inelastic processes in the rupture zone, e.g., fluids. In the present work, we have used about 100,000 P and 60,000 S wave arrival times from about 4600 events during 1981 to 1996 ro determine detailed 3-D P and S wave velociry (Vp, Vs) and Poisson's ratio structures in the Northridge area. Then we estimated the distribution of crack density and saturation rate in Northridge by applying the partial saturation crack model of O'Connell and Budiansky [1974] to che Vp, Vs and Poisson's ratio values determined by tomography. Our preliminary results show that the crack densiry is in the range of 0.03 to 0.15, and the saturation rate is from 20 to 80%. High values of crack density and saturation rate generally appear in areas with more aftershock seismicity.
Zhao, D. and H. Kanamori, The 1994 Northridge earthquake: 3-D crustal structure in the ruprure zone and its relation to the aftershock locations and mechanisms, Geophys. Res. Lett., 22, 763-766, 1995.
Zhao, D., H. Kanamori and D. Wiens, State of stress before and after the 1994 Northridge earthquake, Geophys. Res. Lett., 24, 519-522, 1997.
272 Seismological Research Letters Volume 70, Number 2 March/April 1999
A Seismotectonic Model for the Eastern Tennessee Seismic Zone Based upon Potential Field and Velocity Inversions VLAHOVIC, G., Dept. Geology, UNC Chapel Hill, Chapel Hill, NC 27599, [email protected]; and POWELL, C., CERI, U. of Memphis, Memphis, TN 38152, [email protected].
The central and eastern United States are characterized by diffuse seismicity interrupted by several zones of concentrated activity, such as the New Madrid and eastern Tennessee seismic zones. Lack of correlation between earthquake locations and observed faulcs in the central and eastern U.S. necessitates development of seismotectonic models for earthquake hazard assessment. In this study, we constructed a seismotectonic model for the eastern Tennessee seismic zone (ETSZ) based upon inversion of potential field data constrained by a tomographic image of the velocity structure.
Five potential field profiles were extracted from the 0.5 km digital grid of aeromagnetic anomalies and che 1 km grid of isostatic residual gravity data. Commercially available GMSYS modeling software was used for the inversion. The most critical question is the nature of che New York-Alabama (NY-AL) magnetic lineament because it separates basement units with different seismogenic properties. The source of the NY-AL magnetic lineament was modeled as a transition zone between two basement felsic blocks with high susceptibility contrast. The irregular shape of magnetic anomalies in the block northwest of the NY-AL lineament implies chat it contains numerous intrusions. Mose of the earthquakes occur in a low density, low susceptibility block southeast of the NYAL lineament. This block is bordered to the southeast by a basement unit with higher than average density and low suscepciblity. The resulcs of our study suggest that the seismogenic block is bordered to che northwest and southeast by more competent crust; earthquakes are produced by regional stress acting on the weaker crustal material.
Seismotectonics of the Northeastern United States from Regional Earthquake Monitoring EBEL, J.E., Weston Observatory, Department of Geology and Geophysics, Boston College, Weston, MA 02493, USA, [email protected]
Over 20 years of high-quality earthquake monitoring in the northeastern U.S. and adjacent Canada is starting to reveal information about the modern seismocectonics of chis part of eastern North America. While there is earthquake activity spread throughout the region as a whole, some areas have more earthquakes than others. Earthquakes in the Grenville cracon occur as deep as 30 km, while those in the accreted cerranes to the east and south of Grenville are almost invariably less than 10 km deep. Currencly, there have been insufficient data collected ro determine which specific geologic structures are seismically active. However, on a regional basis, most of che modern earthquakes tend to occur on or near structures that formed or were reactivated during Mesozoic rifting of North America. These structures include faults, dikes and uplifts. Since some of these faults are hundreds of kilometers in length, major earthquakes (M7+) may be possible at a number oflocalities in the region, although with a relatively low frequency of occurrence.
Seismotectonic Study of Kennedy Entrance, South-central Alaska VELASQUEZ, M. and DOSER, D.I., Department of Geological Sciences, University ofTexas at El Paso, El Paso, TX 79968, [email protected] and [email protected]
The March 28, 1964 Prince William Sound (PWS) Alaska earthquake (Mw-9.2) involved rupture along two asperities. The larger asperity within the PWS region is located co che northeast of Kennedy En trance. A smaller asperity is located near Kodiak Island to the southwest of Kenndey Entrance. Although these two asperities are geographically close, paleoseismicicy and historic information suggest chat the asperities ace independently of one another. Thus, investigation of structure and seismicity of the Kennedy Entrance region may help to determine what controls the edges of these asperities. This study will attempt to identify how structure (revealed in seismic reflection studies and limited onshore exposure) controls behavior of this portion of the megathrust and is related to the observed seismicity.
Body waveform modeling oflarger earthquakes (Mb >~5.7) occurring since the 1964 mainshock will be conducted to determine fault orientation, focal depth, and rupture processes within the region. Data from regional 2D reflection studies (EDGE) will be used co constrain near source velocity structure for the modeling process. Source parameter information will be compared to postmainshock activity within the PWS and Kodiak regions to determine similarities and differences between regions.
Historic Seismicity of the Prince William Sound, Alaska, Region (1928-1964) DOSER, D.I., and BROWN, WA., Dept. of Geo!. Sci., Univ. Texas at El Paso, El Paso, TX, 79968, U.S.A., [email protected]
We are investigating the character of seismicity in the Prince William Sound/ Cook Inlet, Alaska, region for about 35 years prior to the 1964 great Alaskan earthquake. The study involves relocation of all events of magnitude greater than 5.9 and depths less than 100 km. Focal mechanisms are currently being determined from first motion and waveform modeling analysis for rhe larger (magnitude greater than 6.4) events. These results will be compared to the 1964 mainshock rupture zone and posc-mainshock activity to determine how the stress field in the region has changed through time. Results to date suggest a number of important similarities and differences between pre- and post-mainshock seismicity. Similarities include: normal faulting at depths of 40 to 60 km in both the Tazlina Glacier and Columbia Bay Glacier regions north of Prince William Sound, seismicity at depths of abour 100 km in the Kantishna region north of Cook Inlet, and intermediate depth (50 to 100 km) events below the western Kenai peninsula and northern Cook Inlet. Differences include: a higher level of shallow (less than 50 km depth) activity along che Castle Mountain fault system prior to 1964, a higher level of seismicitiy in the south-central and eastern Kenai Peninsula region prior to 1964, and a lower level of seismicity in the offshore Prince William Sound prior to 1964.
Wednesday, 8:30 A.M.-11:45 A.M.-Rainier Room Posters Structure
Sidescan Sonar and Seismic Reflection Data over the San Gregorio Fault between Pillar Point and Pescadero ROSS, S.L., RYAN, H.F., and STEVENSON, A.J., U.S. Geological Survey, 345 Middlefield Rd. MS-999, Menlo Park, CA, 94025, [email protected]
Alchough the San Gregorio fault is the major active faulc zone west of the San Andreas fault in central California, its seismogenic structure is less understood than most faults in the area because it lies primarily offshore. To study the nearsurface structure of the faulc, we collected 300 km of 100-kHz sidescan and high resolution seismic reflection data near Half Moon Bay, California, over the San Gregorio fault zone. The lines extended from just offshore to about 9 km to the west with a line spacing of 500m.
Structural features are discontinuous along strike; rhis could indicate multiple surficial fault strands. Some seismic reflection lines reveal fault features such as offsets and discontinuities while ochers show a broad zone of deformation. Over much of the area, the zone of deformation separates a block of gently seaward-dipping reflectors to the west from a block of more steeply landward-dipping reflectors closer to shore. The northern and southern sections of the sidescan image display numerous rock outcrops but che central section appears mostly sediment covered. Some lines show pronounced topographic relief across the fault while others show buried faulc structures.
Fault Relations and Shallow Velocity Structure in the San Gorgonio Pass Region, Southern California, Using High-resolution Seismic Reflection and Refraction Imaging CATCHINGS. R.D., RYMER, M.J., GOLDMAN, M.R., GANDHOK, G., and HORTA, E., US Geological Survey, 345 Middlefield Rd., MS 977, Menlo Park, CA 94025, [email protected]
High-resolution seismic reflection and refraction dara show details about previously poorly understood faulcs beneath San Gorgonio Pass, located about 40 miles east of San Bernardino. San Gorgonio Pass is bordered on the north by the San Bernardino Mountains and the San Andreas fault zone and on the south by the San Jacinto Mountains. Within the San Gorgonio area, the San Andreas fault zone splits into multiple strands, including the San Gorgonio, Banning, Vincent, Mission Creek, and Mill Creek faulcs. Little is known, of relations of the San Gorgonio fault zone beneath sedimentary cover in the San Gorgonio Pass char was originally inferred on gravity anomalies and indirect geologic evidence. In the summers of 1997 and 1998, the U.S. Geological Survey acquired nine separate high-resolution seismic imaging surveys to examine stratigraphic and faulting relations in the area. Seismic reflection images indicate a dense distribution of faults, many of which propagate ro near the ground surface. Seismic
Seismological Research Letters Volume 70, Number 2 March/April 1999 273

profiles from the base of the San Bernardino Mountains to Interstate 10 show zones of densely spaced faulting beneath populated areas. Between Interstate 10 and the San Jacinto Mountain range front, seismic data show a series of folds and faults that are truncated by a south-dipping fault that surfaces beneath Interstate 10. For each of the surveys, detailed seismic velocity measurements were made. P-wave velocities range from about 400 mis to more than 4300 ml s in the upper 400 m. The combined velocity and reflection data outline areas and depths of unconsolidated sediments, useful for ground motion modeling. The combination of active faults and thick accumulations of unconsolidated sediments that underlie local cities present an appreciable seismic hazard that must be considered in furure seismic hazard analyses.
Poisson's Ratio Variations of the Crust beneath North America LIGORRIA, J.P., lnstituto Nacional de Electrificacion, Guatemala City, Guatemala, [email protected], and AMMON, C.j., Saint Louis University, St. Louis, MO, 63103, USA, [email protected]
We present the results of a study of variations in the average crustal Poisson's ratio beneath North America. Specifically, we analyzed receiver functions calculated from three-component broadband records obtained by the CNSN, NCEDC, USNSN, GEOSCOPE, TERRASCOPE, IRIS-IU, IRIS-II, seismic networks for che years 1990 through 1998. We organized the data for each station, in sub-groups of stacked receiver functions calculated from signal arriving with similar azimuths. The data consist of 731 receiver function stacks, calculated from teleseismic records at 101 stations. We correlate the observations with geologic environment (e.g. Shields, Continental Platforms, Orogens, Volcanic Arcs) and history, attempting to understand the observed variations in the seismic properties in light of the evolution of the crust, including the role of magmatic underplating and models of continental growth. We obtain a median (and mean) Poisson's ratio for the continent of approximately 0.27, consistent with earlier estimates for continental crust. The largest observed raios are associated with volcanic arcs and consistent with a relatively mafic composition (with two notable exceptions, PMB and UNM); the high median values of shields and platforms (0.28) likely reflects mafic lower crust; orogenic regions are variable but generally show values lower than average; and several extended regions suspected to have experienced mafic magmatic underplating, have intriguing low Poisson's ratio values.
Upper-crustal Structure in the Mississippi Embayment and Adjacent Areas from Teleseismic Receiver Analysis AKINCI. Aybige, HERRMANN, Robert B., and AMMON, Charles J. Earth and Atmospheric Department, Saint Louis University, 3507 Laclede Avenue, St. Louis, MO, 63103
We investigate upper-crustal structure in the Mississippi Embayment and adjacent areas using teleseismic receiver functions. Specifically, we use three-component broadband observations from three seismic stations of the Cooperative
New Madrid Seismic Network in the central United States. Each site is located in a different near-surface geological environment, SLM is located in eastern Missouri on Paleozoic sedimentary rocks, BLO is located on the flanks of the Illinois Basin, and MPH is located in the Mississippi Embayment above a thick sequence of late Cretaceous and Cenozoic unconsolidated and poorly consolidated sediments. In this work we compare the upper crustal structure at BLO and SLM sites with a shallow crustal strucrure in MPH site. Crustal velocity models estimated using observations from the three stations are relatively simple with smooth velocity variations through the middle and lower crust and similar crustal thickness (40-43 km) beneath the BLO, SLM and MPH. Analysis and inversion clearly the shallow crustal strucrure differences in three station sites. Large arrivals produced by the thick section oflow-velocity unconsolidated sediments and sharp transition to a relatively fast basement dominate the observations at station MPH. Beneath MPH, average sediment shear-velocity is about 0.8 km/sec and with a relatively sharp transition to about 3.0-3.3 km/sec in the basement beneath the sediments. The upper crust beneath BLO consists of 500 m of Pennsylvanian-age elastic sedimentary rocks with a shear-velocity of about 1.6 km/sec. Beneath SLM, the shallow crust consists of about 1000 m Ordovician carbonate strata with a shear-velocity of about 2.5 km/sec and it reaches again 3.0-3.3 km/sec under the site. These results may be the first ro use the technique to focus on very shallow structure.
Attenuative Body-wave Dispersion along the North Anatolian Fault Zone of Turkey and in Southern Germany AKINCI, Aybige and MITCHELL, Brian J., Department of Earth and Atmospheric Sciences, Saint Louis University, 3507 Laclede Avenue, St. Louis, MO 63103, [email protected]
A new method based on attenuative dispersion of high-frequency P waves was used to determine attenuation parameters along the eastern and western portions of the tectonically active North Anatolian Fault zone (NAFZ) and in the southern Germany.The method measures relative group delays of the spectral components that make up the direct body wave arrival. We relate seismic Q to dispersion through a continuous relaxation model and determine Q and the high-frequency relaxation time.
P-wave Q values deduced by this method show a regional variation of between 10 and 100 in the NAFZ and between 10 and 250 in Germany over distances of 5 to 100 km. In Turkey, the eastern portion of the NAFZ exhibits somewhat higher Q than the western portion. In Germany, we obtained Q for ovelying sediments (2 km) as well as for the deeper basement. We found that average Q for the sediments is 12+-11 and for the upper 10 km of 390+-115. Variation of Q along the NAFZ and the lower Q values there, relative to Germany, are consistent with results of previous studies, suggesting that this method provides an independent test of attenautaion results determined by other methods.
27 4 Seismological Research Letters Volume 70, Number 2 March/April 1999

SSA '99 Abstracts of the 94th Annual Meeting
Author Index
A Beukelman, G. 230 Chen, X.Q. 259 E Abramson, H.A. 232 Bhattacharyya, J. 238 Childs, J.R. 220 Ebel, J.E. 273 Adams, J. 230, 268 Biehler, Shawn, 248 Chiou, S.J. 216 Edwards, C.L. 218 Agnon, A. 226 Bilek, S.L. 268 Choy, G.L. 248 Ekstrom, G.A. 226, 244 Agustsson, K. 269 Biswas, N. 217,251 Clague, J.J. 232 Elfendahl, Gerald, 233 Akinci, Aybige 230, 274 Bittenbinder, A. 243 Clarke, S. 210 Ellis, R.M. 238, 253 Aldridge, D.F. 258, 264 Blackwell, D.D. 245 Clayton, R. 242 Ellsworth, WL. 235, 236, 246 Alexander, S.S. 239 Blakely, R.J. 209,218,219, 220, Clowes, R.M. 210, 260, 261 Engdahl, E.R. 227 Alguacil, G. 222 221 Cogbill, A.H. 218, 229 Engeln, J. 267 Allen, R.M. 222, 249 Blandford, R.R. 211 Cole,A. 246 Enkbaatar, D. 235 Almendros, J. 222 Blanpied, M.L. 234 Collot, J.-Y. 254 Erlendsson, P. 222 Amitrano, D. 236 Boatwright, J. 215, 266 Cook, R. W 267 Ammon, C.J. 241,254,268,274 Bodin, P. 234, 237 Cook, S.W 253 F Andrews, J.A. 242 Bogaert, B. 243 Cormier, V. F. 240 Fan, G.-W 269 Anooshehpoor, A. 217 Bolt, B. 266 Cornell, C.A. 224 Farfan, F. 237 Antolik, M. 226 Bonilla, L.F. 226, 251 Cornou, C. 218 Fehler, M.C. 218,263,264,271 Arabasz, WJ. 244 Bonjer, K.-P. 215 Courboulex, F. 218 Fenton, C.H. 230, 266 Aracne-Ruddle, C. 226 Bonner, B.P. 226 Cowan, D.S. 247 Ferguson, John R. 248 Archuleta, R.J. 216, 226, 235, Booth, D.B. 234, 256 Cox, Jonathon 257 Fink, J. 271
247,251 Bostock, M.G. 252, 253, 260, Cranswick, Edward, 257 Finn, WD.L. 250 Arnadottir, T. 269 263 Creager, K.C. 210,219,239,240, Fischer, K.M. 239, 240 Aster, R.C. 227, 271 Bott, J.D.J. 256 254,255 Fisher, M.A. 210,219,220,254, Astiz, Luciana. 227 Bouchon, M. 218 Cristaldi, M. 214 255 Atkinson, G.M. 225 Boughner, Judith A. 211 Crosson, R.S. 209,210,219,254, Flueh, E. 210 Atwater, B.F. 210, 232 Bourgeois, J. 232 255 Fonseca, J.F.B.D. 265 Ayala, R. 214 Boyd, T.M. 248 Crosswhite, J.C. 253 Ford, S. 271
Bradley, C.R. 259 Cultrera, G. 218 Fouch, M.J. 239, 240 B Bradshaw, J.A. 240 Foulger, G. 222 Babb, Carmen, 265 Braile, Lawrence W 248 D Fourmaintraux, D. 267 Bachrach, R. 226 Breger, L. 241 Dadisman, S.V. 220, 234 Frankel, A.D. 211, 214, 256, 257 Baker, D.F. 218 Bracher, T.M. 210,219,254,255 Davidson, Rachel, 265 Frederiksen, A.W 252 Bakun, WH. 270 Brodsky, E.E. 223 Day, S.M. 259 Fumal, T.F. 231 Baldridge, W Scott, 248 Brown, L.T. 256 de Carmona, R.P. 243 Ballenger, L.J. 266 Brown, S.M. 239 Del Pezzo, E. 221 G Bank, C.-G. 253 Brown, WA. 273 Delaughter, J. 250 Gaffer, S. 218 Bard, P.-Y. 267 Bucknam, R.C. 210,233 Dewey, J.W 211 Gaherty, J.B. 259 Barker, B.W 267 Bungum, H. 268 Di Bona, M. 214 Gallardo, V.A. 238 Barnhardt, WA. 231 Burgmann, R. 244 Diaz de Cossio, G. 237 Gandhok, G. 273 Bartel, L.C. 264 Dieterich, J.H. 234 Gao, S.S. 261 Barzilai, A. 242 C Dietrich, M. 218, 269 Garambois, S. 269 Baumont, D. 269 Carkin, B. 231 Dietz, L. 243 Garces, M.A. 224 Bawden, G.W 248 Carlson, J.M. 270 Dixon, J. 224 Gamero, E.J. 241 Bayasgalan, A. 23 5 Carmona, E. 222 Dixon, T.H. 224, 267 Garrison-Laney, C.E. 232 Bazzurro, P. 224 Carmona, J.S. 243 Dollar, R.S. 222 Geist, E.L. 221 Beaudoin, B. 210 Carr, D.B. 227 Doser, D.I. 273 Gerdom, M. 210 Beeler, N.M. 234 Carver, David, 257 Dragert, H. 209, 245, 246 Gerstel, WJ. 250 Begnaud, M.L. 238 Carver, G.A. 232, 245 Drake, L.A. 214 Giampiccolo, E. 223 Bennett, T.J. 267 Caserta, A. 218 Dravinski, M. 215,217,251,258 Gillard, D. 246 Bent, A.L. 267 Cassidy, J.F. 221,246,250, 253 Dreger, D. 212, 216 Gilpin, Bernard J. 248 Bemhien, M.L. 242 Castle, J.C. 239 Driad, L. 215 Glor, J.P. 218 Benz, H.M. 238, 255, 256 Catchings, R.D. 273 Dueker, K.G. 253, 261 Glowacka, E. 237 Berge, P.A. 226, 262 Chang, C.L. 251 Dutt, James, 216 Goldfinger, C. 210, 244 Berglof, WR. 230 Charusiri, P. 266 Dutta, U. 217,251 Goldman, M.R. 273 Bernard, M. 229 Charvis, P. 254 Dziewonski, A.M. 226 Goldsby, D.L. 247 Berryman, J.G. 226, 262 Chase, E.G. 230 Gomberg, J.S. 231, 234
Seismological Research Letters Volume 70, Number 2 March/April 1999 275

Gonzalez, J. 237 Hutton, K. 272 Langenhorst, A. 239 Menke, W 260 Gorman, A.R. 261 Hyndman, R.D. 210, 211, 219, Langer, H. 214 Metcalfe, R. 256 Gossi er, J. 260 220,245,246,254 Langston, C.A. 253,261, 264 Michael, A.]. 248 Got, J.-L. 246 Lapajne, J.K. 242, 265 Miller, K.C. 210,219,243 Craindor6c, D. 254 Laprade, WT. 233 Miller, M. 210 Graizer VM. 225 Ibanez, J. 222 Larsen, S. 216 Miller, M.G. 247 Grant, L.B. 266 Idriss, I.M. 217 Lavallee, D. 226 Minasian, D. 231 Grasso, J.-R. 236, 267, 269 Israelsson, H. 213 Lay, T. 240, 268 Mitchell, BrianJ. 274 Graves, R.W 214, 220,225,251 Ito, H. 236 Lee, R. C. 230 Molzer, P.C. 219,254 Gregor, N.J. 217,256 Leeds, D.J. 215 Montague, M. 239 Gresta, S. 214, 223 J Lees, J.M. 218, 223, 238 Moran, S.C. 210, 218, 222 Guatteri, M. 247 Jaksha, L.H. 271 Leroy, T. 232 Morgan, J. 222 Guiguet, R. 218,269 James, D.E. 261 Levander, A.R. 243, 244, 246, Morikawa, H. 225 Gulick, S.P.S. 210, 246 Janod, F. 269 258,261 Mosher, D.C. 220, 254 Gurnis, M. 240 Jewel, E. 216 Levin, S.Z. 237 Mulder, T.L. 221 Gurrola, H. 252, 253, 261 Ji, C. 215, 267 Levin, V 238, 260 Mullen, J. 256
Jiracek, George R. 248 Leyendecker, E. V 211 Murphy, J.R. 267 H Johnson, C. 245 Li, Q. 253 Murray, M. 244 Haddon, R.A.W 268 Johnson, C.L. 241 Li, S. 217,256 Musumeci, C. 223 Hafner, K. 242 Johnson, Carl E. 243 Li, X. 260 Myers, S.C. 213, 227 Hageny, M.T. 224 Johnson, J.B. 223 Li, Y.-G. 270 Hagstrum, J.T. 234 Johnson, Lane 259 Ligorria, J.P. 274 N Halchuk, S. 230 Johnson, P.A.B. 272 Lin, K.W: 271 Nabelek, J. 245 Hall, J.L. 237 Johnson,S.Y. 219,220,232,233 Liu, H.J. 252 Nadeau, R.M. 235, 236 Hanley, WG. 212, 227 Jones, E.M. 226 Liu, L.F. 251 Narwold, C.F. 233 Hansen, R.A. 258 Jones, L. 272 Liu, P.C. 247 Nava, S.J. 244 Hao, X.-S. 250 Jordan, T.H. 259 Logan, Robert L. 233 Nelson, A.R. 210, 233 Hardebeck, J.L. 268 Julian, B. 222 Long, L.T. 259 Newman, A. 224, 267 Harmsen, S.C. 211,214 Lund, W.R. 235 Ni, S. 240 Harris, J.M. 227 K Nielsen, S.B. 235, 270 Harris, Ruth A. 234 Kafka, A.L. 237 M Nishenko, S.P. 235 Harrse, H.E. 228, 229 Kalinski, M.E. 256 Mabey, M.A. 256 Noir,J. 269 Harrzell, Stephen, 257 Kanamori, H. 223, 272 Madariaga, R. 247 Nolan, T. 256 Haug, B. 234 Kang, D. 264 Maechling, P. 272 Nolet, G. 222 Hauksson, E. 242, 268 Karageogy, E.D. 269 Magistrale, H. 271 Norabuena, E. 224 Havens, E. 241 Karason, H. 239 Makdisi, F. 216 Norris, R.D. 218, 257 Hazier, S.E. 228 Kawase, H. 225,251 Malagnini, L. 214, 268 Nur, A. 226 He, X. 263 Kayen, R.E. 231 Malone, S.D. 223 Nyblade, A.A. 253, 261 Hecker, S. 235 Keers, Henk 259 Manion, S. 242 Hellman, R. 269 Keller, G.R. 243, 261 Mao, A. 267 0 Hellweg, M. 223, 263 Kelsey, H.M. 233 Marone, C. 235 Odom, R.I. 258, 263 Helmberger, D.V. 215,240,252, Kenny, T. 242 Marquis, J. 242 Odum, J.K. 234, 257
265 Ketter, B.S. 254 Marra, F. 218 Oglesby, D.O. 235 Helmstetter, A. 269 Khalturin, VI. 265 Martinod, J. 269 Okubo, P.G. 238 Henstock, T.J. 246, 258, 261 Khazaradze, G. 245 Marrirosyan, A. 217,251 Olsen, K.B. 216, 226, 247 Henton, J.A. 245 Kilgore, B.D. 234 Maryak, M.E. 230 Oncescu, M.-C. 215 Hernandez, E. 224 Kim, S.G. 253 Mathewes, R.W 232 Oppenheimer, D.H. 270 Herrmann, R.B. 214, 216, 230, Kimball, J. 230 Matsushima, S. 225 Orrey, J.L. 258, 259, 264
237,274 Kind, R. 260 Matthews, M.V. 235 Ortega, Roberto 230 Hestholm, S.O. 264 Kloska, E. 250 Mayhew, M.A. 248 Owens, T.J. 253, 261 Hill, David P. 222 Koch, K. 214 McCaffrey, R. 209, 244 Hinthong, C. 266 Koehler, R.D. 233 McCann, W.R. 266 p Holmes, M. 234 Koller, M. 267 McEvilly, T.V 236, 269 Palmer, S.P. 233, 250 Horner, R.B. 221 Korneev, VA. 269 McGarr, A. 248 Papadopoulos, G.A. 231 Horta, E. 273 Kragness, David 243 McKenna, J.R. 245 Papageorgiou, A. 217, 251 Horton, S. 237 Kroeger, G.C. 249 McKenzie, D. 262 Park, J. 238, 258, 260 Hough, S.E. 222 McLaughlin, K. L. 213 Parsons, T. 210, 219, 254, 255 Hreinsdottir, S. 269 L McMechan, G. 243 Passmore, P.R. 243 Hsu, V 212 La Flame, L.M. 258 McNally, K.C. 238 Pasyanos, M.E. 228 Huang, L.-J. 263, 264 La Rocca, M. 221 McNutt, S.R. 218 Pearson, D.C. 212 Huerfano, VA. 272 Laforge, R. 266 Meagher, K.L. 218,219 Pechmann, J.C. 244 Hughes, J.F. 232 Lahaie, F. 267, 269 Meerrens, C. 224, 243 Peng, H.Y. 251,252 Humphrey, J. 217 Lambert, M.S. 269 Melbourne, T.I. 252 Peng, X. 261 Humphreys, E.D. 244, 253, 261 Lamontagne, M. 237 Meltzer, A.S. 210, 244, 246, 249 Perin, B. 224, 243
276 Seismological Research Letters Volume 70, Number 2 March/April 1999

Perkins, D.M. 270 Sampson, D. 224 Stokoe, K.H. 217,256 w Perry, S.C. 256 Sanford, A.R. 271 Stout, D.L. 248 Walck, M.C. 264 Petrosino, S. 221 Sato, H. 264 Stump, B.W 212 Wald, D.J. 251,267 Pezzopane, S.K. 221,233 Sato, T. 251 Sturtevant, B. 223 Waldhauser, F. 221, 246 Phillips, WS. 228, 229, 271 Satoh, T. 251 Sylvester, Arthur Gibbs, 249 Wallace, T.C. 213, 269 Pike, T. 242 Sawada, S. 225 Symons, N.P. 210, 255 Walsh, T.J. 250 Pitarka, A. 220 Schapiro, R. 224 Walter, WR. 212,228 Plafker, G. 232, 245 Schell, Bruce A. 238 T Wang,K.209,245,246 Ponti, D.J. 235 Schmidt, M. 245,246 Tasic, I. 242 Wang, Yumei 251 Porter, L.D. 215 Schoenberg, F.R. 266 Taylor, S.R. 228, 229 Wang, Z. 231 Powell, C. 273 Schultz, C.A. 213, 227 Tekula, S.A. 242 Weaver, C.S. 209,210,211,218, Power, J.A. 218, 222 Schuster, Robert L. 233 ten Brink, U.S. 210,219,254 219,255,256 Power, M.S. 230 Schutt, D.L. 253, 261 Thavaraj, T. 250 Weber, J. 267 Pratt, T.L. 210, 219, 234, 255 Schwartz, D.P. 235 Thia, H.K. 229 Weldon, R.J. II 256 Prejean, S.G. 236 Schwartz, S.Y. 224 Thomas, J.-C. 269 Wells, D.L. 230 Preston, L. 239 Schweig, Eugene S. 231 Thomas, P.A. 256 Wells, R.E. 209, 219, 233, 256 Preston, L.A. 240, 255 Seeber, L. 272 Thorbergsson, G. 269 Wen, K.L. 251,252 Priestley, K.F. 238, 262 Seekins, LC. 215 Thywissen, K. 215 Wen, L.-X. 240, 241 Pringle, Patrick T. 211, 233 Shakal A.F. 225 Tilmann, F.J. 238 Wesson, R.L. 270 Protti, M. 224 Shearer, P.M. 244 Tinker, M.A. 213 Williams, R.A. 234, 257 Pyke, R. 217 Sheehan, A.F. 253 Tkalcic, H. 241 Wills, C. 217
Sherrod, B.L. 210, 233 Toki, K. 225 Winchester, J.P. 239 Q Shibazaki, B. 236 Tortorici, L. 214 Withers, M. 237 Qamar, A. 209,218,219,245 Shiver, WS. 243 Trehu, A.M. 210, 219, 254 Wong, I.G. 221,256
Sicherman, A. 212 Trombino, C. 226 Woods, B.B. 212,229 R Sidorin, I. 240 Troost, K.G. 234, 256 Worley, D.M. 257 Ragnarsson, S. 222 Silva, WJ. 217,225,256 Trumbull, Sam, 265 Wright, D.H. 256 Randall, G.E. 229, 254 Silver, P.G. 240, 244, 261 Tsai, LC. 271 Wu, R.S. 262 Ratchkovsky, N.A. 258 Simmons, Nathan 252 Tullis, T.E. 247 Wysession, M.E. 239,240 Reasenberg, P.A. 235 Simons, F.J. 262 Tumarkin, A.G. 225 Reasoner, C. 241 Simpson, D.W 244 Tytgat, G. 218 X Reiter, D.T. 229 Sket Momikar, B. 265 Xie,J. 268 Revenaugh, J. 241 Slunga, R. 222 u Xu, F. 270 Rhea, S.B. 220, 257 Smith, A.J. 246 Uhrhammer, R.A. 270, 271 Rieven, S.A. 229 Smith, C.L. 245 y Ritsema, J. 240, 261 Smith, N.F. 220 V Yacoub, N.K. 213 Robinson, G. 264 Snelson, C.M. 261 van der Hilst, R.D. 239, 262 Yang, X. 213 Roblee, C.J. 217,225 Sobolev, S. 260 van der Laat, R. 224 Yeats, R.S. 250 Rodgers, A.J. 228 Sojourner, A. 256 van der Vink, G.E. 249 Yokoyama, K. 225 Rodgers, A.W 212 Somerville, P.G. 216, 220, 224 Van-Der-Baan, M. 269 Young, C.J. 227 Rodrigues, D. 213 Song, X.J. 265 Vanzandt, T. 242 Youngs, R.R. 216 Rogers, G.C. 209, 220, 221, 250 Soukup, D.J. 258 Vasalani, J.L. 239 Yount, J.C. 256 Rognvaldsson, S. 222, 269 Sparks, A. 256 Vasco, Don 259 Yuan, X. 260 Rohay, A.C. 228 Spence, G. 210, 254 Vega, A. 214 Romanowicz, B. 216,241,244 Spudich, P. 216, 247 Velasco, A.A. 228, 229, 254, 268 z Ross, S.L. 273 Stakes, D.S. 238 Velasquez, M. 273 Zabukovec, B. 265 Rowe, C. 271 Stanley, D. 255, 256 Ventura, C.E. 250 Zeitler, P.K. 249 Rubin, A.M. 246 Stead, R. 213 Vidale, J.E. 270 Ze!t, B.C. 238 Russell, S.A. 240 Steck, L.K. 218, 229 Vilanova, S.P. 265 Ze!t, C.A. 255, 258 Ruud, B.O. 264 Stefansson, R. 222, 269 Villasenor, A. 255, 256 Zhai, E. 250 Ryan, H.F. 273 Steidl, J.H. 251 Vlahovic, G. 273 Zhang, X. 227 Rymer, M.J. 273 Stein, S. 224, 243, 244, 250, 267 Vogfjord, K. 222, 269 Zhao, Dapeng, 272
Stenner, H.D. 235 Volant, P. 267 Zheng, T. 215,258 s Stephenson, WJ. 234, 256, 257 von Hillebrandt-Andrade, C.G. Zielhuis, A. 262 Saccorotti, G. 221 Stevenson, A.J. 273 272 Zupancic, P. 265 Saikia, C.K. 212, 216, 229 Stickney, M.C. 237 Vucetic, M. 217 Zwick, P. 244 Saltzer, R.L. 259, 261 Stidham, C. 216
Seismological Research Letters Volume 70, Number 2 March/April 1999 277