Embed Size (px)
Citation preview

Data report
Seismicity in Iceland during 2001
Bergþóra S. Þorbjarnardóttir, Gunnar B. Guðmundsson and Steinunn S. JakobsdóttirDepartment of Geophysics, Icelandic Meteorological Office, Bústaðavegur 9, 150 Reykjavík, Iceland;
[email protected], [email protected], [email protected]
Abstract — Over 14,000 earthquakes were located in 2001 by the SIL seismic system. During the first halfof the year the majority of the located earthquakes were aftershocks of the magnitude 6.6 earthquakes of June2000. The Mýrdalsjökull region was more seismically active than usual in the first half of the year and theReykjanes ridge was fairly active in the latter half of the year. Many small earthquake swarms occurred aswell, the two largest along the Tjörnes Fracture Zone, offshore northern Iceland. The larger of these swarmsoriginated in Öxarfjörður with a total number of earthquakes greatly exceeding previous swarms in the area,recorded by the SIL system. Five stations were added to the SIL network and one station was dismantled. Atthe end of the year 42 seismic stations comprised the SIL network.
INTRODUCTIONThe SIL seismic system is a network of 3-
component digital seismic stations and a data pro-cessing system (Jakobsdóttir et al., 2002). In 1990eight stations were installed in the South Iceland Low-lands. The number has since gradually increased to42 in 2001 (Figure 1). The stations are concentratedalong the seismic zones and rift zones through Ice-land. Since its installment the system has recordednearly 200,000 events (May, 2003). The density of theSIL network varies between areas, producing vary-ing detection levels. In some areas, for example theReykjanes peninsula and the South Iceland Lowlands,the detection threshold is about 0. In other areas,such as the highlands, the stations are more widelyspaced and only earthquakes greater than 1.5 may bedetected.
At the beginning of 2001, a total of 38 stationswere operating within the SIL network (Figure 1).Three stations were installed late in the year 2000, butwere not fully operational until 2001. These stationsare; Vestmannaeyjar (ves), offshore southern Iceland,and Flatey (fla) and Brettingsstaðir (bre) in the north.Other stations added during the year were Grímsfjall(grf) on the Vatnajökull ice cap and Eystri Skógar
(esk), southwest of the Mýrdalsjökull glacier. TheHafnarfjörður (haf) station in southwest Iceland wasdismantled due to increasing traffic in the area. Thusa total of 42 stations comprised the SIL network at theend of the year 2001 (Figure 1).
TJÖRNES FRACTURE ZONEThe largest earthquake swarms in 2001 occurredwithin the Tjörnes Fracture Zone, offshore northernIceland (Figures 1 and 2). The Tjörnes Fracture Zoneis a transform fault zone connecting the rift zone innorth Iceland with that of the Kolbeinsey Ridge. Mostof the seismicity in north Iceland is associated withthis zone (Rögnvaldssson et al., 1998). In Septem-ber and October 2001 an earthquake swarm occurredin Öxarfjörður with over 2000 earthquakes. This isthe largest swarm that has been recorded in the Öxar-fjörður area by the SIL system since it was expandedin 1994 to cover the northern rift zone (Figure 3). Asthe swarm progressed the seismicity migrated to thesouthwest.
In December another large swarm was locatedwithin the Tjörnes Fracture Zone, north of Eyjafjörður(Figures 1 and 2). Over 1200 earthquakes were lo-cated.
JÖKULL No. 52, 2003 55

Bergþóra S. Þorbjarnardóttir, et al.
1991 - 2000
2001
Discontinued
NVZ
EVZSISZ
WVZVatnajökull
Mýrdals−jökull
Öxar−fjörður
Eyja−fjörður
Ridge
eskves
haf
bre fla
grf
Reykjanes
Rid
ge
TFZKo
lbei
nse
y
Figure 1. The map shows the SIL seismic station network. The main tectonic featues of Iceland are also shown:The Tjörnes Fracture Zone (TFZ), the Northern Volcanic Zone (NVZ), the Eastern Volcanic Zone (EVZ), theWestern Volcanic Zone (WVZ) and the South Iceland Seismic Zone (SISZ). – SIL jarðskjálftamælanetið ásamtgos- og brotabeltum landsins. Tjörnesbrotabeltið (TFZ), nyrðra gosbeltið (NVZ), eystra gosbeltið (EVZ), vest-ara gosbeltið (WVZ) og Suðurlandsbrotabeltið (SISZ).
MÝRDALSJÖKULL
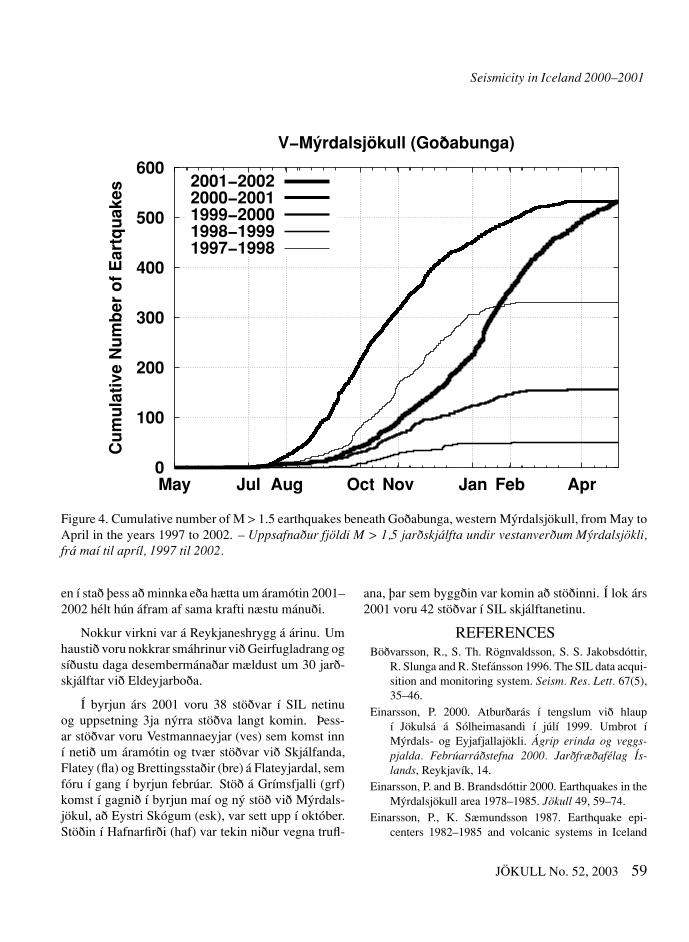
Seismic activity beneath the Mýrdalsjökull glacier isconcentrated in two areas, within the Katla calderaand in the currently more active Goðabunga area, inthe western part of the glacier. The seismicity underGoðabunga has followed a seasonal pattern during thelast decades (Figure 4). The number of earthquakesin the latter half of the year is many times higher thanin the first half. Two factors are likely involved, thedecreased load of the ice and the increased pore pres-sure in the crust beneath the glacier. Einarsson andBrandsdóttir (2000) argued that the pore pressure isthe more influential factor, causing fluctuations in thebrittle crust beneath the glacier.
In July of 1999 a minor magmatic event (Einars-son, 2000) resulted in a small jökulhlaup in the riverJökulsá á Sólheimasandi, southwest of the Mýrdals-jökull glacier. A new cauldron was formed and otherknown cauldrons in the glacier increased in size (Guð-mundsson et al., 2000).
Changes have occurred in seismicity in the Goða-bunga area over the last semesters. The activity in2000 continued into the year 2001 and did not de-crease until a few months later. The activity increasedagain in August but at the end of the year it continuedwith the same intensity the following months.
56 JÖKULL No. 52, 2003

Seismicity in Iceland 2000–2001
24W
22W
20W
18W
16W
14W
64N
65N
66N
67N
M0
12
34
5
LEG
EN
DE
arth
qu
akes
200
1
Vol
cani
c sy
stem
(Ein
arss
on a
nd S
mun
dsso
n, 1
987)
Fis
sure
sw
arm
Cen
tral
vo
lcan
oC
ald
era
Fis
sure
s an
d fa
ults
Figu
re2.
Ear
thqu
ake
epic
ente
rs(r
eddo
ts)r
ecor
ded
byth
eSI
Lse
ism
icsy
stem
duri
ng20
01.–
Jarð
skjá
lfta
r(r
auði
rpu
nkta
r)m
æld
irm
eðSI
Lke
rfin
uár
ið20
01.
JÖKULL No. 52, 2003 57

Bergþóra S. Þorbjarnardóttir, et al.
-200
-200
-150
-150
-150
-100
-100
-50
-50
0
0
0
K pasker
17.0 W 16.8 W 16.6 W 16.4 W
66.1 N
66.2 N
66.3 N
66.4 N
0 5 10
km
Öxar−fjörður
0
500
1000
1500
Num
ber
of E
arth
quak
es
1994 1995 1996 1997 1998 1999 2000 2001 2002
Figure 3. Earthquake epicenters in the Öxarfjörðurregion during September and October 2001 andnumber of earthquakes per month from 1994 to2001. – Staðsetningar jarðskjálfta í hrinu í Öxarfirðií september og október 2001. Neðri myndin sýnirmánaðarlegan fjölda jarðskjálfta frá 1994 til 2001.
SOUTH ICELAND
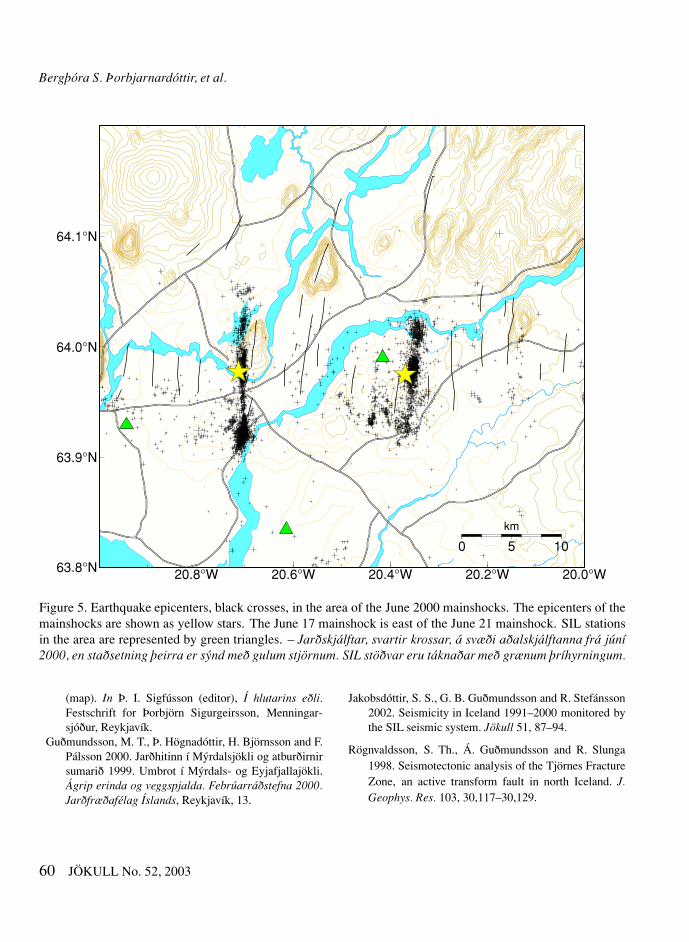
A great number of small aftershocks was located in2001 along the faults of the June 2000 earthquakes inthe South Iceland Lowlands. Nearly 2000 aftershocksof the June 17 mainshock (�� = 6.6) were located.Over 2500 aftershocks of the June 21 mainshock (��
= 6.6) were located (Figure 5). Earthquake swarmswere especially frequent along the fault of the June 21mainshock. The majority of earthquakes was smallwith magnitudes less than 1. The activity has beengradually decreasing.
The Reykjanes ridge (Figures 1 and 2) was fairlyactive during the year. In the fall a few earthquakeswarms were located 30 km off Reykjanes peninsula.In the last days of December around 30 earthquakeswere located about 65 km off Reykjanes peninsula.
Acknowledgements
This paper is based on the work of employees ofthe Department of Geophysics, Icelandic Meteoro-logical Office, in 2001. They are Barði Þorkelsson,Bergþóra S. Þorbjarnardóttir, Erik Sturkell, Gunn-ar B. Guðmundsson, Halldór Geirsson, HjörleifurSveinbjörnsson, Jósef Hólmjárn, Kristín S. Vogfjörð,Matthew Roberts, Páll Halldórsson, Ragnar Stefáns-son, Sighvatur K. Pálsson, Steinunn S. Jakobsdóttir,Sigþrúður Ármannsdóttir, Vigfús Eyjólfsson and Þór-unn Skaftadóttir. They contributed to the operation ofthe SIL system and the building up of the earthquakedatabase. Reynir Böðvarsson and Ragnar Slunga arethe main designers of the SIL system.
ÁGRIPJarðskjálftavirkni á Íslandi árið 2001
Rúmlega 14.000 jarðskjálftar mældust árið 2001 meðSIL jarðskjálftakerfi Veðurstofu Íslands. Stærstu jarð-skjálftahrinurnar voru norðan við land, í Tjörnesbrota-beltinu. Fyrri hrinan hófst um miðjan september í Öx-arfirðinum, þar sem yfir 2000 skjálftar voru staðsettir.Seinni hrinan var í desember fyrir mynni Eyjafjarðarog mældust þar rúmlega 1200 skjálftar. Mikið var umsmáskjálfta, flestir innan við stærð 1, á sprungunumtveimur í Holtum og við Hestvatn, þar sem 17. og 21.júní 2000 stórskjálftarnir áttu upptök sín. Nærri 2000eftirskjálftar mældust á Holtasprungunni og yfir 2500á Hestvatnssprungunni. Smáskjálftahrinur voru tíðar,sérstaklega á Hestvatnssprungunni. Virkni á sprung-unum fer hægt minnkandi.
Jarðskjálftavirkni undir Mýrdalsjökli var nokkurfyrstu mánuði ársins, en yfirleitt minnkar virknin þá.Um haustið jókst svo virkni aftur eins og vanalegt er,
58 JÖKULL No. 52, 2003
Öxarfjörður 1994-2001
Seismicity in Iceland 2000–2001
0
100
200
300
400
500
600
May Jul Aug Oct Nov Jan Feb Apr
Cu
mu
lati
ve N
um
ber
of
Ear
tqu
akes
V−Mýrdalsjökull (Goðabunga)
2001−20022000−20011999−20001998−19991997−1998
Figure 4. Cumulative number of M > 1.5 earthquakes beneath Goðabunga, western Mýrdalsjökull, from May toApril in the years 1997 to 2002. – Uppsafnaður fjöldi M > 1,5 jarðskjálfta undir vestanverðum Mýrdalsjökli,frá maí til apríl, 1997 til 2002.
en í stað þess að minnka eða hætta um áramótin 2001–2002 hélt hún áfram af sama krafti næstu mánuði.
Nokkur virkni var á Reykjaneshrygg á árinu. Umhaustið voru nokkrar smáhrinur við Geirfugladrang ogsíðustu daga desembermánaðar mældust um 30 jarð-skjálftar við Eldeyjarboða.
Í byrjun árs 2001 voru 38 stöðvar í SIL netinuog uppsetning 3ja nýrra stöðva langt komin. Þess-ar stöðvar voru Vestmannaeyjar (ves) sem komst inní netið um áramótin og tvær stöðvar við Skjálfanda,Flatey (fla) og Brettingsstaðir (bre) á Flateyjardal, semfóru í gang í byrjun febrúar. Stöð á Grímsfjalli (grf)komst í gagnið í byrjun maí og ný stöð við Mýrdals-jökul, að Eystri Skógum (esk), var sett upp í október.Stöðin í Hafnarfirði (haf) var tekin niður vegna trufl-
ana, þar sem byggðin var komin að stöðinni. Í lok árs2001 voru 42 stöðvar í SIL skjálftanetinu.
REFERENCESBöðvarsson, R., S. Th. Rögnvaldsson, S. S. Jakobsdóttir,
R. Slunga and R. Stefánsson 1996. The SIL data acqui-sition and monitoring system. Seism. Res. Lett. 67(5),35–46.
Einarsson, P. 2000. Atburðarás í tengslum við hlaupí Jökulsá á Sólheimasandi í júlí 1999. Umbrot íMýrdals- og Eyjafjallajökli. Ágrip erinda og veggs-pjalda. Febrúarráðstefna 2000. Jarðfræðafélag Ís-lands, Reykjavík, 14.
Einarsson, P. and B. Brandsdóttir 2000. Earthquakes in theMýrdalsjökull area 1978–1985. Jökull 49, 59–74.
Einarsson, P., K. Sæmundsson 1987. Earthquake epi-centers 1982–1985 and volcanic systems in Iceland
JÖKULL No. 52, 2003 59
Bergþóra S. Þorbjarnardóttir, et al.
20.8°W 20.6°W 20.4°W 20.2°W 20.0°W63.8°N
63.9°N
64.0°N
64.1°N
0 5 10
km
Figure 5. Earthquake epicenters, black crosses, in the area of the June 2000 mainshocks. The epicenters of themainshocks are shown as yellow stars. The June 17 mainshock is east of the June 21 mainshock. SIL stationsin the area are represented by green triangles. – Jarðskjálftar, svartir krossar, á svæði aðalskjálftanna frá júní2000, en staðsetning þeirra er sýnd með gulum stjörnum. SIL stöðvar eru táknaðar með grænum þríhyrningum.
(map). In Þ. I. Sigfússon (editor), Í hlutarins eðli.Festschrift for Þorbjörn Sigurgeirsson, Menningar-sjóður, Reykjavík.
Guðmundsson, M. T., Þ. Högnadóttir, H. Björnsson and F.Pálsson 2000. Jarðhitinn í Mýrdalsjökli og atburðirnirsumarið 1999. Umbrot í Mýrdals- og Eyjafjallajökli.Ágrip erinda og veggspjalda. Febrúarráðstefna 2000.Jarðfræðafélag Íslands, Reykjavík, 13.
Jakobsdóttir, S. S., G. B. Guðmundsson and R. Stefánsson2002. Seismicity in Iceland 1991–2000 monitored bythe SIL seismic system. Jökull 51, 87–94.
Rögnvaldsson, S. Th., Á. Guðmundsson and R. Slunga1998. Seismotectonic analysis of the Tjörnes FractureZone, an active transform fault in north Iceland. J.Geophys. Res. 103, 30,117–30,129.
60 JÖKULL No. 52, 2003