Embed Size (px)
Citation preview

Khorshid et al. Iraqi Journal of Science, 2016, Vol. 57, No.4B, pp: 2692-2704
__________________________________
Email: [email protected]*
2692
Seismic stratigraphy study of the east Razzaza within late Jurassic –early
Cretaceous era (Central Iraq)
Salman Z. Khorshid*, Ghazi H. AL-Sharaa, Layalen H. Ali
Department of Geology, College of Science, University of Baghdad, Baghdad, Iraq.
Abstract This study deals with seismic structural and stratigraphic interpretation that
applied on the East Razzaza (central of Iraq) area, by using 2D seismic data from Oil
Exploration Company. Three main seismic reflectors are picked. These reflectors are
Zubair, Yamama and Gotnia Formations, which were defined by using petrophysical
well logs and synthetic traces that calculated from sonic- logs of the wells East
Baghdad-1(Eb-1) and West kifl-1(Wk-1) using Geoframe program, to suggest a
stratigraphic model for them. Structural maps of formations are prepared to obtain
the location and direction of the sedimentary basin and shoreline. Seismic
interpretation of the area approves the presence of some stratigraphic features in the
studied formations. Some distributary buildup mound and carbonate platform.
Yamama is interpreted here to represent a carbonate platform. Seismic attributes
technique was used to predict the physical properties distribution of Yamama
succession. Instantaneous frequency and amplitude maps of Yamama shows low
anomaly, this may indicate porous calcareous rocks in that location that contain
fluids.
Keyword: Seismic stratigraphy-East Razzaza-Late Jurassic-Early Cretaceous.
وسط العراقالطباشيري المبكر – الجوراسي المتأخرزلزالية طباقية لشرق الرزازة ضمن عصر دراسة
ليالين حمادي عمي ، غازي حسن مطمك سممان زين العابدين خورشيد، العراق بغداد، كمية العموم، جامعة بغداد، ، االرض عمم قسم
ةالخالصوسط -الدراسة تتعامل مع التفسيرات التركيبية والطباقية التي طبقت عمى منطقة شرق الرزازةهذِة
العراق. بواسطة استخدام المعمومات الزلزالية ثنائية البعد المتوفرة في شركة االستكشفات النفطية. حيث التقطت استخدام المجسات البتروفيزيائية ثالث عواكس لمتكاوين الزبير واليمامة والقطنية. والتي التقطت من خالل
( بواسطة 1-، غرب الكفل1-واالثار المصنعة لممجسات الصوتية لمبئرين )شرق بغداد،وذلك لغرض عمل موديل طباقي لمعواكس.اعدت خرائط تركيبية لمحصول عمى موقع Geoframe)برنامج)
لممنطقة وجود ظواهر طباقية في واتجاه الحوض الرسوبي وتحديد خط الساحل. اثبتت التفاسير الزلزالية التكاوين المدروسة منها تقبب متراكم ومنصة كاربونية وكذلك فّسر تكوين اليمامة بوجود منصة كاربونية متراكمة، كذلك استخدمت تقنية المالمح الزلزالية لتخمين الخواص الفيزياوية لتتابع اليمامة، خرائط التردد والسعة
ISSN: 0067-2904

Khorshid et al. Iraqi Journal of Science, 2016, Vol. 57, No.4B, pp: 2692-2704
37:4
هرت انخفاضات شاذة،وهذِة تعتبر مؤشر عمى مسامية الصخور الجيرية الحاممة االنية لتكوين اليمامة اظ . لمموائع في المنطقة
Introduction
The seismic reflection method absorbs more than 90% of the money spent world-wide on applied
geophysics. Most surveys are aimed at defining oil bearing structures at depths of thousands of meters
using hundreds or even thousands of detectors [1]. With reflection methods one can locate and map
such features as anticlines, faults, salt domes, and reefs where many of these are associated with the
accumulation of oil and gas [2]. The studied area (East Razzaza) is located in the middle parts of Iraq,
and belong to three governorates (Baghdad, Karbala and Anbar governorates) on the western side of
Mesopotamian basin between Euphrates river and Razazza lake, Figure -1. The aim of this research is
to apply a new software interpretation system (Geoframe) to interpret a (2D) seismic data available in
Oil Exploration Company for surveys carried out in East Razzaza for the purpose of application of
seismic attributes to predict the hydrocarbon accumulations that may present within Zubair, Yamama
and Gotnia Formations and determining the seismic structure, stratigraphic picture and facies changes
for the Zubair, Yamama and Gotnia Formations in the area which are covered by two dimensional
survey for locating the probable reservoir.
Figure 1- Iraq map shows the study area.
Data Acquisition
Base map preparation
Processed seismic data are loaded in the interactive workstation of interpretation in SEG-Y format
and before starting; special subprograms must be operated to define the required data for loading. This
process is called (project creation) for achieving the interpretation process on an interactive
workstation. After that, the base map of the study area is constructed. This process includes entering
strike line and dip line numbers, the separated distance between bin sizes along strike line direction
and dip line direction. Base map includes definition of the geographic coordinates in UTM coordinates
system of study area, Figure -2.
.

Khorshid et al. Iraqi Journal of Science, 2016, Vol. 57, No.4B, pp: 2692-2704
37:5
Figure 2- Illustrates a base map of study area, (2D survey).
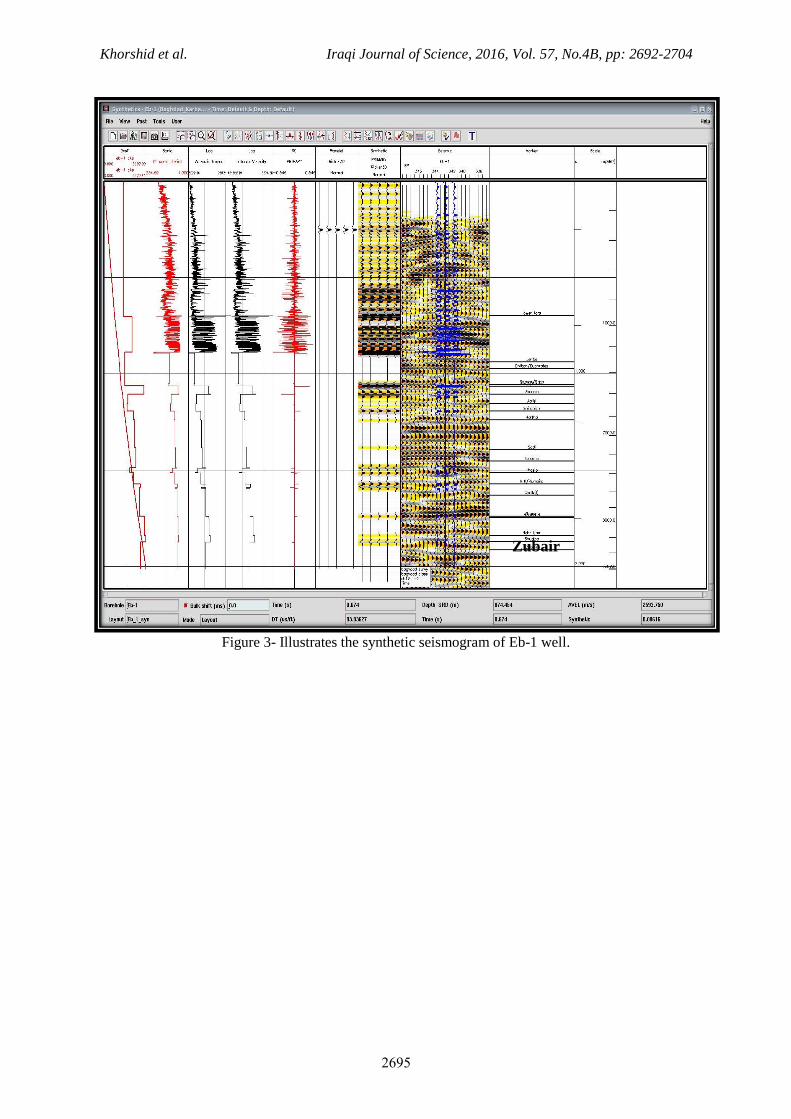
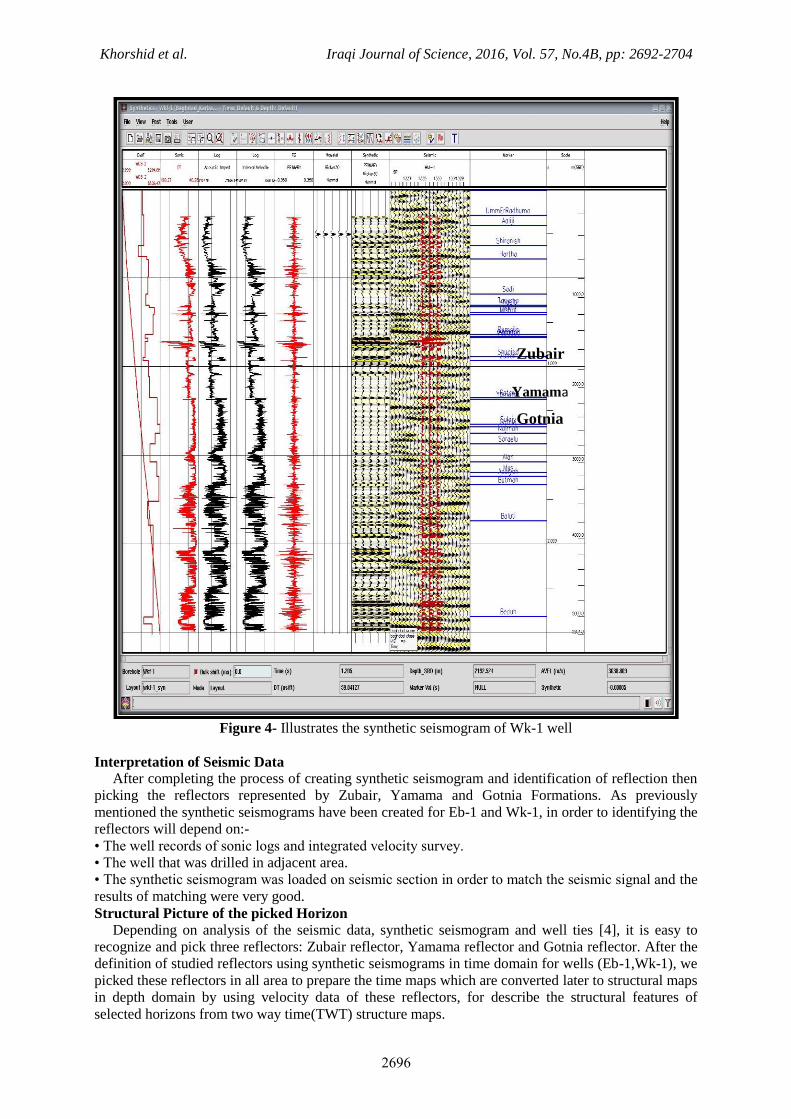
Synthetic seismograms
Synthetic seismograms Figures- 3and4 are artificial reflection records made from velocity logs by
conversion of the velocity log in depth to a reflectivity function in time and by convolution of this
function with a presumed appropriate wavelet or source pulse [3]. Synthetic seismograms were
generated for Eb-1 and Wk-1 wells using GeoFrame software package. Basically, seismic well tie
allows well data, measured in units of depth, to be compared to seismic data, measured in units of
time. The sonic and density logs were transformed from depth to time domain. This conversion will
permits correlation of horizon tops identified in well with reflections present in the seismic section.
The picked reflectors wavelets appeared as peaks on synthetic trace (positive reflection) but in
different intensity. The Zubair corresponds to a trough. This is very reasonable because the rocks in
Zubair are shale as well as the sandstone is characterized by high porosity and lower density. For this
reason the reflection coefficient of sandstone in this interface is negative (trough).The Gotnia and
Yamama corresponds to a (peak) because the rocks in Gotnia and Yamama are limestone which is
characterized by low porosity and higher density. For this reason the reflection coefficient of this
interface is positive (peak).
Khorshid et al. Iraqi Journal of Science, 2016, Vol. 57, No.4B, pp: 2692-2704
37:6
Figure 3- Illustrates the synthetic seismogram of Eb-1 well.
Zubair
Khorshid et al. Iraqi Journal of Science, 2016, Vol. 57, No.4B, pp: 2692-2704
37:7
Figure 4- Illustrates the synthetic seismogram of Wk-1 well
Interpretation of Seismic Data
After completing the process of creating synthetic seismogram and identification of reflection then
picking the reflectors represented by Zubair, Yamama and Gotnia Formations. As previously
mentioned the synthetic seismograms have been created for Eb-1 and Wk-1, in order to identifying the
reflectors will depend on:-
• The well records of sonic logs and integrated velocity survey.
• The well that was drilled in adjacent area.
• The synthetic seismogram was loaded on seismic section in order to match the seismic signal and the
results of matching were very good.
Structural Picture of the picked Horizon
Depending on analysis of the seismic data, synthetic seismogram and well ties [4], it is easy to
recognize and pick three reflectors: Zubair reflector, Yamama reflector and Gotnia reflector. After the
definition of studied reflectors using synthetic seismograms in time domain for wells (Eb-1,Wk-1), we
picked these reflectors in all area to prepare the time maps which are converted later to structural maps
in depth domain by using velocity data of these reflectors, for describe the structural features of
selected horizons from two way time(TWT) structure maps.
Gotnia
Yamama
Zubair

Khorshid et al. Iraqi Journal of Science, 2016, Vol. 57, No.4B, pp: 2692-2704
37:8
Time, velocity and depth maps
Time maps
The time maps may carry important information on the subsurface geo-logic features. Zubair,
Yamama and Gotnia Formations two way time maps. Figure -5 shows Yamama TWT map as an
example which is dominated by NE-SW trending high to the East and drops to the West. The structure
rises sharply to the North East. In the middle area the structure depicts ridges extends NW-SE trend on
the surface it takes nose structure shape. These ridges represent accumulation of sediments which may
contain oil.
Figure 5- Shows the Yamama two way time map.
Velocity maps
To obtain depth maps, the picked time data of any reflector is needed to the velocity data. The more
accurate velocity to be used in time to depth conversion is the average velocity, which can be
computed directly from well velocity survey (check shot) [5]. For the two wells the area (Eb-1 and
Wk-1), check shot data are used to prepare the velocity maps. The velocity map of Gotnia shows the
average of velocity increases in SW trend, Figure -6.
Figure 6- Shows the Gotnia Velocity Map.

Khorshid et al. Iraqi Journal of Science, 2016, Vol. 57, No.4B, pp: 2692-2704
37:9
Depth maps
The time map of a given reflector is used with its average velocity map to extract the depth map, as
follows:
Depth at any point = (velocity × TWT /2) at this point.
Zubair, Yamama and Gotnia depth maps reveal a structural feature having a general trend in the SE-
NW direction. We noticed a decrease at the West and gradually increases toward the East and North
East of the basin. The noses of structure observed in the middle part of the area, Figure -7 shows
Yamama depth map as an example.
Figure 7- Shows the Yamama- depth structure map.
Stratigraphic Interpretation Seismic stratigraphy can add important geological information and enhance the understanding of
the depositional environments, which may help in the understanding the origin, accumulation, and
trapping mechanisms of the hydrocarbon deposits. The seismic traces are trying to tell us the details of
the subsurface [6]. Based on seismic character and reflections patterns two distinct intervals were
observed and distinguished in the preview 2D seismic survey; these intervals are:
1. An upper interval of parallel folding reflections comprising the (Zubair–Yamama) Formations.
This sequence separates middle cretaceous from lower cretaceous Zubair Formation which
represent the first sequence.
2. A basal interval of semi-parallel slightly diverging reflection comprising the (Yamama- Gotnia)
Formations.
Sequence Stratigraphy of the Studied Formations
- Zubair Formation
The Zubair Formation is interpreted to show thickness and depositional sequence represented by
using the log data for the identification of the individual parasequences within Zubair area. Both Eb-1,
Wk-1 wells are essentially composed of alternating shales and sandstones with some siltstones. The
variation in lithology displays some regularity, towards the shore. In the west the formation is
composed mostly of sands only. Towards the basin the formation contains more and more shales and
becomes almost purely shale near the east of the area.

Khorshid et al. Iraqi Journal of Science, 2016, Vol. 57, No.4B, pp: 2692-2704
37::
-Yamama Formation
Yamama Formation is interpreted as three depositional sequences representing the base which is an
initial low stand (LS), remaining to top as carbonate package; it represents the highstand (HS) and
transgressive systems tracts (TST). Within the Yamama sequence, three reflection sequences that can
be mapped across the entire platform top, Figure-8. The Yamama sequence appears to initially
backstep and then prograde from SW-NE in the highstand. These latter seismic events can be
interpreted as prograding clinoforms. Major interpreted environment of deposition are interpreted
including the shelf margin, upper slope and inner shelf, and basin. Note that transgressive and high
stand system tracts dominate, with transgressive system tracts being associated with major periods of
shelf margin aggradations, as build-up and rising sea level. In terms of petroleum systems we are most
likely to encounter source rocks in the deep water basinal settings. Reservoir distribution is harder to
predict because of the effects of complex diagenesis associated with carbonate rocks. Primary
reservoir facies would be concentrated within and around the rim margin (reefs, rudist build-ups and
oolitic shoals) Figure -9.
Figure 8- Illustrates sequence stratigraphy of the section.
Figure 9- Shows reservoir facies.

Khorshid et al. Iraqi Journal of Science, 2016, Vol. 57, No.4B, pp: 2692-2704
3822
-Gotnia Formation
Gotnia sequence represents a complete carbonate sequence which was deposited on the shelf and
continental slope of the basin. It is clear on seismic section and in Wk-1 well. The lithological data
from wells indicates that Eb-1, Wk-1 consist mainly of argillaceous limestone, evaporate and marls,
which is an indicator of deep water environment. It is thought that the continued progradation causes
the basin itself to become smaller in areal extent and therefore creates an evaporitic basin. This
interpretation appear continued progradation further away the basin off from marine circulation and
creates an evaporitic basin.
Seismic Reflection Configuration
In the studied area of two Formations (Zubair- Gotnia), two main types of seismic reflection
configuration are observed.
1- Zubair reflector display parallel configuration.
2- Yamama to Gotnia display the progradational configuration.
Zubair reflector is characterized by high to moderate amplitude and continuity. Reflection
configurations of Zubair indicate wide, relatively uniform lateral extent in sedimentary basin, and
limestone strata; sandstone is rare. The shelf facies consist of neritic shale and generally transgressive.
While Zubair represents delta platform facies consisting of shallow- water, high-energy marine (delta-
front) sandstone. The second type of reflection configuration in the studied package which includes
Yamama and Gotnia reflectors is progradational configuration, with two fundamentals types of
progradational configuration called oblique and sigmoid. The concluded sigmoid model is associated
with progradation of shelf system. The depositional energy may be high, and the evidence on that is
the reefal limestone and predominance of oolites in Yamama, Figure -10.
Figure 10- Shows sigmoid model in the study area.
Seismic Attribute Sections
Instantaneous phase
Instantaneous phase is measured in degree (-π, π) it is independent of amplitude and shows
continuity and discontinuity of event, it show bedding very well and its best indicator of lateral
continuity. Figure -11 is useful to explain the system tract model.

Khorshid et al. Iraqi Journal of Science, 2016, Vol. 57, No.4B, pp: 2692-2704
3822
Figure 11- Application of Instantaneous phase attribute on the 2D seismic section in the study area.
Instantaneous Frequency Sections It is used for visualizing regional depositional patterns [7]. Frequency tuning can indicate changes
in bed thickness. Spikes indicate noise or discontinuous points where frequency can become zero,
negative or anomalously large, Figure- 12.
Figure 12- Shows Instantaneous frequency attribute in the study area.
Mound Reflection from top and side of the depositional feature, and onlap of overlying reflection on to
buildups [8]. Many seismic attributes displayed are useful to explore the stratigraphic phenomena in
the area like channel, mound, and unconformity. Figure -13 explains the mound by applying phase
attribute photo gray on composite section.

Khorshid et al. Iraqi Journal of Science, 2016, Vol. 57, No.4B, pp: 2692-2704
3823
Figure 13-Seismic section phase attribute photo Gray in the study area.
Geological model
Geophysical data are best interpreted in tight integration with the geological data. Combining the
most practical and effective geophysical data, 2D geological modelling works to achieve business-
focused results. 2D geological models are attributed with petrophysical properties and adjusted to
match the geophysical field data. Our structural, formational, and facies modelling software tools
ensure that 2D geological models respect a consistent structural, stratigraphic, and topological
framework in addition to ensuring consistency between the geological models and geophysical data.
Working with an extensive set of 2D, exploratory data analysis to ensure data integrity and enhance
interpretational insight, providing results in common 2D formats for the easy communication of
ideas. All required link data that work on it to make the best image to the subsurface. Figure -14 shows
the best image for geological model that is correspond with the interpreted seismic data. On the basis
of interpreted data it will be able to identify two of the stratigraphy traps, and identify two well (A-
Well in the sequence-1 of Yamama Formation and B-Well in the Sequence-2 of Yamama Formation).

Khorshid et al. Iraqi Journal of Science, 2016, Vol. 57, No.4B, pp: 2692-2704
3824
Figure 14- Shows the stratigraphy traps and the proposed wells by geological model.
Conclusions and Recommendations Gotnia, Yamama, and Zubair wavelets appeared on synthetic seism-ograms as peaks (Yamama and
Gotnia) and trough (Zubair) in different intensity, because they have higher density than the above and
under reflectors densities. The TWT depth maps and average velocity maps of the studied area showed
the structural picture of East Razazza. The trending structural noses was toward NW-SE, these noses
are compatible with carbonate build up features, which identified in the region. Depth maps reveal that
the minimum depth values are noticed at the west and gradually increase toward the east and northeast
till the middle part of the axis where structural anomalies and rises are observed. The deepening
increases from west to northeast, which reflects the transition from the continental slope towards the
basin. This is confirmed by the behavior of the TWT and average velocity maps. Two seismic facies
were determined: Zubair reflectors display parallel and Yamama and Gotnia facies is progradational
configuration (sigmoid) subjected to truncation erosion to steam onlap onto carbonate platform
surface. Yamama Formation is interpreted as three depositional sequences representing the base which
is an initial low stand, remaining to top as carbonate package; it represents the highstand and
transgressive systems tracts. The geological model that was drawn is the final outcome of the research,
where identifying two stratigraphic traps promising hydrocarbon.
We recommend to use three-dimensional surveys to obtain high resolution power to confirm the
stratigraphic features on the time sections, study more wells surrounding the studied area and correlate
many wells probes, also drilling of wells that have been identified and that penetrate to Yamama
Formation.
References
1. Milsom, John . 2003, Field Geophysics, 3rd. Ed. University College London, 232 p.
2. Dobrin, M.. 1976, Introduction to Geophysical Prospecting, 3rd
ed., McGraw Hill. Int. co.,
International Student Edition 386 p.
3. Dobrin, M.B. and Savit, C.H. 1988, Introduction to Geophysical Prospecting, 4th ed. McGraw-Hill
Co.,p. 865.

Khorshid et al. Iraqi Journal of Science, 2016, Vol. 57, No.4B, pp: 2692-2704
3825
4. Kearey, P., Brooks, M. and Lan H., 2002. An Introduction to Geophysical Exploration, 3rd
ed.,
Blackwell Science Ltd., 256p.
5. McQuillin, R., Bacon, M, and Barclay, W. 1984, An Introduction to Seismic Interpretation,
Graham and Trotman, 287 p.
6. Gadallah, M.R., and Fisher, R. 2009, Exploration Geophysics ,Verlag Berlin Heidberg, 292p.
7. Sheriff, R.E., 1980, Seismic Stratigraphy, IHRDC, Boston, 277 p.
8. Mitchum Jr., R. M. 1977, Seismic Stratigraphy and Global Changes of Sea Level: Part 11.
Glossary of Terms used in Seismic Stratigraphy: Section 2. Application of Seismic Reflection
Configuration to Stratigraphic Interpretation, Memoir 26 Pages 205 - 212.