Embed Size (px)
Citation preview

SEISMIC SITE RESPONSE, ANALYSIS AND
CHARACTERIZATION OF MAJOR CITIES IN U.A.E.
A THESIS IN CIVIL ENGINEERING
Presented to the faculty of the American University of Sharjah
College of Engineering
in partial fulfillment of
the requirements for the degree
MASTER OF SCIENCE
by
MUHAMMAD IRFAN
B.S. 2009
Sharjah, UAE
June 2011

© 2011
Mohammad Irfan
ALL RIGHTS RESERVED

ii
We approve the thesis of Muhammad Irfan Date of Signature
Dr. Magdi El-Emam
Assistant Professor
Civil Engineering
Graduate Committee
Dr. Zahid Khan
Assistant Professor
Civil Engineering
Graduate Committee
Dr. Jamal Abdalla
Head
Civil Engineering
Graduate Comittee
Dr. Aman Mwafy
Assistant Professor
Civil Engineering
Graduate Committee
Dr. Hany El-Kadi
Associate Dean
College of Engineering
Dr. Yousef Al-Assaf
Dean
College of Engineering
Dr. Gautem Sen
Vice Provost
Research and Graduate Studies

iii
SEISMIC SITE RESPONSE, ANALYSIS AND
CHARACTERIZATION OF MAJOR CITIES IN U.A.E.
Muhammad Irfan, Candidate for the Masters of Science Degree
American University of Sharjah, 2011
ABSTRACT
United Arab Emirates (UAE) has experienced significant economic growth in
recent years. The accelerated schedule driven projects are compelling designers to use
values of seismic hazard (ground motion) that are either significantly conservative or
unreliable. Moreover, not all estimates of a seismic hazard analysis such as mapped
spectral accelerations, representative hazard spectra, and deaggregation covering all
parts of UAE are available. Studies that have attempted to define the seismic hazard
in UAE in the past are not in agreement and they either focused on few cities or did
not provide all the necessary information. The variations in their results could be
attributed to the use of questionable source zonation, activity parameters, and
superseded prediction equations. Consequently, designers in UAE have to rely on
inaccurate estimate of seismic hazard for the region. Considering substantial
development in United Arab Emirates (UAE) and considerable ambiguity faced by
the designers in choosing the seismic hazard from disagreeing studies, a new seismic
hazard analysis is urgently required.
This study is based on the use of homogenized catalogue of various degrees of
completeness for temporal distribution of events (Surface magnitudes, Ms), activity
parameters based on doubly bounded magnitude-frequency relationships, modified
zonation of area sources, and new generation prediction equations. The study aims to
provide a comprehensive seismic hazard assessment for all parts of UAE that will
provide designers with Hazard curves, values of peak ground accelerations (PGA),
mapped spectral accelerations at 0.2s and 1s (S0.2 and S1), Uniform Hazard Spectra
(UHS), and deaggregation of seismic hazard.

iv
In addition to the estimation of seismic hazard, this study provides estimates
of the site amplification for three major cities of UAE (Sharjah, Dubai, and Abu
Dhabi). Effect of local site conditions in modifying the seismic waves is well
documented in many studies. Site amplification factors as a guideline for typical UAE
building sites are not available. As a result, designers in UAE have to rely on factors
developed for other regions. These factors are typically obtained by performing
equivalent-linear or non-linear site response analysis of sites of known dynamic
properties. Site response analyses were performed for different representative
subsurface soil models obtained from various sources. Sites were grouped as per the
provisions of International Building Code (IBC 2009). The results of this part of the
study will provide structural engineers with region specific amplification factors for
the development of design spectra instead of relying on factors developed for other
regions.
The results are generally provided for a return period of 2475 years (2 %
probability of excedance in 50 years) in conformance to the provisions given in
American codes. The results mapped seismic hazard presented in this study
corresponds to rock sites classified as Site Class B according to International Building
Code (IBC 2009). The results indicate slightly larger values of seismic hazard
compared to some recently published studies. The effect of west coast fault is
significant especially at larger return periods and should be taken into account if
future studies confirm the presence of a fault along the west coast of UAE and
prevalent building codes adopts lower probability of exeedance. The activity in
Arabian Craton (background seismicity) contributes mostly to the hazard in most
southern part of UAE. The contribution of other sources such as Zargos (Iran) and
Oman mountains increases as one move towards the North. The west of the country is
dominated by seismicity from Zargos whereas the east by seismicity from Oman
mountains.
The results of site response analyses (site classes C and D) suggest more
amplification in Sharjah than in Dubai and Abu Dhabi because of deep engineering
bedrocks in Sharjah. The response spectra of Abu Dhabi and Dubai are scattered as
compared to Sharjah because of the variance in soil column depths in Dubai and Abu
Dhabi. The amplification factors for Sharjah are in the range of 4 to 6 and for Dubai
it is estimated to be around 3 to 4; whereas, the amplification factors for Abu Dhabi
ranged from 4 to 8.
v
CONTENTS
ABSTRACT iii
LIST OF FIGURES vii
LIST OF TABLES x
ACKNOWLEDGEMENTS xi
Chapter
1 INTRODUCTION 1
General Introduction 1
Problem Definition 2
Objectives of Study 3
Available Data and Collection 4
Organization of Thesis 6
2 LITERATURE REVIEW 7
Background 7
Review of Regional Studies 19
3 STUDY AREA - GEOLOGY, TECTONICS AND SEISMICITY 30
Study Area 30
Geology 31
Regional Tectonic Setting 32
Regional Seismicity 34
4 METHODOLOGY 35
Seismic Hazard Analysis 35
Spectral Matching 40
Site Response Analysis 42
5 RESULTS AND DISCUSSION 49
Gridded Seismic Hazard Analysis 49
Spectral Matching 63
Site Response Analysis 70
6 CONCLUSIONS AND RECOMMENDATIONS 79
Conclusions 79
Recommendations 81

vi
REFERENCE LIST 82
Appendix
A SOIL COLUMNS 92
B SOFTWARE INTERFACE 128
C MANUAL INTEGRATION FOR PSHA 132
VITA 136

vii
FIGURES
Figure Page
2.1 Typical Seismic Hazard Curve 10
2.2 Typical Uniform Hazard Spectrum (UHS) 10
2.3 Typical Seismic Hazard Map (NEHRP 2003) 11
2.4 Typical Deaggregation Plot 12
2.5 Typical plots to calculate site amplification factors 16
2.6 NEHRP Design Spectrum 17
2.7 Seismic source model of Al-Haddad et al. (1994) 19
2.8 Seismic source model of Abdalla and Al Homoud 2004 20
2.9 Cluster of Earthquake Records in the Iranian Region (Source: USGS NEIC) 21
2.10 Seismic Source Model of Peiris et al (2006) 22
2.11 Seismic Source Model of Musson et al. (2006) 23
2.12 Seismic source model of Aldama et al. (2009) 24
2.13 UHS from past studies for a return period of 2475 years 26
3.1 Location of U.A.E in the Arabian Gulf. (Source: Google Earth) 30
3.2 Spatial distribution of the Emirates of U.A.E. (Source: Wikipedia) 31
3.3 Tectonic Setting around U.A.E. 33
3.4 Seismicity Catalogue 34
4.1 Seismic source model for this study 36
4.2 Grid of nodes used in Gridded Seismic Hazard Analysis 39
4.3 Modulus reduction curves 43
4.4 Damping ratio curves 43
viii
4.5 Plot of shear wave velocity versus depth 45
4.6 Response spectra on surface and half space using LSM2270 47
5.1 Seismic curves of the eight cities of U.A.E. 50
5.2 Comparison of seismic curves for Abu Dhabi (PGA) 52
5.3 Comparison of seismic curves for Ras Al Khaimah (PGA) 53
5.4 Comparison of seismic curves for Dubai (PGA) 53
5.5 UHS for the eight cities of U.A.E. 54
5.6 Comparison of UHS for Dubai (return period - 2475 years) 54
5.7 Comparison of UHS for Dubai (return period - 475 years) 55
5.8 Contour map for 2475 year return period Peak Ground Acceleration 56
5.9 Contour map for 2475 year return period spectral acceleration at 0.2s. 56
5.10 Contour map for 2475 year return period spectral acceleration at 1s. 57
5.11 Proposed zonation of UAE based on equal increments of mapped hazard 58
5.12 UHS representing the proposed zonation of UAE 58
5.13 Deaggregation of hazard for Abu Dhabi 59
5.14 Deaggregation of hazard for Ras Al Khaimah 60
5.15 Effect of west coast fault on hazard curves 62
5.16 Matching ANG-090 response on Abu Dhabi Target Response Spectrum 64
5.17 Matching LSM2270 response on Abu Dhabi Target Response Spectrum 64
5.18 Matching GIL337 response on Dubai Target Response Spectrum 65
5.19 Matching TCU129-E response on Dubai Target Response Spectrum 65
5.20 Matching ANG000 response on Sharjah Target Response Spectrum 66

ix
5.21 Matching LSM2000 response on Sharjah Target Response Spectrum 66
5.22 Comparing ANG090 Original to Matched Time History 67
5.23 Comparing LSM 2270 Original to Matched Time History 67
5.24 Comparing GILL337 Original to Matched Time History 68
5.25 Comparing TCU129E Original to Matched Time History 68
5.26 Comparing ANG000 Original to Matched Time History 69
5.27 Comparing LSM2000 Original to Matched Time History 69
5.28 Response Spectra for Sharjah for Site Class C 71
5.29 Response spectra for Sharjah for Site Class D 71
5.3 Amplification factors for Sharjah for Site Class C 72
5.31 Amplification factors for Sharjah for Site Class D 73
5.32 Response Spectra for Dubai for Site Class C 73
5.33 Response Spectra for Dubai for Site Class D 74
5.34 Amplification factors for Dubai for Site Classes C and D with two input motions 75
5.35 Response Spectra for Abu Dhabi for Site Class C 75
5.36 Response Spectra for Abu Dhabi for Site Class D 76
5.37 Amplification factors for Abu Dhabi for Site Class C 77
5.38 Amplification factors for Abu Dhabi for Site Class D 77

x
TABLES
Table Page
2.1 NEHRP Site Classification 18
2.2 Recurrence Parameters used by Abdallah and Al Homoud (2004) 20
2.3 Recurrence Parameters used by Musson et al. (2006) 23
2.4 Recurrence Parameters used by Aldama et al. (2009) 25
2.5 Comparison of PGAs 25
2.6 Results after using three attenuation equations on one source model 27
2.7 Results after using one attenuation equations on three source models 27
4.1 Verification Results 35
4.2 Activity parameters used in this study 37
4.3 Criteria for selecting time histories 41
4.4 Time histories selected for spectral matching 41
5.1 Spectral Accelerations at 2475 years for the eight cities of U.A.E. 50
5.2 Spectral Accelerations at 475 years for the eight cities of U.A.E. 51
5.3 Spectral Accelerations at 10000 years for the eight cities of U.A.E. 51
5.4 Comparing PGAs of this study with some of the previous hazard studies 52
5.5 Contribution of different sources to the hazard in selected cities 61
5.6 No. of boreholes for each city 70
5.7 Site amplification factors 78

xi
ACKNOWLEDGEMENTS
Foremost thanks and praises are to Almighty who blessed me with the
strength, capability, and knowledge to undertake and complete the research.
First of all, I express my gratitude to the Department of Civil Engineering of
the American University of Sharjah for accepting me as a Research Assistant for this
study.
The greatest credit of this work goes to my esteemed supervisors Dr. Magdi
El-Emam and Dr. Zahid Khan who have given bulk of their precious time and
experience during this study to assist me in achieving the goals of this study. Their
continuous supervision and valuable suggestions have been instrumental in
completing this research.
Special thanks to Dr. Jamal Abdalla and Dr. Mousa Attom for their occasional
valuable suggestions on my research work.
I also appreciate the help of Dr. Tarig Ali for help with ArcGIS for plotting the
contour maps in from results of the Gridded Probabilistic Seismic Hazard Analysis.
I am extremely thankful to the Geotechnical Department of Sharjah
Municipality for their support in providing me the borehole logs of sites in Sharjah.
Without their generous help, site response analysis phase of this study wouldn’t have
been possible.
For Dubai, I would like to appreciate the help of some private companies for
providing the borehole logs of sites in Dubai.
I would also like to thank Dr. Ali Shaaban Ahmed Megahed from Abu Dhabi
Municipality for providing the borehole logs for various sites in Abu Dhabi.
Lastly, I would like to appreciate the support of my family during this long
and sometimes difficult journey. By family, I mean my wife and my lovely children
Ali and Amna. Special thanks to my parents for their love and support, and for
instilling in me the value of learning and hard work, and providing me with the
opportunities to advance my life. My sisters have also been a great source of
motivation for me during this study.

xii
DEDICATION
To my family:
My Parents, Wife, Sisters and two lovely Children Ali and Amna
1
Chapter 1: INTRODUCTION
General Introduction
Earthquakes are one of the most devastating natural hazards faced by various
countries around the world. Recently, many governments have begun to realize the
importance of managing the risk posed by the earthquakes. As part of the risk
management strategies, developing countries such as U.A.E, Saudi Arabia, and Iran
are beginning to develop building codes which will incorporate seismic loads
consideration for the design of structures. The seismic design of structures is
primarily based on Seismic Hazard Analysis and Site Response Analysis of the area.
Numerous studies have been performed to assess the seismic hazard for a
particular area [1], [2]. Seismic Hazard Analyses are usually performed for rock
conditions ignoring the effects of local site conditions. Hence, the results of Seismic
Hazard Analysis only give a preliminary view of the seismic loads expected on the
structure. Depending on what type of structure and where the structure is, the
designers extract the relevant results. The analysis which would complete the seismic
design prerequisites is called ‘Site Response Analysis’. Site Response analysis is the
process of quantifying the effects the local site conditions have on the seismic waves
which originate from bedrock.
Site Response Analysis is one of the most critical steps in geotechnical
earthquake engineering. The amplification of seismic waves due to the geological
structure of a particular site has been found to be considerable by many researchers.
Some of the examples are the 1994 Northridge earthquake [3], the disastrous 1985
Mexico earthquake in which the amplification of seismic waves was five times the
ground motion from the rock [4], and the 2003 Bam earthquake [5]. The degree of the
amplification caused by site conditions depends on the dynamic characteristics of the
soil, the characteristics of the base rock motions, the impedance contrast between the
soil profile and the base rock and the depth of semi-infinite half space [6].
Designing the structures according to the building codes applicable to the area
where the structures are built is extremely important. Due to the lack of availability,
some designers around the world are forced to design the structures using the
procedures developed by developed countries such as U.S. and U.K. This can lead to
extreme consequences because the design of structures using inapplicable studies
2
would be unreliable. Moreover, the intensity of the effects of earthquakes largely
depends on the types and strength of structures present in the area of shaking. The
recent earthquakes in Chile and Haiti suggest that although the earthquakes were of
similar intensities, the casualties in Haiti were much greater than those in Chile.
Many studies have attempted to perform Seismic Hazard Analysis for UAE [7,
8]. But significant variations exist amongst the results of those studies. Two of the
studies in the past have attempted to perform site response analysis for Dubai and
Sharjah [9, 10]. But the results of these cannot be reliable due to various shortcomings
discussed in the literature review section. Considering the substantial development in
cities such as Dubai and Abu Dhabi and the ambiguity faced by the designers in
U.A.E. in choosing the seismic hazard, a comprehensive study of seismic hazard
analysis is needed. Moreover, the lack of studies on site response analysis for U.A.E.
also justifies a study on site response analysis. Considering the time driven nature of
projects in U.A.E., not every project performs site specific response analysis. Hence
this study aims at performing a comprehensive Probabilistic Seismic Hazard Analysis
for U.A.E. to assess the hazard posed by the earthquake activity around U.A.E.
Moreover, numerous site response analyses would be performed for different parts of
U.A.E. to provide the designers with guidelines to incorporate site effects without
performing site response analysis for the project. The results and conclusions of this
study would contribute significantly towards developing the regional building codes
for different cities of U.A.E.
Problem Definition
In the last 20 years, U.A.E. has undergone tremendous development in terms
of its infrastructure, including mega projects like the Palm Island, Dubai metro, and
Burj Khalifa. Although historically U.A.E. has not been hit by a major earthquake, the
frequent seismicity in the surrounding areas such as Iran and Oman can pose a
significant threat to the infrastructure of U.A.E. Recent earthquakes of considerable
magnitudes in U.A.E. and Oman have also enhanced the need for risk management
plans for major cities of U.A.E. [11, 12]. The advancement in seismic networks of
U.A.E. has enabled the recording of seismic activities which were previously
unknown and underestimated.
Tall buildings have high natural periods. The seismic waves coming from long
distances also vibrate at long periods. If the natural periods of the structures match the

3
predominant periods of the long distance seismic waves (i.e. resonance), the results
could be catastrophic. Therefore, even though the seismic activity in Iran is at a
considerable distance, the long period and high intensity waves are a concern for
integrity of the sky scrapers in U.A.E.
Moreover, the seismic waves are subject to amplification due to the different
types of soils underlying the surface. The amplification due to site effects causes the
waves to increase the ground motion.
Several studies have attempted to evaluate the risk of U.A.E. in general and
major cities in particular. These studies presented significant variations in their results
and emphasized on calculating general seismicity of the area or for particular cities
only. The discrepancies in their findings are attributed to several shortcomings as
discussed in the Literature Review chapter. Considering substantial development in
the region especially in Dubai and Abu Dhabi and considerable ambiguity faced by
the designers in choosing the seismic hazard, some municipalities in UAE are at
different stages of developing building codes. In light of the above challenges, a
comprehensive seismic hazard analysis based on systematic approach is urgently
required.
Objectives of Study
• To prepare a homogenized seismicity catalogue for U.A.E.
• To develop a representative seismic source model for U.A.E.
• To select the appropriate Ground Motion Prediction Equations, suitable for
regional geology. In case the needed equations are not available, use the
widely accepted equations and the recently developed equations for world
wide applications.
• To perform Gridded Probabilistic Seismic Hazard Analysis to develop Seismic
Curves and Uniform Hazard Spectra for different areas of U.A.E.
• Develop contour maps for PGA and Spectral Accelerations at 0.2s and 1s for
return period of 2475 years (2% of exceedence in 50 years)
• To create a suite of spectrally matched ground motion time histories.
• To develop site amplification factors using the site classifications provisions
of NEHRP (2003) specifically for use in U.A.E.

4
Available Data and Collection
Seismic Hazard Analysis
The first set of data required to perform seismic hazard analysis was the
seismicity in and around the study area. The seismicity records were retrieved from
various databases and catalogues available online or in the literature [13, 14, 15, 16,
17, 18]. Some of these resources contained historic seismicity along with the
instrumental seismicity. In this study, only the instrumental seismicity was used. The
final collection of seismicity records was cleaned up to avoid repetition of any seismic
events. Along with seismicity, plate tectonics and geology studies were also consulted
[19, 20, 21]. These were required to develop the recurrence parameters for the
Gutternberg-Richter relationship and for developing the seismic source model to be
used in seismic hazard analysis. Ground Motion Prediction Equations (GMPE’s) were
needed to be assigned to the seismic sources. These were acquired from the Pacific
Earthquake Engineering Research (PEER) center studies along with other studies such
as [22, 23]. The commercially available software, EZFRISK was purchased from Risk
Engineering Inc. for performing the Gridded Seismic Hazard Analysis. Another
computer program called ArcGIS was obtained to plot the seismic hazard contour
maps of UAE
Spectral Matching
Several strong ground motion time histories were obtained from Pacific
Earthquake Engineering Research (PEER) database. PEER database has the option of
using criteria such as magnitude, distance or PGA to select the time histories. So, the
time histories were selected based on the deaggregation results from seismic hazard
analysis of Dubai, Sharjah and Abu Dhabi. A computer program of ‘SeismoSignal’,
available for free from SeismoSoft Ltd. for research purposes on the web, was used to
obtain various strong motion parameters of time histories for comparing the original
and matched time histories. Moreover, ‘RSP Match EDT’, commercially available
software, was procured and used to perform spectral matching on ground motion time
histories.
5
Site Response Analysis
To correlate the dynamic properties of soils at different site selected in UAE
major cities, reports of soil investigation conducted at these sites are required.
Numerous boreholes reports are available with the municipalities of the emirates of
U.A.E. However, due to complications in formal procedures and lack of cooperation
from some municipalities, it was not easy to acquire many boreholes from Emirates
such as Umm Al Quwain, Fujairah and Ras Al Khaimah. Around 100 boreholes from
Dubai, Sharjah, Abu Dhabi and Ajman were collected. Most of the boreholes from
Dubai and Abu Dhabi varied from 15 to 30 m depth. However, some boreholes from
Sharjah are extended to 50m depth. Several studies of correlations between SPT-N
values and shear wave velocities are available in literatures [24, 25, 26, 27]. These
correlations were used to correlate the data from the boreholes to the soil dynamic
properties required for site response analysis phase. To estimate the shear wave
velocities for the bedrock, three studies were used to correlate the Unconfined
Compression Strength (UCS- MPa) [28, 29, 30]. The computer program ‘SHAKE
2000’ is used extensively for performing 1-D site response analysis in this study.

6
Organization of Thesis
This thesis is prepared for two major phases of this study. First phase was the
Gridded Seismic Hazard Analysis and the second was Site Response Analyses.
Chapter 2 presents the general background and review of some of the subjects of this
thesis such as Source Zonation, Ground Motion Prediction Equation and Recurrence
Parameters. Chapter 2 also reviews the regional seismic hazard and site response
studies performed. Moreover, the results of previous studies are compared and
reasons for discrepancies in the results are discussed.
Chapter 3 describes the tectonic setting, geology and seismicity of the study
area along with the geographic setting of UAE.
Chapter 4 presents the methodology used for Gridded Seismic Hazard
Analysis and Site Response Analyses. The computer programs used for the two
phases are also described. Format of results from Gridded Seismic Hazard Analysis
and Site Response Analyses have been presented.
Chapter 5 presents the results of Gridded Seismic Hazard Analysis in the form
of Uniform Hazard Spectra, seismic hazard curves and contour maps. Deaggregation
graphs for cities of Abu Dhabi and Ras Al Khaimah have been plotted. Comparison of
results between this study and past studies has been made. Matched time histories
along with their response spectra have been plotted to compare the results before and
after matching. Response spectra and amplification factors for Sharjah, Dubai and
Abu Dhabi have been plotted to show the results of site response analyses performed
for 100 boreholes.
Chapter 6 summarized most important conclusions made in this research as
well as suggestions for further research.

7
CHAPTER 2: LITERATURE REVIEW
Background
Probabilistic Seismic Hazard Analysis
The time, size and location of occurrence of earthquakes in future cannot be
predicted with certainty. The concept of probability is incorporated in Seismic Hazard
Analysis to analyze factors of time, size and location with the uncertainty involved.
Cornell 1968 [31] developed ‘Probabilistic Seismic Hazard Analysis’ for the
estimation of ground motion. The probabilistic approach considers all possible
magnitude earthquakes, at all possible distances from all possible source zones with
consideration given to likelihood of each combination. The ground motion obtained
from this approach has a specified probability of exceedence. Uncertainty in the
events of earthquake occurrence and the associated hazards of damaging ground
motion is inherent. The reliability of results from this approach depends on factors
described in the following. These factors are required for performing the Probabilistic
seismic hazard analysis [31, 32, 33, 34, 35, 36]. They include identification of
sources, establishment of recurrence relationships, magnitude distribution and average
rate of occurrence for each source, selecting attenuation relationship and computing
the Uniform Hazard Spectrum and site hazard curve.
Identification of seismic sources
The identification of seismic source zones is based on the interpretation of
tectonic, geological and seismological data. Describing the whole process of
developing the seismic model is a broad topic; therefore, the identification process is
briefly described in this section.
Seismicity around a region of interest is grouped into many seismic sources.
These sources are identified based on the spatial distribution of earthquakes. Seismic
sources can be faults, areas and points. Area sources are widely preferred where the
accurate knowledge of line and point sources is not conclusive. Once the sources
close to the site of interest are identified, uniform probability distributions within the
sources are assigned to each source i.e. earthquakes can occur at any point within the
source zone.

8
Recurrence parameters for seismic sources
Determining recurrence parameters is a major difference between the
deterministic and probabilistic approaches of Seismic Hazard Analysis. The
uncertainty in size and time of occurrence of future earthquakes is characterized
through a ‘recurrence relationship’ assigned to each source. A ‘recurrence
relationship’ specifies the average rate at which an earthquake of some size will be
exceeded. A linear relationship was observed by Gutenberg and Richter (1944) when
the logarithm of annual rate of exceedence was plotted against earthquake magnitude
(Equation 2.1).
Log N = a – bM [2.1]
Where M is the earthquake magnitude and N is the number of earthquakes
having magnitude greater than or equal to M. ‘a’ and ‘b’ are constants where ‘a’
indicates the number of earthquakes greater than magnitude zero, and it depends on
the number of events, the size of source region and the number of years of seismic
date. ‘b’ is the relative number of small magnitude to large magnitude earthquakes
[7].
Selection of Ground Motion Prediction Equations (GMPEs)
Ground Motion Prediction Equations (GMPEs or attenuation equations) are
used to predict the ground motion produced by an earthquake at a certain distance
from epicenter or hypocenter. The GMPE’s are constrained by many factors such as
the distance from epicenter, distance from hypocenter, type of fault rupture
mechanism, damping of transmitting media, and characteristic of the soil of the site if
included [38, 39]. These ground motion prediction equations are developed from the
regression of accelerations recorded at different distances. The uncertainty in the
regression is quantified by the standard deviation of the peak ground acceleration.
Majority of the attenuation relations relate the peak ground acceleration to the
magnitude of an earthquake (M), and the distance (R) from epicenter/hypocenter.
Some attenuation relations also include other parameters which are used to
characterize the earthquake source, wave propagation and local site conditions.
Typical form of the GMPE relationships is given by
ln Y = C� +CM +C�M� +C� ln�R + C� exp�C�M�� + C�R + f�source� + f�site� [2.2]

9
The values of coefficients (C1, C2, C3 etc) vary depending on which ground
motion parameter (Y) is being predicted. These coefficients are computed by
performing the regression analysis on the particular ground motion parameter.
Typically, these coefficients represent the relationship between the ground motion
parameter, spectral period, and the variable (magnitude or distance). The relationship
between the variable and ground motion parameter is also determined using the
regression analysis. These relationships could be linear, parabolic or exponential.
GMPEs are then assigned to different seismic sources. More than one equation can be
assigned to a seismic source.
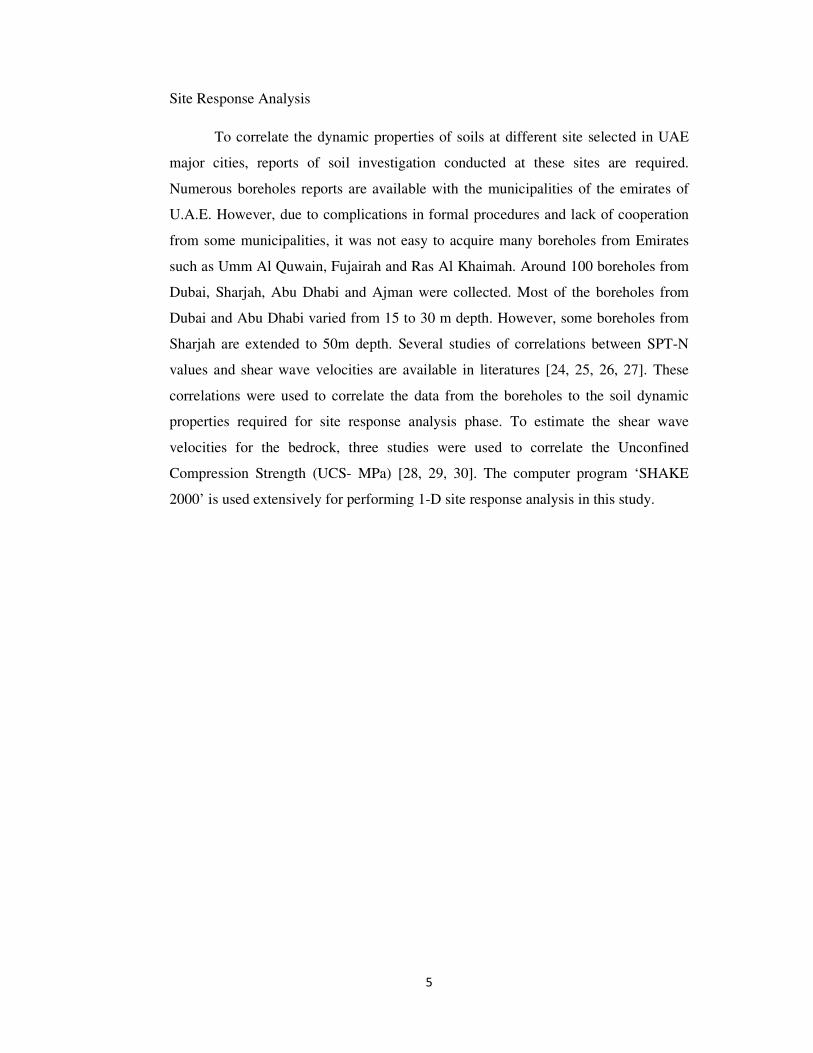
Results of Probabilistic Seismic Hazard Analysis
Main result of PSHA is seismic hazard curve that relates the annual rate of
exceedence (or return period) to any spectral acceleration (such as PGA). Figure 2.1
presents a typical seismic curve for Peak Ground Acceleration which is the spectral
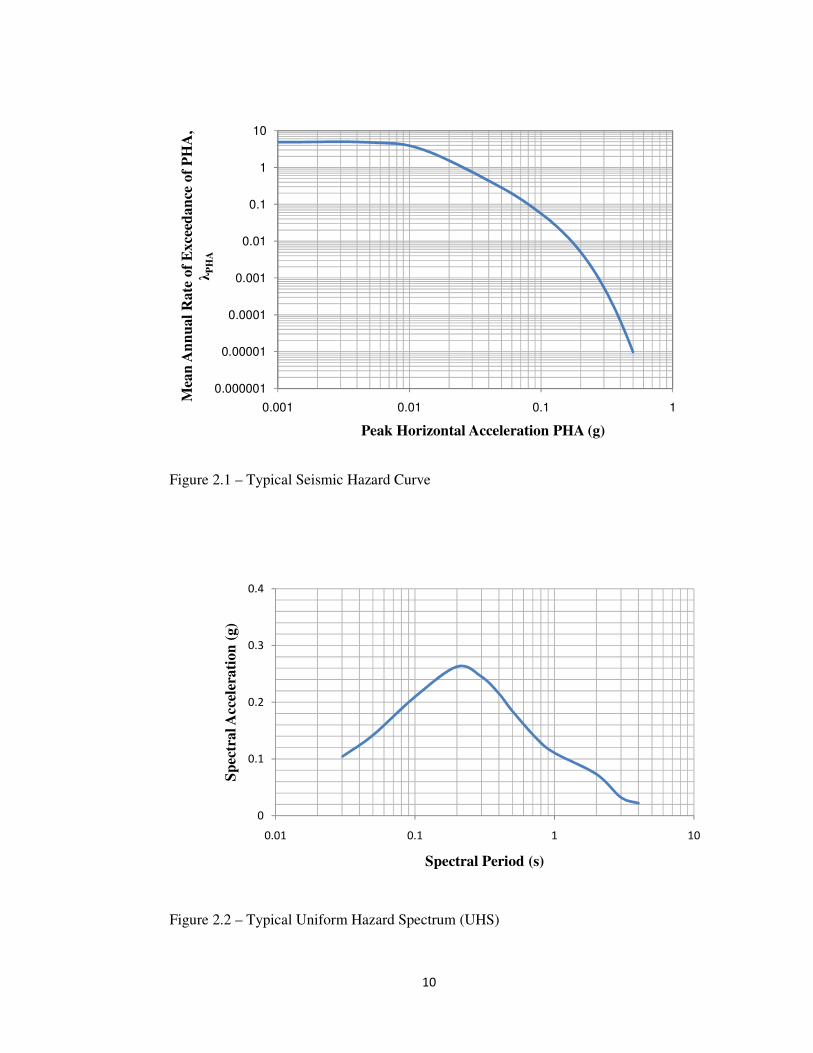
acceleration at spectral period of zero (0) second. In addition to seismic curves, a plot
which shows different spectral accelerations for different spectral periods at a
common rate of exceedence is called Uniform Hazard Spectrum (Figure 2.2). Results
of PSHA are also plotted as ground motion hazard maps such as the one produced by
the USGS for the National Earthquake Hazards Reduction Program (Figure 2.3).
Typically, PGA and Spectral acceleration for 0.2s and 1s are plotted on these maps to
facilitate designers in choosing ground motion amplitudes for a particular return
period i.e. a particular probability of exceedence.
10
Figure 2.1 – Typical Seismic Hazard Curve
Figure 2.2 – Typical Uniform Hazard Spectrum (UHS)
0.000001
0.00001
0.0001
0.001
0.01
0.1
1
10
0.001 0.01 0.1 1
Mea
n A
nn
ua
l R
ate
of
Ex
ceed
an
ce o
f P
HA
,
λP
HA
Peak Horizontal Acceleration PHA (g)
0
0.1
0.2
0.3
0.4
0.01 0.1 1 10
Sp
ectr
al A
ccel
era
tio
n (
g)
Spectral Period (s)

11
Figure 2.3 – Typical Seismic Hazard Map (NEHRP 2003)
PSHA deaggregation
The dynamic analysis of a structures, engineering models and computer codes
require an earthquake acceleration time history representative of local conditions from
the results of PSHA. A procedure called ‘Deaggregation’ is used to determine the
dominant distance and magnitude from the results of PSHA. Many studies have
described the process of Deaggregation [34, 39, 40, 41, 42, 43]. Figure 2.4 shows a
typical deaggregation plot. For different spectral accelerations at different spectral
periods, the peaks of histogram will change. The magnitude and distance range that
represents the peak in histogram is used to select the earthquake time history for
structure specific dynamic analysis.
In deterministic hazard analysis, selecting a representative earthquake for
dynamic analysis could be difficult because deterministic approach considers the
effect of a single scenario earthquake at a site. On the other hand, the probabilistic
approach considers all possible combinations of earthquake magnitudes and distances
in order to determine which one contributes the greatest to a particular hazard level.

12
Figure 2.4 – Typical Deaggregation Plot
Description of EZFRISK
EZFRISK is commercially available software by Risk Engineering Ltd which
implements the Cornell-McGuire approach. Seismic Hazard calculations of EZFRISK
represent an application of the total probability theorem. The process of entering the
input data is extremely user friendly. Constructing a seismic zone model and
assigning the recurrence parameters on the seismic zones are relatively simple steps.
The program has a big database of predefined Ground Motion Prediction Equations
which is frequently updated. EZFRISK is capable of delivering various results such as
seismic curves for different spectral periods, uniform hazard spectra for numerous
return periods and deaggregation for several combinations of magnitude and distance.
Time consumed for a single site seismic hazard analysis performed by EZFRISK was
small which enabled the Gridded Seismic Hazard Analysis to be performed within
reasonable amount of time.

13
Time Histories for Site Response Analysis
Designing of strong motion time histories is an essential part of soil structure
interaction done by geotechnical earthquake engineers, and nonlinear dynamic
analysis of critical structures done by structural engineers. The earthquake time
histories are selected and adjusted to match the target response spectrum of a
particular site. The target response spectrum is part of the results produced by
Probabilistic Seismic Hazard Analysis (PSHA). There are two methods for designing
the strong ground motion time histories: scaling ground motion and spectral matching
[44]. Both methods involve the use of past natural or synthetic time histories.
Scaling ground motions is conducted by multiplying the natural or synthetic
acceleration values at all-time intervals by certain factor. Though the natural phasing
of the recorded ground motion and peaks and troughs in the spectral shape are
maintained, getting the average response spectrum shape to match the target response
spectrum would be a major challenge using this method.
In the second method (i.e. spectral matching method) the frequency content of
an earthquake time history (natural or synthetic) could be modified to match the
response spectrum of that target time history (i.e. target response spectrum). Various
methods of spectral matching have been described by Preumont (1984) [45].
Generally, there are two approaches of spectral matching: frequency domain and time
domain. The first approach involves replacing the Fourier amplitude spectrum of the
initial time history with a Fourier spectrum which is consistent with the target
spectrum based on random vibration theory. However, the later involves adding
wavelets to the initial time history. Time domain approach is a better option because
of good convergence properties and preserving the non-stationary character of the
original time histories. Several popular computer programs such as RSP Match EDT
and SeismoMatch use the time domain approach for computing the modified time
histories. Spectral matching is a preferred option over the scaling of ground motions
because lesser hassle is involved in achieving a satisfactory comparison of the
response spectra of both original and target time histories.
14
RSP Match EDT
RSP match EDT is a Windows based program that uses a time domain
approach to modify the original time histories to make them compatible with a target
response spectrum. This program was developed by Abrahamson (1992) [46] and
applies the methodology of Lilhanand and Tseng (1987, 1988) [47, 48]. Different
modification models are used to perform the modification of time histories. This helps
in preserving the non-stationary phasing of the original time history as mentioned
above. Different sources are used to get the recorded strong ground motion time
histories for spectral matching. This program has its own specific format in which the
original acceleration-time history could be input into it. Hence, the ground motion
time histories from any database are converted to a RSP Match EDT compatible
format before being used scaled. The formatting process is done within the program
option that is available in RSP Match EDT.
Site Response Analysis
Site response analysis is the process of analyzing the seismic hazard at a micro
level. Soil conditions are considered to quantify the alterations caused by the soil on
seismic waves propagating from the bed rock. The results of site response analysis
primarily depend upon the type of soils, and the soil profile configuration. Hence,
differences would be encountered in the results of site response analysis from one site
to another. Therefore, a site specific response analysis is highly recommended for
every structure that intended to be built. However, site response analysis is expensive
to perform making it impractical to be done for each individual structure site. To help
the designers save the cost of performing site specific response analysis, building
codes include ‘site amplification factors’ which are used to quantify the amplification
or deamplification of the seismic waves due to the soil conditions. For example, the
National Earthquake Hazard Reduction Program [49] has site amplification factors
estimated for the North American region.
The local site affects the important characteristics of the surface ground
motion such as amplitude and frequency content. The intensity depends on the
properties of the subsurface materials, site geometry, and distance of earthquake [50,
51] and on the characteristics of the bedrock ground motion itself [39]. Site Specific
Response Analysis is generally divided into three main tasks [52].

15
Characterization of soil properties in the site is the first, major, and most
expensive task. Geophysical or geotechnical investigation is used to determine the
dynamic properties of the soil by laboratory or field methods such as Resonant
Column Test, Cyclic Triaxial test, Seismic Refraction or Spectral Analysis of Surface
Waves (SASW). The other two tasks are: the selection of bedrock acceleration-time
Histories, and conducting the ground Response Analysis.
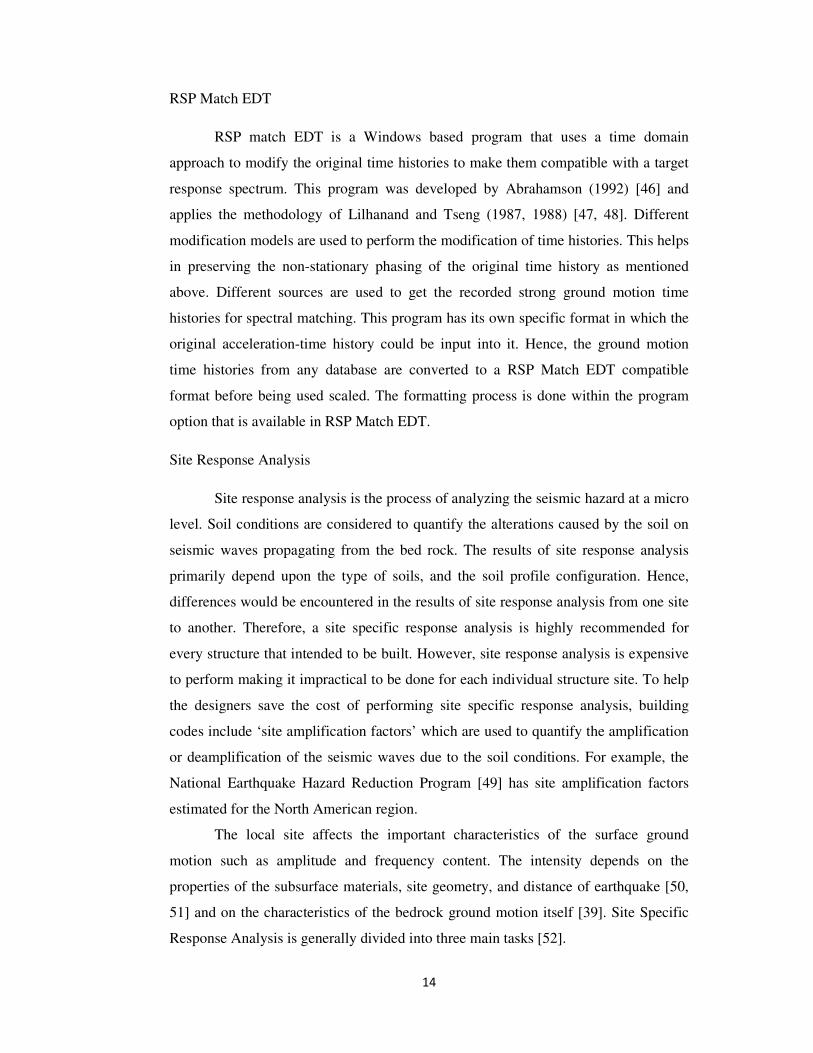
The ground response analysis (usually one dimensional) is performed for the
specified site using the bedrock time histories selected in the second task to compute
the time histories propagated to the ground surface. The ratio of response spectra of
the time histories measured at the ground surface to the input motion response spectra
is used to quantify the local site effects (Figure 2.5).
The use of one dimensional ground response analysis is most suitable for
modern seismic analysis for many reasons. Software packages for conducting one
dimensional site response analysis are available in abundance in personal computers
and have been tried tested and verified. They are believed to produce conservative
results, because majority of the design projects in the past which were designed using
this methodology have survived strong earthquakes. The two major assumptions in
one dimensional analysis are: (1) soil layers are horizontal and extend to infinity, and
(2) the ground surface is level and the shear waves propagate vertically upwards.
These assumptions can be justified for various reasons such as the horizontal ground
motions are more important than vertical ground motions, soil properties generally
vary more in the vertical direction than in the horizontal directions and many more
reasons which make the use of one dimensional analysis viable for use in the site
response analysis [52]. One dimensional site response analysis is typically performed
as either equivalent linear or non linear analysis.
16
Figure 2.5 - Typical plots to calculate site amplification factors
Estimating Site Amplification Factors
Performing a Site Specific Response Analysis for every structure is not
practical. Therefore, typical buildings and other structures often employ the site
amplification factors to develop a site specific design response spectrum (Figure 2.6).
These factors are provided in modern building codes as short and long period
acceleration amplification factors.
The development of site amplification factors involves Site Response
Analyses on a large scale. For a particular region, the site amplification factors are
determined by using the soil profiles of various sites in that region. The use of the
average shear wave velocity in the top 30 m of the soil profile (Vs30) is commonly
used to classify the soil profiles [53, 54, 55, 56]. This type of soil classification is used
for its simplicity and making the soil classification uniform (Table 2.1).

17
Figure 2.6 – NEHRP Design Spectrum

18
Table 2.1 – NEHRP Site Classifications
Site Class Description
A Hard rock with measured shear wave velocity, vS > 5000 ft/sec (1500 m/s)
B Rock with 2,500 ft/sec < vs ≤ 5000 ft/sec (760 m/s < vs ≤ 1500m/s
C Very dense soil and soft rock with 1,200 ft/sec < vs ≤ 2,500 ft/sec (360 m/s
< vs ≤ 760 m/s) or with either N > 50 or su > 2,000 psf (100 kPa)
D Stiff soil with 600 ft/sec ≤ vs ≤ 1,200 ft/sec (180 m/s ≤ vs ≤ 360 m/s) or
with either 15 ≤ N ≤ 50 or 1,000 psf ≤ su ≤ 2,000 psf (50 kPa ≤ su ≤ 100
kPa)
E A soil profile with vs < 600 ft/sec (180 m/s) or with either N < 15, su <
1,000 psf, or any profile with more than 10 ft (3 m) of soft clay defined as
soil with
PI > 20, w ≥ 40 percent, and su < 500 psf (25 kPa)
F Soils requiring site-specific evaluations:
1. Soils vulnerable to potential failure or collapse under seismic
loading such as liquefiable soils, quick and highly sensitive clays,
collapsible weakly cemented soils. Exception: For structures
having fundamental periods of vibration less than or equal to 0.5
second, site-specific evaluations are not required to determine
spectral accelerations for liquefiable soils. Rather, the Site Class
may be determined in accordance with Sec. 3.5.2, assuming
liquefaction does not occur, and the corresponding values of Fa
and Fv determined from Tables 3.3-1 and 3.3-2.
2. Peat and/or highly organic clays (H > 10 ft [3 m] of peat and/or
highly organic clay, where H= thickness of soil)
3. Very high plasticity clays (H > 25 ft [8 m] with PI > 75)
4. Very thick, soft/medium stiff clays (H > 120 ft [36 m]) with su <
1,000 psf (50 kPa)

19
Review of regional studies
Seismic Hazard Analysis
Many studies have attempted to estimate the seismic hazard for the Arabian
Peninsula region in the past. These studies have several shortcomings and
generalizations which will be discussed in this section. Due to the generalizations, the
results of these studies have significant variations, and all of them draw different
conclusions on the regional seismic hazard.
The earliest study was performed by Al-Haddad et al. (1994) [57]. Although
the study’s focus was on Saudi Arabia, the results were mapped over the whole
Arabian Peninsula. The study used a ground motion prediction equation which was
derived for Western North America [58] but the coefficients for that equation were
taken from Thenhaus et al. (1986) [59]. The seismic source model of this study is
presented in Figure 2.7. The figure shows partial seismic model relevant for the area
covered in this study. The large source which combines the Zagros region with
Makran region is not justified because two different regions have been combined into
one seismic source. The results of this study indicated that the PGA values
corresponding to a return period of 475 years for the cities of Abu Dhabi and Dubai
are less than 0.05g. Hazard for U.A.E. was estimated by mapping the hazard of Saudi
Arabia which could produce unreliable results for U.A.E.
Figure 2.7 – Seismic source model of Al-Haddad et al. (1994)

20
A Global Seismic Hazard Assessment Project was completed in 1999 for
generating the PGA maps (return period of 475 years) for Europe, Africa and Middle
East [60] The results of this study suggested over conservative values of PGA of
0.32g and 0.24g for Dubai and Abu Dhabi respectively. The results were deduced
from the calculated hazard at Dead Sea and Zargos area without performing actual
seismic hazard analysis for sites in UAE.
Abdallah and Al Homoud (2004) [7] performed the pioneering seismic hazard
assessment specifically for United Arab Emirates and its surroundings. The seismic
zones considered in this study are shown in Figure 2.8 and the recurrence parameters
are given in Table 2.2. This study used one attenuation equation for all the seismic
sources adopted from Zare (2002) [61]. The estimated PGA from this study for Dubai
and Abu Dhabi for a return periods of 475 years are 0.15g and 0.10g respectively.
Figure 2.8 – Seismic source model of Abdalla and Al Homoud 2004 [7]
Table 2.2 - Recurrence Parameters used by Abdallah and Al Homoud (2004) [7]
Seismic Source
Fault
Mechanism Mmin Mmax λ at Mmin β - beta
Main Zagros Thrust Region Area 4 7 194984 2.81
North East Arabian Gulf Region Area 4 6 1698 2.16
Northern Emirates Region Area 4 6 104.71 1.842
Lut Region Area 4 6.8 37154 2.56
Central Iran Region Area 4 7.2 6026 2.05
Makran Region Area 4 6.7 0.347 1.842
South East Arabian Gulf Region Area 4 7.5 47.86 1.842
Central Iran Region
Lut Region
Makran Region
South East Arabian Gulf Region
Northern Emirates Region
North East Arabian Gulf Region
Main Zagros Thrust Region

21
This study indicated larger seismic hazard in comparison to most recent
studies. The difference in the results are attributed to a source zone (region III –
Northern Emirates Region) with very high activity parameter of α (12.02 at Mmin = 4).
In addition to that, this seismic source seems to inflate the seismicity in U.A.E.
because this seismic source combines the Southern Zagros region with the northern
region of U.A.E. As a result, the probability of a high magnitude earthquake occurring
in the northern emirates region is similar to that of Southern Zagros region. This is
contrary to the cluster of earthquakes records shown in Figure 2.9 where it clearly
shows that barely any major earthquake has occurred close to the northern emirates
region. In addition, the high standard deviation of the attenuation equation used in this
study also contributes to larger seismic hazard [62].
Figure 2.9 – Cluster of Earthquake Records in the Iranian Region (Source: USGS
NEIC)
Sigbjornsson and elnashai 2006 [74] performed the seismic hazard for Dubai
only. They adopted the seismic source zonation of Tavakoli and Ghafory (1999) [1] in
addition to the inclusion of Dibba and West Coast Faults. They used attenuation
equations by Ambraseys et al. 1996 [63] and Simpson 1996 [64] for all the sources in
22
the seismic source model. The results were presented in the form of hazard curves for
PGA and Uniform Hazard Spectra for return periods of 975 and 2475 years for Dubai.
The PGA values of this study for Dubai were 0.16g and 0.22g for return periods of
475 and 2475 years respectively. In comparison, the PGA at 475 years is slightly
higher than that of Abdalla and Al-Homoud 2004 [7] and significantly higher than
some of the other studies. The larger values of hazard are possibly because of the
inclusion of west coast fault as a very active source.
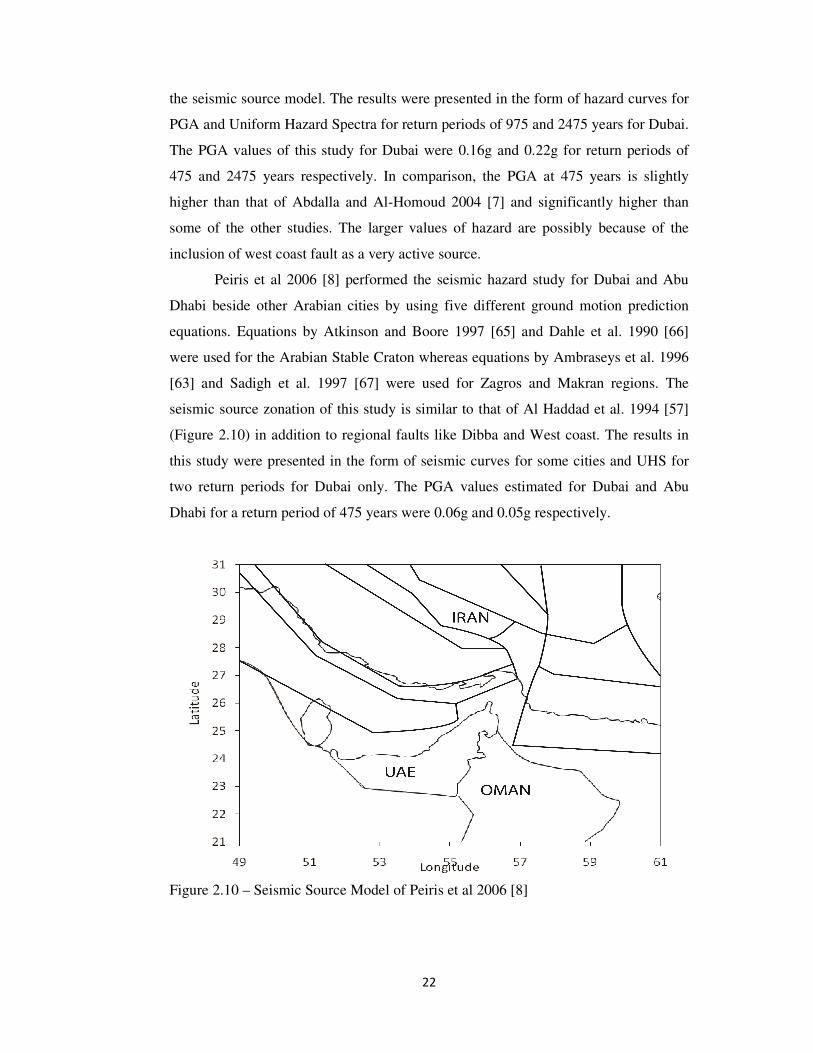
Peiris et al 2006 [8] performed the seismic hazard study for Dubai and Abu
Dhabi beside other Arabian cities by using five different ground motion prediction
equations. Equations by Atkinson and Boore 1997 [65] and Dahle et al. 1990 [66]
were used for the Arabian Stable Craton whereas equations by Ambraseys et al. 1996
[63] and Sadigh et al. 1997 [67] were used for Zagros and Makran regions. The
seismic source zonation of this study is similar to that of Al Haddad et al. 1994 [57]
(Figure 2.10) in addition to regional faults like Dibba and West coast. The results in
this study were presented in the form of seismic curves for some cities and UHS for
two return periods for Dubai only. The PGA values estimated for Dubai and Abu
Dhabi for a return period of 475 years were 0.06g and 0.05g respectively.
Figure 2.10 – Seismic Source Model of Peiris et al 2006 [8]

23
The study by Musson et al. 2006 [68] presented the results of seismic hazard
assessment of UAE that was performed by British Geological Survey on behalf of the
Government of Dubai. Although significantly different tectonic nature of different
source zones were appreciated, only two attenuation equations were used for all the
seismic sources in their model (Figure 2.11). Table 2.3 presents the recurrent
parameters used in that study. Ambraseys et al 1996 [63] was used for the
computation of spectral accelerations, whereas Ambraseys 1995 [69] was used for
predicting Peak Ground Accelerations (PGA). The results were presented in the form
of PGA maps and Uniform Hazard Spectra for the seven emirates for return periods of
475, 1000 and 10000 years. The results indicated a PGA of 0.05g for Dubai for a
return period of 475 years. These results are similar to those of Peiris et al. 2006 [8]
and Al Haddad et al. 1994 [57].
Figure 2.11 - Seismic Source Model of Musson et al. 2006 [68]
Table 2.3 - Seismicity Parameters used by Musson et al. 2006 [68]
Seismic Source Fault Mechanism Mmin Mmax λ at Mmin β - beta
DIBB Strike slip 4 5 0.0139 1.428
EHOS Strike slip 4 5.1 0.0832 1.7731
FORE Reverse 4 5.8 0.525 2.464
MUSP Strike slip 4 4.9 0.007 2.602
OMOB Strike slip 4 5.5 0.0139 1.428
QESH Reverse 4 6.4 0.851 1.704
ZEMI Strike slip 4 5.8 0.0794 1.658
ZMFF Reverse 4 6.5 1.023 1.59

24
Husein Malkawi et al. 2007 [70] presented seismic hazard assessment for
major cities of UAE. The seismic source model of this study consists of a single
source which includes the Makran Region, Zagros Region and parts of the Arabian
Craton. A single ground motion prediction equation of Atkinson and Boore 1997 [65]
was used. The results of this study are considered highly unreliable considering the
uncertain zone model and superseded ground motion prediction equation.
The latest study for U.A.E. was presented by Aldama et al. 2009 [71]. The
study focused on three cities: Dubai, Abu Dhabi and Ras al Khaimah. A total of 20
seismic source zones were considered (Figure 2.12), and seven attenuation equations
including a New Generation Attenuation (NGA) equation were used for different
seismic source zones. The recurrence parameters used for various source zones are
given in Table 2.4. The results were presented in the form of uniform hazard spectra
and hazard curves for the three cities for different return periods. The results are in
agreement with the findings of Peiris et al 2006 [8] and Musson et al. 2006 [68]. This
study did not provide seismic hazard assessment for other parts of UAE.
Shama 2011 [72] presented a seismic hazard assessment for a site in Dubai.
This study used many attenuation models for different seismic sources. Many local
faults such as West coast and Dibba were considerd as very active and hence included
in this study. The study presented significantly higher values of hazard in Dubai with
PGA values of 0.17g and 0.33g for a return period of 475 and 2475 years respectively.
The seismic catalogue used in the study was based on the database of IRIS [73] which
includes many events that are dislocated and are not present in the original database
cross referenced by IRIS 2008 [73].
Figure 2.12 – Seismic source model of Aldama et al. 2009 [71]
25
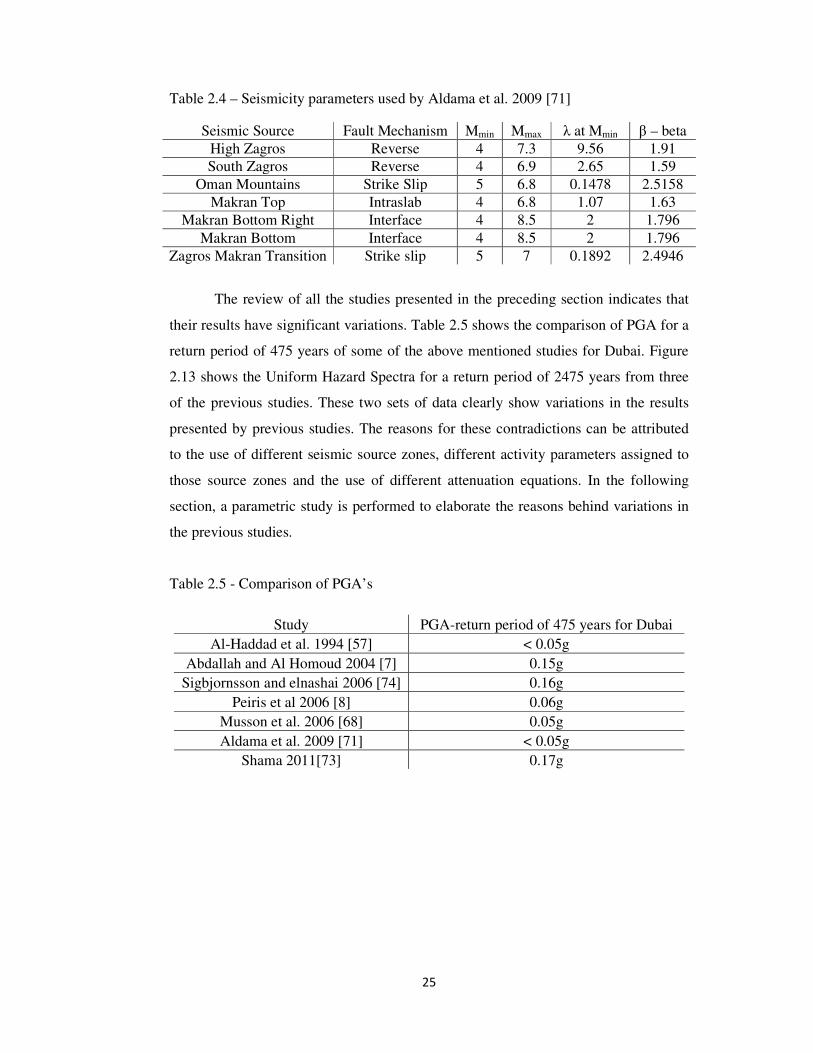
Table 2.4 – Seismicity parameters used by Aldama et al. 2009 [71]
Seismic Source Fault Mechanism Mmin Mmax λ at Mmin β – beta
High Zagros Reverse 4 7.3 9.56 1.91
South Zagros Reverse 4 6.9 2.65 1.59
Oman Mountains Strike Slip 5 6.8 0.1478 2.5158
Makran Top Intraslab 4 6.8 1.07 1.63
Makran Bottom Right Interface 4 8.5 2 1.796
Makran Bottom Interface 4 8.5 2 1.796
Zagros Makran Transition Strike slip 5 7 0.1892 2.4946
The review of all the studies presented in the preceding section indicates that
their results have significant variations. Table 2.5 shows the comparison of PGA for a
return period of 475 years of some of the above mentioned studies for Dubai. Figure
2.13 shows the Uniform Hazard Spectra for a return period of 2475 years from three
of the previous studies. These two sets of data clearly show variations in the results
presented by previous studies. The reasons for these contradictions can be attributed
to the use of different seismic source zones, different activity parameters assigned to
those source zones and the use of different attenuation equations. In the following
section, a parametric study is performed to elaborate the reasons behind variations in
the previous studies.
Table 2.5 - Comparison of PGA’s
Study PGA-return period of 475 years for Dubai
Al-Haddad et al. 1994 [57] < 0.05g
Abdallah and Al Homoud 2004 [7] 0.15g
Sigbjornsson and elnashai 2006 [74] 0.16g
Peiris et al 2006 [8] 0.06g
Musson et al. 2006 [68] 0.05g
Aldama et al. 2009 [71] < 0.05g
Shama 2011[73] 0.17g

26
Figure 2.13 – UHS from past studies for a return period of 2475 years
Reasons for contradictions in past studies
The contradictions in the results of the previous studies can be attributed to the
three main steps of Probabilistic Seismic Hazard Analysis i.e. seismic source model,
activity parameters assigned to the source model and attenuation equations. In this
section, the results of a parametric study are presented to illustrate the effect of using
different zones, activity rates and attenuation equations. EZFRISK by Risk
Engineering is used to perform the seismic hazard calculations for two scenarios. In
the first scenario, the seismic source zones and activity rates are kept constant and
three different equations are used. In the second scenario, single attenuation equation
will be used for three different seismic source models and activity parameters
Same Seismic model, but different attenuation equations
The seismic source model from Aldama et al. 2009 [71] presented in Figure
2.12 was used with three different equations. Not all the seismic sources were
extracted from the study because these have been found to be most critical for the
hazard contribution. The hazard analysis was performed for Dubai.
0
0.2
0.4
0.6
0.8
1
0 0.5 1 1.5 2 2.5 3 3.5 4
Sp
ectr
al A
ccel
era
tio
n (
g)
Period (s)
Aldama et al. 2009
Sigbjornsson and elnashai
(2006)
Peiris et al (2006)

27
The Attenuation equations that were used for this analysis are as follows:
� Abrahamson and Silva 1997 [22]
� Ambraseys et al. 1996 [63]
� Sadigh et al. 1997 [67]
The results of this analysis are given in Table 2.6 for the Peak Ground
Acceleration for the return period of 2475 years.
Table 2.6 – Results after using three attenuation equations on one source model
Attenuation Equation PGA
Ambraseyes et al. 1996 [63] 0.08272g
Abrahamson and Silva 1997 [22] 0.1091g
Sadigh et al.1997 [67] 0.0715g
Although the functional forms of these equations are similar, the table
indicates that using different attenuation equations can produce different results.
These results could vary significantly if other equations are also considered without
considering their applicability and constraints
Same attenuation equation but different seismic models and activity parameters
Three different seismic source models of Abdallah and Al Homoud 2004 [7],
Musson et al. 2006 [68] and Aldama et al. 2009 [71] are used in this step. These
seismic source models are presented in Figures 2.8, 2.11 and 2.12 respectively. Their
seismicity parameters are given in Tables 2.2, 2.3, and 2.4 respectively. The
attenuation equation used for this iteration was Abramson and Silva 1997 [22] for
rock sites and the results with different source models are presented in Table 2.7. It is
evident from Table 2.7 that variations in the results of past studies are due to the
source models and activity rates
Table 2.7 - Results after using one attenuation equations on three source models
Attenuation Equation Seismic Source Model PGA
Abrahamson and Silva 1997 [22] Aldama et al. 2009 [71] 0.114g
Abrahamson and Silva 1997 [22] Musson et al. 2009 [68] 0.062g
Abrahamson and Silva 1997 [22] Abdallah and Al Homoud 2004 [7] 0.2g

28
Other emirates of U.A.E. are developing at a fast pace and many major
infrastructures are being built in other cities such as Abu Dhabi, Ajman and Sharjah
and even in small towns. The designers in these emirates do not have proper guidance
on calculating seismic loads. Therefore, there is a need for a new comprehensive
Gridded Seismic Hazard Analysis for U.A.E.
Spectral Matching
The spectral matching is the process of matching historical ground motion
time histories to the Uniform Hazard Spectra of a particular area resulting from
Seismic Hazard Analysis for that area. Sigbjornsson and Elnashai 2006 [74] have
presented synthetic time histories in their study for dynamic analysis for Dubai only.
Moreover, no spectral matching was performed. This study will aim to create a suite
of spectrally matched time histories for the major cities of U.A.E. such as Dubai,
Sharjah and Abu Dhabi by performing spectral matching on UHS of Dubai, Sharjah
and Abu Dhabi
Site Response Analysis
Two studies have been performed on the consideration of local site effects for
U.A.E. None of these studies present the site amplification factors, similar to that of
NEHRP provisions, which can be used as a general guideline for the development of
design spectrum (Figure 2.6). Balwan 2008 [10] performed site response analyses for
various sites of Sharjah using a total of 140 boreholes logs selected at various sites in
Sharjah. The study of Al Bodour 2005 [75] was used to obtain the PGA map for
United Arab Emirates. Single acceleration time history was used for all the sites. The
amplification potential of Sharjah was given in the form of zonation maps for PGA.
Spectral acceleration at different periods was not considered in assessing the
amplification. The time history was selected because the PGA of this recording was
within the range of PGA given by Al Bodour 2005 [75] for Sharjah. No Spectral
matching was performed for any Uniform Hazard Spectrum.
In another study, Ansal et al. 2008 [9] developed microzonation maps for site
conditions of Dubai. This study presents amplification factors of different areas of
Dubai after performing site response analyses using different borehole logs. The input
ground motions were based on the results of the seismic hazard assessment for return
periods of 475 and 2475 years. A total of 1094 borings from the city of Dubai were

29
used to determine the variation of shear wave velocities. Correlations between shear
wave velocity and the number of blows from SPT tests were adopted. The scaling of
time histories was simply based on the Peak Ground Acceleration of the time
histories, and not on the spectral matching. Consequently, the time histories did not
exactly represented the hazard spectra for the sites. Moreover, this study used
unreliable damping ratio and shear modulus reduction curves which can produce
significant offset in the results [76]. This study presents larger degradation in dynamic
properties for rock than for clays which is in disagreement with the findings of [6, 39,
77].
Despite the influence of soil conditions being very critical in earthquake
design, not much effort has been made on site characterization of the major cities of
U.A.E to account for the seismic wave amplification. None of the two studies
described above can be relied on due to their shortcomings. Therefore, there is scope
for a new site response analysis study for major cities of U.A.E. This study aims at
characterizing the major cities of U.A.E. according to the amplification intensity of
the soils in respective cities by performing site response analysis on numerous
boreholes. The results in the format of site amplification factors for major cities of
U.A.E. would be easier to apply by the practical designers in U.A.E.

30
CHAPTER 3: STUDY AREA: GEOLOGY, TECTONICS AND
SEISMICITY OF U.A.E.
Study Area
U.A.E. is a small country located in the southeast of Arabian Peninsula in
Southwest Asia on the Persian Gulf covering an area of approximately 83,600 km2
(Figure 3.1). The country comprises of seven emirates with Abu Dhabi being the
capital. The spatial distribution of the seven emirates is shown in Figure 3.2. Although
Abu Dhabi has a large area, majority of the infrastructure is located in the northern
region of Abu Dhabi. Even in other major cities such as Sharjah, Dubai and Ajman,
the developed area is relatively small, and covers the western side of these emirates
bordering the Persian Gulf.
The Arabian Peninsula is not considered as active seismically. However,
recent shakings of the neighboring areas such as Oman and areas such as Dibba have
raised the awareness of a potential hazard to UAE [11, 12]
Figure 3.1 – Location of U.A.E in the Arabian Gulf (Source: Google Earth)

31
Figure 3.2– Spatial distribution of the Emirates of U.A.E. (Source: Wikipedia)
Geology
The geology of the United Arab Emirates, and the Arabian Gulf area, has been
substantially influenced by the deposition of marine sediments associated with
numerous sea level changes during relatively recent geological time. With the
exception of mountainous regions shared with Oman in the north-east, the country is
relatively low lying; with near-surface geology dominated by Quaternary to late
Pleistocene age, mobile Aeolian dune sands, and sabkha/evaporate deposits.
Conditions in Dubai area essentially consist of a linear coastline dissected by
channels or creeks. Superficial deposits consist of beach dune sands together with
marine sands and silts. In addition, wind erosion, capillary action and evaporation has
led to extensive sabkha deposits in certain areas, notably around the creeks. These
superficial deposits are underlain by alternating beds of calcarenite, carbonate
sandstone, sands and cemented sands.

32
Regional Tectonic Setting
U.A.E. is located on the Arabian plate which is regarded as stable seismically
[19, 20]. The tectonic setting on regional scale is depicted in Figure 3.3. Significant
crustal deformations and recorded seismic events are rare within the Arabian
Peninsula [78]. Although the Arabian plate is bounded by many active tectonic
boundaries, major contribution to the seismic hazard in UAE is from Zagros and the
Makran region. The separation of the Arabian plate from the African plate creates a
subduction zone with the Eurasian plate. The Arabian plate is moving north at a rate
of approximately 21 mm/year [79] and slight rotational movement also creates
subduction zone at the boundary of Makran [80]. Movement of Arabian plate is also
associated with the formation of Zagros fold and thrust belt in Iran that extends to the
edge of the Persian Gulf [81]. In addition to Zagros and Makran regions, the active
tectonic structures present in the Oman Mountains (Dibba fault) can also contribute
significantly to the seismic hazard in UAE especially in the north and east of the
country [82].
The possibility of existence of fault on the west coast of UAE is supported by
little and unclear information [82, 83]. A comprehensive assessment of this feature
including geomorphic and paleoseismological studies is required. Since some
instrumentally recorded earthquakes can be associated with the west coast fault
(Figure 3.4), any seismic hazard assessment of the region shall include optional
hazard values with west coast fault included.
Most of the earthquakes in Zagros region are shallow earthquakes at an
average depth of 15 km associated with blind thrust faults in the Precambrian
metamorphic rocks [21, 84]. The region has the potential to generate earthquakes with
magnitude (Ms) larger than 7. The depths of earthquake foci tend to get deeper (40
km) towards the transition between zagros and makran regions. This transition creates
complex faulting systems known as Zindan-Minab zone [85]. The Makran region
itself is subducting at an estimated rate of approximately 25 mm/yr [79].
Oman Mountains towards the northeast of UAE exhibit active seismicity.
Kusky et al 2005 [86] also reports historical seismicity associated with this
Cretaceous Ophiolite Obsduction. Instrumented earthquake with magnitude greater
than 5 has been recorded with association to this faulting mechanism. Recent studies
associate this fault system (Dibba fault, Wadi Shimal, and Wadi Ham fault) as an

33
extension of Zindab-Minab line. Since the seismic activity is not well documented for
this source, rates of uplift and deformation rates shall be used to characterize the
source.
Figure 3.3 – Tectonic Setting around U.A.E.
Plate Movement Thrust fault Transform fault
Strike slip fault Plate boundary

34
Regional Seismicity
Different databases from sources such as United States Geological Survey
(USGS) and National Geosceinces of Iran were used to develop a seismic catalogue
for the sources around UAE. The earthquake database from National Geoscience uses
various references such as National Earthquake Information Center [13], International
Seismological Center [14], Ambraseys and Melville 1982 [15], Nowroozi 1987 [16],
Nabavi 1978 [17], National Oceanic and Atmospheric Administration [18] among
many others. Events with magnitude greater than four and between 1900 and 2010
were selected as the basis of catalogue to identify the sources. The catalogue was
cleaned using standard protocols of removing duplicated events and aftershocks and
for completeness using methods suggested by Reasenberg 1985 [87] and Knopoff
2000 [88]. Historical records of earthquakes in the region were especially considered
for Arabian Craton, Oman Mountains, and Makran region. Sources like Zargos and
Zindam Minab were characterized by instrumentally recorded data since 1910. The
abundance of instrumented events was considered sufficient for defining the slope of
Gutenberg Richter relationship which has significant effect on the outcome of Hazard.
Historical events were given due consideration in selecting the upper bound
magnitudes. Figure 3.4 presents the homogenized (Ms) seismicity catalogue of
instrumentally recorded events from National Geoseisnces of Iran.
Figure 3.4 – Seismicity Catalogue
18
20
22
24
26
28
30
32
45 50 55 60 65 70
Lati
tud
e
Longitude

35
CHAPTER 4: METHODOLOGY
Seismic Hazard Analysis
In this study, a computer program of ‘EZFRISK’ was used to perform the
seismic hazard analysis. EZFRISK is an implementation of the Cornell 1968 [31]
PSHA framework. The accuracy of this software was evaluated by performing a
sensitivity analysis. A simple verification example of PSHA was performed for a site
in UAE using three different seismic zone models in CRISIS [89], EZFRISK and
using manual calculations. Manual calculations were done by following the procedure
described in Kramer 1996 [39]. To make the manual calculations short and simple,
only one seismic source was used along with one attenuation relationship assigned to
the seismic source. The PGA values for a return period of 2475 years were computed.
The results of this analysis are given in Table 4.1
Table 4.1 – Verification Results
Source Attenuation Relation Manual
Calculations EZFRISK CRISIS
Oman Mountains Abramson-Silva 1997 [22] 0.046g 0.0413 0.0530
South Zagros Fold Belt Spudich et al. 1999 [110] 0.048g 0.0546g 0.0515g
Oman Peninsula Spudich et al. 1999 [110] 0.090g 0.1035g 0.1075g
For South Zagros fold belt and Oman Peninsula, the variation in the results of
CRISIS and EZFRISK is very small. Whereas, the variation for South Zagros fold
belt and Oman Peninsula is 0.003 and 0.004 respectively. The difference between the
results of CRISIS and EZFRISK increases to 0.0117 with Oman Mountains. This
increase in difference might be attributed to the use of a different attenuation
equation. However, the difference in the results between EZFRISK and manual
calculations is around 10% to 12% for all the three analyses. The increase in variation
for manual calculations might be due to manual integration. The overall results
indicate good agreement between the results of EZFRISK and CRISIS

36
Seismic Zones
The development of seismic source model is primarily based on the work of
Berberian 1995 [21], Engdahl et al. 2006 [90] and Aldama et al. 2009 [71]. The
seismic source model adopted for this study is shown in Figure 4.1. The seismic
source model comprises of seven distinct seismic sources. The southern boundary of
South Zargros has been extended into the Persian Gulf instead of being along the
Iranian coast due to uncertainty associated with constraining of the boundary.
Moving the boundary of South Zargros northward can increase the seismicity of
stable Arabian Craton with potentially higher hazard levels in the southern and central
cities such as Abu Dhabi and Dubai.
The proposed boundary of South Zargros although may slightly increase the
level of hazard in northern cities but is not expected to cause significant increase in
hazard in other distant cities. Dividing the South Zargos into another small zone in the
south based on the presence of Zargos foredeep [21] will push the seismicity
associated with Zargos region northwards and will result in under estimation of
seismic hazard. Although further subdivision of South Zargos can be justified by
geological evidence, it is not in agreement with the spatial or temporal distribution of
seismic events; therefore, a single zone of South Zargos was adopted.
Figure 4.1 – Seismic source model for this study
18
20
22
24
26
28
30
32
45 50 55 60 65 70
Lat
itu
de
Longitude
Makran
Makran
Bottom
Arabian Craton
Oman Mountains
Transition
37
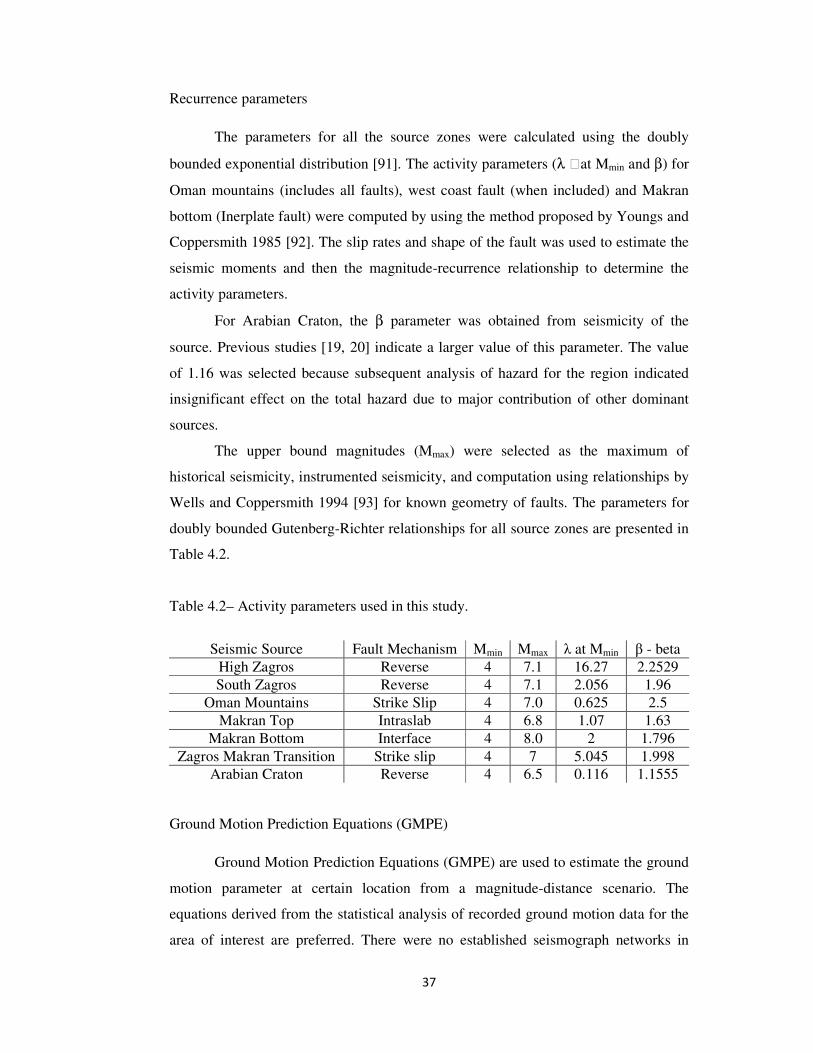
Recurrence parameters
The parameters for all the source zones were calculated using the doubly
bounded exponential distribution [91]. The activity parameters (λ at Mmin and β) for
Oman mountains (includes all faults), west coast fault (when included) and Makran
bottom (Inerplate fault) were computed by using the method proposed by Youngs and
Coppersmith 1985 [92]. The slip rates and shape of the fault was used to estimate the
seismic moments and then the magnitude-recurrence relationship to determine the
activity parameters.
For Arabian Craton, the β parameter was obtained from seismicity of the
source. Previous studies [19, 20] indicate a larger value of this parameter. The value
of 1.16 was selected because subsequent analysis of hazard for the region indicated
insignificant effect on the total hazard due to major contribution of other dominant
sources.
The upper bound magnitudes (Mmax) were selected as the maximum of
historical seismicity, instrumented seismicity, and computation using relationships by
Wells and Coppersmith 1994 [93] for known geometry of faults. The parameters for
doubly bounded Gutenberg-Richter relationships for all source zones are presented in
Table 4.2.
Table 4.2– Activity parameters used in this study.
Seismic Source Fault Mechanism Mmin Mmax λ at Mmin β - beta
High Zagros Reverse 4 7.1 16.27 2.2529
South Zagros Reverse 4 7.1 2.056 1.96
Oman Mountains Strike Slip 4 7.0 0.625 2.5
Makran Top Intraslab 4 6.8 1.07 1.63
Makran Bottom Interface 4 8.0 2 1.796
Zagros Makran Transition Strike slip 4 7 5.045 1.998
Arabian Craton Reverse 4 6.5 0.116 1.1555
Ground Motion Prediction Equations (GMPE)
Ground Motion Prediction Equations (GMPE) are used to estimate the ground
motion parameter at certain location from a magnitude-distance scenario. The
equations derived from the statistical analysis of recorded ground motion data for the
area of interest are preferred. There were no established seismograph networks in

38
UAE until recently established by the governments of Dubai and Abu Dhabi.
Consequently ground motion prediction equations (GMPEs) specific to UAE are not
available. All seismic hazard analysis performed for the region use GMPEs developed
for other geographical areas. The choice of these equations often is based on
guidelines proposed by Cotton et al 2006 [94]. Alternatively equations (New
Generation Equations) that were developed after the analysis of worldwide seismicity
are increasingly being used.
A total of seven different GMPEs were used in this study including new
generation equations. Different seismic sources were assigned at least two GMPEs
except for the Arabian Craton along with conversion to geometric mean wherever
applicable. Three New Generation Equations of Boore and Atkinson 2008 [95],
Abrahamson and Silva 2008 [96], Campbell and Borzognia 2008 [97] along with
Abrahamson and Silva 1997 [22] were assigned to sources of Zagros and the Oman
Mountains. For the Makran region, Atkinson and Boore 2003 [98] and Youngs et al.
1997 [23] were used due to their suitability for earthquakes generated in subduction
zones. The equation by Atkinson and Boore 2006 [99] was assigned to the Arabian
Craton.
Gridded Seismic Hazard Analysis
The computer application used in this study facilitates the option of
performing single site and multi-site seismic hazard analysis. Hence, the shape of
U.A.E. was defined in EZFRISK and a grid of nodes was plotted on the U.A.E. map.
Latitudes and Longitudes of all the nodes were recorded. EZFRISK already has a
predefined seismic source model for the Middle East. But for this study, a separate
seismic source model was defined in EZFRISK along with recurrence parameters for
each source. The attenuation equations obtained from EZFRISK’s database were
assigned to the seismic source zones. The input data was validated and gridded
seismic hazard analysis was performed. Figure 4.2 shows the gridded map of U.A.E.
developed in EZFRISK.

39
Figure 4.2 – Grid of nodes used in Gridded Seismic Hazard Analysis.
Presentation of results for Seismic Hazard Analysis
For each of the nodes in the grid in Figure 4.2, EZFRISK produced a seismic
curve and a uniform hazard spectrum (UHS). Seismic curves corresponding to
spectral acceleration of 0.2s, 1s and 3s are also produced. Preferences for Uniform
Hazard Spectra (UHS) can also be predefined in EZFRISK depending on the need.
UHS can be plotted for any return period.
Probabilistic Seismic Hazard Analysis combines all the seismic source zones
to determine the hazard at a particular site. However, designers and researchers
usually are also interested in the contribution of the sources to the hazard. The process
of determining the contribution from the seismic sources to the hazard at site is called
‘Deaggregation’. EZFRISK has the option of performing deaggregtation for any
spectral acceleration. The results are presented in the form of 2D and 3D graphs
showing the contribution of each combination magnitude and distance has to the
hazard. Since our aim is to find the combination of magnitude and distance which
contributed greatest to the Peak Ground Acceleration (PGA) on the site of interest, the
PGA should be known before performing deaggregation. Therefore, the seismic
hazard analysis was performed first without the deaggregation option. Once the PGA
was known, the seismic hazard analysis was repeated with the deaggregation option
activated. Using the distance and magnitude combination that contributed greatest to
22
22.5
23
23.5
24
24.5
25
25.5
26
26.5
51 52 53 54 55 56 57
La
titu
de
Longitude

40
the hazard, ground motion time histories were selected for spectral matching and site
response analysis for Sharjah, Dubai and Abu Dhabi. Deaggregation was performed
for all the seven emirates of U.A.E.
Spectral Matching
Constructing an accurate representative time history for a target spectrum is
integral in the outcome of any site response analysis. This will rely on the results of
deaggregation from gridded seismic hazard analysis. In this study, a commercial
computer software called RSP Match EDT was used to match time histories results to
the target spectra.
This application required two major inputs for matching:
• Target response spectrum – is a result of Seismic Hazard Analysis. For Dubai,
Sharjah and Abu Dhabi, these were obtained from the results of Gridded
Probabilistic Seismic Hazard Analysis (GPSHA) of U.A.E. This is called ‘Target’
because the response spectrum of a time history is customized to be matched to
this response spectrum.
• Time histories to be matched – two time histories each for Dubai, Sharjah and
Abu Dhabi were chosen according to the criteria described by Bommer and
Avecedo 2004 [100] for selection of time histories. Bommer and Avecedo 2004
[100] mention some conditions for selecting the ground motion time histories such
as the spectral shape and similarity in magnitude and distance. Therefore, each
response spectrum of the chosen time history was compared to the target spectrum
to choose the time history which gives the closest response spectrum in terms of
the shape along with the closeness in deaggregation results (Table 4.3). An
alternative to obtain the input ground motion was to create an artificial time
histories to match regional mechanisms for the Arabian Peninsula region.
However, selecting the time histories based on parameters such as magnitude,
source to site distance and Peak Ground Acceleration is more important than
based on the local mechanism [100].
Other input values such as the maximum waves, maximum wavelets and
interpolation values were required by RSP Match EDT. The values used for those
inputs are given in Figure 21 which shows the screen shot of the main menu of RSP
Match EDT. Defaults values for some of the parameters were used because, according

41
to the manual of RSP Match EDT, they were not known to affect the matching
process significantly.
The ground motion time histories selected were in PEER (Pacific Earthquake
Engineering Research) format. Therefore, the time histories had been converted to the
compatible format before matching was done. Once the suit of time histories was
ready, target response spectrum was defined and RSP Match EDT was run. The
details of time histories used for matching are given in Table 4.4.
Table 4.3 – Criteria for selecting time histories
Cities PGA Range (g) Magnitude Range Distance Range (km)
Dubai 0.10-0.12 5.5-6.5 20-40
Abu Dhabi 0.07-0.1 5.5-6 35-45
Sharjah 0.12-0.13 5.5-6 25-35
Table 4.4 – Time histories selected for spectral matching
City Earthquake Station Component PGA
(g)
Distance
(km) Magnitude
Dubai
Chi-Chi,
Taiwan-02
1757, 09/19/79
CWB 9999936
TCU129
TCU-129-
E 0.1173 27 5.9
Dubai
Morgan Hill
1984-04-24
21:15
CDMG 47006
Gilroy - Gavilan
Coll.
GIL 337 0.1014 25 6.19
Abu
Dhabi
Whittier
Narrows-01
1987-10-01
14:42
USC 90062 Mill
Creek, Angeles
Nat For
A-ANG090 0.071
38 5.99
Abu
Dhabi
Little Skull
Mtn,NV 1992-
06-29
USGS 99999
Station #2-NTS
Control Pt. 1
LSM-2270 0.091 30 5.9
Sharjah
Whittier
Narrows-01
1987-10-01
14:42
USC 90062 Mill
Creek, Angeles
Nat For
A-ANG000 0.089 38 5.99
Sharjah
Little Skull
Mtn,NV 1992-
06-29
USGS 99999
Station #2-NTS
Control Pt. 1
LSM-2000 0.119 30 5.19

42
Site Response Analysis
Amplification of seismic waves has been witnessed in the past in earthquakes
such as the Mexico City in 1985, Los Angeles in 1995 and San Francisco in 1989
[101, 102]. The soil amplification is sometimes known to be the sole reason behind
the disastrous consequences of an earthquake. Although the Mexico City earthquake
originated from a distance of 400kms, the seismic waves in Mexico were amplified by
five times the original intensity. Hence, the intensity of site amplification on seismic
waves is an important factor in designing structures to mitigate earthquake damage.
To predict site amplification, the knowledge of variation of shear wave
velocities laterally and in depth for different points in a region is essential. Other
required information is the unit weights and both damping ratio and shear modulus
curves for different soil in the site profile. While the static properties of soil profiles
can be retrieved from the geotechnical investigations done for majority of private and
government projects, few projects attempt to perform geophysical investigations to
determine the dynamic properties. Therefore, the geophysical data available for site
response analysis is limited.
In this study, 1D equivalent linear site response analysis was performed for
around 100 boreholes from different parts of U.A.E. Borehole logs were selected
based on the spatial distribution for cities of Dubai, Sharjah and Abu Dhabi. These
borehole logs represented typical sand and rock composition in U.A.E. The
commercial program SHAKE 2000 was used to perform site response analyses on
these 100 boreholes.
SHAKE 2000 is a FORTRAN program used for performing one dimensional,
equivalent nonlinear site response analysis. It is one of the oldest geotechnical
earthquake engineering programs developed for mainframe environments in 1970’s
by Schnabel et al. 1972 [77]. Since then it has gone through many modifications to
make it more user friendly and compatible for today’s advanced computer features.
Inputs for SHAKE 2000
• Thickness and material type for Layers - will depend on the geology and
composition of underground soils. The borehole logs were used to define the
material type and thickness values to be input to SHAKE 2000.

43
• Shear modulus and Damping ratio curves - depending on the type of soil in the
borhole profile, shear modulus and damping curves were assigned to those
layers. Several damping and modulus curves have been proposed in the past
such as Schnabel 1973 [103], Seed et al. 1986 [104], and Sun et al. 1988
[105]. These studies have been derived for specific soil types such as sand,
clay and gravel. In UAE, majority of the top composition of soils are sandy.
Hence, two widely accepted shear modulus and damping curves (Seed and
Idriss 1970 [106] for sandy soils, and Schnabel 1973 [103] for rocks) were
used in this study. Figures 4.3 and 4.4 show the plots of modulus reduction
and damping ratio curves used for both sandy soil and bedrock.
Figure 4.3 – Modulus reduction curves
Figure 4.4 – Damping ratio curves
0
0.2
0.4
0.6
0.8
1
1.2
0.0001 0.001 0.01 0.1 1
Mo
du
lus
Red
uct
ion
(G
/Gm
ax
)
Strain (%)
Seed and Idriss
(1970)
Schnabel (1973)
0
5
10
15
20
25
30
0.0001 0.001 0.01 0.1 1
Dam
pin
g r
ati
o (
%)
Strain (%)
Seed and Idriss
(1970)
Schnabel (1973)

44
• Shear Wave Velocity - is the dynamic property that used to characterize the
strength of soil. Stiff soils are known to have greater shear wave velocities
than soft soils. Various geophysical methods such as seismic refraction
surveys, seismic crosshole and downhole tests and seismic cone penetration
test (SCPT) have been developed over the years to measure shear wave
velocity of soils. However, since the geophysical tests are usually expensive to
perform, many researchers have developed correlations which can be used to
predict shear wave velocity using in site tests such as Standard Penetration
Test Number (SPT-N). In this study, the correlations proposed by Hasancebi
and Ulusay 2006 [24], Shibata (1970) [25], Seed and Idriss (1981) [26] and
Athanasopoulos (1995) [27] were used to estimate average shear wave
velocities of different soil layers from the soils’ SPT-N values (Equations 4.1,
4.2, 4.3 and 4.4 respectively).
V# = 90.82 × N+.��, [4.1]
V# = 31.7 × N+.�0 [4.2]
V# = 61.4 × N+.� [4.3]
V# = 107.6 × N+.�� [4.4]
Where Vs – shear wave velocity in m/s
N – Standard Penetration Test Number (SPT-N)
The variation of the shear velocity predicted using the four abovementioned
equations for one borehole loge is shown in Figure 4.5. Despite the similarity in the
trend of shear wave velocity predicted with the four equations with depth, some
discrepancies are clear from the figure. For example; the shear wave velocity values
predicted by Shibata (1970) [4.2] and Hasancebi and Ulusay (2006) [4.1] are closer to
each other and located in the lower side of the shear wave velocity axis. However,
values predicted by Seed and Idriss (1981) [4.3] and Athanasopoulos (1995) [4.4] are
in good agreement and located in the larger side of shear wave velocity axis. To
remove these discrepancies, it is decided to use the average shear wave velocity
predicted by the four proposed equations.

45
Figure 4.5 – Plot of shear wave velocity versus depth
For each of the boreholes, the average value of the shear wave velocities
predicted from the four proposed correlation equations was used. In some cases where
there were more than one SPT-N value given in a layer, the group of SPT-N values
were averaged to estimate a representative shear wave velocity for the layer.
For rocks, Unconfined Compression Strength (UCS) was used to predict the
shear wave velocity. The values of UCS were obtained from the borehole logs
collected in this study. The correlations proposed by Gotkan (1988) [28], Khandelwal
and singh (2009) [29] and Chary et al. (2006) [30] were used to predict the shear
wave velocity (Equations 4.5, 4.6 and 4.7 respectively).
25
20
15
10
5
00 200 400 600 800
Depth
(m
)
Shear wave velocity (m/s)
Seed and Idriss (1981)
Athanasopoulos (1995)
Shibata (1970) Hasancebi and Ulusay (2006)
Average

46
V3 = 4�#5��.��+.+�� [4.5]
V3 = 4�#5�.�,+.���� [4.6]
V3 = 4�#50.���+.+�00 [4.7]
Where VP is compressional wave velocity and UCS is Unconfined Compression
Strength (MPa).
These correlations predicted the compressional wave velocity of the bedrock
from its Unconfined Compression Strength (UCS). Therefore, with an assumption of
the value of Poisson’s ratio, shear wave velocity was computed using Equation [4.8].
VS=VP
62-2µ
1-2µ
[4.8]
Where VP = compressional wave velocity (m/s), VS = shear wave velocity (m/s) and µ
= Poisson’s ratio
As in the case of SPT-N, the layers for which more than one UCS value were
measured; an average value of shear wave velocity corresponding to an average UCS
for that layer was used for representing the layer in site response analysis.
• Unit Weight - is a static property of soils measuring the degree of compaction of the
soils. The study of Koloski et al. 1989 [107] was used to determine the unit weights
for different types of soils. The values given in this study are in the form of ranges.
Hence, average values were selected because a small variation in unit weight does not
affect the results of site response analysis drastically. To verify this conclusion, a
selected ground motion was propagated beneath two identical soil profiles with
different unite weight, using SHAKE 2000. Figure 4.6 shows the results in the form
of response spectra of top layers. In both cases, good agreement between the response
spectra is clear (i.e. the red and green plots).
• Input Ground Motion Time Histories - are required to be propagated through soil
profiles defined in SHAKE 2000 in order to find the response of soils. After RSP
spectral matching for Dubai, Sharjah and Abu Dhabi was performed, the matched
time histories shown in Table 4.4 were input in SHAKE 2000. The input motion time

47
histories have to be defined in a SHAKE 2000 compatible form in order to run.
Hence, the time histories were converted in SHAKE 2000 compatible form using the
option available in SHAKE2000.
Figures 4.6 – Response spectra on surface and half space using LSM2270
Input Motion Assigned to a Layer
The purpose of performing site response analysis is to measure the response of
a soil profile on a time history when the time history is propagated through it. The
time history has to be assigned on top of a particular layer. That layer is called the half
space or the engineering bedrock (Vs = 760 m/s).
Results obtained
Once all the input data was entered, SHAKE 2000 was made to run and
process the results. Numerous results such as the response spectra, amplitude spectra,
Fourier spectra and resulting time histories were obtained from SHAKE 2000
processed files. Depending on the need of the user, the options for output data can be
customized. In this study, the only outputs required from the site response analysis
were the response spectra on the surface layer and the half space. The response
spectrum represents the maximum response of a single degree of freedom (SDOF)
0
0.2
0.4
0.6
0.8
1
1.2
0.03 0.3 3
Sp
ectr
al A
ccel
era
tio
n (
g)
Period (s)
LSM2270
one profile
second
profile

48
system as a function of the natural frequency of the system and used to model the
response of structures [39].
Site Classification
Average Shear Wave Velocity is used to represent a soil profile. Weighted
average shear wave velocity for the top 30m of a soil profile was computed for each
soil profile because the top 30m is largely responsible for site amplification [108].
This method of site classification is also adopted by National Earthquake Hazard
Reduction Program [49] also. Therefore, it will be used in this study. However, in
some cases, the engineering bedrock (VS ≥ 760m/s) was encountered before 30m, so
the average shear wave velocity was calculated for the depth above the engineering
bedrock. While in other instances, where the engineering bedrock was deeper than
30m, the 30m average shear wave velocity was used because if little or no
information is available for larger depths, the 30m assumption may be adequate to
estimate site response [109].
The average shear wave velocities for the top 30m (VS30) of all soil profiles
were computed in order to determine site classes of soil profiles according to the soil
classification of NEHRP [49]. All the 100 boreholes used in this study were either site
class C (VS is 360m/s to 760m/s) or D (VS is 180m/s to 360m/s). The input ground
motion was propagated from half space layer (below 30m) and the response was
recorded at the top of surface layer by SHAKE 2000. In some cases, half space was
less than 30m because the engineering bedrock velocity (760 m/s – Site class B) was
encountered at a depth before 30 m.
Computing Site Factors
Using the response spectra on the surface layer and half space, site
amplification factors were calculated at 0.2 and 1s periods. An example is shown in
Figure 2.5. The red color response spectrum is at the half space and the blue color is
at the surface layer. Using the values from the two response spectra, FA and FV were
calculated for all sites used in this study. Statistical analysis was performed on
response spectra on surface of all the boreholes.

49
CHAPTER 5: RESULTS AND DISCUSSION
Gridded Seismic Hazard Analysis
A comprehensive probabilistic seismic hazard analysis was performed for
UAE using modified source model, updated catalogue of seismic events, and new
generation attenuation equations. The main results of the study are presented in this
section. All results correspond to 2 % probability of excedence in 50 years on rock
sites unless stated otherwise. This level of probability corresponds to the ground
motion at the site and not of the events that generate ground motions. The results
include contour maps of PGA and spectral accelerations, seismic hazard curves,
Uniform Hazard Spectra, and PGA and spectral accelerations for main cities with and
without the effect of west coast fault.
The hazard curves for selected cities are presented in Figure 5.1. The peak
ground accelerations corresponding to different return periods can be determined from
the plot. Five out of eight cities which are on the western side of U.A.E. follow a
similar pattern because of dominant effect from seismicity in Zagros region.
However, Fujairah has a slightly different trend because of larger contribution from
Oman Mountains. At larger return periods, the seismicity of Dubai, Sharjah, Ajman
and Ras Al Khaimah overcomes the seismicity of Fujairah because of larger
contribution from near sources such as Arabian stable craton.
The annual rate of exceedence (λ (1/yr)) for a return period of 2475 years is
calculated using Equation [5.1]. Using the value of λ1/yr and seismic curves in Figure
5.1, Peak Ground Accelerations for eight cities of U.A.E. were estimated. PGAs
corresponding to other return periods (475 and 10000 years) were also calculated in
order to compare the results of this study and previous studies.
7� 89:� = �;< [5.1]
Tables 5.1 to 5.3 show the Peak Ground Acceleration (PGA) and spectral
accelerations for major cities in U.A.E. for return periods of 2475, 475 and 10000
years. The PGA for Ras Al Khaimah is the largest amongst the emirates lying on the
North Western boundary of U.A.E. This was expected because Ras Al Khaimah is
located closest to the Zagros region as well as to Oman Mountains. The Zagros region
was expected to be the potential hazard for cities. However, PGA for Fujairah is the

50
greatest. This is not unexpected because even though Ras Al Khaimah is closer to the
Zagros region, the effect of Oman Mountains would have contributed to the hazard
for Fujairah in addition to Zagros region.
Figure 5.1 – Seismic curves of the eight cities of U.A.E.
Table 5.1 – Spectral Accelerations for the eight cities of U.A.E.
Return Period 2475 years
Emirate Latitude Longitude PGA
(g)
0.2s
(g)
1s
(g)
2s
(g)
3s
(g)
4s
(g)
Abu Dhabi 24.5 54.35 0.073 0.178 0.075 0.045 0.025 0.017
Ajman 25.42 55.5 0.122 0.300 0.113 0.070 0.039 0.026
Sharjah 25.38 55.43 0.120 0.285 0.109 0.068 0.037 0.025
Fujairah 25.12 56.3 0.250 0.565 0.131 0.073 0.040 0.028
Dubai 25.3 55.33 0.118 0.202 0.087 0.055 0.030 0.020
Ras Al Khaimah 25.83 56 0.150 0.356 0.126 0.074 0.041 0.028
Umm al Quwain 25.46 55.6 0.144 0.314 0.118 0.071 0.040 0.027
Al Ain 24.23 55.75 0.097 0.225 0.082 0.048 0.027 0.018
1E-08
0.0000001
0.000001
0.00001
0.0001
0.001
0.01
0.1
1
10
0.0001 0.001 0.01 0.1 1 10
An
nu
al
Fre
qu
ency
of
Ex
ceed
ence
Peak Ground Acceleration (PGA, g)
Ajman
Sharjah
Fujairah
Ras Al
KhaimahUmm Al
QuwainAl Ain
Dubai
Abu Dhabi

51
Table 5.2 - Spectral Accelerations for the eight cities of U.A.E.
Return Period 475 years
Emirate Latitude Longitude PGA
(g)
0.2s
(g)
1s
(g)
2s
(g)
3s
(g)
4s
(g)
Abu Dhabi 24.5 54.35 0.035 0.071 0.040 0.033 0.016 0.009
Ajman 25.42 55.5 0.055 0.140 0.058 0.033 0.020 0.012
Sharjah 25.38 55.43 0.052 0.141 0.058 0.032 0.018 0.014
Fujairah 25.12 56.3 0.113 0.249 0.057 0.032 0.018 0.012
Dubai 25.3 55.33 0.047 0.121 0.052 0.031 0.017 0.011
Ras Al Khaimah 25.83 56 0.070 0.175 0.063 0.036 0.021 0.014
Umm al Quwain 25.46 55.6 0.060 0.152 0.059 0.034 0.020 0.013
Al Ain 24.23 55.75 0.038 0.088 0.045 0.030 0.021 0.012
Table 5.3 - Spectral Accelerations for the eight cities of U.A.E.
Return Period 10000 years
Emirate Latitude Longitude PGA
(g) 0.2s (g) 1s (g) 2s (g) 3s (g) 4s (g)
Abu Dhabi 24.5 54.35 0.105 0.220 0.098 0.072 0.042 0.031
Ajman 25.42 55.5 0.162 0.380 0.151 0.088 0.053 0.033
Sharjah 25.38 55.43 0.167 0.350 0.142 0.084 0.048 0.041
Fujairah 25.12 56.3 0.337 0.813 0.178 0.094 0.053 0.036
Dubai 25.3 55.33 0.139 0.318 0.128 0.084 0.047 0.031
Ras Al Khaimah 25.83 56 0.201 0.474 0.169 0.098 0.055 0.037
Umm al Quwain 25.46 55.6 0.018 0.400 0.156 0.090 0.052 0.034
Al Ain 24.23 55.75 0.134 0.371 0.203 0.083 0.061 0.048
Comparison of the results from this study with important previous studies is
presented in Table 5.4. For the comparison it is assumed that all the authors reported
the hazard at rock sites and that the geometric mean of the horizontal component was
used in prediction equations. Except for Abdallah and Al Hamoud 2004 [7] all studies
practically gives similar results for the cities of Dubai and Abu Dhabi. For Ras Al
Khaimah however, the estimate of most recent study [71] is under estimated. As noted
earlier in the section of seismic zonations, the extension of southern boundary of
South Zargos will slightly elevate the seismic hazard in northern cities of UAE. This
small increase is justifiable because the inclusion of events along the coast of Iran in
the activity of Arabian Craton will unnecessarily increase the hazard in central and
southern UAE. Creation of new smaller zone at the south of South Zargos is also not
supported by spatial distribution of events. This new zone will result in the

52
underestimation of Zargos region as a source capable of generating strong ground
motions in UAE.
Figures 5.2-5.4 show the comparison of seismic curves for Peak Ground
Acceleration of this study with Aldama et al. 2009 [71] and Peiris et al. 2006 [8] for
Abu Dhabi, Ras Al Khaimah and Dubai. These figures also indicate the closeness of
results amongst these studies for PGA. Abdallah and Al Homoud (2004) only
presented the contour maps of Peak Ground Acceleration for U.A.E. Therefore, the
seismic curves of their seismic hazard analysis could not be presented here.
Table 5.4 – Comparing PGAs of this study with some of the previous hazard studies
Peiris et al (2006)
Aldama et al.
(2009)
Abdalla and Al
Homoud (2004) This study
City 475 yr 2475 yr 475 yr 2475 yr 475 yr 2475 yr 475 yr 2475 yr
Dubai 0.060 0.120 0.047 0.090 0.153 0.194 0.047 0.117
Abu Dhabi 0.050 0.100 0.035 0.080 0.122 0.143 0.035 0.072
Ras Al
Khaimah - - 0.060 0.110 0.163 0.224 0.07 0.149
Figure 5.2 – Comparison of seismic curves for Abu Dhabi (PGA)
1E-08
0.0000001
0.000001
0.00001
0.0001
0.001
0.01
0.1
0.027 0.27 2.7
An
nu
al
Fre
qu
ency
of
Ex
ceed
ence
Peak Ground Acceleration (PGA, g)
This study
Aldama et al.
2009
Peiris et al.
2006

53
Figure 5.3 – Comparison of seismic curves for Ras Al Khaimah (PGA)
Figure 5.4 – Comparison of seismic curves for Dubai (PGA)
Figure 5.5 presents the Uniform Hazard Curves for selected cities for a return
period of 2475 years. This figure also signifies the difference between the hazard of
Fujairah and other emirates. The spectral acceleration at 0.2s for Fujairah is almost
twice that of Ras Al Khaimah. The Uniform Hazard Spectra of Dubai, Sharjah, Ajman
and Umm Al Quwain are very close to each other due to the fact that they are
spatially very close.
0.0000001
0.000001
0.00001
0.0001
0.001
0.01
0.1
1
10
0.001 0.01 0.1 1
An
nu
al
Fre
qu
ency
of
Ex
ceed
ence
Peak Ground Acceleration (PGA, g)
This study
Aldama et al. 2009
0.000001
0.00001
0.0001
0.001
0.01
0.1
0.027 0.27
An
nu
al
Fre
qu
ency
of
Ex
ceed
ence
Peak Ground Acceleration (PGA, g)
This study
Aldama et al.
2009
Peiris et al.
2006

54
Figure 5.6 compares the Uniform Hazard Spectra for a return period of 2475
years for Dubai of this study with that of Sigbjornsson and Elnashai 2006 [74], Peiris
et al 2006 [8] and Aldama et al. 2009 [71]. Clearly the UHS of Sigbjornsson and
Elnashai 2006 [74] is very different from the other three studies. Although the seismic
zoning used by Sigbjornsson and Elnashai 2006 [74] is different from Abdallah and
Al Homoud 2004 [7], the results of these studies have similarities. But, as discussed
in the Literature Review, there were few shortcomings which could have made their
results conservative.
Figure 5.5 – UHS for the eight cities of U.A.E.
Figure 5.6 – Comparison of UHS for Dubai (return period - 2475 years)
0.05
0.15
0.25
0.35
0.45
0.55
0.65
0.02 0.2 2
Sp
ectr
al A
ccel
era
tion
(g
)
Spectral Period (s)
Umm Al
QuwainRas al
khaimahDubai
Fujairah
Sharjah
Ajman
Abu Dhabi
AL Ain
0
0.2
0.4
0.6
0.8
1
0 1 2 3
Sp
ectr
al A
ccel
erati
on
(g
)
Spectral Period (s)
Aldama et al. 2009
Sigbjornsson and elnashai
(2006)
Peiris et al (2006)
This study

55
Figure 5.7 shows the Uniform Hazard Spectra for Dubai for a return period of
475 years of this study, Aldama et al. 2009 [71], Peiris et al. 2009 [8] and Musson et
al. 2006 [68]. Musson et al. 2006 [68] is another study which has given similar
results. The UHS of this study is more in line with that of Musson et al. 2006 [68].
Figure 5.7 – Comparison of UHS for Dubai (return period - 475 years)
Contours for PGA and spectral accelerations at 0.2s and 1s
The advantage of performing the Gridded PSHA for this study was that
generalized results of PSHA could be presented to the designers which could be
interpreted easily. Hence, using the Peak Ground Acceleration (PGA) and spectral
accelerations at 0.2s and 1s for all the nodes in the grid (Figure 4.2), a computer code
of ArcGIS was employed to plot the contour maps of the accelerations over the map
of U.A.E. Figures 5.8-5.10 present the contours of peak ground accelerations (PGA)
and spectral accelerations (S0.2 and S1) for UAE. The results indicate higher seismicity
levels towards the east and northeast of the country with relatively little difference in
seismicity level with in the southern part (emirate of Abu Dhabi) of UAE. These
results are in line with the general expectation of hazard distribution in UAE due to
the presence of active sources towards the North and East. The seismic hazard in the
cities along the western coast is generally dominated by the Zargos; whereas Oman
Mountains contribute largely to the hazard on the eastern side. PGA contour maps can
be used to retrieve the PGA for any structure. The PGA values are then used for other
0
0.05
0.1
0.15
0 0.5 1 1.5 2 2.5 3
Sp
ectr
al A
ccel
era
tio
n (
g)
Spectral Period (s)
Aldama et al. 2009
Musson et al.
(2006)
Peiris et al. (2006)
This study

56
earthquake mitigation methods such as liquefaction assessment and seismic
displacement of retaining walls.
Figure 5.8 – Contour map for 2475 year return period Peak Ground Acceleration.
The design response spectrum for a particular structure is plotted by extracting
the data from the contour maps of spectral accelerations at 0.2 and 1s (Figure 2.6).
The values of SS and S1 are taken from the contour maps shown below according to
the approximate location of the structure. The site amplification factors FA and FV are
retrieved from a site specific response analysis performed for a particular project.
Figure 5.9 – Contour map for 2475 year return period spectral acceleration at 0.2s.

57
Figure 5.10 – Contour map for 2475 year return period spectral acceleration at 1s.
Macrozonation
Based on the Uniform Hazard Spectra and the contour maps presented above,
another map is presented in Figure 5.11. The map of U.A.E. has been divided into
zones that represent a range of Peak Ground Acceleration and Spectral Accelerations
at 0.2s and 1s. Based on the location of their sites, designers can obtain UHS
representative of that zone for dynamic or response analysis. The UHS representing
proposed zones (Figure 5.11) are presented in Figure 5.12. The UHS representing
major cities are presented and discussed separately (Figure 5.5). Typically the UHS
representing a specific city should be reasonably similar to UHS of the corresponding
zone presented in Figure 5.12. The development in UAE is expected to continue and
more projects are being contemplated and constructed well outside the limits of the
cities. In fact smaller cities of UAE are also growing at a considerable pace and
Figure 5.12 is an attempt to address the requirements of these areas. These spectral
accelerations would be applicable for rock site classifications only. This form of maps
has not been presented in any of the earlier hazard studies. In Figure 5.11, the legend
colors descend from the North East region of U.A.E., which includes Fujairah, to the
Southern region which includes Abu Dhabi and Al Ain.

58
Figure 5.11 – Proposed zonation of UAE based on equal increments of mapped
hazard
Figure 5.12 - UHS representing the proposed zonation of UAE
0
0.1
0.2
0.3
0.4
0.5
0.6
0.7
0 0.5 1 1.5
Sp
ectr
al A
ccel
era
tio
n (
g)
Spectral Period
Zone 1
Zone 2
Zone 3
Zone 4
Zone 5
Zone 6
Zone 3
Zone 6
Zone 5
Zone 4
Zone 2
Zone 1

59
Deaggregation
The seismic hazard at a site represents the total effect of different
combinations of earthquake magnitudes and distances. Consequently, different parts
of the UHS should be matched by time histories of small and close earthquakes for
short periods and large and distant earthquakes for long periods. The choice of
magnitude and distance is aided by a technique (deaggregation) that presents (Figure
5.13) earthquake–distance combinations that make the largest contribution to the total
hazard [34, 42, and 43]. Deaggregations help the designers in choosing time histories
wisely.
The deaggregation of hazard (PGA and spectral acceleration at 1s for return
period of 475 years) for Abu Dhabi indicates that most of the hazard coming from
magnitude 6.5 earthquakes at a distance of 80–100 km contributes to the PGA or very
short period acceleration (Figure 5.13). The deaggregation of hazard for acceleration
at 1s however indicates that a mean magnitude-distance combination of 7.25 and 300
km will have the largest contribution to the hazard. As expected, contributions from
larger earthquakes occurring at longer distances tend to contribute more with the
increase in spectral period. For Abu Dhabi especially this contribution is from
earthquakes occurring in Zargos and Oman Mountains.
Figure 5.13: Deaggregation of hazard for Abu Dhabi – (a) PGA and (b) 1s
(a) (b) 4
.25
4.7
5
5.2
5
5.7
5
6.2
5
6.7
5
7.2
50
10
20
30
12
.5
62
.5
11
2.5
16
2.5
21
2.5
26
2.5
31
2.5
36
2.5
Co
ntr
ibu
tio
n [
%]
4.2
5
4.7
5
5.2
5
5.7
5
6.2
5
6.7
5
7.2
5
0
5
10
12
.5
62
.5
11
2.5
16
2.5
21
2.5
26
2.5
31
2.5
36
2.5
Co
ntr
ibu
tio
n [
%]

60
Figure 5.14: Deaggregation of hazard for Ras Al Khaimah – (a) PGA and (b) 1s
Figure 5.14 presents the degaggregation of PGA and S1 (return period = 2475
years) for Ras Al Khaimah. The deaggregation of PGA suggests a dominant
magnitude-distance scenario of 5 and 40 km. The deaggregation of S1 suggests two
probable scenarios. One scenario is for magnitude of 6 and distance of 40 km and the
other with a magnitude of 6.75 and distance of 200 km. The time history analysis
shall therefore consider both scenarios.
These deaggregations suggest that sites located in the south of UAE are
affected by distant earthquakes and this distance increases with increase in spectral
period. On the other hand the sites located in the North are influenced by earthquakes
that are generated in nearby active zones and also by large earthquakes in distant
zones such as Makran. The deaggregation for spectral period of 0.2s is not
significantly different than the deaggregation for PGA at this return period (2475
years) and is therefore not included.
4.2
5
4.7
5
5.2
5
5.7
5
6.2
5
6.7
5
7.2
5
0
2
4
6
8
10
12
.5
62
.5
11
2.5
16
2.5
21
2.5
26
2.5
31
2.5
36
2.5
Co
ntr
ibu
tio
n [
%]
4.2
5
4.7
5
5.2
5
5.7
5
6.2
5
6.7
5
7.2
5
0
5
10
15
12
.5
62
.5
11
2.5
16
2.5
21
2.5
26
2.5
31
2.5
36
2.5
Co
ntr
ibu
tio
n [
%]
(b)
(a)

61
Source Contribution
Along with the deaggregation performed by EZFRISK, another form of
deaggregation was performed in this study. Seismic Hazard Analysis was performed
seven times each for the cities of Dubai, Abu Dhabi, Al Ain, Ras Al Khaimah and
Fujairah with each seismic source individually. This was termed as ‘Source
Contribution’.
The contributions from all the seismic sources to the seismic hazard in
selected cities are presented in Table 5.5. The table presents the values of PGA (return
period 2475) inferred from the hazard curves corresponding to individual sources for
the selected cities. The last column presents the total hazard from all sources using
the hazard curve of total seismicity.
Table 5.5: Contribution of different sources to the hazard in selected cities
As expected the effect is directly related to the proximity of a city to the
source. The total seismic hazard in Abu Dhabi is governed by seismicity from
Arabian Craton and South Zargos; whereas, the hazard in Dubai is dominated by
South Zargos. On the other hand, Oman Mountains has significant effect on the
hazard computed in Fujairah and Ras Al Khaimah with later affected equally by
South Zargos.
Source
City
Arabian
Craton
High
Zagros
Oman
mountains
South
Zagros Z-M
Makran
bottom
Makran
top
TOTAL
HAZARD
Fujairah 0.019 0.025 0.203 0.035 0.034 0.036 0.011 0.244
Ras Al
Khaymah 0.024 0.036 0.093 0.092 0.043 0.032 0.013 0.149
Dubai 0.034 0.029 0.035 0.074 0.026 0.019 0.007 0.117
Al Ain 0.037 0.021 0.058 0.026 0.021 0.018 0.005 0.094
Abu Dhabi 0.040 0.023 0.017 0.037 0.019 0.010 0.003 0.072

62
PSHA with West Coast
West coast fault is reported by some studies [82] as a potential seismic source
close to the major cities of Ras Al Khaimah, Dubai, and Abu Dhabi. The effect of
west coast on the PSHA was also studied. The slip rate for the fault (assumed to be
0.5 mm/yr) was used to estimate the activity parameters following the methodology
presented in earlier section. The slip rates were inferred from the study by Vernant et
al. 2004 [79] that presents the rotational movement of Arabian Peninsula from GPS
measurements. The rotational movements can be used infer the relative slip of faults
in the UAE.
Figure 5.15 presents the comparison of hazard curves for Abu Dhabi and
Dubai with and without west coast fault. The curves are very similar up to a return
period of 2475 years but tend to deviate significantly at larger return periods. The
PGA values for Abu Dhabi corresponding to return period of 2475 increases from
0.072g to 0.091g and from 0.12g to 0.23g for a return period of 10000 years.
Similarly for Dubai the PGA values corresponding to return period of 2475 increases
from 0.11g to 0.112g and from 0.22g to 0.4g for a return period of 10000 years. At
return periods of 10000 and larger the seismic hazard for Abu Dhabi and Dubai is
significantly influenced by west coast fault.
Figure 5.15: Effect of west coast fault on hazard curves

63
Spectral Matching
Ground motion time histories for site response analysis were prepared by
performing spectral matching on RSP Match EDT. Firstly, the ground motion time
histories which matched the magnitude-distance combinations resulting from
deaggregation were obtained from Pacific Earthquake Engineering Research (PEER)
database (Table 4.4). The ground motion earthquake scenarios were for a return
period of 2475 years (2% in 50 years). Target Response Spectra for cities of Abu
Dhabi, Dubai and Sharjah which represented the deaggregation scenarios were used
(Table 4.3). The objective was to match the response spectrum of the selected time
history to a target response spectrum. The resulting time history of the matched
response spectrum was used in site response analysis, as bedrock input motion.
Satisfactory spectral matching was achieved with the six ground motion time
histories for the three cities. Figures 5.16-5.21 show the matching results in the form
of response spectra of original and matched time histories along with the response
spectra of the three cities. While, the matched and the target response spectra are in
perfect agreement, the original response spectra (before spectral matching) also have
relatively closer trends to the target response spectra.
Acceleration and time plots were plotted for the original and matched time
histories to compare the changes that spectral matching might have caused. Figure
5.22-5.27 show the comparison between the original and modified time histories. The
trends of both time histories in all the figures shows similar path. No drastic changes
in the time histories can be observed.

64
Figure 5.16 - Matching ANG-090 response on Abu Dhabi Target Response Spectrum
Figure 5.17 - Matching LSM2270 response on Abu Dhabi Target Response Spectrum
0
0.05
0.1
0.15
0.2
0.25
0.3
0.35
0.01 0.1 1 10
Sp
ectr
al A
ccel
era
tio
n (
g)
Period (s)
Abu Dhabi Target
spectrum
MATCHED
ORIGINAL
0
0.05
0.1
0.15
0.2
0.25
0.3
0.01 0.1 1 10
Sp
ectr
al A
ccel
erati
on
(g
)
Period (s)
Abu Dhabi Target
spectrum
Matched
Original

65
Figure 5.18 - Matching GIL337 response on Dubai Target Response Spectrum
Figure 5.19 - Matching TCU129-E response on Dubai Target Response Spectrum
0
0.05
0.1
0.15
0.2
0.25
0.3
0.01 0.1 1 10
Sp
ectr
al A
ccel
era
tio
n (
g)
Period (s)
Dubai Target
Response Spectrum
Matched
Original
0
0.05
0.1
0.15
0.2
0.25
0.3
0.35
0.4
0.45
0.5
0.01 0.1 1 10
Sp
ectr
al A
ccel
era
tio
n (
g)
Period (s)
Dubai Target
Response Spectrum
Matched
Original

66
Figure 5.20 - Matching ANG000 response on Sharjah Target Response Spectrum
Figure 5.21 - Matching LSM2000 response on Sharjah Target Response Spectrum
0
0.05
0.1
0.15
0.2
0.25
0.3
0.35
0.01 0.1 1 10
Sp
ectr
al A
ccel
era
tio
n (
g)
Period (s)
Sharjah Target
Response Spectrum
Matched
Original
0
0.05
0.1
0.15
0.2
0.25
0.3
0.35
0.4
0.45
0.01 0.1 1 10
Sp
ectr
al A
ccel
era
tio
n (
g)
Period (s)
Sharjah Target
Response Spectrum
Matched
Original

67
Figure 5.22 - Comparing ANG090 Original to Matched Time History
Figure 5.23 - Comparing LSM 2270 Original to Matched Time History
-0.08
-0.06
-0.04
-0.02
0
0.02
0.04
0.06
0.08
0 5 10 15 20
Acc
eler
ati
on
(g
)
Time (s)
Matched
Original
-0.08
-0.06
-0.04
-0.02
0
0.02
0.04
0.06
0.08
0.1
0.12
20 25 30 35 40Acc
eler
ati
on
(g
)
Time (s)
Matched
Original

68
Figure 5.24 - Comparing GILL337 Original to Matched Time History
Figure 5.25 - Comparing TCU129E Original to Matched Time History
-0.15
-0.1
-0.05
0
0.05
0.1
0.15
0.2
0 2 4 6 8 10
Acc
eler
ati
on
(g
)
Time (s)
Matched
Original
-0.15
-0.1
-0.05
0
0.05
0.1
0.15
0 5 10 15 20 25 30
Acc
eler
ati
on
(g
)
Time (s)
Matched
Original

69
Figure 5.26 - Comparing ANG000 Original to Matched Time History
Figure 5.27 - Comparing LSM2000 Original to Matched Time History
-0.15
-0.1
-0.05
0
0.05
0.1
0 5 10 15 20
Acc
eler
ati
on
(g
)
Time (s)
Matched
Original
-0.15
-0.1
-0.05
0
0.05
0.1
0.15
20 22 24 26 28 30 32 34
Acc
eler
ati
on
(g
)
t
Matched
Original
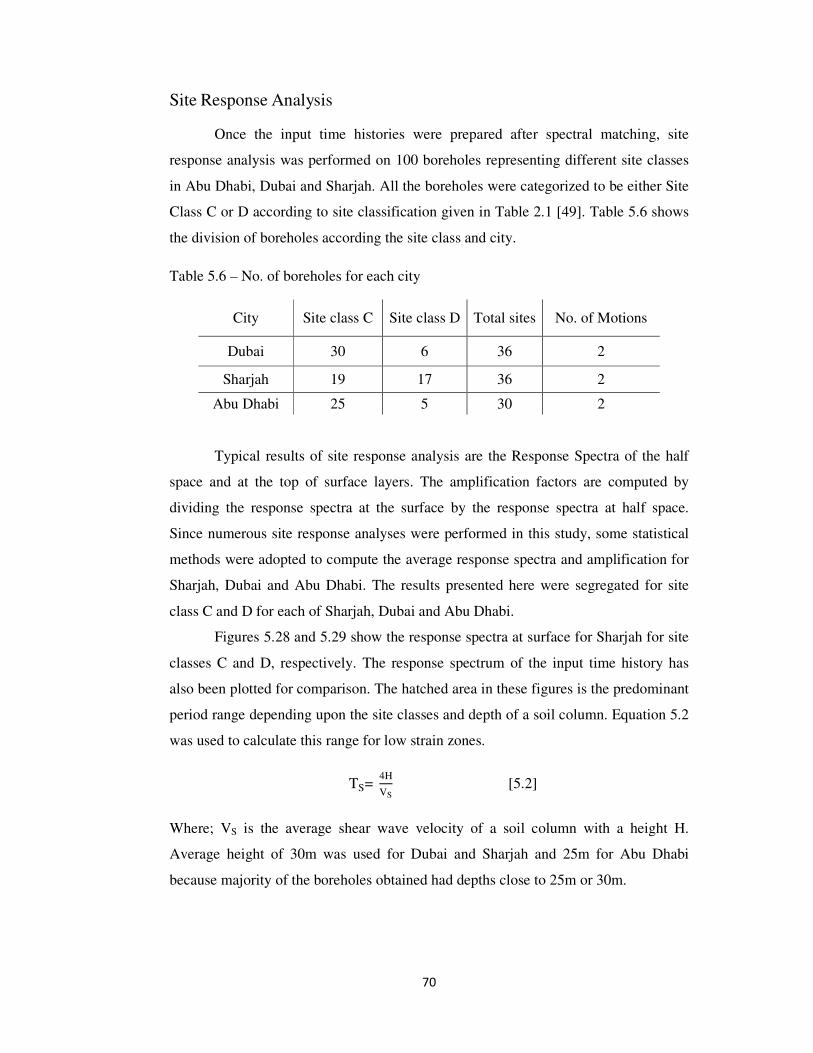
70
Site Response Analysis
Once the input time histories were prepared after spectral matching, site
response analysis was performed on 100 boreholes representing different site classes
in Abu Dhabi, Dubai and Sharjah. All the boreholes were categorized to be either Site
Class C or D according to site classification given in Table 2.1 [49]. Table 5.6 shows
the division of boreholes according the site class and city.
Table 5.6 – No. of boreholes for each city
City Site class C Site class D Total sites No. of Motions
Dubai 30 6 36 2
Sharjah 19 17 36 2
Abu Dhabi 25 5 30 2
Typical results of site response analysis are the Response Spectra of the half
space and at the top of surface layers. The amplification factors are computed by
dividing the response spectra at the surface by the response spectra at half space.
Since numerous site response analyses were performed in this study, some statistical
methods were adopted to compute the average response spectra and amplification for
Sharjah, Dubai and Abu Dhabi. The results presented here were segregated for site
class C and D for each of Sharjah, Dubai and Abu Dhabi.
Figures 5.28 and 5.29 show the response spectra at surface for Sharjah for site
classes C and D, respectively. The response spectrum of the input time history has
also been plotted for comparison. The hatched area in these figures is the predominant
period range depending upon the site classes and depth of a soil column. Equation 5.2
was used to calculate this range for low strain zones.
TS= 4H
VS [5.2]
Where; VS is the average shear wave velocity of a soil column with a height H.
Average height of 30m was used for Dubai and Sharjah and 25m for Abu Dhabi
because majority of the boreholes obtained had depths close to 25m or 30m.

Figure 5.28 – Response Spectra for Sharjah for Site Class C
Figure 5.29 – Response spectra for Sharjah for Site Class D
71
Response Spectra for Sharjah for Site Class C
Response spectra for Sharjah for Site Class D

According to Equation
depends on the average shear
Theoretically, the peaks of the response spectra of the various boreholes should be
within the range of predominant periods of the respective site class. However, in the
case of site class C for Sharjah, most of
natural period than the theoretical one (out of predominant period range). This could
be because the depths of several soil columns found in Sharjah were greater than 30m.
The response spectra peak in the case of
right because of the low average shear wave velocities of site class D boreholes.
Therefore, the natural periods of the sites are within the theoretical natural period of a
site class D. This can also be observed in
amplification factors for site class C and D.
The amplification factors were computed after dividing the surface response
spectra by the input motion response spectra for all the boreholes of Sharjah for Site
classes C and D. The greatest amplification factors of 4
the range of 0.4-0.6s. At 0.2s and 1s, the amplification factors vary from 1.2 to 2.8
and 1 to 1.5 respectively. It can be appreciated from the figures that the ranges of
amplification factors are within one standard deviation.
Figure 5.30 – Amplification factors for Sharjah for Site Class C
72
quation [5.1], the predominant period (site class natural period)
depends on the average shear wave velocity and height of the soil column.
Theoretically, the peaks of the response spectra of the various boreholes should be
within the range of predominant periods of the respective site class. However, in the
case of site class C for Sharjah, most of the response spectra peaks have a greater
natural period than the theoretical one (out of predominant period range). This could
be because the depths of several soil columns found in Sharjah were greater than 30m.
The response spectra peak in the case of site class D (Figure 5.29) shift to the
right because of the low average shear wave velocities of site class D boreholes.
Therefore, the natural periods of the sites are within the theoretical natural period of a
site class D. This can also be observed in the Figures 5.30 and 5.31 which show the
amplification factors for site class C and D.
The amplification factors were computed after dividing the surface response
spectra by the input motion response spectra for all the boreholes of Sharjah for Site
sses C and D. The greatest amplification factors of 4 – 6 can be observed within
0.6s. At 0.2s and 1s, the amplification factors vary from 1.2 to 2.8
and 1 to 1.5 respectively. It can be appreciated from the figures that the ranges of
ification factors are within one standard deviation.
Amplification factors for Sharjah for Site Class C
, the predominant period (site class natural period)
wave velocity and height of the soil column.
Theoretically, the peaks of the response spectra of the various boreholes should be
within the range of predominant periods of the respective site class. However, in the
the response spectra peaks have a greater
natural period than the theoretical one (out of predominant period range). This could
be because the depths of several soil columns found in Sharjah were greater than 30m.
site class D (Figure 5.29) shift to the
right because of the low average shear wave velocities of site class D boreholes.
Therefore, the natural periods of the sites are within the theoretical natural period of a
the Figures 5.30 and 5.31 which show the
The amplification factors were computed after dividing the surface response
spectra by the input motion response spectra for all the boreholes of Sharjah for Site
6 can be observed within
0.6s. At 0.2s and 1s, the amplification factors vary from 1.2 to 2.8
and 1 to 1.5 respectively. It can be appreciated from the figures that the ranges of

Figure 5.31 – Amplification factors for Sharjah for Site Class D
Figure 5.32 – Response Spectra for Dubai for Site Class C
0 . 0 10 . 0
0 . 2
0 . 4
0 . 6
0 . 8
1 . 0
1 . 2
in p u t m o t io n
R a n g e o f p r e d o m in a n t pe r io d sfo r S ite _ C ( W h i tm an 1 9 9 0 )
a ) R e s p o n s e a c c e le ra ti o n fo r s it e c la s s _ C (D u b a i )
Resp
onse
acce
lera
tion
, S
a (
g)
73
Amplification factors for Sharjah for Site Class D
Response Spectra for Dubai for Site Class C
0 . 1 1
in p u t m o t io n
R a n g e o f p r e d o m in a n t pe r io d sfo r S ite _ C ( W h i tm an 1 9 9 0 )
a ) R e s p o n s e a c c e le ra ti o n fo r s it e c la s s _ C (D u b a i )
S p e c tr a l p e rio d ( s )
4

74
Figure 5.33– Response Spectra for Dubai for Site Class D
Figures 5.32 and 5.33 present the response spectra of soil columns in Dubai.
The peaks of the spectra are scattered relative to Sharjah because the soil columns of
Dubai analyzed in this study had various depths. The depths varied from 20 to 45m.
Moreover, the nature of the soil columns was also observed to be very inconsistent.
While the engineering bedrock for some soil columns was very deep, other soil
columns had the engineering bedrock located at a depth low as 10m below ground
surface. In general, however, the soil columns of Dubai were found to be stiffer than
of Sharjah. This is the reason for the amplification factors for Dubai to be lower than
that for Sharjah. Figure 5.34 shows the peak amplification factors to be around 3-4 in
the range of 0.2 to 0.4s time period.
0 .0 1 0 . 1 1 40 .0
0 .2
0 .4
0 .6
0 .8
1 .0
1 .2
in p u t m o tio n
P r e d o m in a n t p e r i o d r a n g efo r S ite _ D ( W h itm a n 1 9 9 0 )
a ) R e s p o n s e a c c e l e r a t io n fo r s ite c la s s _ D ( D u b a i )
S p e c t r a l p e rio d (s )
Respo
nse a
ccele
ration
, S
a (
g)

75
Figure 5.34 – Amplification factors for Dubai for Site Classes C and D with two input
motions
.
Figure 5.35 – Response Spectra for Abu Dhabi for Site Class C
0 . 0 1 0 .1 1 20
1
2
3
4
5
b ) S it e c l a s s _ D
( o u tc r o p a c c e l e ra t io n _ 1 )
0 . 0 1 0 .1 1 20
1
2
3
4
5
S p e c t r a l p e r i o d ( s )
d ) S it e c la s s _ D
( o u t c r o p a c c e l e r a t io n _ 2 )
0 .01 0 .1 1 40.0
0 .2
0 .4
0 .6
0 .8
1 .0
1 .2
1 .4
1 .6
1 .8
2 .0
Av e ra g e Sa
inp u t m o tion
R an g e o f p re do m i na n t p e r io d s
fo r S i te _C (W h itm a n 1 99 0 )
a ) R e s p o n s e a c c e le ra tio n fo r s i te c las s _C ( Ab u D h ab i)
S pecra l pe r io d (s)
Resp
onse a
cce
lera
tion, S
a (
g)

76
Figure 5.36 – Response Spectra for Abu Dhabi for Site Class D
Figure 5.35 and 5.36 present the response spectra for all the soil columns of
Abu Dhabi. These are similar to those of Dubai. The peaks of the response spectra are
scattered and away from the natural period of the respective sites because majority of
the boreholes used from Abu Dhabi varied of 15 to 25m depth. Response spectra in
site class C seem to be closer to the predominant period range because the natural
period of the input motion is relatively close to predominant period range causing
what is expected to be premature resonance of the sites.
The soil column composition of boreholes of Abu Dhabi was very similar to
that of Dubai. Most of the boreholes had very shallow engineering bedrock. But the
amplification factors for Abu Dhabi are greater than those of Dubai (Figure 5.37 and
5.38). One reason for high amplification could be the difference in shear wave
velocities between the engineering bedrock and the surface [39, 109]. Many boreholes
in Abu Dhabi were found to have a very weak top layer as compared to the bedrock.
The amplification factors ranged from 4 to 8 in the time period range of 0.1 to 0.2s for
both site class C and D.
0 .0 1 0 .1 1 40 .0
0 .2
0 .4
0 .6
0 .8
1 .0
1 .2
1 .4
1 .6
1 .8
2 .0
A v e ra g e Sain p u t m o tio n
P re d o m in a n t p e r io d ra n g e
fo r S ite _ D (W h itm a n 1 9 9 0 )
a ) R e s p o n s e a c c e le ra t io n fo r s ite c la s s _ D (A b u D h a b i)
S p e c tra l p e r io d (s )
Re
spo
nse a
cce
lera
tio
n, S
a (
g)

77
Figure 5.37– Amplification factors for Abu Dhabi for Site Class C
Figure 5.38 - Amplification factors for Abu Dhabi for Site Class D
0 .01 0 .1 1 20
2
4
6
8
10
A ve rage
+ /- St . D ev ia tion
Predom inant pe riod range
fo r S i te_C (W hi tm an 1990 )
a) Am pl ifi ca tion factor for si te cl as s_C (Abu D hab i )
Am
plifi
catio
n f
act
or,
AF
0.0 1 0 .1 1 20 .0
0 .1
0 .2
0 .3
Spe
ctr
al a
ccele
ratio
n, S
a (g
)
Sp ec tra l Pe riod (s )
b) Inpu t r ock m ot io n
0 .0 1 0 .1 1 20
2
4
6
8
1 0
A ve rage
+ /- St . De v iat ion
P re d om in a nt p er io d
fo r S ite _D (W hi tm a n 1 9 90 )
a) A m p li f ica tio n fa c to r fo r s i te c l ass _D (A b u D h ab i)
Am
plif
ica
tio
n f
acto
r, A
F
0.0 1 0 .1 1 20.0
0.1
0.2
0.3
Spe
ctra
l accele
ration,
Sa (
g)
S |p ec tral P erio d (s )
b) In put rock m ot io n

78
The amplification factors at 0.2s (short period) and 1s (long period) have been
summarized in for Sharjah, Dubai and Abu Dhabi. The amplification factors were
compared to NEHRP 2009 amplification factors. Factors at 0.2s for U.A.E cities are
greater than those of NEHRP 2009. In addition to the factors at 0.2 and 1s, the
amplification for Peak Ground Acceleration (PGA) is also presented. According to the
table, the PGA is expected to amplify by 2 to 3 times at the surface from the bed rock.
Table 5.7 – Site amplification factors
City
Site Class
PGA
0.2 sec
1.0 sec
Current Study Code* Current Study Code*
Sharjah
C 2.18 1.9 1.2 1.2 1.7
D 2.18 2 1.6 1.5 2.4
Dubai
C 3.6 2.7 1.2 1.3 1.7
D 3.4 3.6 1.6 1.25 2.4
Abu Dhabi
C 3.6 2.6 1.2 1 1.7
D 3.4 3.2 1.6 1.1 2.4
*NEHRP 2009

79
CHAPTER 6: CONCLUSIONS AND RECOMMENDATIONS
Conclusions
Seismic hazard maps for U.A.E., seismic hazard curves, and Uniform Hazard
Spectra (UHS) for selected cities have been developed in the scope of this study using
commercial software of EZ-Frisk by Risk Engineering. Modified seismic source
model was developed for U.A.E. and its surroundings based on the updated
homogenized seismicity catalogue and recurrence parameters. Seven Ground Motion
Prediction Equations (GMPEs) including the New Generation Attenuation (NGA)
equations were assigned on the seismic sources. PSHA was performed at each node of
grid representing U.A.E. to construct the seismic hazard contour maps. Moreover, the
effect of the west coast fault on PSHA has been discussed and results with and
without west coast fault have been compared.
Six time histories (two each for Abu Dhabi, Dubai and Sharjah) were selected
based on the deaggregation results from PSHA. The time histories were matched to
the response spectra of Abu Dhabi, Dubai and Sharjah obtained from PSHA results.
Commercially available software of RSP Match EDT from Geo Motions was used for
spectral matching. A comparison between the original and matched time histories is
presented in the form of acceleration time graphs and response spectra. 1-D
equivalent linear Site response analysis was performed on a total of 100 soil columns
using SHAKE 2000, a windows based computer program for 1-D analysis. There
were several inputs required by SHAKE 2000 such as the shear wave velocities, input
ground motion time histories and shear modulus and damping ratio curves. The
results were presented in the form of response spectra on the surface along with
amplification factors for Abu Dhabi, Dubai and Sharjah.
The Uniform Hazard Spectra and seismic curves for PGA indicate largest
hazard ground motion in Fujairah because of the contribution from both Zagros region
and Oman Mountains. However, at longer return periods, seismicity of Northern
Emirates becomes more than Fujairah because of dominance of local seismicity.
Deaggregations results suggest that the activity in Arabian Craton contributes
mostly to the hazard in most southern part of UAE. The contribution of other sources
such as Zargos and Oman mountains increases as one move towards the North.
Western region of U.A.E. is dominated by seismicity from Zargos whereas Oman

80
Mountains has the greatest effect on the east. The hazard in the most northerly city of
Ras Al Khaimah is influenced equally by seismicity in Zargos and Oman Mountains.
The effect of west coast fault is significant especially at larger return periods
and should be taken into account if future studies indicate the presence of a fault
along the west coast of UAE and prevalent building codes adopts lower probability of
exceedance. The activity parameters assumed for this study are conservative as very
rare, if any events can be associated with this fault.
The results of this study indicate slightly larger values of seismic hazard
compared to some recently published studies. The results of previous studies that
suggest higher values are considered as overestimated based on many short comings
such as inappropriate source models, mislocated events in the seismic catalogue, and
inappropriate choice of prediction equations.
Site response analysis results suggest more amplification in Sharjah than in
Dubai and Abu Dhabi because of deep engineering bedrocks in Sharjah. The response
spectra of Abu Dhabi and Dubai are scattered as compared to Sharjah because of the
variance in soil column depths in Dubai and Abu Dhabi.
The greatest amplification factors for Sharjah are in the range of 4 – 6 within
the range of 0.4-0.6s. At 0.2s and 1s, the amplification factors vary from 1.2 to 2.8
and 1 to 1.5 respectively.
The soil columns of Dubai cause lesser amplification than of Sharjah. The
peak amplification factors were estimated to be around 3-4 in the range of 0.2 to 0.4s
time period.
The amplification factors for Abu Dhabi ranged from 4-8 in the time period
range of 0.1 to 0.2s for both site class C and D.
The results clearly show that the soil deposits can amplify the seismic shaking
multiple times. The large magnitude, distant earthquakes from Zagros region and
Oman Mountains are a warning for the sky scrapers in Dubai and Abu Dhabi. With
the long natural periods of the tall structures, the seismic shaking can easily become a
threat due to the soil deposits.

81
Recommendations
Seismic hazard analysis results of this study are in good agreement with some
of the recent seismic hazard study few cities. Therefore, these results could be used as
a bench mark for the earthquake resistant design code. The format of the results
presented in this study is easily comprehensible for the designers and it covers all
parts of development of U.A.E.
Prior to the start of the site response analysis phase of this study, the
expectation was to get at least 500 boreholes from cities of U.A.E. However, due to
technical difficulties, only 100 boreholes from Dubai, Abu Dhabi and Sharjah were
obtained. Due to the unified nature of sub surface soil deposits in most of the cities of
U.A.E., the results of this study (with 100 boreholes) is a good indication of potential
amplification caused by soil deposits. But there is definitely room for improvement in
terms of the estimation of dynamic properties, no. of soil columns and type of site
response analysis used. Further research is being conducted at the Department of Civil
Engineering of the American University of Sharjah to improve on these three aspects.
Moreover, shear modulus and damping ratio curves applicable for UAE soil
columns should be developed by performing resonant column tests. Advanced
methods such as downhole and crosshole tests should be used for estimating the
dynamic properties of soil columns of UAE.
Seismic networks should be developed throughout the UAE to record ground
motion time histories which can be used for developing Ground Motion Attenuation
Relationships applicable for UAE

82
REFERENCE LIST
[1] F. Tavakoli and M. Ghafory-Ashtiany, “Seismic hazard assessment of Iran,”
Annali di geofisica, vol. 42, no. 6, pp. 1013-1021, Dec. 1999.
[2] L. Chouinard, P. Rosset, A. De La Puente, R. Madriz, D. Mitchell, and J. Adams,
“Seismic Hazard Analysis for Montreal,” Proceedings of the 13th
World Conference
on Earthquake Engineering, Aug. 1-6 2004, Vancouver, B.C., Canada.
[3] A. Pitarka and K. Irikura, “Basin structure effects on long-period strong motions
in the San Fernando Valley and the Los Angeles Basin from the 1994 Northridge
earthquake and an aftershock,” Bulletin of Seismological Society of America, vol. 86,
pp. S126-S137, Feb. 1996.
[4] M. Celebi, C. Dietel, J. Prince, M. Onate, and G. Chavez, “Site amplification in
Mexico City determined from 19th
September strong-motion records and from
recordings of weak motions,” in Ground Motion and Engineering Seismology, A.S.
Cakmak, California: Elsevier, 1987, pp. 141-152.
[5] M. H. T. Rayhani, M. H. El Naggar, and S. H. Tabatabaei, “Nonlinear analysis of
local site effects on seismic ground response in the bam earthquake,” Geotechnical
and Geological Engineering, vol. 26, no. 1, pp. 91-100, Feb. 2008.
[6] R.W. Day, Geotechnical Earthquake Engineering Handbook, McGraw-Hill, 2002,
pp. 700.
[7] J.A Abdalla and A.S. Al Homoud, “Seismic hazard assessment of United Arab
Emirates and its surroundings,” Journal of Earthquake Engineering, vol. 8, no. 6, pp.
817-837, May 2004.
[8] N. Peiris, M. Free, Z. Lubkowski, and A.T. Hussein, “Seismic hazard and seismic
design requirements for Arabian Gulf region,” Proceedings of the first European
Conference on Earthquake Engineering and Seismology, Sept. 3-8, 2006, Geneva,
Switzerland.
[9] A. Ansal, A. Kurtulus, and G. Tonuk, “Assessment of Seismic Hazard and Risk in
Dubai, United Arab Emirates,” Final Project Report Part C, Microzonation for Site
Conditions, June 2008, pp. 1-33.
[10] M. Balwan, “Influence of Local Soil Conditions on Ground Response – Site
Amplification,” M.S. Thesis, University of Sharjah, Sharjah, UAE, 2008.

83
[11] A. Rodgers, A. Fowler, A. Al-Amri, and A. Al-Enezi, “The March 11, 2002
Masafi, United Arab Emirates earthquake: insights into the seismotectonics of the
northern Oman Mountains,” Technophysics, vol. 415, no. 1-4, pp. 57–64, March
2006.
[12] Y. Al Marzooqi, K.M. Abou Elenean, A.S. Megahed, I. El-Hussain, A.J.
Rodgers, and E. Al Khatibi, “Source parameters of March 10 and September 13,
2007, United Arab Emirates earthquakes,” Tectonophysics, vol. 460, no. 1-4, pp. 237-
247, Nov. 2008.
[13] NEIC. National Earthquake Information Center, US Department of the Interior,
US Geological Survey.
[14] ISC. International Seismological Center
[15] N.N. Ambraseys and C.P. Melville, A History of Persian Earthquakes, London:
Cambridge University Press, 1982.
[16] A.A. Nowroozi, “Tectonics and earthquake risk of Iran,” Developments in
Geotechnical Engineering, vol. 44, pp. 59-75.
[17] M.S. Nabavi, “Historical earthquakes in Iran c. 300 B.C. – 1900 A.D.,” Journal
of the Earth and Space Physics (Institute of Geophysics, Tehran University Press),
vol. 7, no. 1, pp. 70-117, 1978.
[18] NOAA. National Oceanic and Atmospheric Administration.
http://www.noaa.gov.
[19] C. H. Fenton, J. Adams, and S. Halchuk, “Seismic hazard assessments for
radioactive waste disposal sites in regions of low seismic activity,” Geotechnical and
Geological Engineering, vol. 24, no. 3, pp. 579-592, June 2006.
[20] A.C. Johnson, K.J. Coppersmith, L.R. Kanter, C.A. and Cornell, “The
earthquakes of stable continental regions,” In Assessment of Large Earthquake
Potential, Editor, A.C. Johnston, vol. 1. Palo Alto, CA: Electric Power Research
Institute, 1994.
[21] M. Berberian, “Master 'blind' thrust faults hidden under the Zagros folds: active
basement tectonics and surface morphotectonics,” Tectonophysics, vol. 241, no. 3-4,
pp. 193-224, Jan. 1995.
[22] N. A. Abrahamson and W.J. Silva, “Empirical response spectra attenuation
relations for shallow crustal earthquakes,” Seismological Research Letters, vol. 68,
no. 1, pp. 94-127, Feb. 1997.

84
[23] R.R. Youngs S.J. Chiou, W.J. Silva, and J.R. Humphrey, “Strong ground motion
attenuation relationships for subduction zone earthquakes,” Seismological Research
Letters, vol. 68, no. 1, pp. 58-73. Feb 1997.
[24] N. Hasancebi and R. Ulusay, “Empirical correlations between shear wave
velocity and penetration resistance for ground shaking assessments,” Bulletin of
Engineering Geology and the Environment, vol. 66, no. 2, pp. 203-213, Nov. 2007.
[25] T. Shibata, “Analysis of liquefaction of saturated sand during cyclic loading,” in
Disaster Prevention Research Institute Bulletin, vol. 13, pp. 563-570.
[26] H.B. Seed and I.M. Idriss, “Evaluation of liquefaction potential sand deposits
based on observation of performance in previous earthquakes,” ASCE National
Convention (MO) Preprint no. 81544, 1981.
[27] G.A. Athanasopoulos, “Empirical correlations Vs – NSPT for soils of Greece: a
comparative study of reliability,” Proceedings of the 7th
International Conference on
Soil Dynamics and Earthquake Engineering, 1995, Chania, Greece, Editors. A. S.
Cakmak and C.A. Brebbia, pp 19-26.
[28] R.M. Gotkan, “Theoretical and practical analysis of rock rippability,” PhD thesis,
Istanbul Technical University, Istanbul, Turkey, 1988.
[29] M. Khandelwal and T.N. Singh, “Correlating static properties of coal measure
rocks with P-wave velocity,” International Journal of Coal Geology, vol. 79, no. 1-2,
pp. 55-60. July 2009.
[30] K.B. Chary, L.P. Sarma, K.J. Prasanna Lakshmi, N.A. Vijayakumar, V. Naga
Lakshmi, and M.V.M.S Rao, “Evaluation of Engineering Properties of Rock Using
Ultrasoni Pulse Velocity and Uniaxial Compressive Strength,” Proceedings in
National Seminar on Non-Destructive Evaluation Dec. 7-9, 2006, Hyderabad.
[31] C.A. Cornell, “Engineering seismic risk analysis,” Bulletin of Seismological
Society of America, vol. 58, no. 5, pp. 1583-1606, Oct. 1968.
[32] H.C. Shah, M. Manoutchehr and T. Zsutty, “Seismic risk analysis for California
State Water Project Reach C," The John A. Blume Earthquake Engineering Center,
Department of Civil Engineering, Stanford University, Report No. 22, 1976
[33] R. McGuire, The Practice of Earthquake Hazard Assessment, Denver:
International Association of Seismology and Physics of the Earth's Interior, 1993.
[34] R.K. McGuire, “Probabilistic seismic hazard analysis and design earthquakes:
closing the loop,” Bulleting of the Seismological Society of America, vo. 85, no. 5, pp.
1275-128, Oct. 1995

85
[35] L. Reiter, Earthquake Hazard Analysis: Issues and Insights, New York:
Columbia University Press, 1990.
[36] EERI Committee on Seismic Risk, “The Basics of Seismic Risk Analysis,”
Earthquake Spectra, vol. 5, no. 4, pp. 675-701, Nov. 1989.
[37] B. Gutenberg and C.F.Richter, “Frequency of earthquakes in California,”
Bulletin of Seismological Society of America, vol. 34, no. 4, pp. 185, 1944
[38] L. Esteva, “Geology and probability in the assessment of seismic risk,”
Proceedings of the second International Congress of the International Association of
Engineering Geologists, Sao Paolo, 1974.
[39] S.L. Kramer, Geotechnical Earthquake Engineering, New Jersey: Prentice Hall,
1996, pp 653.
[40] J.C. Stepp, W.J. Silva, R.K. McGuire, and R.W. Sewell, “Determination of
Earthquake Design Loads for a High Level Nuclear Waste Repository Facility,”
Proceedings of the Natural Phenomena Hazards Mitigation Conference, Oct. 19-22,
Atlanta, GA, pp. 651-657.
[41] M.C. Chapman, “A Probabilistic approach to ground motion selection for
engineering design,” Bulletin of Seismological Society of America, vol. 85, no. 3, pp.
937-942, June 1995
[42] P. Bazzuro and C.A. Cornell, “Disaggregation of Seismic Hazard,” Bulletin of
Seismological Society of America, vol. 89, no. 2 , pp. 501-520, April 1999.
[43] S. Harmsen, D. Perkins, and A. Frankel, “Disaggregation of Probabilistic Ground
Motions in the Central and Eastern United States,” Bulletin of Seismological Society
of America, vol. 89, no. 1, pp. 1-13, Feb. 1999.
[44] W.H.K. Lee, International handbook of earthquake and engineering seismology,
Amsterdam; Boston: Academic Press, 2002.
[45] A. Preumont, “The generation of spectrum compatible accelerograms for the
design of nuclear power plants,” Earthquake Engineering and Structural Dynamics,
vol. 12, no. 4, pp.481-497, 1984
[46] N.A. Abrahamson, “Non-Stationary Spectral Matching,” Seismological research
letters, vol. 63, no. 1, pp. 30, 1992
[47] K. Lihanand and W.S. Tseng, “Generation of synthetic time histories compatible
with multiple design response spectra,” Transactions of the 9th
International
Conference on Structural Mechanics in Reactor Technology, Lausanne, K1, 105-110.

86
[48] K. Lihanand and W.S. Tseng, “Development and application of realistic
earthquake time histories compatible with multiple-damping design spectra,”
Proceedings of the 9th
World Conference on Earthquake Engineering, August 2-9,
1988, Tokyo, Japan, Vol. II, 819-824.
[49] NEHRP 2009. Recommended Provisions for Seismic Regulations for New
Buildings and Other Structures (FEMA P-750).
[50] V. Graizer, “Low-velocity zone and topography as a source of site amplification
effect on Tarzana hill, California,” Soil Dynamics and Earthquake Engineering, vol.
29, no. 2, pp. 324-332, Feb. 2009.
[51] L.D. Lawrence and R.W. Lewis, “Observed effects of topography on ground
motion”. Bulletin of the Seismological Society of America, vol. 63, no. 1, pp. 283-298,
Feb. 1973.
[52] L. GovindaRaju, G.V. Ramana, C. HanumanthaRao, and T.G. Sitharam, “Site-
specific ground response analysis,” Current Science, vol. 87, no. 10, pp. 1354-1362,
Nov. 2004
[53] R.D. Borchedt, “Empirical Evidence for Acceleration-Dependent Amplification
Factors,” Bulleting of Seismological Society of America, vol. 92, no. 2, pp. 761-782,
March 2002.
[54] Y. Choi and J.P. Stewart, “Nonlinear site amplification as function of 30 m shear
wave velocity,” Earthquake Spectra, vol. 21, no. 1, pp. 1-30, Feb 2005.
[55] J. P. Stewart, A. H. Liu and Y. Choi, “Amplification factors for Spectral
Acceleration in Tectonically active Regions,” Bulleting of Seismological Society of
America, vol. 93, no. 1, pp. 332-352. Feb. 2003.
[56] R. Dobry, R.D. Borcherdt, C.B. Crouse, I.M. Idriss, W.B. Joyner, G.R. Martin,
M.S. Power, E.E. Rinne, and R.B. Seed, “New site coefficients and site classification
system used in recent building code provisions,” Earthquake Spectra, vol. 16, no. 1,
pp. 41–68, Feb. 2000.
[57] M. Al-Haddad, G.H. Siddiqi, R. Al-Zaid, A. Arafah, A. Necioglu, and N.
Turkelli, “A Basis for Evaluation of Seismic Hazard and Design Criteria for Saudi
Arabia,” Earthquake Spectra vol. 10, no. 2, pp. 231-258, May 1994.
[58] W.K. Campbell, “Strong Motion Attenuation Relations: A Ten-Year
Perspective,” Earthquake Spectra, vol. 1, no. 4, pp. 739-804, Aug. 1985.

87
[59] P.C. Thenhaus, S.T. Algermissen, D.M. Perkins, S.I. Hanson, and W.H. Diment,
“Probabilistic Estimates of the Seismic Ground Motion Hazards in Western Saudi
Arabia, Kingdom of Saudi Arabia,” Open File Report, U.S.G.S, 1986.
[60] G. Grunthal, C. Bosse, S. Sellami, D. Mayer-Rosa, and D. Giardini,
“Compilation of the GSHAP regional seismic hazard map for Europe, Africa and the
Middle East,” Annali di geofisica, vol. 42, no. 6, pp. 1215-1223, 1999.
[61] M. Zare, “Attenuation Relation and Coefficients of Movement in Iran,” Tehran,
Iran: International Institute of Earthquake Engineering and Seismology, 2002.
[62] J.J. Bommer and N.A. Abrahamson, “Why do modern probabilistic seismic
hazard analyses often lead to increased hazard estimates?,” Bulletin of the
Seismological Society of America, vol. 96, no. 6, pp. 1967-1977, Dec. 2006.
[63] N.N. Ambraseys, K.A. Simpson, and J.J. Bommer, “Prediction of horizontal
response spectra in Europe,” Earthquake engineering and Soil Dynamics, vol. 25, no.
4, pp. 371-400, April 1996.
[64] K.A. Simpson, “Attenuation of Strong-Ground motion incorporating near surface
foundation conditions”. PhD thesis, University of London, London, UK, 1996.
[65] G.M. Atkinson and D.M. Boore, “Some comparisons between recent ground
motion relations,” Seismological Research Letters, vol. 68, no. 1, pp. 24-40, Feb.
1997.
[66] A. Dahle, H. Bungum, and L.B. Kvamme, “Attenuation models inferred from
intraplate earthquake recordings,” Earthquake Engineering and Structural Dynamics,
vol. 19, no. 8, pp. 1125-1141, Nov. 1990
[67] K., Sadigh, C.Y., Chang, J.A. Egan, F. Makdisi, and R.R. Youngs, “Attenuation
relationships for shallow crustal earthquakes based on California strong motion data,”
Seismological Research Letters, vol. 68, no. 1, pp. 180-189, Feb. 1997.
[68] R. Musson, K. Northmore, S. Sargeant, E. Phillips, D. Boon, and D. Long, “The
geology and geophysics of the United Arab Emirates,”, vol 4: Geological Hazards.
British Geological Survey, Keyworth, pp. 237, 2006.
[69] N.N. Ambraseys, “The prediction of earthquake peak ground acceleration in
Europe,” Earthquake Engineering and Structural Dynamics, vol. 24, no. 4, pp. 467-
490, April 1995.

88
[70] A.I.H Malkawai, S. Barakat, A. Shanableh, W. Al Bdour, M. Omar, and S.
Altoubat, “Seismic hazard assessment and mitigation of earthquake risk in United
Arab Emirates,” Technical Report UOS-3, University of Sharjah, United Arab
Emirates, 2007.
[71] G. Aldama-Bustos, J.J. Bommer, C.H. Fenton, and P. Stafford, “Probabilistic
seismic hazard analysis for rock sites in the cities of Abu Dhabi, Dubai and Ras Al
Khaimah, United Arab Emirates,” Georisk, vol. 3, no. 1, pp. 1-29, Jan. 2009
[72] A.A. Shama, “Site specific probabilistic seismic hazard analysis at Dubai Creek
on the west coast of U.A.E.,” Earthquake Engineering and Engineering Vibration,
vol. 10, no. 1, pp. 143-152, March 2011.
[73] IRIS. Incorporated Research Institute for Seismology.
[74] R. Sigbjornsson, and A.S. Elnashai, “Hazard assessment of Dubai, United Arab
Emirates, for close and distant earthquakes,” Journal of Earthquake Engineering, vol.
10, no. 5, pp. 749-773, Sep. 2006.
[75] Al Bodour, “Seismic Hazard Assessment and Mitigation of Earthquake Risk in
United Arab Emirates,” PhD Thesis, University of Science and Technology, Amman,
Jordan.
[76] H.H.M. Huang and C.S. Lee, “Parametric study of site response analysis,” Soil
dynamics and Earthquake Engineering, vol. 10, no. 6, pp. 282-290, Aug. 1991.
[77] P.B. Schnabel, J. Lysmer, and H.B. Seed, “SHAKE. A Computer Program for
Earthquake Response Analysis of Horizontally Layered Sites,” Report no.
UCB/EERC-72/12, University of California, Berkeley, Dec. 1972, pp. 102.
[78] C. Vita-Finzi, “Neotectonics at the Arabian plate margins,” Journal of Structural
Geology, vol. 23, no. 2-3, pp. 521-530, Feb. 2001
[79] Ph. Vernant, F. Nilforoushan, D. Hatzfeld, M.R. Abbassi, C. Vigny, F. Masson,
H. Nankali, J. Marinod, A. Ashtiani, R. Bayer, F. Tavakoli, J. and Chery, “Present-
day crustal deformation and plate kinematics in the Middle East constrained by GPS
measurements in Iran and northern Oman,” Geophysical Journal International, vol.
157, no. 1, pp. 381-398, April 2004.
[80] G. Farhoudi and D.E. Karig, “Makran of Iran and Pakistan as an active arc
system,” Geology, vol. 5, no. 11, pp. 664-668, Nov. 1977.
89
[81] J.A. Jackson and D. McKenzie, “Active tectonics of the Alpine-Himalayan belt
between Turkey and Pakistan,” Geophysical Journal of the Royal Astronomical
Society, vol. 77, no. 1, pp. 185-264, April 1984.
[82] P.R. Johnson, “Tectonic map of Saudi Arabia and adjacent areas,” Technical
Report USGS-TR-98-3 (IR 948), US Geological Survey, 1998, pp. 2.
[83] G.G. Brown, “Tectonic map of the Arabian Peninsula”, Saudi Arabian
directoriate general of mineral resources. Arabian Peninsula Map AP-2, scale
1:4000000., Saudi Arabian Directoriate General of Mineral Resources, 1972.
[84] J.A. Jackson and T. Fitch, “Basement faulting and the focal depths of the larger
earthquakes in the Zagros Mountains (Iran),” Geophysical Journal of the Royal
Astronomical Society, vol. 64, no. 3, pp. 561-586, March 1981.
[85] R.T. Walker, J. Jackson, and C. Baker, “Active Faulting and seismicity of the
Dasht-e-Bayaz region, eastern Iran,” Geophysical Journal International, vol. 157, no.
1, pp. 265-282, April 2004.
[86] T. Kusky, C. Robinson and F. El-Baz, “Tertiary-Quaternary faulting and uplift in
the northern Oman Hajar Mountains,” Journal of the Geological Society, vol. 162, no.
5, pp. 871-888, Sept. 2005.
[87] P.A. Reasenberg, “Second-order moment of central California seismicity, 1969-
1982,”Journal of Geophysical Research, vol. 90, no. B7, pp. 5479-5495, 1985.
[88] L. Knopoff, “The magnitude distribution of declustered earthquakes in Southern
California,” Proceedings of the National Academy of Sciences, vol. 97, no. 22, Oct.
24, 2000, pp. 11880-11884.
[89] M. Ordaz, A. Aguilar, and J. Arboleda, “CRISIS v5.1. Program for Computing
Seismic Hazard,” Instituto de Ingenieria, UNAM, Mexico, 2007.
[90] E.R. Engdahl, J.A. Jackson, S.C. Myers, E.A. Bergman, K. and Priestley,
“Relocation and assessment of seismicity in the Iran region,” Geophysical Journal
International, vol. 167, no. 2 pp. 761–778, Nov. 2006
[91] R.K. McGuire and W.J. Arabasz, “An introduction to probabilistic seismic
hazard analysis,” in Geotechnical and Environmental Geophysics, S.H. Ward, vol. 1,
1990, Society of Exploration Geophysicist, pp. 333-353,
[92] R.R. Youngs and K.J. Coppersmith, “Implications of fault slip rates and
earthquake recurrence models to probabilistic seismic hazard estimates,” Bulletin of
the seismological society of America, vol. 75, no. 4, pp. 939-964, Aug. 1985.

90
[93] D.L. Wells and K.J. Coppersmith, “New empirical relationships among
magnitude, rupture length, rupture width, rupture area, and surface displacement,”
Bulletin of the Seismological Society of America, vol. 84, no. 4, pp. 974-1002, Aug.
1994.
[94] F. Cotton, F. Scherbaum, J.J. Bommer, and H. Bungum, “Criteria for selecting
and adjusting ground-motion models for specific target applications: applications to
Central Europe and rock sites,” Journal of Seismology, vol. 10, no. 2, pp. 137-156,
April 2006
[95] D.M. Boore and G.M. Atkinson, “Ground-motion prediction equations for the
average horizontal component of PGA, PGV, and 5%-damped PSA at spectral periods
between 0.01 s and 10.0 s,” Earthquake Spectra, vol. 24, no. 1, pp. 99-138, Feb. 2008.
[96] N.A. Abrahamson and W.J. Silva, “Summary of the Abrahamson & Silva NGA
ground motion relations,” Earthquake Spectra, vol. 24, no. 1, pp. 67–97, Feb 2008.
[97] K.W. Campbell and Y. Bozorgnia, “NGA ground motion model for the
geometric mean horizontal component of PGA, PGV, PGD, and 5% damped linear
elastic response spectra for periods ranging from 0.01 to 10 s,” Earthquake Spectra,
vol. 24, no. 1, pp. 139-171, Feb. 2008.
[98] G.M. Atkinson and D.M. Boore, “Empirical Ground-Motion Relations for
Subduction-Zone Earthquakes and Their Application to Cascadia and Other Regions,”
Bulletin of the Seismological Society of America, vol. 93, no. 4, pp. 1703-1729, Aug.
2003.
[99] G.M. Atkinson and D.M. Boore, “Earthquake ground-motions prediction
equations for Eastern North America,” Bulletin of the Seismological Society of
America, vol. 96, no. 6, pp. 2181-2205, June 2007.
[100] J.J. Bommer and A.B. Avecedo, “The use of real earthquake accelerograms as
input to dynamic analysis,” Journal of Earthquake Engineering, vol. 8, no. 1, pp. 43-
91, 2004.
[101] J. Boatwright, L.C. Seekins, T.E. Fumal, H.P. Liu, and C.S. Mueller,“Ground
motion amplification in the Marina District,” Bulletin of Seismological Society of
America, vol. 81, no. 5, pp. 1980-1997, Oct. 1991.
[102] J.G. Anderson, P. Bodin, J. Prince, S.K. Singh, R. Quass, and M. Onate,
“Strong ground motion from the Michoacan, Mexico, earthquake,” Science, vol. 233,
no. 4768, pp. 1043-1049, Sept. 2006.

91
[103] P.B. Schnabel, “Effects of local geology and distance from source on
earthquake ground motions,” PhD Thesis, University of California, Berkeley,
California, USA, 1973.
[104] H.B. Seed, R.T. Wong, I.M. Idriss, and K. Tokimatsu, “Moduli and damping
factors for dynamic analyses of cohesionless soils,” Journal of Geotechnical
Engineering. ASCE, vol. 112, no. 11, pp. 1016-1032, Nov. 1986.
[105] J.I. Sun, R. Golesorkhi, and H.B. Seed, "Dynamic Moduli and Damping Ratios
for Cohesive soils,” Report UBC/EERC- 88/15. Berkeley: University of California,
Earthquake Engineering Research Center. 1988, pp. 48.
[106] H.B. Seed and I.M. Idriss, “Soil moduli and damping factors for dynamic
response analyses,” Report No. EERC 70-10, University of California, Berkeley,
California, 1970.
[107] J.W. Koloski, S.D. Schwarz, and D.W. Tubbs, “Geotechnical Properties of
Geologic Materials,” Washington Division of Geology and Earth Resources Bulletin
78, 1989.
[108] R.D. Borcherdt, “Estimates of Site-Dependent Response Spectra for Design
(Methodology and Justification),” Earthquake Spectra, vol. 10, no. 4, pp. 617-653,
Nov. 1994.
[109] M.S. Romero and G.J. Rix, “Ground Motion Amplification of Soils in the
Upper Mississippi Embayment,” GIT-CEE/GEO-01-1, Georgia Institute of
Technology, School of Civil and Environmental Engineering, 2001, pp. 493.
[110] P. Spudich, W.B. Joyner, A.G. Lindh, D.M. Boore, B.M. Margaris and J.B.
Fletcher, “SEA99: A Revised Ground Motion Prediction Relation for Use in
Extensional Tectonic Regimes,” Bulletin of Seismological Society of America, vol. 89,
no. 5, pp. 1156-1170, Oct. 1999.

92
Appendix A
SOIL COLUMNS

93
Abu Dhabi
Table A1
Table A2
Option 2 - Set No. 1Option 2 - 701B0001Soil Deposit No.: 1 - B0001
Layer Soil Type Thickness ShearModulus
Damping Unit Weight Shear WaveVelocity
(m) (kN/m^2) (kN/m^3) (m/s)1 1 2 .05 18 2172 1 1 .05 18.5 2463 1 3.4 .05 18.5 4404 1 .9 .05 18.5 4705 1 2.7 .05 18.5 5006 1 2 .05 18.5 5217 1 1 .05 18.5 5438 2 1.5 .02 21 7049 2 1.4 .02 21 713
10 2 .4 .02 21 72111 2 1.7 .02 21 72912 2 3 .02 21 73813 2 3 .02 21 74614 2 1.4 .02 21 75515 2 .02 21 760
Option 2 - Set No. 1Option 2 - 701B0002Soil Deposit No.: 1 - B0002
Layer Soil Type Thickness ShearModulus
Damping Unit Weight Shear WaveVelocity
(m) (kN/m^2) (kN/m^3) (m/s)1 1 1.8 .05 18 342.822 1 2.7 .02 21 7043 1 1.8 .02 21 7134 1 2.1 .02 21 7215 1 4.5 .02 21 7306 1 3.9 .02 21 7387 1 6 .05 21 7468 2 2.2 .02 21 7559 2 .02 21 760

94
Table A3
Table A4
Table A5
Option 2 - Set No. 1Option 2 - 701B0003Soil Deposit No.: 1 - B0003
Layer Soil Type Thickness ShearModulus
Damping Unit Weight Shear WaveVelocity
(m) (kN/m^2) (kN/m^3) (m/s)1 1 2 .05 18 2472 1 .5 .05 18.5 3573 2 1.7 .02 18.5 7044 2 .3 .02 18.5 7215 2 1.7 .02 18.5 7256 2 1.8 .02 18.5 7307 2 1 .02 18.5 7408 2 .5 .02 21 7419 2 .8 .02 21 74710 2 1.2 .02 21 74911 2 5 .02 21 75212 2 1 .02 21 75513 2 3.3 .02 21 75614 2 .7 .02 21 76015 2 .02 21 763
Option 2 - Set No. 1Option 2 - 701B0004Soil Deposit No.: 1 - B0004
Layer Soil Type Thickness ShearModulus
Damping Unit Weight Shear WaveVelocity
(m) (kN/m^2) (kN/m^3) (m/s)1 1 1.5 .05 18 199.462 1 3.3 .05 18.5 251.83 2 .2 .02 18.5 696.44 2 1 .02 18.5 7005 2 1 .02 18.5 7056 2 1.3 .02 18.5 7087 2 2 .02 18.5 713.168 2 1.2 .02 21 7179 2 4 .02 21 720
10 2 .5 .02 21 72111 2 .8 .02 21 73012 2 3.7 .02 21 73813 2 1.5 .02 21 74714 2 3 .02 21 74715 2 .02 21 763
Option 2 - Set No. 1Option 2 - 701B0005Soil Deposit No.: 1 - B0005
Layer Soil Type Thickness ShearModulus
Damping Unit Weight Shear WaveVelocity
(m) (kN/m^2) (kN/m^3) (m/s)1 1 1 .05 18 3002 1 .5 .05 18.5 3503 2 2.7 .02 18.5 7044 2 .7 .02 18.5 7135 2 1.1 .02 18.5 7236 2 .5 .02 18.5 7277 2 .8 .02 18.5 7288 2 4.7 .02 21 7309 2 3.9 .02 21 73810 2 .5 .02 21 74711 2 4.6 .02 21 75512 2 .02 21 772

95
Table A6
Table A7
Table A8
Option 2 - Set No. 1Option 2 - 701B0006Soil Deposit No.: 1 - B0006
Layer Soil Type Thickness ShearModulus
Damping Unit Weight Shear WaveVelocity
(m) (kN/m^2) (kN/m^3) (m/s)1 1 .5 .05 18 3502 2 3.5 .02 21 6933 2 1.1 .02 21 6964 2 3.2 .02 21 7005 2 1 .02 21 7036 2 1.3 .02 21 7067 2 .5 .02 21 7108 2 3.1 .02 21 713.29 2 1.3 .02 21 721
10 2 2.8 .02 21 72411 2 1.7 .02 21 728.2512 2 2.7 .02 21 731.613 2 .02 21 755
Option 2 - Set No. 1Option 2 - 950b0020Soil Deposit No.: 1 - b0020
Layer Soil Type Thickness ShearModulus
Damping Unit Weight Shear WaveVelocity
(m) (kN/m^2) (kN/m^3) (m/s)1 1 .6 .02 17 7032 2 4.4 .02 21 7213 2 3.2 .02 21 7314 2 1.4 .02 22 7005 2 3.4 .02 22 7696 2 12 .02 22 7717 2 .02 22 800
Option 2 - Set No. 1Option 2 - 950b0021Soil Deposit No.: 1 - b0021
Layer Soil Type Thickness ShearModulus
Damping Unit Weight Shear WaveVelocity
(m) (kN/m^2) (kN/m^3) (m/s)1 1 1 .05 17 3742 1 3.3 .05 17 4553 1 3.2 .05 18.5 4844 1 10.5 .05 18.5 5655 2 7 .02 21 7556 2 .02 21 760

96
Table A9
Table A10
Table A11
Option 2 - Set No. 1Option 2 - 950b0023Soil Deposit No.: 1 - b0023
Layer Soil Type Thickness ShearModulus
Damping Unit Weight Shear WaveVelocity
(m) (kN/m^2) (kN/m^3) (m/s)1 1 6.5 .05 17 3632 1 4.5 .05 18.5 392.53 1 1.8 .05 18.5 4194 1 2.9 .05 18.5 4445 1 .8 .05 18.5 5656 2 8.5 .02 21 7387 2 .02 21 760
Option 2 - Set No. 1Option 2 - A09B0001Soil Deposit No.: 1 - B0001
Layer Soil Type Thickness ShearModulus
Damping Unit Weight Shear WaveVelocity
(m) (kN/m^2) (kN/m^3) (m/s)1 1 .5 .05 17 3632 1 8.5 .05 18.5 488.613 2 1 .02 21 704.774 2 2.3 .02 21 709.85 2 1.2 .02 21 719.866 2 1.8 .02 21 724.97 2 2.2 .02 21 729.938 2 .02 21 760
Option 2 - Set No. 1Option 2 - A09B0002Soil Deposit No.: 1 - B0002
Layer Soil Type Thickness ShearModulus
Damping Unit Weight Shear WaveVelocity
(m) (kN/m^2) (kN/m^3) (m/s)1 1 4.3 .05 18 3632 1 2.1 .05 18.5 443.9113 2 1.8 .02 21 696.384 2 4.6 .02 21 713.165 2 2 .02 21 731.60256 2 1.4 .02 21 7357 2 2.6 .02 21 741.6648 2 .02 21 765

97
Table A12
Table A13
Table A14
Option 2 - Set No. 1Option 2 - abualabayadbh5dh1Soil Deposit No.: 1 - bh5dh1
Layer Soil Type Thickness ShearModulus
Damping Unit Weight Shear WaveVelocity
(m) (kN/m^2) (kN/m^3) (m/s)1 1 2 .05 17 2172 1 1 .05 18.5 2923 1 2 .05 18.5 3704 1 4 .05 18.5 4405 2 3 .02 21 7136 2 5 .02 21 7407 2 .02 21 760
Option 2 - Set No. 1Option 2 - abualabayadbh5dh2Soil Deposit No.: 1 - bh5dh2
Layer Soil Type Thickness ShearModulus
Damping Unit Weight Shear WaveVelocity
(m) (kN/m^2) (kN/m^3) (m/s)1 1 2 .05 17 2922 1 1 .05 18.5 3503 1 2 .05 18.5 3124 1 6 .05 18.5 2925 1 2.6 .05 18.5 4006 2 3.4 .02 21 7217 2 .02 21 760
Option 2 - Set No. 1Option 2 - abualabayadbh5dh5Soil Deposit No.: 1 - bh5dh5
Layer Soil Type Thickness ShearModulus
Damping Unit Weight Shear WaveVelocity
(m) (kN/m^2) (kN/m^3) (m/s)1 1 2 .05 17 2272 1 2 .05 18.5 3163 1 9 .05 18.5 4064 2 6 .02 18.5 7385 2 .02 18.5 760

98
Table A15
Table A16
Table A17
Option 2 - Set No. 1Option 2 - abualabayadbh5dh6Soil Deposit No.: 1 - bh5dh6
Layer Soil Type Thickness ShearModulus
Damping Unit Weight Shear WaveVelocity
(m) (kN/m^2) (kN/m^3) (m/s)1 1 4 .05 17 3322 1 2 .05 18.5 3213 1 7 .05 18.5 4404 2 3 .02 18.5 7385 2 .02 18.5 760
Option 2 - Set No. 1Option 2 - abualabayadbh5dh10Soil Deposit No.: 1 - bh5dh10
Layer Soil Type Thickness ShearModulus
Damping Unit Weight Shear WaveVelocity
(m) (kN/m^2) (kN/m^3) (m/s)1 1 5 .05 18 2472 1 2 .05 18.5 4403 1 6 .05 18.5 4704 2 5 .02 18.5 7555 2 .02 18.5 760
Option 2 - Set No. 1Option 2 - abualabayadbh5dh11Soil Deposit No.: 1 - bh5dh11
Layer Soil Type Thickness ShearModulus
Damping Unit Weight Shear WaveVelocity
(m) (kN/m^2) (kN/m^3) (m/s)1 1 3 .05 17 4402 1 3 .05 18.5 4553 1 1 .05 18.5 4404 2 6 .05 18.5 4705 2 5.5 .02 22 7556 2 .02 22 760

99
Table A18
Table A19
Table A20
Option 2 - Set No. 1Option 2 - abualabayadbh5dh13Soil Deposit No.: 1 - bh5dh13
Layer Soil Type Thickness ShearModulus
Damping Unit Weight Shear WaveVelocity
(m) (kN/m^2) (kN/m^3) (m/s)1 1 4 .05 17 2802 1 7 .05 18.5 4883 2 5 .02 22 7404 2 .02 22 760
Option 2 - Set No. 1Option 2 - abualabayadbh5dh16Soil Deposit No.: 1 - bh5dh16
Layer Soil Type Thickness ShearModulus
Damping Unit Weight Shear WaveVelocity
(m) (kN/m^2) (kN/m^3) (m/s)1 1 2 .05 17 246.732 1 4 .05 18.5 363.153 1 6 .05 18.5 378.24 2 3.2 .02 22 7225 2 1.8 .02 22 7406 2 .02 22 760
Option 2 - Set No. 1Option 2 - abualabayadbh5dh17Soil Deposit No.: 1 - bh5dh17
Layer Soil Type Thickness ShearModulus
Damping Unit Weight Shear WaveVelocity
(m) (kN/m^2) (kN/m^3) (m/s)1 1 5 .05 18 3872 1 2 .05 18.5 4243 1 3 .05 18.5 4404 2 5 .02 22 7385 2 1.5 .02 22 7706 2 .02 22 780

100
Table A21
Table A22
Table A23
Option 2 - Set No. 1Option 2 - Al Sowah BH1Soil Deposit No.: 1 - BH1
Layer Soil Type Thickness ShearModulus
Damping Unit Weight Shear WaveVelocity
(m) (kN/m^2) (kN/m^3) (m/s)1 1 3 .05 17 3952 1 1 .05 17 3753 1 4 .05 17 4024 1 .5 .05 17 4885 1 2 .05 17 4026 1 1.5 .05 17 4557 2 1.5 .02 21 725.738 2 2.2 .02 21 7219 2 .02 21 760
Option 2 - Set No. 1Option 2 - Al Sowah BH2Soil Deposit No.: 1 - BH2
Layer Soil Type Thickness ShearModulus
Damping Unit Weight Shear WaveVelocity
(m) (kN/m^2) (kN/m^3) (m/s)1 1 4.601 .05 17 3112 1 2.4 .05 17 488.63 1 3 .05 17 488.64 2 1.2 .02 21 7905 2 3.2 .02 21 7606 2 .02 21 760
Option 2 - Set No. 1Option 2 - Al Sowah BH3Soil Deposit No.: 1 - BH3
Layer Soil Type Thickness ShearModulus
Damping Unit Weight Shear WaveVelocity
(m) (kN/m^2) (kN/m^3) (m/s)1 1 3 .05 18 3952 1 5 .05 18.5 3663 1 2 .05 18.5 5094 1 2 .05 18.5 5205 1 2 .05 18.5 5306 1 1.24 .05 18.5 5407 2 3.8 .02 22 7388 2 .02 22 760

101
Table A24
Table A25
Table A26
Option 2 - Set No. 1Option 2 - Al Sowah BH4Soil Deposit No.: 1 - BH4
Layer Soil Type Thickness ShearModulus
Damping Unit Weight Shear WaveVelocity
(m) (kN/m^2) (kN/m^3) (m/s)1 1 5 .05 18 3042 1 7 .05 18.5 3003 1 2 .05 18.5 2604 1 1 .05 18.5 488.615 2 3 .02 22 7226 2 .02 22 760
Option 2 - Set No. 1Option 2 - Al Sowah BH5Soil Deposit No.: 1 - BH5
Layer Soil Type Thickness ShearModulus
Damping Unit Weight Shear WaveVelocity
(m) (kN/m^2) (kN/m^3) (m/s)1 1 6.5 .05 18.5 3372 1 2.5 .05 18.5 3003 1 2 .05 18.5 3204 1 .7 .05 18.5 5645 2 3 .02 22 7656 2 .02 22 770
Option 2 - Set No. 1Option 2 - Al Sowah BH6Soil Deposit No.: 1 - bh6
Layer Soil Type Thickness ShearModulus
Damping Unit Weight Shear WaveVelocity
(m) (kN/m^2) (kN/m^3) (m/s)1 1 2.5 .05 17 3862 1 4 .05 17 2503 1 7.5 .05 17 2554 1 2.4 .05 17 4405 2 3 .02 21 7046 2 .02 21 760

102
Table A27
Table A28
Table A29
Option 2 - Set No. 1Option 2 - Al Sowah BH7Soil Deposit No.: 1 - bh7
Layer Soil Type Thickness ShearModulus
Damping Unit Weight Shear WaveVelocity
(m) (kN/m^2) (kN/m^3) (m/s)1 1 8 .05 17 2852 1 3 .05 17 2703 1 3 .05 17 2804 1 1.5 .05 17 4605 2 3 .02 21 7226 2 .02 21 760
Option 2 - Set No. 1Option 2 - Al Sowah BH10Soil Deposit No.: 1 - bh10
Layer Soil Type Thickness ShearModulus
Damping Unit Weight Shear WaveVelocity
(m) (kN/m^2) (kN/m^3) (m/s)1 1 3 .05 17 4062 1 7 .05 17 3663 1 1 .05 17 3834 1 2.25 .05 17 5655 2 4.2 .02 21 7226 2 .02 21 760
Option 2 - Set No. 1Option 2 - taweelahbh1Soil Deposit No.: 1 - tawbh1
Layer Soil Type Thickness ShearModulus
Damping Unit Weight Shear WaveVelocity
(m) (kN/m^2) (kN/m^3) (m/s)1 1 6.5 .05 17 4002 2 5.7 .02 21 7203 2 3 .02 21 7604 2 2.3 .02 22 7305 2 7 .02 22 7706 2 1.5 .02 22 7807 2 .02 21 800

103
Table A30
Dubai
Table A31
Option 2 - Set No. 1Option 2 - taweelahbh2Soil Deposit No.: 1 - tawbh2
Layer Soil Type Thickness ShearModulus
Damping Unit Weight Shear WaveVelocity
(m) (kN/m^2) (kN/m^3) (m/s)1 2 6.71 .02 21 7032 2 3.3 .02 21 7213 2 2 .02 21 7314 2 4.2 .02 22 7005 2 1 .02 22 7696 2 10.2 .02 22 7717 2 .02 22 800
Option 2 - Set No. 1Option 2 - ducabSoil Deposit No.: 1 - ducab
Layer Soil Type Thickness ShearModulus
Damping Unit Weight Shear WaveVelocity
(m) (kN/m^2) (kN/m^3) (m/s)1 1 2.35 .05 17 367.672 2 1.75 .02 21 702.423 2 3.15 .02 21 706.364 2 2.8 .02 21 712.995 2 7.2 .02 21 695.976 2 2.7 .02 21 725.577 2 1.3 .02 21 739.4848 2 1.5 .02 21 719.79 2 1.45 .02 21 730.43
10 2 .02 21 830.04

104
Table A32
Table A33
Table A34
Option 2 - Set No. 1Option 2 - oman insuranceSoil Deposit No.: 1 - oman insurance
Layer Soil Type Thickness ShearModulus
Damping Unit Weight Shear WaveVelocity
(m) (kN/m^2) (kN/m^3) (m/s)1 1 8 .05 17 370.432 1 4 .05 18 263.21923 1 4 .05 18 406.0264 2 5 .02 21 7055 2 10 .02 21 7226 2 10 .02 21 7557 2 .02 21 760
Option 2 - Set No. 1Option 2 - palm jumairahSoil Deposit No.: 1 - palm jumairah
Layer Soil Type Thickness ShearModulus
Damping Unit Weight Shear WaveVelocity
(m) (kN/m^2) (kN/m^3) (m/s)1 1 4 .05 18 2632 1 9.5 .05 18 2273 1 1.5 .05 18 3664 1 2 .05 18 2465 1 7 .05 18 4066 2 .02 21 760
Option 2 - Set No. 1Option 2 - blue moonSoil Deposit No.: 1 - blue moon
Layer Soil Type Thickness ShearModulus
Damping Unit Weight Shear WaveVelocity
(m) (kN/m^2) (kN/m^3) (m/s)1 1 4.5 .05 18 3162 1 4.1 .05 18 2633 2 11.4 .02 21 7084 2 .02 21 760

105
Table A35
Table A36
Table A37
Option 2 - Set No. 1Option 2 - AUDSoil Deposit No.: 1 - AUD
Layer Soil Type Thickness ShearModulus
Damping Unit Weight Shear WaveVelocity
(m) (kN/m^2) (kN/m^3) (m/s)1 1 2.5 .05 18 3162 1 6.5 .05 18 3163 1 7 .05 18 4404 2 3 .02 21 7005 2 .05 21 760
Option 2 - Set No. 1Option 2 - burjumanSoil Deposit No.: 1 - hamriya
Layer Soil Type Thickness ShearModulus
Damping Unit Weight Shear WaveVelocity
(m) (kN/m^2) (kN/m^3) (m/s)1 1 2 .05 18 3832 1 5.5 .05 18 3333 1 2 .05 18 3874 1 3 .05 18 4405 1 3 .05 18 5656 2 5 .02 21 7557 2 .02 21 760
Option 2 - Set No. 1Option 2 - samaSoil Deposit No.: 1 - sama
Layer Soil Type Thickness ShearModulus
Damping Unit Weight Shear WaveVelocity
(m) (kN/m^2) (kN/m^3) (m/s)1 1 3 .05 17 3882 1 15 .05 18.5 5653 2 .02 21 760

106
Table A38
Table A39
Table A40
Option 2 - Set No. 1Option 2 - nbd deiraSoil Deposit No.: 1 - nbd deira
Layer Soil Type Thickness ShearModulus
Damping Unit Weight Shear WaveVelocity
(m) (kN/m^2) (kN/m^3) (m/s)1 1 2.5 .05 18 2852 1 2 .05 18 2053 1 6 .05 18 2854 1 3 .05 18 3165 1 4.5 .05 18 4066 2 4 .02 21 7387 2 .02 21 760
Option 2 - Set No. 1Option 2 - dream baySoil Deposit No.: 1 - dream bay
Layer Soil Type Thickness ShearModulus
Damping Unit Weight Shear WaveVelocity
(m) (kN/m^2) (kN/m^3) (m/s)1 1 3.9 .05 18 2852 1 3 .05 18 4243 2 10 .02 21 7084 2 .02 21 760
Option 2 - Set No. 1Option 2 - quran bldgSoil Deposit No.: 1 - quran bldg
Layer Soil Type Thickness ShearModulus
Damping Unit Weight Shear WaveVelocity
(m) (kN/m^2) (kN/m^3) (m/s)1 1 6 .05 18 2552 1 1 .05 18 3663 1 3 .05 18 4244 2 15.5 .02 21 7155 2 .02 21 760

107
Table A41
Table A42
Table A43
Option 2 - Set No. 1Option 2 - murqabat buildingSoil Deposit No.: 1 - muraqabat
Layer Soil Type Thickness ShearModulus
Damping Unit Weight Shear WaveVelocity
(m) (kN/m^2) (kN/m^3) (m/s)1 1 2.5 .05 17 3822 1 .5 .05 17 3183 1 1 .05 17 2764 1 2.5 .05 17 3455 1 6.5 .05 18.5 4126 1 1 .05 18.5 3647 1 5 .05 18.5 4018 1 4 .05 18.5 4839 2 .02 21 760
Option 2 - Set No. 1Option 2 - murqabat buildingSoil Deposit No.: 1 - muraqabat
Layer Soil Type Thickness ShearModulus
Damping Unit Weight Shear WaveVelocity
(m) (kN/m^2) (kN/m^3) (m/s)1 1 2.5 .05 17 3822 1 .5 .05 17 3183 1 1 .05 17 2764 1 2.5 .05 17 3455 1 6.5 .05 18.5 4126 1 1 .05 18.5 3647 1 5 .05 18.5 4018 1 4 .05 18.5 4839 2 .05 21 760
Option 2 - Set No. 1Option 2 - dubalSoil Deposit No.: 1 - dubal
Layer Soil Type Thickness ShearModulus
Damping Unit Weight Shear WaveVelocity
(m) (kN/m^2) (kN/m^3) (m/s)1 1 7 .05 17 255.12 1 4 .05 18.5 361.643 2 6 .02 22 721.544 2 9 .02 22 755.085 2 .02 22 760

108
Table A44
Table A45
Table A46
Option 2 - Set No. 1Option 2 - business baySoil Deposit No.: 1 - business bay
Layer Soil Type Thickness ShearModulus
Damping Unit Weight Shear WaveVelocity
(m) (kN/m^2) (kN/m^3) (m/s)1 1 5 .05 17 316.36112 1 4 .05 17 366.07993 2 17 .02 22 7004 2 20 .02 22 7385 2 .02 22 770
Option 2 - Set No. 1Option 2 - al rigga dmSoil Deposit No.: 1 - rigga dm
Layer Soil Type Thickness ShearModulus
Damping Unit Weight Shear WaveVelocity
(m) (kN/m^2) (kN/m^3) (m/s)1 1 8 .05 17 316.36112 1 3 .05 17 377.483 1 4 .05 17 515.03264 2 12 .02 21 7135 2 23 .02 21 7506 2 .02 21 760
Option 2 - Set No. 1Option 2 - cultural villageSoil Deposit No.: 1 - cultural village
Layer Soil Type Thickness ShearModulus
Damping Unit Weight Shear WaveVelocity
(m) (kN/m^2) (kN/m^3) (m/s)1 1 4.5 .05 18 3632 1 3 .05 18 1853 1 1.5 .05 18 1054 1 2.5 .05 18 2135 1 2.5 .05 18 2056 1 2.5 .05 18 2467 1 1.5 .05 18 4068 2 3 .02 21 7069 2 5 .02 21 713
10 2 .02 21 760
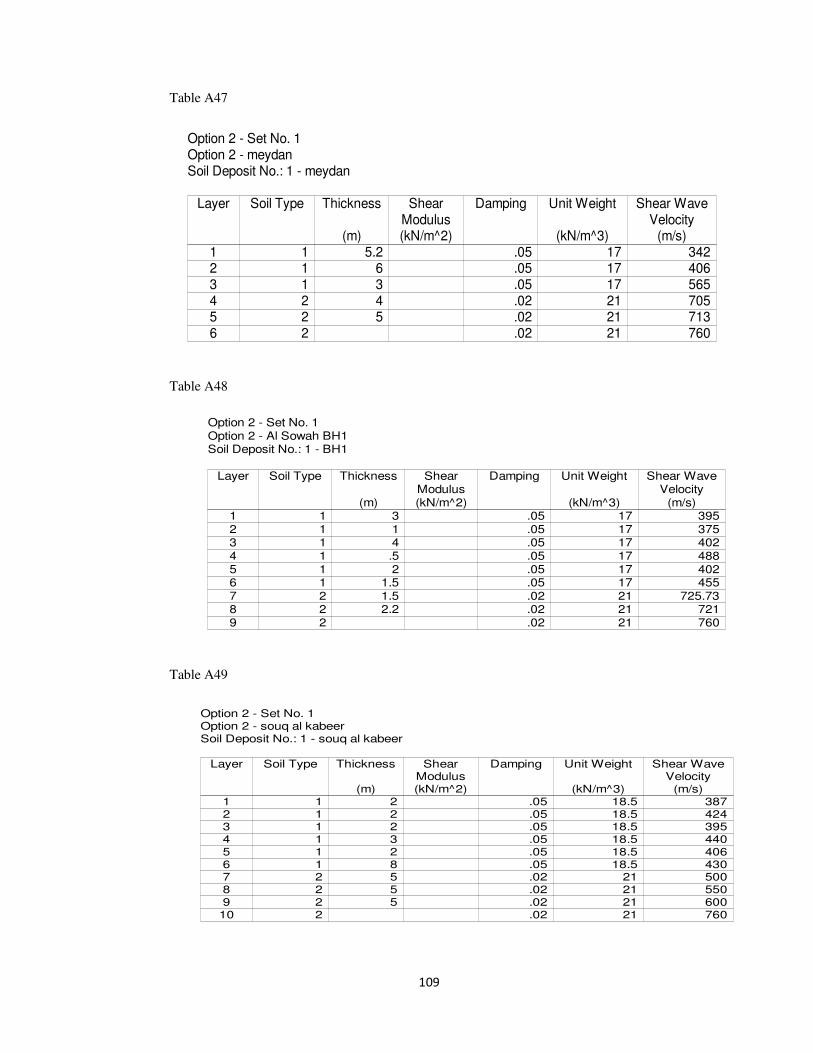
109
Table A47
Table A48
Table A49
Option 2 - Set No. 1Option 2 - meydanSoil Deposit No.: 1 - meydan
Layer Soil Type Thickness ShearModulus
Damping Unit Weight Shear WaveVelocity
(m) (kN/m^2) (kN/m^3) (m/s)1 1 5.2 .05 17 3422 1 6 .05 17 4063 1 3 .05 17 5654 2 4 .02 21 7055 2 5 .02 21 7136 2 .02 21 760
Option 2 - Set No. 1Option 2 - Al Sowah BH1Soil Deposit No.: 1 - BH1
Layer Soil Type Thickness ShearModulus
Damping Unit Weight Shear WaveVelocity
(m) (kN/m^2) (kN/m^3) (m/s)1 1 3 .05 17 3952 1 1 .05 17 3753 1 4 .05 17 4024 1 .5 .05 17 4885 1 2 .05 17 4026 1 1.5 .05 17 4557 2 1.5 .02 21 725.738 2 2.2 .02 21 7219 2 .02 21 760
Option 2 - Set No. 1Option 2 - souq al kabeerSoil Deposit No.: 1 - souq al kabeer
Layer Soil Type Thickness ShearModulus
Damping Unit Weight Shear WaveVelocity
(m) (kN/m^2) (kN/m^3) (m/s)1 1 2 .05 18.5 3872 1 2 .05 18.5 4243 1 2 .05 18.5 3954 1 3 .05 18.5 4405 1 2 .05 18.5 4066 1 8 .05 18.5 4307 2 5 .02 21 5008 2 5 .02 21 5509 2 5 .02 21 60010 2 .02 21 760

110
Table A50
Table A51
Table A52
Option 2 - Set No. 1Option 2 - belyoahahSoil Deposit No.: 1 - belyoahah
Layer Soil Type Thickness ShearModulus
Damping Unit Weight Shear WaveVelocity
(m) (kN/m^2) (kN/m^3) (m/s)1 1 4 .05 18.5 3162 1 5 .05 18.5 2783 1 6 .05 18.5 3054 1 4 .05 18.5 4405 2 .02 21 760
Option 2 - Set No. 1Option 2 - mazayaSoil Deposit No.: 1 - mazaya
Layer Soil Type Thickness ShearModulus
Damping Unit Weight Shear WaveVelocity
(m) (kN/m^2) (kN/m^3) (m/s)1 1 4.5 .05 17 2922 1 6 .05 18.5 4243 1 4.5 .05 18.5 4704 2 .02 21 760
Option 2 - Set No. 1Option 2 - dxb media citySoil Deposit No.: 1 - dxb media
Layer Soil Type Thickness ShearModulus
Damping Unit Weight Shear WaveVelocity
(m) (kN/m^2) (kN/m^3) (m/s)1 1 3.5 .05 17 3162 1 5 .05 18.5 3663 1 5 .05 18.5 4064 1 5 .05 18.5 4405 2 5 .02 21 5006 2 5 .02 21 5507 2 .02 211 760

111
Table A53
Table A54
Table A55
Option 2 - Set No. 1Option 2 - al jadafSoil Deposit No.: 1 - al jadaf
Layer Soil Type Thickness ShearModulus
Damping Unit Weight Shear WaveVelocity
(m) (kN/m^2) (kN/m^3) (m/s)1 1 7 .05 18 2852 1 8 .05 18.5 3663 1 5 .05 18.5 4244 2 .02 21 760
Option 2 - Set No. 1Option 2 - dxbmaritimeSoil Deposit No.: 1 - dxb maritime
Layer Soil Type Thickness ShearModulus
Damping Unit Weight Shear WaveVelocity
(m) (kN/m^2) (kN/m^3) (m/s)1 1 5 .05 17 2632 1 10 .05 18.5 2853 1 5 .05 18.5 3164 2 .02 21 760
Option 2 - Set No. 1Option 2 - mankool ghurairSoil Deposit No.: 1 - mankool
Layer Soil Type Thickness ShearModulus
Damping Unit Weight Shear WaveVelocity
(m) (kN/m^2) (kN/m^3) (m/s)1 1 3 .05 17 304.592 1 12 .05 17 386.973 1 3 .05 18 4404 2 10 .02 21 713.15635 2 23 .02 21 746.696 2 .02 21 760

112
Table A56
Table A57
Table A58
Option 2 - Set No. 1Option 2 - majanmazinSoil Deposit No.: 1 - majan
Layer Soil Type Thickness ShearModulus
Damping Unit Weight Shear WaveVelocity
(m) (kN/m^2) (kN/m^3) (m/s)1 1 1.25 .05 17 407.712 2 20.05 .02 21 7243 2 .02 22 760
Option 2 - Set No. 1Option 2 - bin sogatSoil Deposit No.: 1 - bin sogat
Layer Soil Type Thickness ShearModulus
Damping Unit Weight Shear WaveVelocity
(m) (kN/m^2) (kN/m^3) (m/s)1 1 5 .05 17 266.732 1 1.25 .05 17 564.73 2 3.75 .02 21 7004 2 8.05 .02 21 7055 2 1.95 .02 21 7106 2 5.55 .02 21 7207 2 4.45 .02 21 7308 2 .02 21 760
Option 2 - Set No. 1Option 2 - sky palacesSoil Deposit No.: 1 - sky palaces
Layer Soil Type Thickness ShearModulus
Damping Unit Weight Shear WaveVelocity
(m) (kN/m^2) (kN/m^3) (m/s)1 1 3 .05 17 211.78212 1 6 .05 18.5 237.62533 1 1 .02 18.5 319.60614 1 10 .02 18.5 368.58225 1 1.5 .02 18.5 488.60826 2 .05 21 760

113
Table A59
Table A60
Table A61
Option 2 - Set No. 1Option 2 - dubai waterfrontSoil Deposit No.: 1 - dubaiWF
Layer Soil Type Thickness ShearModulus
Damping Unit Weight Shear WaveVelocity
(m) (kN/m^2) (kN/m^3) (m/s)1 1 .5 .05 17 246.7322 1 .35 .05 18.5 488.60823 2 1.75 .02 22 702.424 2 1.61 .02 22 706.365 2 2.8 .02 22 7136 2 7.2 .02 22 705.8337 2 4 .02 22 739.4848 2 1.5 .02 22 719.69639 2 1.45 .02 22 730.429
10 2 1.55 .02 22 74011 2 .02 22 795.2838
Option 2 - Set No. 1Option 2 - saba towerSoil Deposit No.: 1 - saba
Layer Soil Type Thickness ShearModulus
Damping Unit Weight Shear WaveVelocity
(m) (kN/m^2) (kN/m^3) (m/s)1 1 2 .05 17 3002 1 1 .05 17 471.783 1 4 .05 18.5 564.74 1 3 .05 18.5 5705 2 7 .02 21 721.546 2 7 .02 21 7307 2 1.5 .02 21 7408 2 2.5 .02 21 7509 2 2 .02 21 75510 2 2 .02 21 75511 2 4 .02 22 75512 2 .02 21 760
Option 2 - Set No. 1Option 2 - rtaterminalSoil Deposit No.: 1 - rta
Layer Soil Type Thickness ShearModulus
Damping Unit Weight Shear WaveVelocity
(m) (kN/m^2) (kN/m^3) (m/s)1 1 3 .05 17 96.082 1 1.8 .05 18.5 2873 1 1.2 .05 18.5 159.714 1 .8 .05 18.5 2005 1 5.2 .05 18.5 266.66 1 2.5 .05 18.5 275.447 1 1.3 .05 18.5 3008 1 3.2 .05 18.5 433.489 2 1.85 .02 22 722.6310 2 2.15 .02 22 702.611 2 .02 22 746.86

114
Table A62
Table A63
Table A64
Option 2 - Set No. 1Option 2 - burjdubai island parkSoil Deposit No.: 1 - db island park
Layer Soil Type Thickness ShearModulus
Damping Unit Weight Shear WaveVelocity
(m) (kN/m^2) (kN/m^3) (m/s)1 1 3 .05 18.5 190.16992 1 .5 .05 18.5 488.60823 2 7 .02 22 7004 2 11 .02 22 7255 2 .02 22 760
Option 2 - Set No. 1Option 2 - CHospitalSoil Deposit No.: 1 - CH
Layer Soil Type Thickness ShearModulus
Damping Unit Weight Shear WaveVelocity
(m) (kN/m^2) (kN/m^3) (m/s)1 1 2 .05 17 270.91432 1 .5 .05 17 255.10193 1 3.5 .05 17 442.35334 1 1 .05 17 564.75 1 1 .05 18.5 564.76 1 1 .05 18.5 564.77 1 1 .05 18.5 402.348 1 1 .05 18.5 564.79 2 3.12 .02 22 695.21
10 2 1.5 .02 22 704.811 2 4.23 .02 22 706.4512 2 6.6 .02 22 703.613 2 .02 22 760
Option 2 - Set No. 1Option 2 - botanica towerSoil Deposit No.: 1 - botanica
Layer Soil Type Thickness ShearModulus
Damping Unit Weight Shear WaveVelocity
(m) (kN/m^2) (kN/m^3) (m/s)1 1 1 .05 18.5 263.21922 1 1 .05 18.5 255.10193 1 3 .05 18.5 378.864 1 1.5 .05 18.5 406.0265 1 1.5 .05 18.5 564.76 1 .5 .05 18.5 564.77 2 9 .02 22 708.168 2 3.2 .02 22 879.129 2 5.1 .02 22 747.74
10 2 2.25 .02 22 728.1111 2 3.65 .02 22 714.0512 2 .02 22 760

115
Table A65
Sharjah
Table A66
Table A67
Option 2 - Set No. 1Option 2 - Arena MallSoil Deposit No.: 1 - Arena Mall
Layer Soil Type Thickness ShearModulus
Damping Unit Weight Shear WaveVelocity
(m) (kN/m^2) (kN/m^3) (m/s)1 1 1.54 .05 17 564.72 2 8.46 .02 21 708.963 2 10 .02 21 715.54 2 10 .02 21 716.515 2 5 .02 22 721.546 2 .02 22 760
Option 2 - Set No. 58Option 2 - plot 11 qassimiyaSoil Deposit No.: 58 - plot 11
Layer Soil Type Thickness ShearModulus
Damping Unit Weight Shear WaveVelocity
(m) (kN/m^2) (kN/m^3) (m/s)1 1 5 .05 18 141.87632 1 2 .05 18.5 320.09373 1 18.5 .05 18.5 391.23764 1 4.5 .05 18.5 4265 2 .05 21 1130
Option 2 - Set No. 8Option 2 - plot 11A al majazSoil Deposit No.: 8 - plot 11a
Layer Soil Type Thickness ShearModulus
Damping Unit Weight Shear WaveVelocity
(m) (kN/m^2) (kN/m^3) (m/s)1 1 4 .05 17 135.15062 1 2 .05 18.5 256.71933 1 13 .05 18.5 342.06584 1 3 .05 18.5 389.1865 1 5.5 .05 18.5 387.56936 1 2.5 .05 18.5 4267 2 .05 21 1130

116
Table A68
Table A69
Table A70
Option 2 - Set No. 81Option 2 - plot 15, 17+19 al nahdaSoil Deposit No.: 81 - plot 15, 17+19
Layer Soil Type Thickness ShearModulus
Damping Unit Weight Shear WaveVelocity
(m) (kN/m^2) (kN/m^3) (m/s)1 1 6 .05 17.5 283.53022 1 4.5 .05 18.5 245.05483 1 2.5 .05 18.5 361.02854 1 7.5 .05 18.5 394.31315 1 11.5 .05 18.5 453.09956 2 .05 21 1130
Option 2 - Set No. 64Option 2 - plot 24 al qassimiyaSoil Deposit No.: 64 - plot 24
Layer Soil Type Thickness ShearModulus
Damping Unit Weight Shear WaveVelocity
(m) (kN/m^2) (kN/m^3) (m/s)1 1 7 .05 18 134.90792 1 9 .05 18.5 308.09743 1 14 .05 18.5 429.54324 2 .05 21 1130
Option 2 - Set No. 40Option 2 - plot 51 industrial area 4Soil Deposit No.: 40 - plot 51
Layer Soil Type Thickness ShearModulus
Damping Unit Weight Shear WaveVelocity
(m) (kN/m^2) (kN/m^3) (m/s)1 1 2.5 .05 18 276.2432 1 3.5 .05 18.5 269.88243 1 17.5 .05 18.5 279.2784 1 6.5 .05 18.5 488.60825 2 .05 21 1130

117
Table A71
Table A72
Table A73
Option 2 - Set No. 3Option 2 - plot 105 al majazSoil Deposit No.: 3 - new plot 105
Layer Soil Type Thickness ShearModulus
Damping Unit Weight Shear WaveVelocity
(m) (kN/m^2) (kN/m^3) (m/s)1 1 5 .05 17 231.00252 1 3 .05 18.5 413.60573 1 13 .05 18.5 368.18294 1 3.5 .05 18.5 483.74885 1 5.5 .05 18.5 4896 2 .05 21 1130
Option 2 - Set No. 2Option 2 - plot 105A al majazSoil Deposit No.: 2 - new plot105A
Layer Soil Type Thickness ShearModulus
Damping Unit Weight Shear WaveVelocity
(m) (kN/m^2) (kN/m^3) (m/s)1 1 5 .05 17 230.13172 1 15 .05 18.5 446.84073 1 5.5 .05 18.5 488.60824 1 4.5 .05 18.5 4895 2 .05 18.5 1130
Option 2 - Set No. 11Option 2 - plot 134 al gulayyahSoil Deposit No.: 11 - plot 134
Layer Soil Type Thickness ShearModulus
Damping Unit Weight Shear WaveVelocity
(m) (kN/m^2) (kN/m^3) (m/s)1 1 3 .05 17 221.13592 1 4 .05 18.5 222.20853 1 3 .05 18.5 442.21964 1 15.5 .05 18.5 397.67275 1 4.5 .05 18.5 4266 2 .05 21 1130

118
Table A74
Table A75
Table A76
Option 2 - Set No. 35Option 2 - plot 135 butinaSoil Deposit No.: 35 - plot 135
Layer Soil Type Thickness ShearModulus
Damping Unit Weight Shear WaveVelocity
(m) (kN/m^2) (kN/m^3) (m/s)1 1 3 .05 17 279.64662 1 1 .05 18.5 230.53973 1 3 .05 18.5 286.2824 1 2 .05 18.5 359.64925 1 4 .05 18.5 285.34226 1 4 .05 18.5 329.99827 1 8.5 .05 18.5 406.18948 1 4.5 .05 18.5 4269 2 .05 21 1130
Option 2 - Set No. 54Option 2 - plot 138 al majazSoil Deposit No.: 54 - plot 138
Layer Soil Type Thickness ShearModulus
Damping Unit Weight Shear WaveVelocity
(m) (kN/m^2) (kN/m^3) (m/s)1 1 6 .05 18 196.86982 1 10 .05 18.5 321.7573 1 9.5 .05 18.5 457.85954 1 4.5 .05 18.5 4895 2 .05 21 1130
Option 2 - Set No. 74Option 2 - plot 141-696 muwailahSoil Deposit No.: 74 - plot 141 696
Layer Soil Type Thickness ShearModulus
Damping Unit Weight Shear WaveVelocity
(m) (kN/m^2) (kN/m^3) (m/s)1 1 3 .05 17 287.27072 1 .5 .05 18.5 177.10393 1 4.5 .05 18.5 228.97724 1 4.5 .05 18.5 365.25385 1 13 .05 18.5 464.75116 1 4.5 .05 18.5 4897 2 .05 21 1130
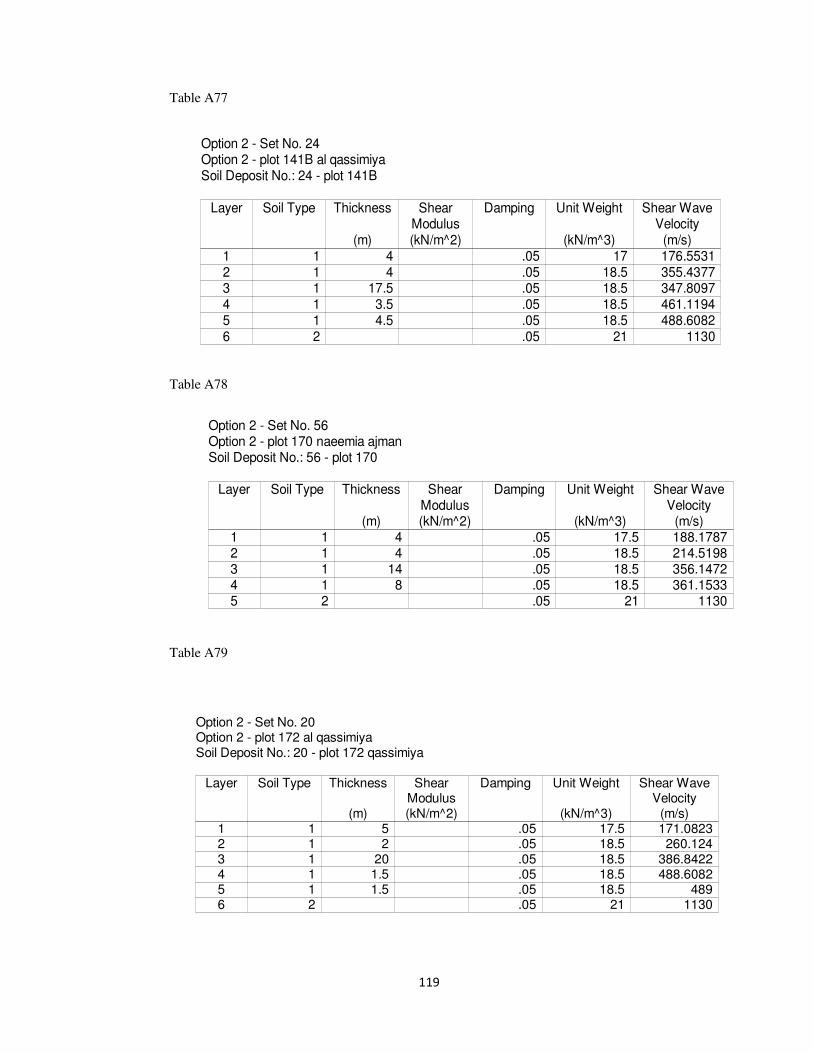
119
Table A77
Table A78
Table A79
Option 2 - Set No. 24Option 2 - plot 141B al qassimiyaSoil Deposit No.: 24 - plot 141B
Layer Soil Type Thickness ShearModulus
Damping Unit Weight Shear WaveVelocity
(m) (kN/m^2) (kN/m^3) (m/s)1 1 4 .05 17 176.55312 1 4 .05 18.5 355.43773 1 17.5 .05 18.5 347.80974 1 3.5 .05 18.5 461.11945 1 4.5 .05 18.5 488.60826 2 .05 21 1130
Option 2 - Set No. 56Option 2 - plot 170 naeemia ajmanSoil Deposit No.: 56 - plot 170
Layer Soil Type Thickness ShearModulus
Damping Unit Weight Shear WaveVelocity
(m) (kN/m^2) (kN/m^3) (m/s)1 1 4 .05 17.5 188.17872 1 4 .05 18.5 214.51983 1 14 .05 18.5 356.14724 1 8 .05 18.5 361.15335 2 .05 21 1130
Option 2 - Set No. 20Option 2 - plot 172 al qassimiyaSoil Deposit No.: 20 - plot 172 qassimiya
Layer Soil Type Thickness ShearModulus
Damping Unit Weight Shear WaveVelocity
(m) (kN/m^2) (kN/m^3) (m/s)1 1 5 .05 17.5 171.08232 1 2 .05 18.5 260.1243 1 20 .05 18.5 386.84224 1 1.5 .05 18.5 488.60825 1 1.5 .05 18.5 4896 2 .05 21 1130

120
Table A80
Table A81
Table A82
Option 2 - Set No. 10Option 2 - plot 178 al qassimiyaSoil Deposit No.: 10 - plot 178
Layer Soil Type Thickness ShearModulus
Damping Unit Weight Shear WaveVelocity
(m) (kN/m^2) (kN/m^3) (m/s)1 1 8 .05 17 147.1232 1 12 .05 18.5 274.42883 1 5.5 .05 18.5 477.91914 1 4.5 .05 18.5 4895 2 .05 21 1130
Option 2 - Set No. 41Option 2 - plot 180 al musallaSoil Deposit No.: 41 - plot 180
Layer Soil Type Thickness ShearModulus
Damping Unit Weight Shear WaveVelocity
(m) (kN/m^2) (kN/m^3) (m/s)1 1 8 .05 18 141.42 1 17 .05 18.5 381.98143 1 2.5 .05 18.5 462.00594 1 2.5 .05 18.5 4895 2 .05 21 1130
Option 2 - Set No. 22Option 2 - plot 216 al khanSoil Deposit No.: 22 - plot 216
Layer Soil Type Thickness ShearModulus
Damping Unit Weight Shear WaveVelocity
(m) (kN/m^2) (kN/m^3) (m/s)1 1 6.5 .05 18 226.86522 1 6.5 .05 18.5 469.21893 1 9 .05 18.5 337.99714 1 3.5 .05 18.5 356.19695 1 4.5 .05 18.5 4266 2 .05 21 1130

121
Table A83
Table A84
Table A85
Option 2 - Set No. 29Option 2 - plot 224 al majazSoil Deposit No.: 29 - plot 224
Layer Soil Type Thickness ShearModulus
Damping Unit Weight Shear WaveVelocity
(m) (kN/m^2) (kN/m^3) (m/s)1 1 4 .05 17.5 211.36922 1 4 .05 18.5 255.28213 1 13 .05 18.5 334.03194 1 16 .05 18.5 418.88425 1 13.5 .05 18.5 488.60826 2 .05 21 1130
Option 2 - Set No. 60Option 2 - plot 297 abu shagaraSoil Deposit No.: 60 - plot 297
Layer Soil Type Thickness ShearModulus
Damping Unit Weight Shear WaveVelocity
(m) (kN/m^2) (kN/m^3) (m/s)1 1 6 .05 18 276.39662 1 6 .05 18.5 379.3523 1 12 .05 18.5 461.86624 1 6 .05 18.5 488.60825 2 .05 21 1130
Option 2 - Set No. 25Option 2 - plot 352 al mujarrahSoil Deposit No.: 25 - plot 352
Layer Soil Type Thickness ShearModulus
Damping Unit Weight Shear WaveVelocity
(m) (kN/m^2) (kN/m^3) (m/s)1 1 7 .05 18 215.8872 1 4 .05 18.5 114.45713 1 5 .05 18.5 309.64184 1 5 .05 18.5 344.07955 1 4.5 .05 18.5 447.35926 1 4.5 .05 18.5 4897 2 .05 21 1130

122
Table A86
Table A87
Table A88
Option 2 - Set No. 18Option 2 - plot 424 al nabaaSoil Deposit No.: 18 - plot 424
Layer Soil Type Thickness ShearModulus
Damping Unit Weight Shear WaveVelocity
(m) (kN/m^2) (kN/m^3) (m/s)1 1 6.5 .05 17.5 143.07482 1 6 .05 18.5 219.79283 1 9 .05 18.5 404.48414 1 4 .05 18.5 479.2555 1 4.5 .05 18.5 4896 2 .05 21 1130
Option 2 - Set No. 51Option 2 - plot 470 musallaSoil Deposit No.: 51 - plot 470
Layer Soil Type Thickness ShearModulus
Damping Unit Weight Shear WaveVelocity
(m) (kN/m^2) (kN/m^3) (m/s)1 1 2 .05 17 187.45012 1 8 .05 18.5 363.82243 1 15.5 .05 18.5 369.88344 1 4.5 .05 18.5 4265 2 .05 21 1130
Option 2 - Set No. 61Option 2 - plot 483 abu shagaraSoil Deposit No.: 61 - plot 483
Layer Soil Type Thickness ShearModulus
Damping Unit Weight Shear WaveVelocity
(m) (kN/m^2) (kN/m^3) (m/s)1 1 6 .05 18 346.03922 1 12 .05 18.5 454.40773 1 7.5 .05 18.5 488.60824 1 4.5 .05 18.5 4895 2 .05 21 1130
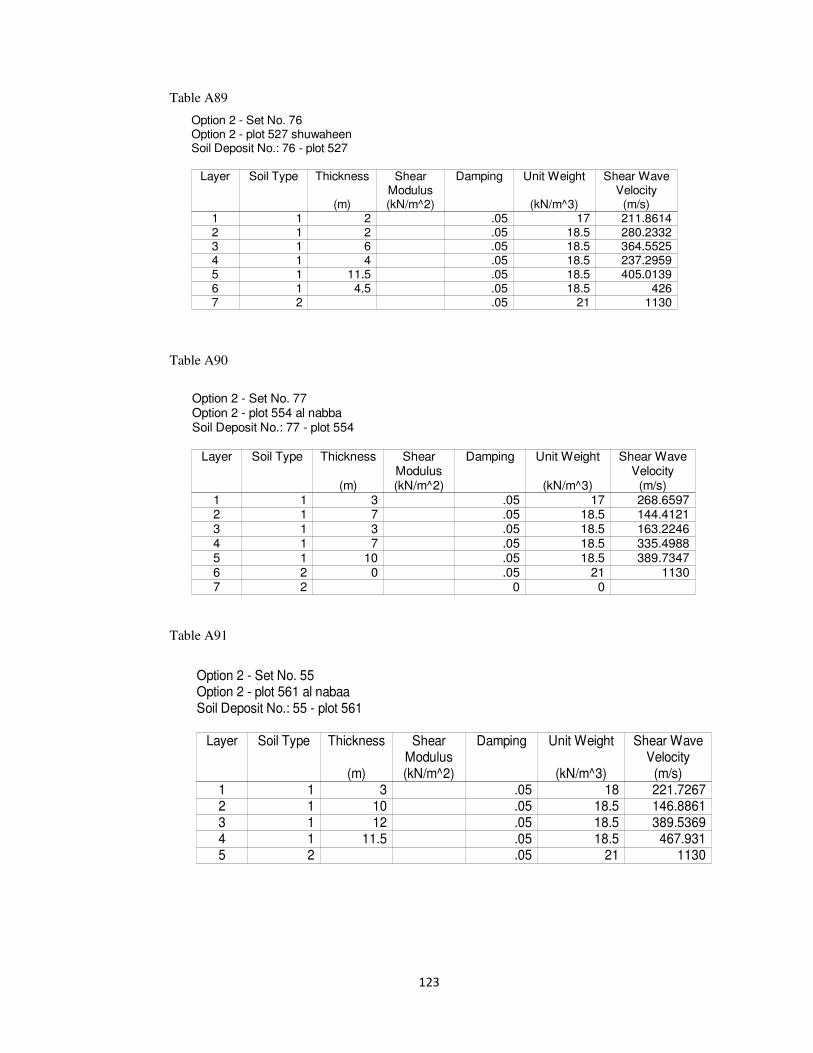
123
Table A89
Table A90
Table A91
Option 2 - Set No. 76Option 2 - plot 527 shuwaheenSoil Deposit No.: 76 - plot 527
Layer Soil Type Thickness ShearModulus
Damping Unit Weight Shear WaveVelocity
(m) (kN/m^2) (kN/m^3) (m/s)1 1 2 .05 17 211.86142 1 2 .05 18.5 280.23323 1 6 .05 18.5 364.55254 1 4 .05 18.5 237.29595 1 11.5 .05 18.5 405.01396 1 4.5 .05 18.5 4267 2 .05 21 1130
Option 2 - Set No. 77Option 2 - plot 554 al nabbaSoil Deposit No.: 77 - plot 554
Layer Soil Type Thickness ShearModulus
Damping Unit Weight Shear WaveVelocity
(m) (kN/m^2) (kN/m^3) (m/s)1 1 3 .05 17 268.65972 1 7 .05 18.5 144.41213 1 3 .05 18.5 163.22464 1 7 .05 18.5 335.49885 1 10 .05 18.5 389.73476 2 0 .05 21 11307 2 0 0
Option 2 - Set No. 55Option 2 - plot 561 al nabaaSoil Deposit No.: 55 - plot 561
Layer Soil Type Thickness ShearModulus
Damping Unit Weight Shear WaveVelocity
(m) (kN/m^2) (kN/m^3) (m/s)1 1 3 .05 18 221.72672 1 10 .05 18.5 146.88613 1 12 .05 18.5 389.53694 1 11.5 .05 18.5 467.9315 2 .05 21 1130

124
Table A92
Table A93
Table A94
Option 2 - Set No. 73Option 2 - plot 644 al musallaSoil Deposit No.: 73 - plot 644
Layer Soil Type Thickness ShearModulus
Damping Unit Weight Shear WaveVelocity
(m) (kN/m^2) (kN/m^3) (m/s)1 1 11 .05 18 299.9622 1 2 .05 18.5 262.82033 1 12.5 .05 18.5 420.94524 1 4.5 .05 18.5 4265 2 .05 21 1130
Option 2 - Set No. 62Option 2 - plot 742 abu shagaraSoil Deposit No.: 62 - plot 742
Layer Soil Type Thickness ShearModulus
Damping Unit Weight Shear WaveVelocity
(m) (kN/m^2) (kN/m^3) (m/s)1 1 6 .05 18 291.75572 1 9 .05 18.5 344.21983 1 5 .05 18.5 488.60824 1 5.5 .05 18.5 488.60825 1 4.5 .05 18.5 4896 2 .05 21 1130
Option 2 - Set No. 1Option 2 - plot 790 al khanSoil Deposit No.: 1 - plot 790
Layer Soil Type Thickness ShearModulus
Damping Unit Weight Shear WaveVelocity
(m) (kN/m^2) (kN/m^3) (m/s)1 1 8 .05 17 182.48642 1 8 .05 18.5 314.75913 1 9 .05 18.5 406.15374 1 2 .05 18.5 381.05115 1 8.5 .05 18.5 473.25956 2 .05 21 1130

125
Table A95
Table A96
Table A97
Option 2 - Set No. 69Option 2 - plot 817 al khanSoil Deposit No.: 69 - plot 817
Layer Soil Type Thickness ShearModulus
Damping Unit Weight Shear WaveVelocity
(m) (kN/m^2) (kN/m^3) (m/s)1 1 2.5 .05 17 210.03952 1 2.5 .05 18.5 156.19913 1 4 .05 18.5 200.32514 1 21 .05 18.5 433.635 2 .05 21 1130
Option 2 - Set No. 33Option 2 - plot 831 al majazSoil Deposit No.: 33 - plot 831
Layer Soil Type Thickness ShearModulus
Damping Unit Weight Shear WaveVelocity
(m) (kN/m^2) (kN/m^3) (m/s)1 1 6 .05 17 215.12232 1 3 .05 18.5 253.1053 1 16 .05 18.5 360.33694 1 5 .05 18.5 469.52125 2 .05 21 1130
Option 2 - Set No. 63Option 2 - plot 894 qassimiyaSoil Deposit No.: 63 - plot 894
Layer Soil Type Thickness ShearModulus
Damping Unit Weight Shear WaveVelocity
(m) (kN/m^2) (kN/m^3) (m/s)1 1 5 .05 18 129.70442 1 4 .05 18.5 292.82963 1 6 .05 18.5 342.02574 1 10.5 .05 18.5 459.89455 1 4.5 .05 18.5 4896 2 .05 21 1130

126
Table A98
Table A99
Table A100
Option 2 - Set No. 45Option 2 - plot 950 al ghuwairSoil Deposit No.: 45 - plot 950
Layer Soil Type Thickness ShearModulus
Damping Unit Weight Shear WaveVelocity
(m) (kN/m^2) (kN/m^3) (m/s)1 1 11 .05 18 323.4572 1 13 .05 18.5 368.22093 1 6 .05 18.5 465.75534 2 .05 21 1130
Option 2 - Set No. 9Option 2 - plot 1118 al majazSoil Deposit No.: 9 - plot 1118
Layer Soil Type Thickness ShearModulus
Damping Unit Weight Shear WaveVelocity
(m) (kN/m^2) (kN/m^3) (m/s)1 1 3 .05 17 264.81922 1 11 .05 18.5 188.87113 1 4 .05 18.5 470.94194 1 4 .05 18.5 439.1645 1 8 .05 18.5 485.51376 2 .05 21 1130
Option 2 - Set No. 28Option 2 - plot 1243N al khanSoil Deposit No.: 28 - plot 1243
Layer Soil Type Thickness ShearModulus
Damping Unit Weight Shear WaveVelocity
(m) (kN/m^2) (kN/m^3) (m/s)1 1 6 .05 17.5 245.58042 1 3 .05 18.5 374.99263 1 16.5 .05 18.5 360.23594 1 4.5 .05 18.5 4265 2 .05 21 1130

127
Table A101
Table A102
Option 2 - Set No. 5Option 2 - dubai madam road nizwaSoil Deposit No.: 5 - dubai madam road
Layer Soil Type Thickness ShearModulus
Damping Unit Weight Shear WaveVelocity
(m) (kN/m^2) (kN/m^3) (m/s)1 1 17 .05 18.5 309.40052 1 8.5 .05 18.5 488.60823 1 4.5 .05 18.5 4894 2 .05 21 1130
Option 2 - Set No. 38Option 2 - plot 597 abu shagarahSoil Deposit No.: 38 - plot 597
Layer Soil Type Thickness ShearModulus
Damping Unit Weight Shear WaveVelocity
(m) (kN/m^2) (kN/m^3) (m/s)1 1 7 .05 18.5 387.68892 1 11 .05 18.5 396.1283 1 12 .05 18.5 478.95784 2 .05 21 1130

128
Appendix B
SOFTWARE INTERFACES

129
Rsp MatchEDT
Figure B1

130
SHAKE 2000
Figure B2

131
Figure B3
Figure B3
Figure B4
Figure B5

132
Appendix C
MANUAL INTEGRATION FOR PSHA
133
Figure C1

134
Figure C2

135
Figure C3

136
VITA
Muhammad Irfan was born on January 14, 1988 in Karachi, Pakistan. Until
grade 5, he studied in a local private school. He moved to UAE with his family in
1997 to continue his schooling from The Westminster School in Dubai, UAE. He
completed his O levels from The Westminster School and A levels from English
Medium School (now known as ‘English Language School’) in Dubai UAE. His A
levels grades were for which he received top achievers certificate. He completed his
Bachelors of Science in Civil Engineering from the American University of Sharjah in
Sharjah, UAE in 2009. Mr. Irfan was awarded Dean’s list recognition for four
semesters and once in Chancellor’s list.
Mr. Irfan started Master’s of Science in Civil Engineering immediately after
graduation, and was awarded Graduate Teaching/Research Assistantship for three
semesters. He completed his Master’s degree in Spring 2011.