Embed Size (px)
Citation preview
11/3/2008
1
Seismic Performance of Nonstructural of Systems ySubjected to Full-scale Floor MotionsGilberto MosquedaqAssistant Professor Department of Civil, Structural and Environmental Engineering University at Buffalo
Research Collaborators
Professor Andre FiliatraultProfessor Andre FiliatraultProfessor Andrei ReinhornDr. Rodrigo RetamalesRyan Davies, Graduate Student
2
11/3/2008
2
OverviewDefinition and importance of nonstructural components and systems in seismic eventscomponents and systems in seismic eventsCurrent code requirementsUB Nonstructural Component Simulator (UB-NCS)New loading protocols for seismic qualification and fragility assessment of nonstructuraland fragility assessment of nonstructural componentsSeismic performance assessment of a full-scale hospital emergency room
3
Nonstructural ComponentsSystems and elements in a building that are not part of the load-bearing structural systemArchitectural
Cladding, glazingCeilings, partition walls
Mechanical and ElectricalDistribution systems - pipingHVAC ducts and equipment
of the load bearing structural system
HVAC ducts and equipment
ContentsFree-standing and anchored medical equipment, computers, shelves, etc.
4
11/3/2008
3
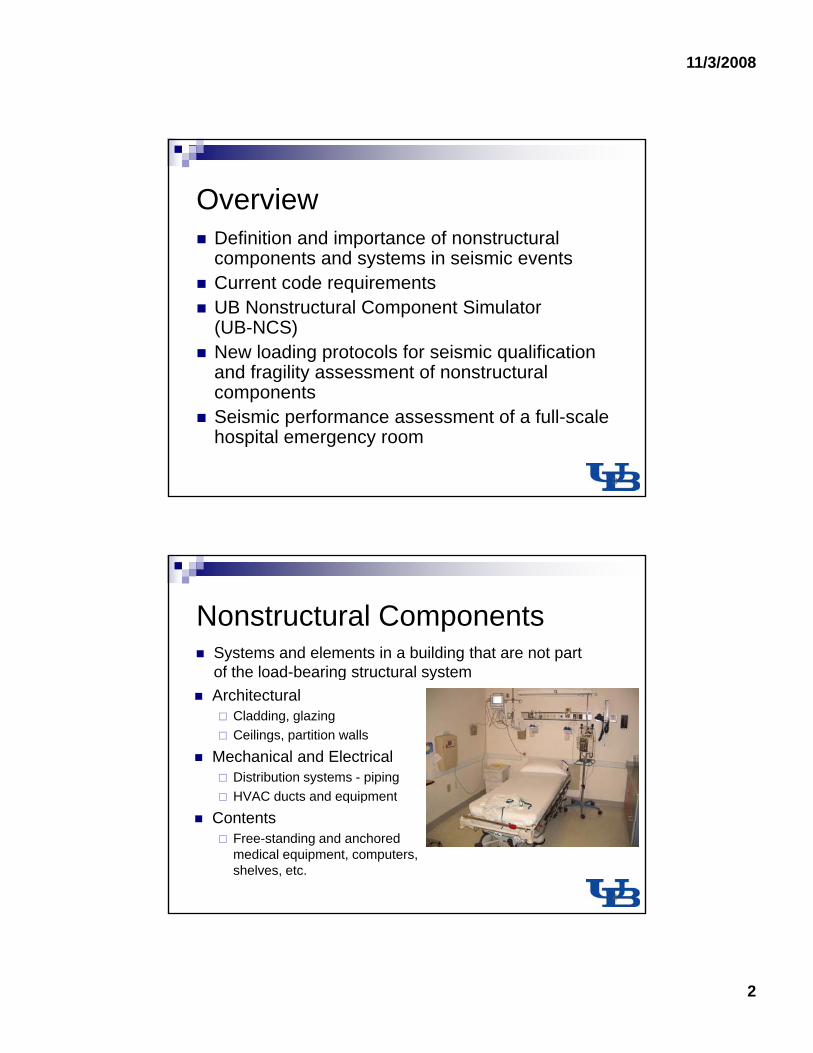
Investment in Nonstructural Components and Content
5
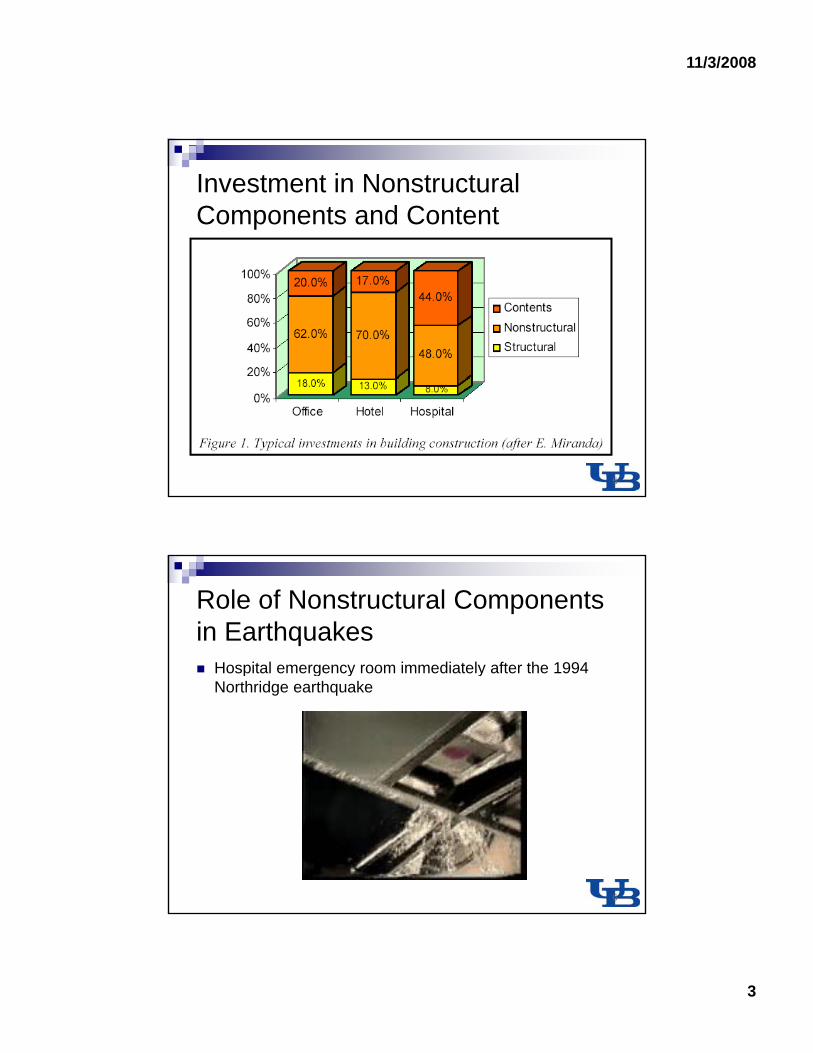
Role of Nonstructural Components in Earthquakes
Hospital emergency room immediately after the 1994 p g y yNorthridge earthquake
6

11/3/2008
4
Role of Nonstructural Components in Earthquakes
2001 Nisqually Earthquake (Filiatrault)q y q ( )
7
Role of Nonstructural Components in Earthquakes
In order for a building or facility to remain operational g y pafter an earthquake, both structural and nonstructural systems must remain intactIn past earthquakes
many hospitals and other facilities have survived earthquakes without structural damage, but lost functionality due to nonstructural damage50% of $18 Billion in building damage following 1994 Northridge earthquake was due to nonstructural damage (Kircher 2003)
In addition to structural response, compatible seismic performance of nonstructural components is essential to achieve global performance objectives
8

11/3/2008
5
Code Requirements (ASCE 7-05)
International Building Code references ASCE 7-05 Nonstructural design requirements depend on:
Seismic Design Category of structureA-F, depending on occupancy category and site spectral accelerations at short (SDS) and long period (SD1)
Occupancy Category of structureI – low hazard to human life (storage)II – regular buildingsIII – high hazard to human life (schools, meeting rooms)IV – essential facilities (hospitals, emergency response center)
Nonstructural Importance Factor IP = 1 or 1.5IP =1.5 if component (a) is essential for life-safety; (b) contains hazardous materials; or (c) is required for functionality of Cat. IV structure
9
Code Requirements (ASCE 7-05)
Equivalent Static Design ForceEquivalent Static Design Force
= component amplification factor (1-2.5)= component importance factor (1-1.5)
⎟⎠⎞
⎜⎝⎛ +=
hz
IRWSa
Fpp
pDSpp 21
/4.0
papI p p ( )
= component response modification factor (1-12)= short period spectral acceleration= component weight= normalized height of component in building
10
pW
p
pRDSS
hz /
11/3/2008
6
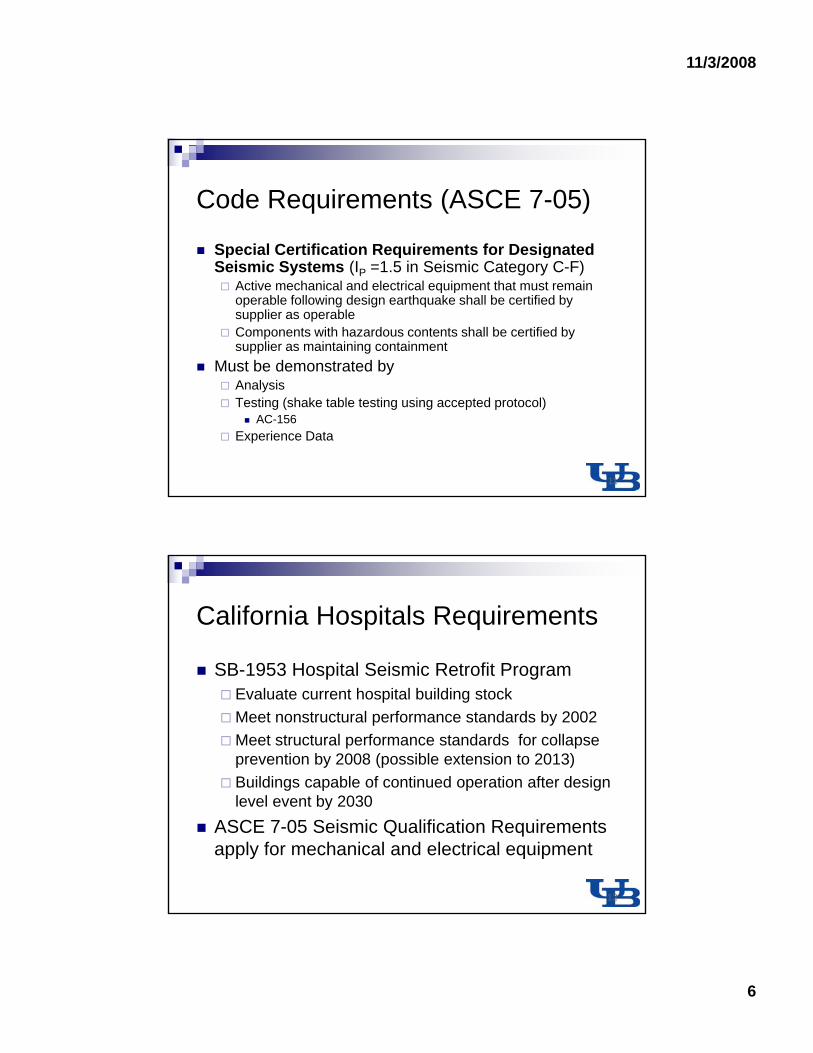
Code Requirements (ASCE 7-05)
Special Certification Requirements for Designated gSeismic Systems (IP =1.5 in Seismic Category C-F)
Active mechanical and electrical equipment that must remain operable following design earthquake shall be certified by supplier as operableComponents with hazardous contents shall be certified by supplier as maintaining containment
Must be demonstrated byAnalysisTesting (shake table testing using accepted protocol)
AC-156Experience Data
11
California Hospitals Requirements
SB-1953 Hospital Seismic Retrofit ProgramSB 1953 Hospital Seismic Retrofit ProgramEvaluate current hospital building stockMeet nonstructural performance standards by 2002Meet structural performance standards for collapse prevention by 2008 (possible extension to 2013)Buildings capable of continued operation after design level event by 2030
ASCE 7-05 Seismic Qualification Requirements apply for mechanical and electrical equipment
12

11/3/2008
7
Testing Protocols for Seismic Qualification of Equipment
ICC-ES AC156 shake table testing protocolTest under non-stationary random excitations matching target floor response spectrum
FLX DSA 1.6S≤
⎛ ⎞
FLX DSzA S 1 2h
⎛ ⎞= +⎜ ⎟⎝ ⎠
Force levels consistent with static design force FP
Test unit should remain functional after testing
RIG DSzA 0.4S 1 2h
⎛ ⎞= +⎜ ⎟⎝ ⎠
Testing Protocols for Seismic Fragility Assessment
FEMA 461 testing protocols:R ki ( i i ) f di l (d if )Racking (quasi-static) test for displacement (drift) sensitive nonstructural componentsShake table tests for acceleration sensitive components
Objective is to determine mean loading conditions triggering different damage levels
Shaking Intensity Measure
Pro
babi
lity
of
Exce
edin
g a
Dam
age
Sta
te
100%
0%
11/3/2008
8
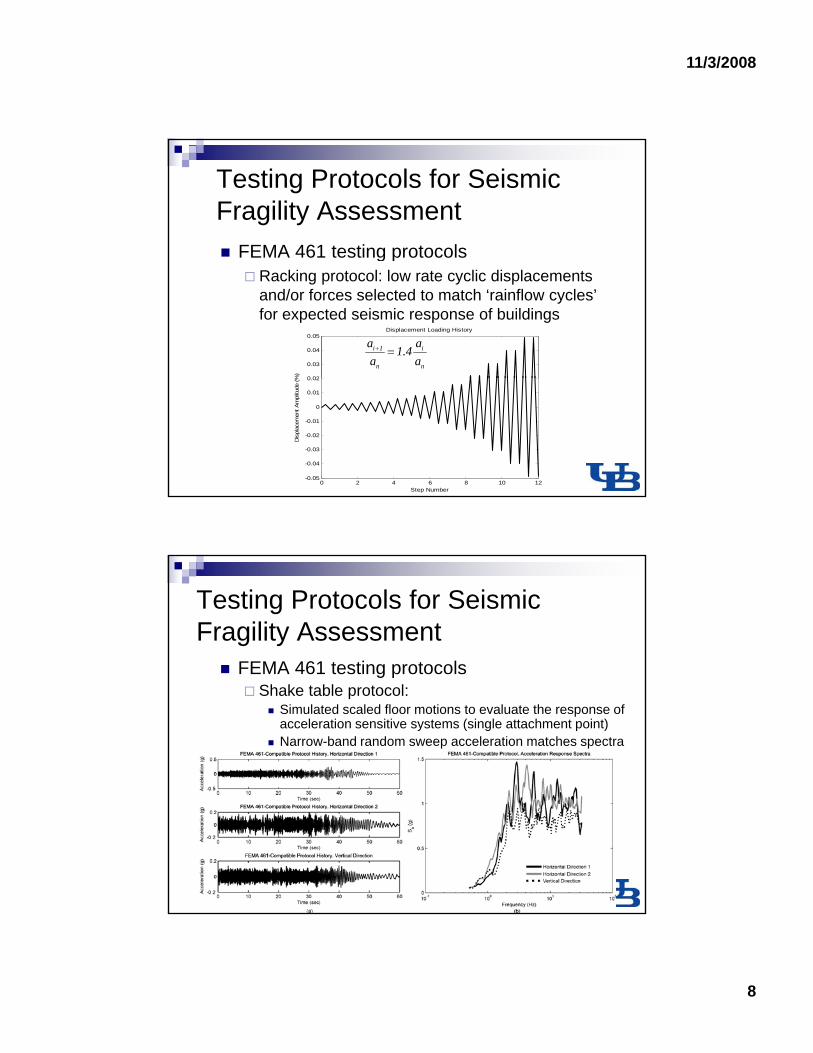
FEMA 461 testing protocols
Testing Protocols for Seismic Fragility Assessment
g pRacking protocol: low rate cyclic displacements and/or forces selected to match ‘rainflow cycles’ for expected seismic response of buildings
0 02
0.03
0.04
0.05Displacement Loading History
%)
i 1 i
n n
a a1.4a a
+ =
0 2 4 6 8 10 12-0.05
-0.04
-0.03
-0.02
-0.01
0
0.01
0.02
Step Number
Dis
plac
emen
t Am
plitu
de (%
FEMA 461 testing protocols
Testing Protocols for Seismic Fragility Assessment
g pShake table protocol:
Simulated scaled floor motions to evaluate the response of acceleration sensitive systems (single attachment point)Narrow-band random sweep acceleration matches spectra

11/3/2008
9
HVAC E i t M t d
Application of Testing Protocol
HVAC Equipment Mounted on Vibration Isolation/Restraint Systems
PI: A. FiliatraultSponsor: MCEER/ASHRAEIndustry Partner: ASHRAE
11/3/2008
10
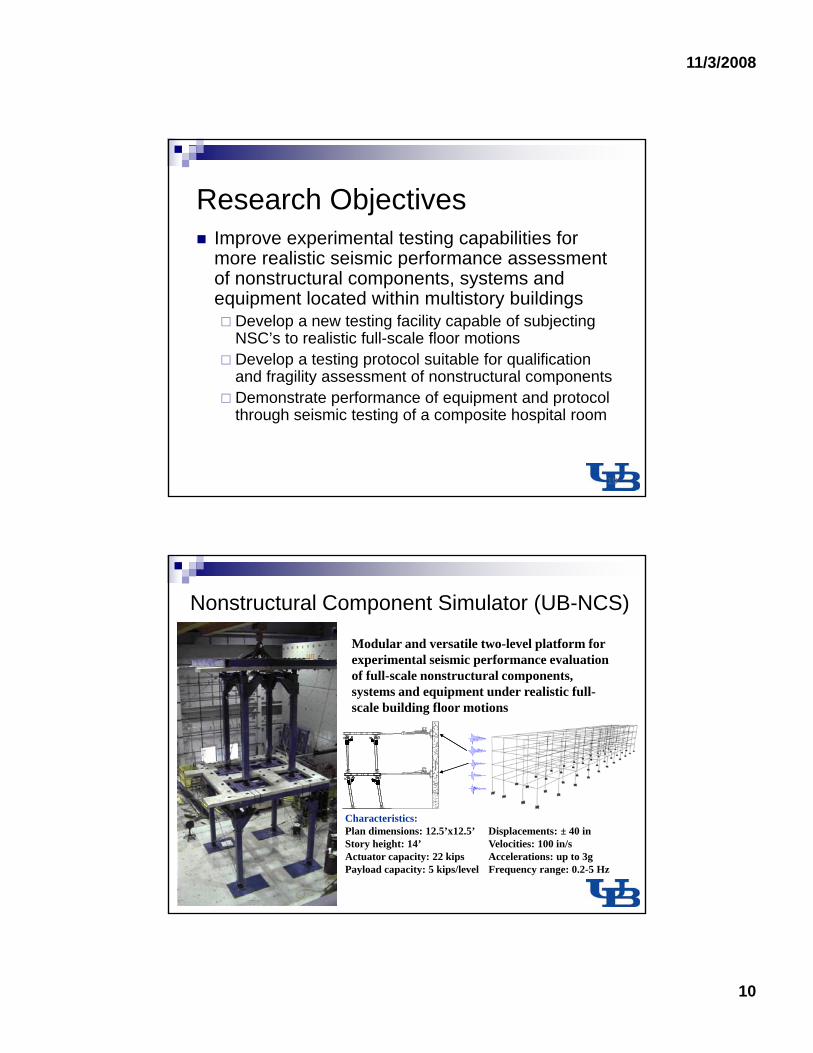
Research ObjectivesImprove experimental testing capabilities for more realistic seismic performance assessmentmore realistic seismic performance assessment of nonstructural components, systems and equipment located within multistory buildings
Develop a new testing facility capable of subjecting NSC’s to realistic full-scale floor motionsDevelop a testing protocol suitable for qualification and fragility assessment of nonstructural componentsand fragility assessment of nonstructural componentsDemonstrate performance of equipment and protocol through seismic testing of a composite hospital room
19
Nonstructural Component Simulator (UB-NCS)
Modular and versatile two-level platform for experimental seismic performance evaluation of full scale nonstructural componentsof full-scale nonstructural components, systems and equipment under realistic full-scale building floor motions
Rea
ctio
n W
all
Rea
ctio
n W
all
Characteristics:Plan dimensions: 12.5’x12.5’ Displacements: ± 40 inStory height: 14’ Velocities: 100 in/sActuator capacity: 22 kips Accelerations: up to 3gPayload capacity: 5 kips/level Frequency range: 0.2-5 Hz

11/3/2008
11
Replicate recorded or simulated floor motions at
UB-NCS Testing Capabilities
upper levels of multi-story buildings Replicate full scale near-fault ground motions (including large displacement/velocity pulses) Capability to generate data required to better understand behavior of nonstructural components under realistic demandscomponents under realistic demands
Develop experimental fragility curvesDevelop effective techniques to protect equipment in buildings
Objectives:Id tif d i ti d
Performance Evaluation of UB-NCS
Identify dynamic properties and limitations of UB-NCSEvaluate system fidelity for replicating simulated and recorded full scale floor motions
Extensive testing including:Hammer impactWhite noise and sine sweep tests Transient floor motionsNew protocols under development
11/3/2008
12
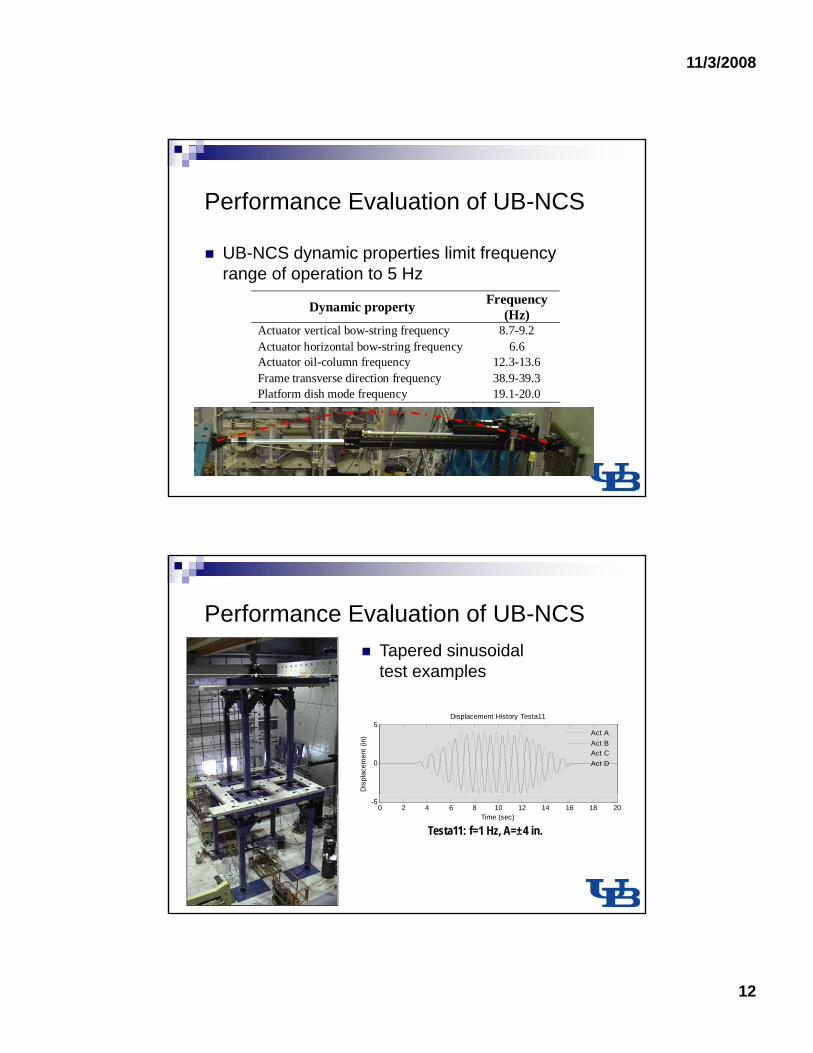
UB-NCS dynamic properties limit frequency
Performance Evaluation of UB-NCS
UB NCS dynamic properties limit frequency range of operation to 5 Hz
Dynamic property Frequency (Hz)
Actuator vertical bow-string frequency 8.7-9.2 Actuator horizontal bow-string frequency 6.6 Actuator oil-column frequency 12.3-13.6 Frame transverse direction frequency 38 9 39 3Frame transverse direction frequency 38.9-39.3Platform dish mode frequency 19.1-20.0
Tapered sinusoidal test examples
Performance Evaluation of UB-NCS
test examples
0
5Displacement History Testa11
Dis
plac
emen
t (in
) Act AAct BAct CAct D
Testa11: f=1 Hz, A=±4 in.
0 2 4 6 8 10 12 14 16 18 20-5
Time (sec)R l i Di l Hi T 11
11/3/2008
13
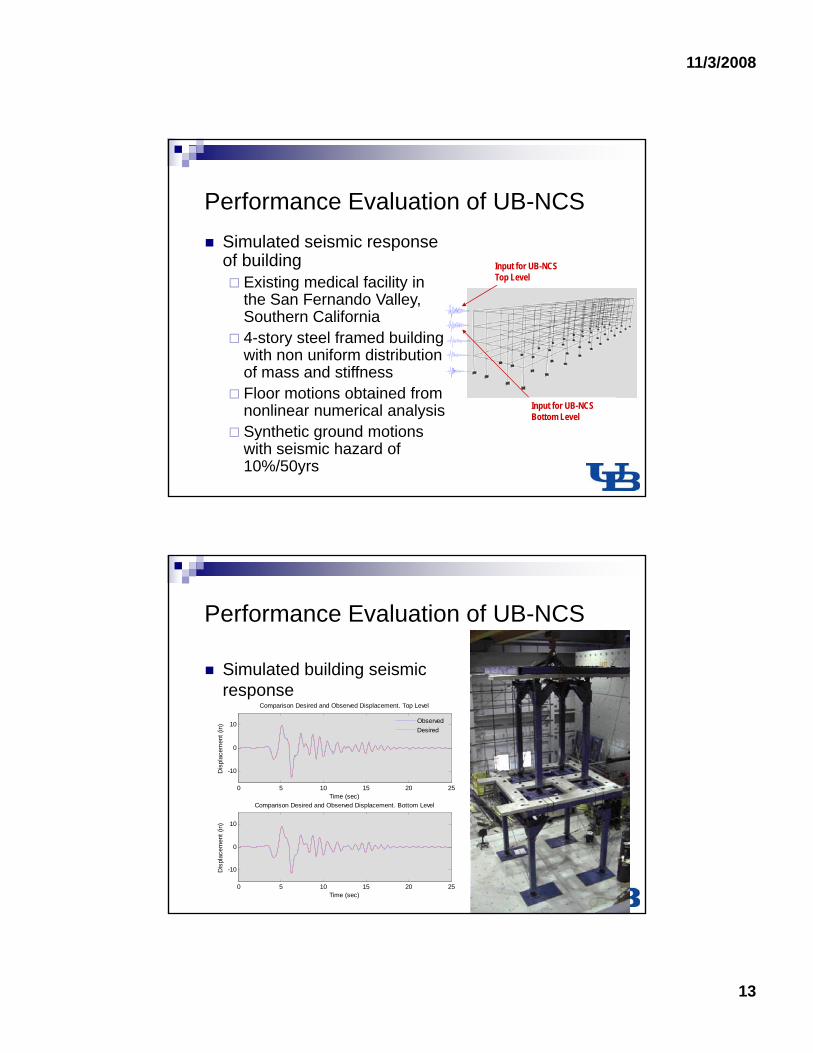
Simulated seismic response of building
Performance Evaluation of UB-NCS
of building Existing medical facility in the San Fernando Valley, Southern California4-story steel framed building with non uniform distribution of mass and stiffness
Input for UB-NCS Top Level
Floor motions obtained from nonlinear numerical analysis Synthetic ground motions with seismic hazard of 10%/50yrs
Input for UB-NCS Bottom Level
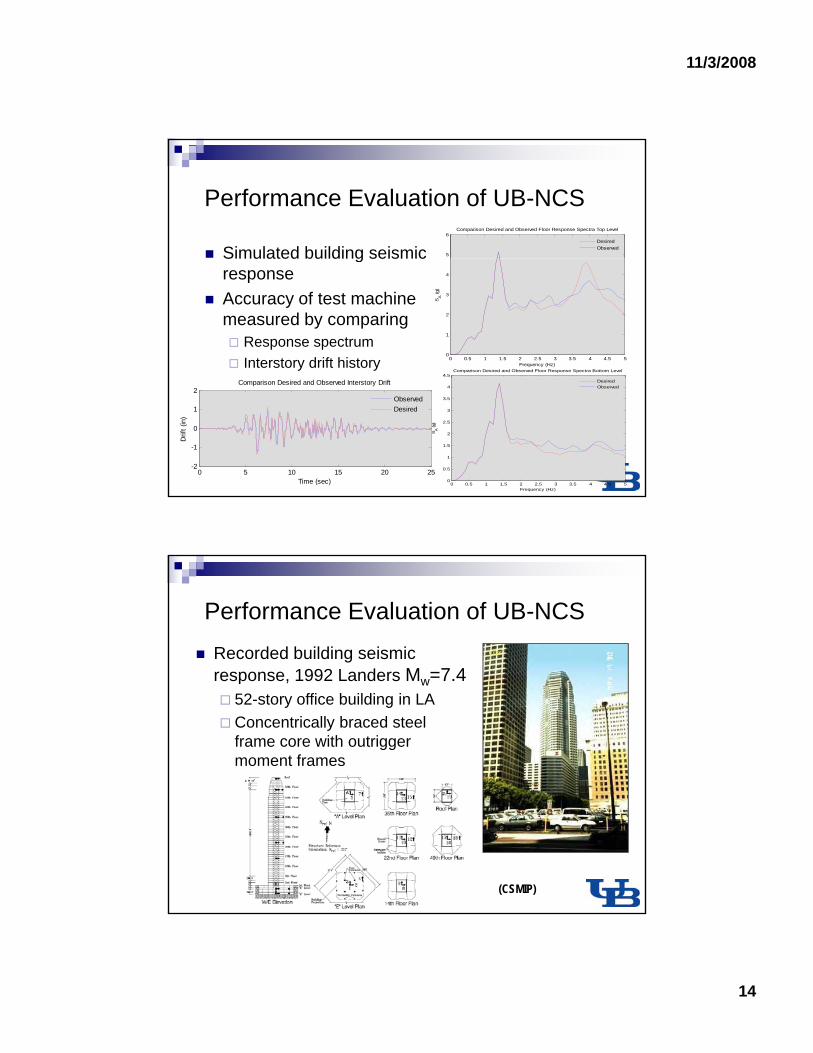
Simulated building seismic
Performance Evaluation of UB-NCS
Simulated building seismic response
0 5 10 15 20 25
-10
0
10
Ti ( )
Dis
plac
emen
t (in
)
Comparison Desired and Observed Displacement. Top Level
ObservedDesired
Time (sec)
0 5 10 15 20 25
-10
0
10
Comparison Desired and Observed Displacement. Bottom Level
Time (sec)
Dis
plac
emen
t (in
)
11/3/2008
14
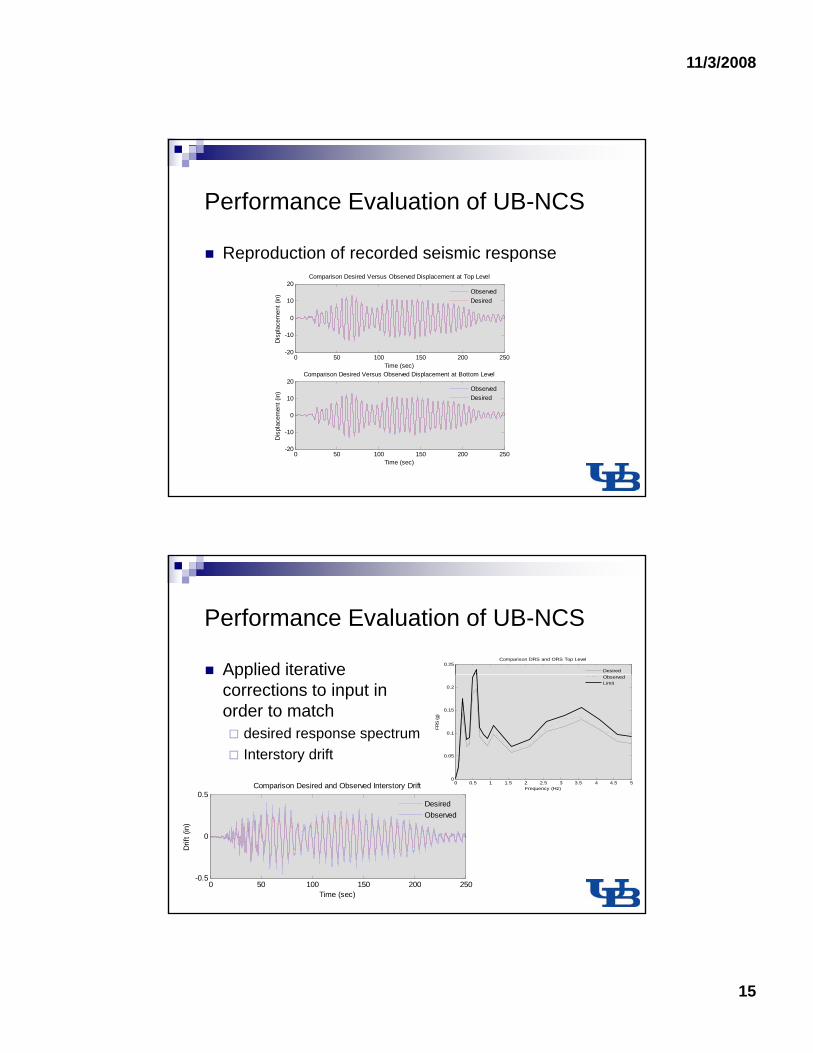
Simulated building seismic 5
6Comparison Desired and Observed Floor Response Spectra Top Level
DesiredObserved
Performance Evaluation of UB-NCS
Simulated building seismic responseAccuracy of test machine measured by comparing
Response spectrumInterstory drift history
4.5Comparison Desired and Observed Floor Response Spectra Bottom Level
0 0.5 1 1.5 2 2.5 3 3.5 4 4.5 50
1
2
3
4
Frequency (Hz)
SA (g
)
0 5 10 15 20 25-2
-1
0
1
2
Time (sec)
Drif
t (in
)
Comparison Desired and Observed Interstory Drift
ObservedDesired
0 0.5 1 1.5 2 2.5 3 3.5 4 4.5 50
0.5
1
1.5
2
2.5
3
3.5
4
Frequency (Hz)
SA (g
)
DesiredObserved
Recorded building seismic response 1992 Landers M =7 4
Performance Evaluation of UB-NCS
response, 1992 Landers Mw=7.4 52-story office building in LAConcentrically braced steel frame core with outrigger moment frames
(CSMIP)
11/3/2008
15
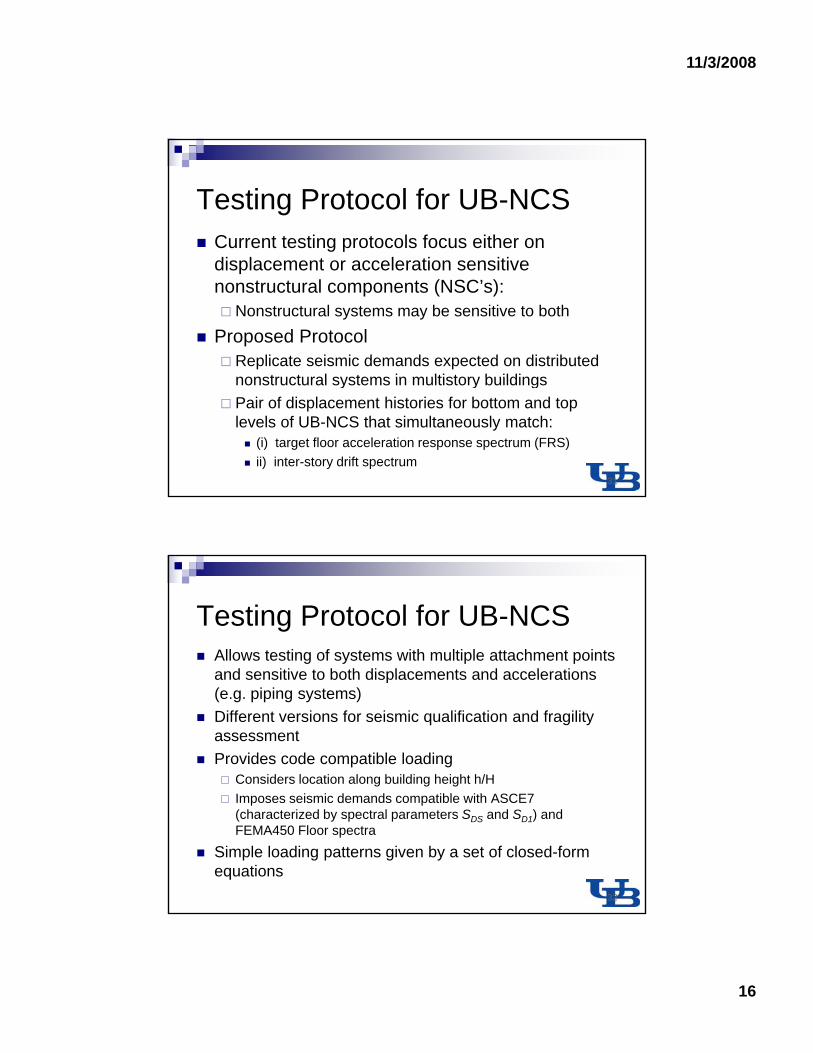
Reproduction of recorded seismic response
Performance Evaluation of UB-NCS
Reproduction of recorded seismic response
0 50 100 150 200 250-20
-10
0
10
20
Time (sec)
Dis
plac
emen
t (in
)Comparison Desired Versus Observed Displacement at Top Level
ObservedDesired
Comparison Desired Versus Observed Displacement at Bottom Level
0 50 100 150 200 250-20
-10
0
10
20
Time (sec)
Dis
plac
emen
t (in
) ObservedDesired
Applied iterative
0.25Comparison DRS and ORS Top Level
Desired
Performance Evaluation of UB-NCS
Applied iterative corrections to input in order to match
desired response spectrumInterstory drift
0 5Comparison Desired and Observed Interstory Drift 0 0.5 1 1.5 2 2.5 3 3.5 4 4.5 5
0
0.05
0.1
0.15
0.2
Frequency (Hz)
FRS
(g)
ObservedLimit
0 50 100 150 200 250-0.5
0
0.5
Time (sec)
Drif
t (in
)
DesiredObserved
11/3/2008
16
Testing Protocol for UB-NCSCurrent testing protocols focus either on di l t l ti itidisplacement or acceleration sensitive nonstructural components (NSC’s):
Nonstructural systems may be sensitive to bothProposed Protocol
Replicate seismic demands expected on distributed nonstructural systems in multistory buildingsnonstructural systems in multistory buildingsPair of displacement histories for bottom and top levels of UB-NCS that simultaneously match:
(i) target floor acceleration response spectrum (FRS) ii) inter-story drift spectrum
31
Allows testing of systems with multiple attachment points and sensitive to both displacements and accelerations
Testing Protocol for UB-NCS
and sensitive to both displacements and accelerations (e.g. piping systems) Different versions for seismic qualification and fragility assessmentProvides code compatible loading
Considers location along building height h/HI i i d d tibl ith ASCE7Imposes seismic demands compatible with ASCE7 (characterized by spectral parameters SDS and SD1) and FEMA450 Floor spectra
Simple loading patterns given by a set of closed-form equations
32

11/3/2008
17
Testing Protocol ModelInput characterized by hazard consistent x
ζ T ζ Tp ypower spectral density function Continuous beam model and Random Vibration Theory (RVT) considered for estimating:
Absolute accelerations along building heightGeneralized drifts along building height
Parameters for building model:
k
cH
mu (h,t)ss
s
s
GA EIζp, Tp, ζs, Ts
GAHEI
α =
Primary system periods: Tp=0.1-5 secSecondary system periods: Ts=0-5 secDamping for primary and secondary systems: ζp= ζs =5%Parameter controlling building deformation pattern: α=0, 5 and 10
u(x,t)
u (t)g..
h
Testing Protocol Input
Example Probabilistic Seismic Hazard with a probabilityExample Probabilistic Seismic Hazard with a probability of exceedance of 10% in 50 (USGS)
1
1.2
1.4
1.6USGS Hazard Consistent Ground Response Spectrum
ratio
n S
a (g)
USGS DataBest Fit USGS Data
Period T (sec) Spectral Amplitude (g)
0.0 0.63 0.1 1.22 0.2 1.51
USGS Spectral Acceleration Amplitudes for a SH with PE 10%/50yrs
SDS
0 0.5 1 1.5 2 2.50
0.2
0.4
0.6
0.8
Period T (sec)
Spe
ctra
l Acc
eler 0.3 1.34
0.5 0.96 1.0 0.50 2.0 0.22
DS
SD1

11/3/2008
18
Testing Protocol DemandsResulting three dimensional Floor Response Spectra
(FRS) for α=5 as a function of Tp and Ts(FRS) for α 5 as a function of Tp and Ts
01
23
45
0
2
4
60
5
10
15
T s (s)
3-D Floor Response Spectra at Ground Level
Tp (s)
Abs
olut
e A
ccel
erat
ion
(g)
0.2
0.4
0.6
0.8
1
1.2
1.4
01
23
45
0
2
4
60
5
10
15
T s (s)
3-D Floor Response Spectra at 0.2H
Tp (s)
Abs
olut
e A
ccel
erat
ion
(g)
0.5
1
1.5
2
2.5
3
3.5
4
4.5
01
23
45
0
2
4
60
5
10
15
T s (s)
3-D Floor Response Spectra at 0.4H
Tp (s)
Abs
olut
e A
ccel
erat
ion
(g)
1
2
3
4
5
6
7
8
9
01
23
45
0
2
4
60
5
10
15
T s (s)
3-D Floor Response Spectra at Roof Level
Tp (s)
Abs
olut
e A
ccel
erat
ion
(g)
1
2
3
4
5
6
7
8
9
35
01
23
45
0
2
4
60
5
10
15
T s (s)
3-D Floor Response Spectra at 0.6H
Tp (s)
Abs
olut
e A
ccel
erat
ion
(g)
2
4
6
8
10
12
01
23
45
0
2
4
60
5
10
15
T s (s)
3-D Floor Response Spectra at 0.8H
Tp (s)
Abs
olut
e A
ccel
erat
ion
(g)
2
4
6
8
10
12
Testing Protocol Demands84th percentile FRS’s and mean 84th percentile FRS along
building heightbuilding height
0 0.5 1 1.5 2 2.5 3 3.5 4 4.5 50
2
4
6
884th Percentile FRS for Building with αo=0
Period Secondary System Ts (sec)
FRS
(g)
4
6
884th Percentile FRS for Building with αo=5
RS
(g)
3
4
5
6Mean 84th Percentile FRSs along Building Height
RS
(g)
Groundh=0.1Hh=0.2Hh=0.3Hh=0.4Hh=0.5Hh=0.6Hh=0.7Hh=0.8Hh=0 9H
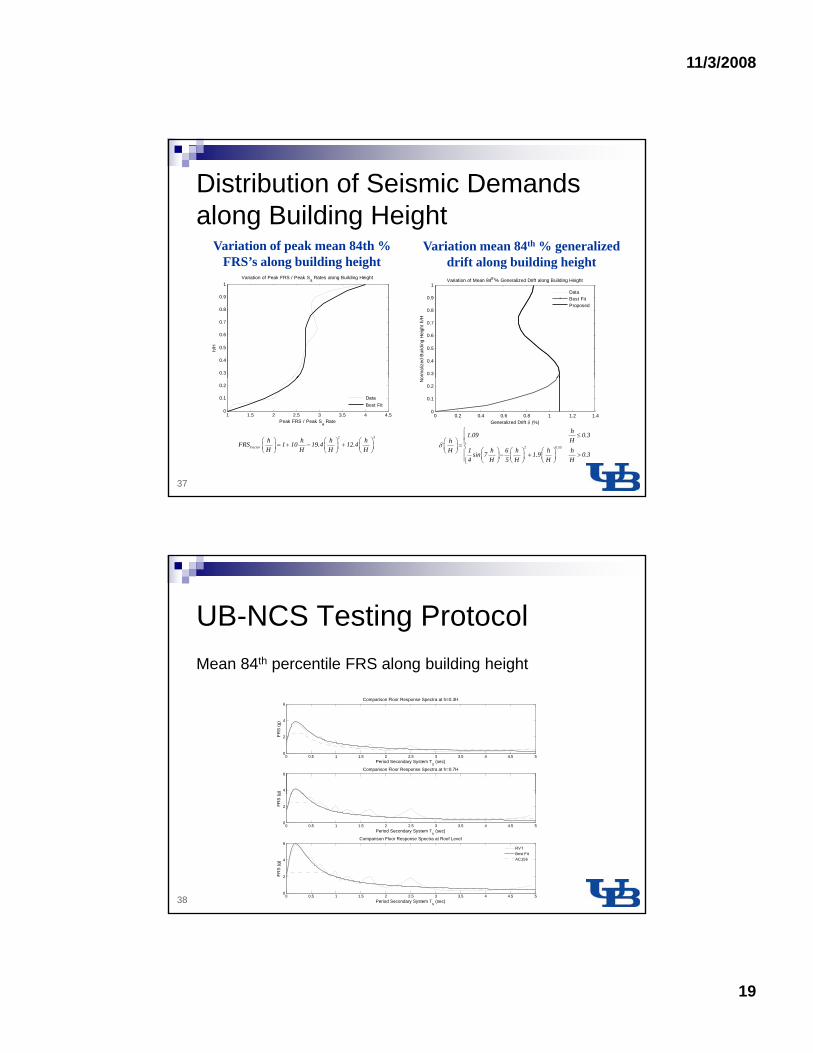
Quotients between peak FRS’ values along building height and peak Sa are calculated
36
0 0.5 1 1.5 2 2.5 3 3.5 4 4.5 50
2
Period Secondary System Ts (sec)
FR
0 0.5 1 1.5 2 2.5 3 3.5 4 4.5 50
2
4
6
884th Percentile FRS for Building with αo=10
Period Secondary System Ts (sec)
FRS
(g)
Ground h=0.1H h=0.2H h=0.3H h=0.4H h=0.5H h=0.6H h=0.7H h=0.8H h=0.9H Roof
0 0.5 1 1.5 2 2.5 3 3.5 4 4.5 50
1
2
Period Secondary System Ts (sec)
F h=0.9HRoof
11/3/2008
19
Distribution of Seismic Demands along Building Height
Variation of peak mean 84th % FRS’ l b ildi h i ht
Variation mean 84th % generalized d ift l b ildi h i htFRS’s along building height
0.3
0.4
0.5
0.6
0.7
0.8
0.9
1Variation of Peak FRS / Peak Sa Rates along Building Height
h/H
0.3
0.4
0.5
0.6
0.7
0.8
0.9
1Variation of Mean 84th% Generalized Drift along Building Height
orm
aliz
ed B
uild
ing
Hei
ght h
/H
DataBest FitProposed
drift along building height
37
1 1.5 2 2.5 3 3.5 4 4.50
0.1
0.2
Peak FRS / Peak Sa Rate
DataBest Fit
2 3
Factorh h h hFRS 1 10 19.4 12.4H H H H
⎛ ⎞ ⎛ ⎞ ⎛ ⎞= + − +⎜ ⎟ ⎜ ⎟ ⎜ ⎟⎝ ⎠ ⎝ ⎠ ⎝ ⎠
0 0.2 0.4 0.6 0.8 1 1.2 1.40
0.1
0.2
Generalized Drift δ (%)N
o
2 0.55
h1.09 0.3Hh
H 1 h 6 h h hsin 7 1.9 0.34 H 5 H H H
δ
⎧ ≤⎪⎪⎛ ⎞ = ⎨⎜ ⎟ ⎛ ⎞ ⎛ ⎞ ⎛ ⎞⎝ ⎠ ⎪ − + >⎜ ⎟ ⎜ ⎟ ⎜ ⎟⎪ ⎝ ⎠ ⎝ ⎠ ⎝ ⎠⎩
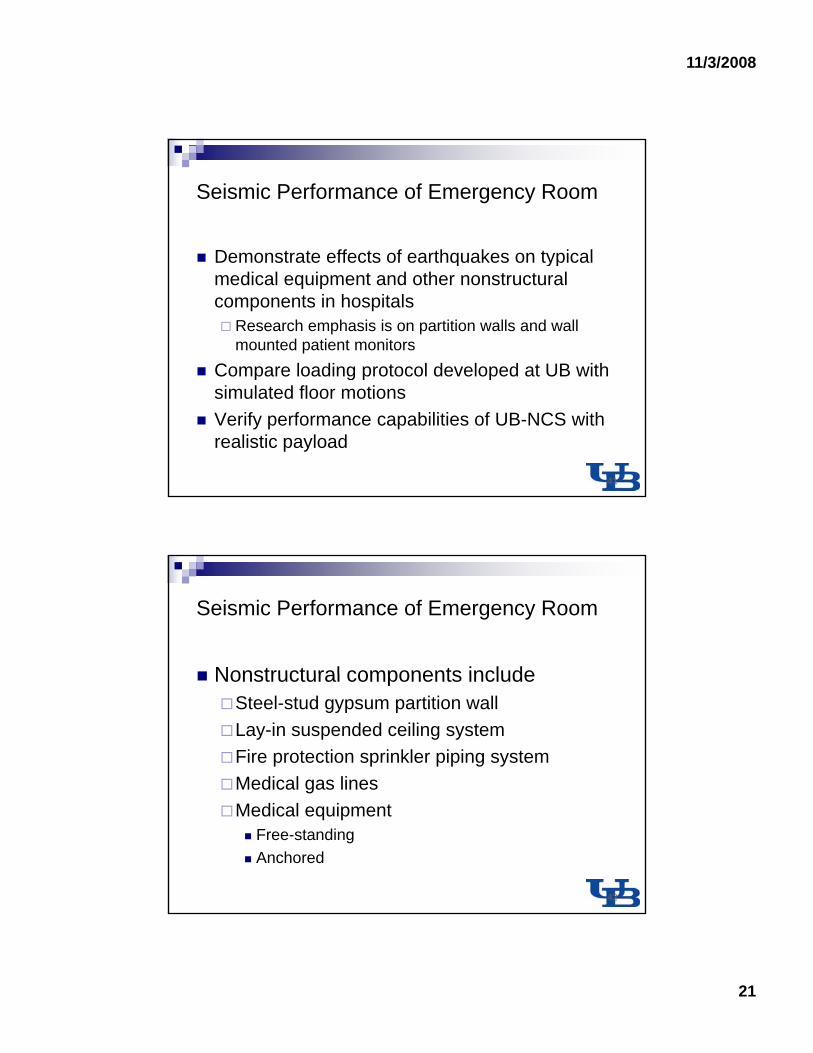
UB-NCS Testing ProtocolMean 84th percentile FRS along building height
0 0.5 1 1.5 2 2.5 3 3.5 4 4.5 50
2
4
6Comparison Floor Response Spectra at h=0.3H
Period Secondary System Ts (sec)
FRS
(g)
4
6Comparison Floor Response Spectra at h=0.7H
g)
38
0 0.5 1 1.5 2 2.5 3 3.5 4 4.5 50
2
Period Secondary System Ts (sec)
FRS
(g
0 0.5 1 1.5 2 2.5 3 3.5 4 4.5 50
2
4
6Comparison Floor Response Spectra at Roof Level
Period Secondary System Ts (sec)
FRS
(g)
RVTBest FitAC156

11/3/2008
20
Testing Protocol for Seismic Qualification
0
20
p (in
)
Bottom Displacement History
• Closed-form equation for bottom level of UB-NCS:
( ) ( )( ) ( )Bottom DS D1 DS D1 Factorh h hx t , ,S ,S t , ,S ,S f t cos t w t FRSH H H
βα ϕ⎛ ⎞ ⎛ ⎞ ⎛ ⎞=⎜ ⎟ ⎜ ⎟ ⎜ ⎟⎝ ⎠ ⎝ ⎠ ⎝ ⎠
0 5 10 15 20 25 30 35 40 45-20
0
Time (sec)
Dis
p
0
1
Protocol Interstory Drift HistoryD
rift (
%)
• Closed-form equation for interstory drift:
39
( )( ) ( )2
dt tD1
D1 NCSSh ht , ,S h e cos t w t
H 0.5g HσΔ δ ϕ−⎛ ⎞−⎜ ⎟
⎝ ⎠⎛ ⎞ ⎛ ⎞=⎜ ⎟ ⎜ ⎟⎝ ⎠ ⎝ ⎠
0 5 10 15 20 25 30 35 40 45
-1
Time (sec)
Top DS D1 Bottom DS D1 D1
h h hx t, ,S ,S x t, ,S ,S t, ,SH H H
Δ⎛ ⎞ ⎛ ⎞ ⎛ ⎞= +⎜ ⎟ ⎜ ⎟ ⎜ ⎟⎝ ⎠ ⎝ ⎠ ⎝ ⎠
• Closed-form equation for top level of UB-NCS:
Testing Protocol for Seismic QualificationExample 1: SDS=1.283g, SD1=0.461g and h/H=1 (Northridge, Soil Class B)
0
20
sp (i
n)
Bottom Displacement History
1
1.5Interstory Drift History
4.5
5Comparison Floor Response Spectra
Target FEMA450 FRSBottom levelTop level
0 5 10 15 20 25 30 35 40 45-20
Time (sec)
Dis
0 5 10 15 20 25 30 35 40 45-50
0
50
Time (sec)
Velo
c (in
/sec
)
Bottom Velocity History
0 5 10 15 20 25 30 35 40 45-1
0
1
Time (sec)
Acc
(g)
Bottom Acceleration History
20Top Displacement History
0 5 10 15 20 25 30 35 40 45 50-1.5
-1
-0.5
0
0.5
Time (sec)
Inte
rsto
ry D
rift (
in)
0 0.5 1 1.5 2 2.5 3 3.5 4 4.5 50
0.5
1
1.5
2
2.5
3
3.5
4
Period Secondary System (sec)
FRS
(g)
pMean
40
50
60Number of Cycles Imposed on Displacement Sensitive Components
Protocol
10
20
30
40
50
No C
ycle
s N
50
Number of Cycles with A>0.5AMax Induced on Acceleration Sensitive Components
40
0 5 10 15 20 25 30 35 40 45-20
0
Time (sec)
Dis
p (in
)
0 5 10 15 20 25 30 35 40 45-50
0
50
Time (sec)
Velo
c (in
/sec
)
Top Velocity History
0 5 10 15 20 25 30 35 40 45-1
0
1
Time (sec)
Acc
(g)
Top Acceleration History
0 10 20 30 40 50 60 70 80 90 1000
10
20
30
40
λ
No o
f Cyc
les
Nλ
Mean FloorMotions
84th% FloorMotions
0 0.5 1 1.5 2 2.5 3 3.5 4 4.5 50
10
Frequency Secondary System (Hz)
N
0 0.5 1 1.5 2 2.5 3 3.5 4 4.5 50
50
100
150
Frequency Secondary System (Hz)
No C
ycle
s N
10
Number of Cycles with A>0.1AMax Induced on Acceleration Sensitive Components
Mean Floor Motions
84th% Floor MotionsProtocol
Peak Displacements Peak Interstory Drift Peak Velocities Peak Accelerations DMax Bot
(in) DMax Top
(in) ΔMax (in)
δMax (%)
VMax Bot (in/s)
VMax Top (in/s)
AMax Bot (g)
AMax Top (g)
18.8 20.0 1.21 0.79 26.6 28.0 0.55 0.58
11/3/2008
21
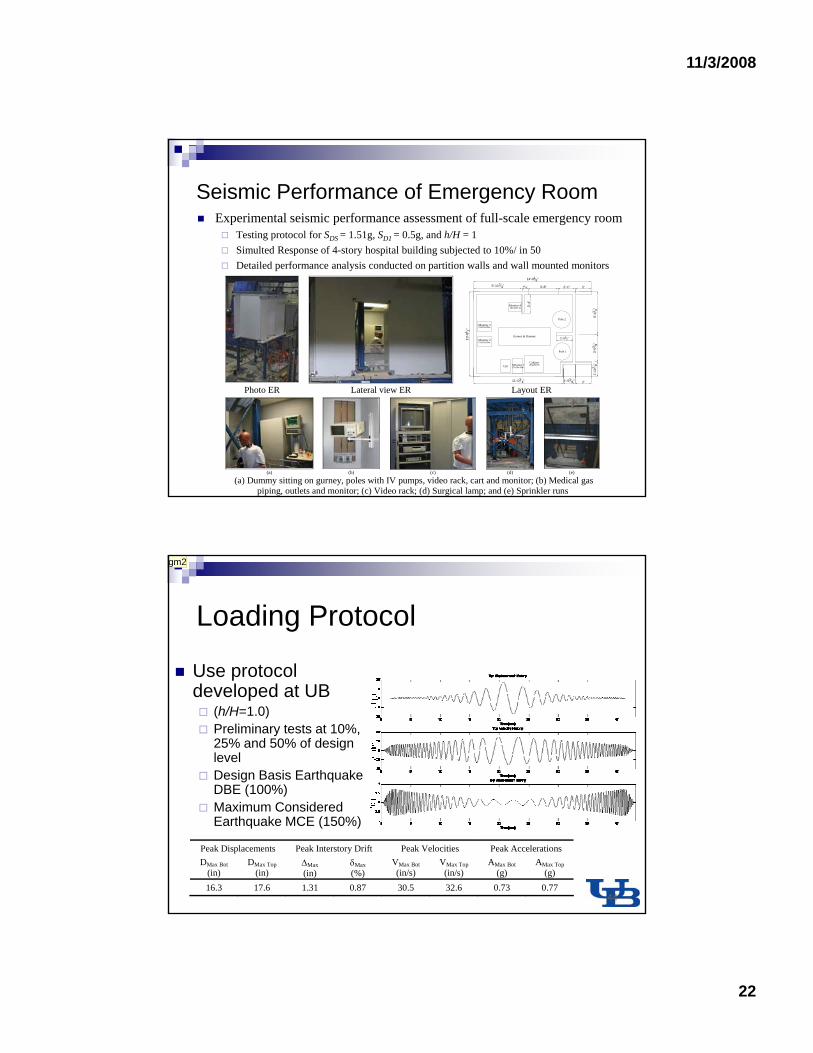
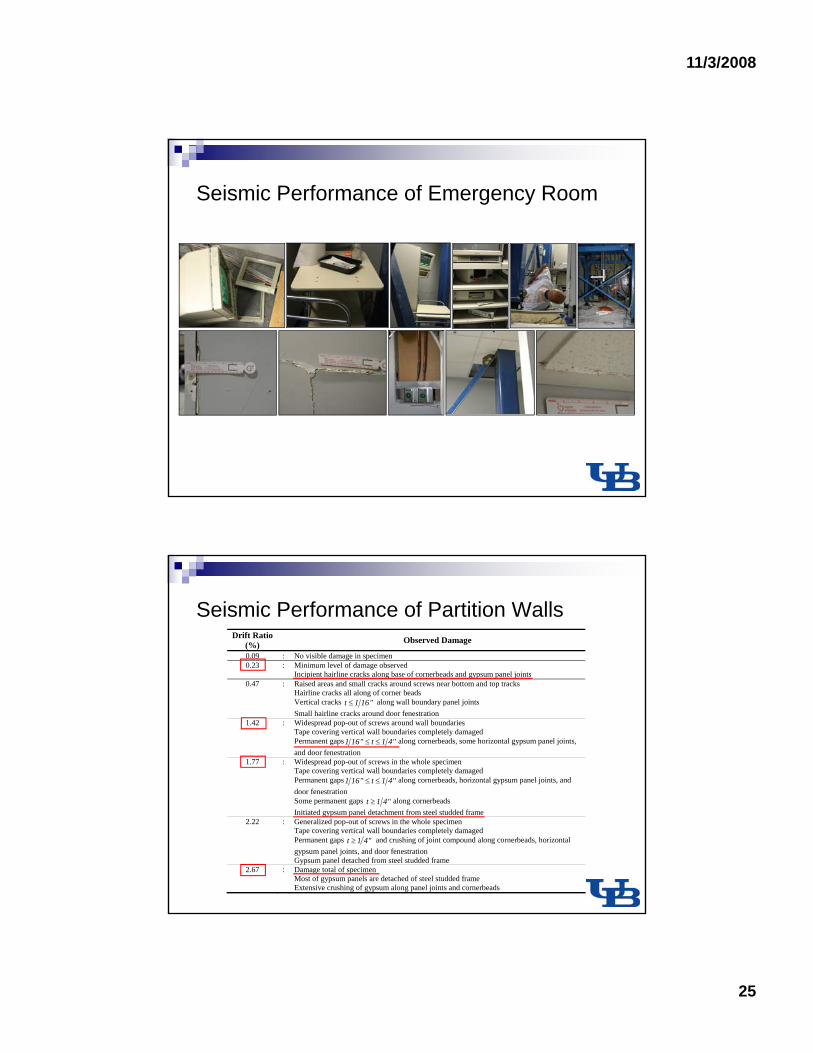
Seismic Performance of Emergency Room
Demonstrate effects of earthquakes on typicalDemonstrate effects of earthquakes on typical medical equipment and other nonstructural components in hospitals
Research emphasis is on partition walls and wall mounted patient monitors
Compare loading protocol developed at UB with p g p psimulated floor motionsVerify performance capabilities of UB-NCS with realistic payload
41
Nonstructural components include
Seismic Performance of Emergency Room
Nonstructural components includeSteel-stud gypsum partition wallLay-in suspended ceiling systemFire protection sprinkler piping systemMedical gas linesMedical equipment
Free-standingAnchored
42
11/3/2008
22
Experimental seismic performance assessment of full-scale emergency roomTesting protocol for SDS = 1.51g, SD1 = 0.5g, and h/H = 1Simulted Response of 4-story hospital building subjected to 10%/ in 50
Seismic Performance of Emergency Room
Detailed performance analysis conducted on partition walls and wall mounted monitors
Monitor 1Cabinet
Gurney & Dummy
Monitor 4
Pole 1
Monitor 315x18x18in
15x18x18in
13x16x7 in
26x28x76
Pole 2
10'-8
1 2"
1'-1
078"
3'-5
38"
5'-4
1 4"
5'-1134" 95
16" 3'-8" 2'-1" 2'
14'-618"
Monitor 215x18x18in
2'-4
"
2'-012"
Cart
43
(a) (b) (c) (d) (e)
(a) Dummy sitting on gurney, poles with IV pumps, video rack, cart and monitor; (b) Medical gas piping, outlets and monitor; (c) Video rack; (d) Surgical lamp; and (e) Sprinkler runs
1'-538" 2'11'-03
4" Photo ER Lateral view ER Layout ER
Loading Protocol
Use protocolUse protocol developed at UB
(h/H=1.0)Preliminary tests at 10%, 25% and 50% of design levelDesign Basis Earthquake DBE (100%)( %)Maximum Considered Earthquake MCE (150%)
44
Peak Displacements Peak Interstory Drift Peak Velocities Peak Accelerations DMax Bot
(in) DMax Top
(in) ΔMax (in)
δMax (%)
VMax Bot (in/s)
VMax Top (in/s)
AMax Bot (g)
AMax Top (g)
16.3 17.6 1.31 0.87 30.5 32.6 0.73 0.77
gm2

Slide 44
gm2 Inseert table by Rodriog on peak driftsGilberto Mosqueda, 10/11/2007

11/3/2008
23
Seismic Performance of Emergency RoomProtocol loading histories – Design Level
Protocol loading histories – Design Level
Seismic Performance of Emergency Room
11/3/2008
24
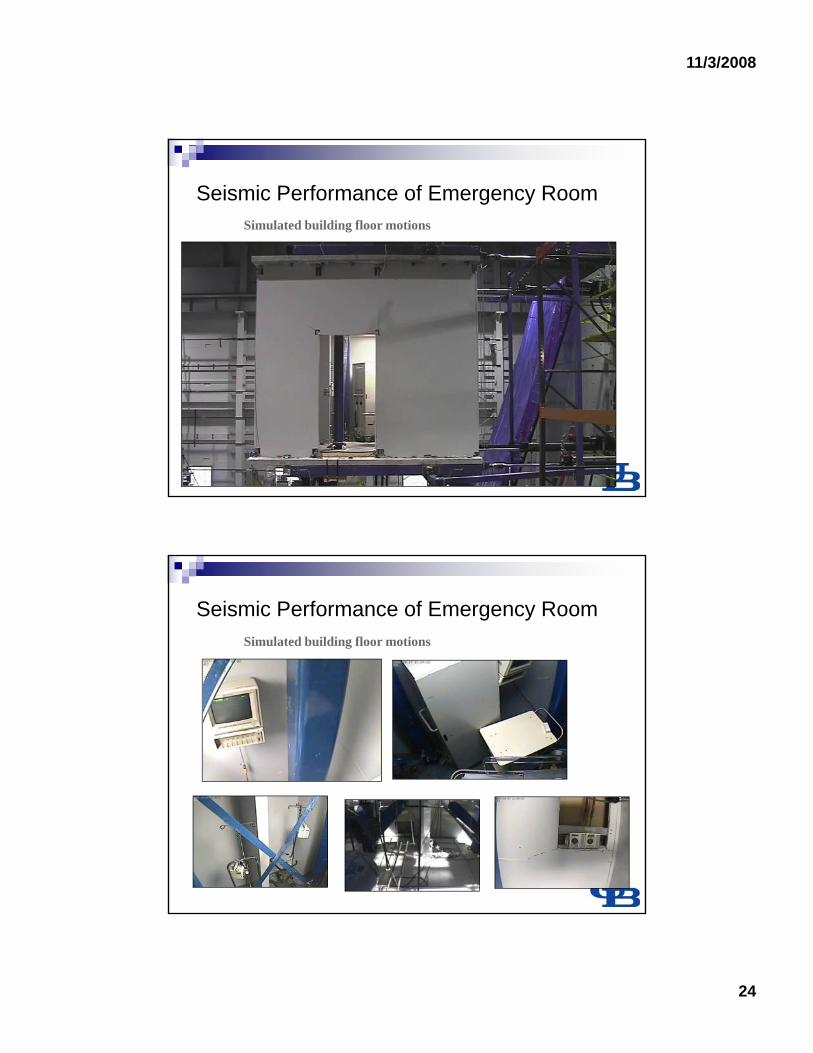
Seismic Performance of Emergency RoomSimulated building floor motions
Simulated building floor motions
Seismic Performance of Emergency Room
11/3/2008
25
Seismic Performance of Emergency Room
Seismic Performance of Partition WallsDrift Ratio
(%) Observed Damage
0.09 : No visible damage in specimen 0.23 : Minimum level of damage observed
Incipient hairline cracks along base of cornerbeads and gypsum panel jointsIncipient hairline cracks along base of cornerbeads and gypsum panel joints0.47 : Raised areas and small cracks around screws near bottom and top tracks
Hairline cracks all along of corner beads Vertical cracks t 1 16"≤ along wall boundary panel joints Small hairline cracks around door fenestration
1.42 : Widespread pop-out of screws around wall boundaries Tape covering vertical wall boundaries completely damaged Permanent gaps1 16" t 1 4"≤ ≤ along cornerbeads, some horizontal gypsum panel joints, and door fenestration
1.77 : Widespread pop-out of screws in the whole specimen Tape covering vertical wall boundaries completely damaged Permanent gaps1 16" t 1 4"≤ ≤ along cornerbeads, horizontal gypsum panel joints, and door fenestrationSome permanent gaps t 1 4"≥ along cornerbeads Initiated gypsum panel detachment from steel studded frame
2.22 : Generalized pop-out of screws in the whole specimen Tape covering vertical wall boundaries completely damaged Permanent gaps t 1 4"≥ and crushing of joint compound along cornerbeads, horizontal gypsum panel joints, and door fenestration Gypsum panel detached from steel studded frame
2.67 : Damage total of specimen Most of gypsum panels are detached of steel studded frame Extensive crushing of gypsum along panel joints and cornerbeads

11/3/2008
26
Seismic Performance of Partition Walls and Fragility of Patient Monitors
Best Fit Parameter for Monitor Base Acceleration (g) Damage Measure Damage State
Associated θ β
-10
0
10
20
30Ensemble Histeresis Loops Emergency Room
Forc
e (K
ips)
10% Protocol25% Protocol50% Protocol100% Protocol150% Protocol200% Protocol (QS)
0 4
0.5
0.6
0.7
0.8
0.9
1Fragility Curve for Wall-Mounted patient Monitor
ty o
f Col
laps
e (%
)
DataBest Fit
Peak acceleration at base of monitor
Monitor’s supporting
device failure 1.35 0.20
-3 -2 -1 0 1 2 3-30
-20
Interstory Drift (%)
200% Protocol (QS)250% Protocol (QS)300% Protocol (QS)350% Protocol (QS)
0 0.5 1 1.5 2 2.5 30
0.1
0.2
0.3
0.4
Horizontal Acceleration at Equipment Base (g)
Pro
babi
li
ConclusionsA Nonstructural Component Simulator (UB-NCS) has been commissioned to subject nonstructural components to realistic full-scale building floor motionsgThe UB-NCS provides improved experimental capabilities for seismic qualification and fragility assessment of nonstructural components and building contentsNonstructural systems with multiple attachments sensitive to acceleration and/or drifts can be rigorously evaluated under realistic loading conditionsThe experimental program verified the capabilities of the UB-NCS to reproduce full scale floor motions and loading protocols imposingreproduce full-scale floor motions and loading protocols imposing similar demands. The experimental methods presented can be used for the seismic qualification or fragility assessment of nonstructural components
11/3/2008
27
Thank You!
Questions?


![FOR PERFORMANCE BASED SEISMIC DESIGNAction Plan for Performance Based Seismic Design some nonstructural damage, [and] a major level of earthquake.. without collapse."3 Deaths in recent](https://img.dokumen.tips/doc/110x75/5e9694e88d813321cf54f24a/for-performance-based-seismic-design-action-plan-for-performance-based-seismic-design.jpg)