Embed Size (px)
Citation preview

March–Apr i l 2015 | PCI Journal80
Accelerated bridge construction incorporates in-novative techniques and materials to efficiently reduce construction time and traffic disruption. It
also improves work-zone safety for workers and com-muters. Prefabrication of bridge structural components is a highly effective technique and is one of the accelerated bridge construction methods promoted by the Federal Highway Administration under the category of prefabricat-ed bridge elements and systems. Several bridges have been built or rehabilitated using accelerated bridge construc-tion methods. Examples in Utah include the Interstate 15 (I-15) Core Provo Center Street interchange, the Riverdale Road over Interstate 84 (I-84) bridge, and the I-15 South Layton interchange. Precast concrete deck panels, sub-structures, and superstructures have been frequently used in accelerated bridge construction. Connections between such reinforced precast concrete elements are among the most critical components of the structure. Researchers are investigating the adequacy of various connection configu-rations, especially in moderate to high seismic regions. These connections not only have to conform to acceler-ated bridge construction standards in terms of construc-tion delivery time but must also resist earthquake-induced deformations and stresses. Lateral load capacity, displace-ment ductility, and reparability are three significant criteria for any connection considered in seismic regions. In this paper, a column–to–cap beam joint is investigated using
■ Although grouted splice sleeve connectors facilitate the con-struction of precast concrete bridges and accelerate construc-tion, seismic bridge design codes prohibit their use in column plastic hinges.
■ Half-scale bridge column–to–cap beam assemblies were tested to investigate their response under cyclic quasi-static load.
■ Satisfactory drift capacity and displacement ductility were achieved when the grouted splice sleeve connectors were inside the cap beam joint.
Seismic evaluation of grouted splice sleeve connections for reinforced precast concrete column–to–cap beam joints in accelerated bridge construction
M. J. Ameli, Joel E. Parks, Dylan N. Brown, and Chris P. Pantelides
81PCI Journal | March–Apr i l 2015
connecting precast concrete components is spliced by a mechanical coupler located within one of the components. The response of such connections to cyclic loading was studied to investigate their performance in high seismic regions.7,8
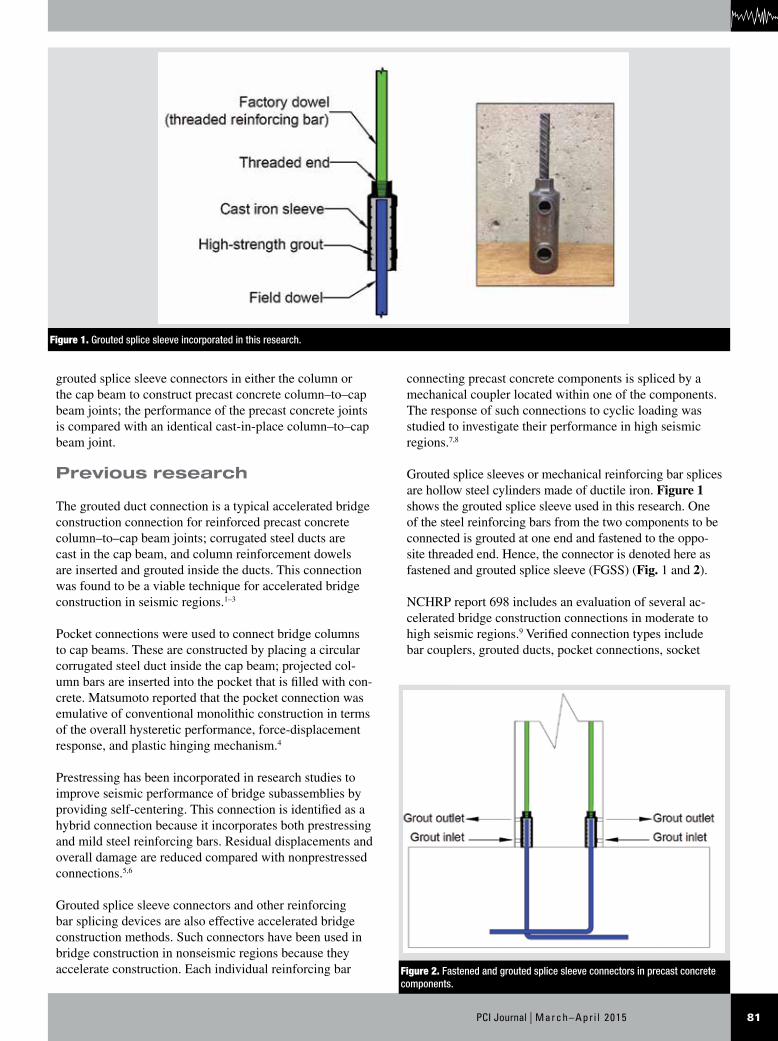
Grouted splice sleeves or mechanical reinforcing bar splices are hollow steel cylinders made of ductile iron. Figure 1 shows the grouted splice sleeve used in this research. One of the steel reinforcing bars from the two components to be connected is grouted at one end and fastened to the oppo-site threaded end. Hence, the connector is denoted here as fastened and grouted splice sleeve (FGSS) (Fig. 1 and 2).
NCHRP report 698 includes an evaluation of several ac-celerated bridge construction connections in moderate to high seismic regions.9 Verified connection types include bar couplers, grouted ducts, pocket connections, socket
grouted splice sleeve connectors in either the column or the cap beam to construct precast concrete column–to–cap beam joints; the performance of the precast concrete joints is compared with an identical cast-in-place column–to–cap beam joint.
Previous research
The grouted duct connection is a typical accelerated bridge construction connection for reinforced precast concrete column–to–cap beam joints; corrugated steel ducts are cast in the cap beam, and column reinforcement dowels are inserted and grouted inside the ducts. This connection was found to be a viable technique for accelerated bridge construction in seismic regions.1–3
Pocket connections were used to connect bridge columns to cap beams. These are constructed by placing a circular corrugated steel duct inside the cap beam; projected col-umn bars are inserted into the pocket that is filled with con-crete. Matsumoto reported that the pocket connection was emulative of conventional monolithic construction in terms of the overall hysteretic performance, force-displacement response, and plastic hinging mechanism.4
Prestressing has been incorporated in research studies to improve seismic performance of bridge subassemblies by providing self-centering. This connection is identified as a hybrid connection because it incorporates both prestressing and mild steel reinforcing bars. Residual displacements and overall damage are reduced compared with nonprestressed connections.5,6
Grouted splice sleeve connectors and other reinforcing bar splicing devices are also effective accelerated bridge construction methods. Such connectors have been used in bridge construction in nonseismic regions because they accelerate construction. Each individual reinforcing bar Figure 2. Fastened and grouted splice sleeve connectors in precast concrete
components.
Figure 1. Grouted splice sleeve incorporated in this research.

March–Apr i l 2015 | PCI Journal82
concrete construction. Table 1 shows the test matrix, and Fig. 3 demonstrates the test configuration alternatives. All specimens were assembled and tested in an inverted posi-tion compared with actual construction for ease of con-struction and testing. A second objective of the study was to investigate the influence of the location of the fastened and grouted splice sleeve connectors within the precast concrete specimens. Specimen FGSS-1 was composed of a precast concrete column and cap beam with the connec-tors in the column end, whereas specimen FGSS-2 was composed of a precast concrete column and cap beam with the connectors in the cap beam. Specimen CIP was the cast-in-place concrete alternative, or control specimen, a monolithic construction without any connectors or bar lap splices.
Monotonic tensile tests on individual connectors
A series of tensile tests was conducted on six individual fastened and grouted splice sleeve connectors to ascertain essential information on the performance of the connectors under monotonic tensile loads. Results from these air tests were used to assess the strength capacity and failure mode of the fastened and grouted splice sleeve connectors, in ad-dition to providing an insight into the overall performance, specifically the stress transfer within the connector.
Two no. 8 (25M) reinforcing bars were connected using an appropriately sized fastened and grouted splice sleeve connector for each air test specimen. The reinforcing bars had a nominal yield strength of 60 ksi (400 MPa) and an
connections, hybrid connections, integral connections, and emerging technologies such as shape memory alloys. These connections were either used in actual projects or were being developed in research studies. One of the outcomes of this study was the prioritization of additional research considered essential for each connection type, to fully understand its behavior under seismic actions. For the bar coupler, which is in the general category of mechanical couplers that includes the grouted splice sleeve connectors, NCHRP report 698 recommended further experimental studies to ascertain strength properties of the grouted splice sleeve along with the displacement ductility of components joined with such connectors.
Experimental studies have been conducted on various types of mechanical couplers comprising only two connecting bars, cast iron sleeves, and high-strength grout.10–12 Such experiments, referred to as air tests, were conducted to study the strength, reinforcing bar slip, bond characteris-tics, and fatigue life of the mechanical couplers. Jansson reported a series of air tests on fastened and grouted splice sleeve connectors for no. 6 (19M) and no. 11 (36M) steel bars. Test results showed acceptable performance in terms of reinforcing bar slip and fatigue life. Tensile test results indicated that all no. 6 assemblies failed due to fracture of the reinforcing bar in the threaded region, thereby reaching the nominal tensile strength of the bars.
Cyclic tests were conducted on large-scale precast concrete specimens joined by means of various grouted splice sleeve connectors.12–17 The presence of grouted splice sleeve connectors in the plastic hinge region did not considerably change the lateral force capacity of the assembly. However, the displacement capacity was found to be smaller than that of monolithic specimens. Damage progression and the plastic hinge mechanism were also different from those of monolithic specimens.
This paper presents experimental results of three quasi-static cyclic tests of half-scale column–to–cap beam speci-mens, two of which used fastened and grouted splice sleeve connectors, to investigate their performance compared with the third specimen, which was built using cast-in-place
Table 1. Test matrix for column–to–cap beam joints
Test identification
SpecimenConnector
typeConnector location
Other
1 FGSS-1 LK-8 Column n/a
2 FGSS-2 LK-8 Cap beam n/a
3 CIP n/a n/a Cast-in-place
Note: n/a = not applicable.
Figure 3. Configuration of test alternatives.

83PCI Journal | March–Apr i l 2015
Design and fabrication of specimens
Specimen design
The specimens were designed and detailed to simulate pro-totype bridges constructed in Utah, following the American Association of State Highway and Transportation Officials’ AASHTO LRFD Bridge Design Specifications18 and the AASHTO Guide Specifications for LRFD Seismic Bridge De-sign19 in accordance with capacity-based design principles. A circular configuration of column longitudinal bars and an octagonal column cross section were adopted because this is the method of choice in Utah. The aforementioned design codes in addition to the Caltrans Seismic Design Criteria (SDC)20 prohibit the splicing of reinforcing bar, including mechanical anchorage devices, in the plastic hinge region of ductile members for bridges located in moderate to high seis-mic regions. In AASHTO LRFD seismic bridge design, this would apply to seismic design categories C and D. Thus the preliminary design and detailing were developed for speci-mens without fastened and grouted splice sleeve connectors (the cast-in-place concrete specimen). The design was then adjusted to accommodate the fastened and grouted splice sleeve connectors inside the precast concrete specimens, and essential modifications were considered accordingly.
actual yield strength of 76 ksi (525 MPa). The test-day compressive strength of the high-strength grout was 9.4 ksi (65 MPa). This grout was used to confine the reinforcing bar inside the connector.
Monotonic tensile loading was applied until the bottom reinforcing bar pulled out from the connector due to bond failure. Strains were monitored on the reinforcing bar portion outside the connector, the reinforcing bar portion inside the connector, and on the connector itself. The aver-age strength achieved by the air test specimens was 1.44 ± 0.0488 (standard deviation, where n = 6) times the nominal yield strength of the reinforcing bar. The strain gauge located 5 in. (130 mm) from the end of the rein-forcing bar grouted inside the connector showed that the reinforcing bar yielded at that section.
The gradual pullout failure was initiated by a grout cone failure at the opening end of the connector (Fig. 4). A subsequent crushing of the grout in front of the reinforc-ing bar deformations formed a shear failure surface with a diameter slightly larger than that of the reinforcing bar, and therefore the reinforcing bar pulled out from the connec-tor. Table 2 includes the results of the air tests. No sign of damage was noted on the threaded reinforcing bar, which was well developed beyond the yield point.
Figure 4. Pullout failure of air test specimen.
Failure of air test specimen in testing apparatus Grout cone failure and reinforcing bar pullout

March–Apr i l 2015 | PCI Journal84
The specimens were half-scale models of common pro-totype highway bridges, specifically the Riverdale Road bridge over I-84 in Utah. The column and cap beam dimen-sions and main longitudinal bars and their configuration were acquired by considering 50% of the actual properties. The column height for all specimens was 8 ft 6 in. (2.6 m) with a 21 in. (530 mm) octagonal cross section to facilitate casting of the concrete. The top 18 in. (460 mm) of the col-umn was changed to a 21 in. (530 mm) square for testing purposes. Six no. 8 (25M) bars in a circular arrangement and a no. 4 (13M) spiral with a pitch of 21⁄2 in. (64 mm) made up the column reinforcement. The longitudinal and volumetric transverse reinforcement ratios were 1.3% and 1.9%, respectively.
A preliminary nonlinear static analysis and a series of sec-tional analyses were conducted to estimate the maximum lateral load and displacement of the control specimen CIP and to design the cap beam accordingly. Probable material properties for steel and concrete were used in addition to
beam-column elements to perform the preliminary analy-sis. Detailed nonlinear analyses, including the effect of the connectors in the system, are anticipated to be complete by the end of 2015. The cap beam was designed as a 9 ft long × 2 ft wide × 2 ft deep (2.8 m × 0.6 m × 0.6 m) precast concrete member with no. 8 (25M) longitudinal bars enclosed by no. 4 (13M) double hoops. The cap beam was designed to remain linearly elastic and not undergo plastic deformation. The design inhibits shear failure from occurring in the column by using a shear span-to-depth ratio of more than 5.0 (corresponding to slender columns) in addition to closely spaced adequate shear reinforcement. The desirable column failure mode was set to be either flexural or splice failure.
Figure 5 shows the steel reinforcement without the fas-tened and grouted splice sleeve connectors. This could be considered the monolithic joint design for cast-in-place concrete construction. The design details for each speci-men are summarized in the next section. Dowel bar tails
Table 2. Tension test results for air test specimens
Air test identification Maximum load, kip Maximum bar stress, ksiMaximum bar stress
normalized to fyObserved failure mode
Air test-1 69.7 88.2 1.47 Reinforcing bar pullout
Air test-2 71.5 90.5 1.51 Reinforcing bar pullout
Air test-3 66.4 84.1 1.40 Reinforcing bar pullout
Air test-4 68.0 86.1 1.43 Reinforcing bar pullout
Air test-5 64.6 81.8 1.36 Reinforcing bar pullout
Air test-6 69.1 87.5 1.46 Reinforcing bar pullout
Note: fy = nominal yield strength of reinforcing bars. 1 kip = 4.448N; 1 ksi = 6.895 MPa.
Figure 5. General design and detailing of joint region for monolithic specimen. Note: no. 4 = 13M; no. 8 = 25M; 1 in. = 25.4 mm; 1 ft = 0.305 m.

85PCI Journal | March–Apr i l 2015
were bent inward to achieve a better performance under lateral cyclic loads as required for seismic design category D in accordance with AASHTO LRFD seismic bridge design.
Fabrication of test specimens
The three specimens had identical geometric properties and similar details in the plastic hinge region. Figure 6 shows the details of specimen FGSS-1 in addition to the column and cap beam reinforcing bar cages. Specimen FGSS-1 comprised a precast concrete column with the fastened and grouted splice sleeve connectors embedded in the column
end and a precast concrete cap beam with dowel bars projecting 7 in. (180 mm). In the first step of the construc-tion phase, column longitudinal bars were fastened to the threaded end of the fastened and grouted splice sleeve con-nectors. All bars were initially hand tightened to the con-nectors before being fully tightened using a pipe wrench. A form mounting fixture was used to fasten the grouted splice sleeve connectors to a wooden template arranging the column bars in the desired configuration. The spiral over the fastened and grouted splice sleeve connector region had a 15⁄8 in. (42 mm) larger diameter than the spiral for the rest of the column due to the larger diameter of the fastened and grouted splice sleeve connector compared with reinforcing
Figure 6. Specimen FGSS-1 construction details. Note: no. 4 = 13M; no. 8 = 25M; 1 in. = 25.4 mm; 1 ft = 0.305 m.
Specimen FGSS-1 details
Specimen FGSS-1 reinforcing bar cages

March–Apr i l 2015 | PCI Journal86
was changed from the column end to inside the cap beam. Such a modification would make the specimen conform to the bridge design code because the fastened and grouted splice sleeve connectors would not be located inside the column plastic hinge region.19,20 A second reason for examining this alternative was to investigate the reduced
bar. This resulted in an overlapping spiral region right above the fastened and grouted splice sleeve connectors.
Figure 7 shows the details of specimen FGSS-2 along with the column and cap beam reinforcing bar cages. The loca-tion of the fastened and grouted splice sleeve connectors
Figure 7. Specimen FGSS-2 construction details. Note: no. 4 = 13M; no. 8 = 25M; 1 in. = 25.4 mm; 1 ft = 0.305 m.
Specimen FGSS-2 details
Specimen FGSS-2 reinforcing bar cages
87PCI Journal | March–Apr i l 2015
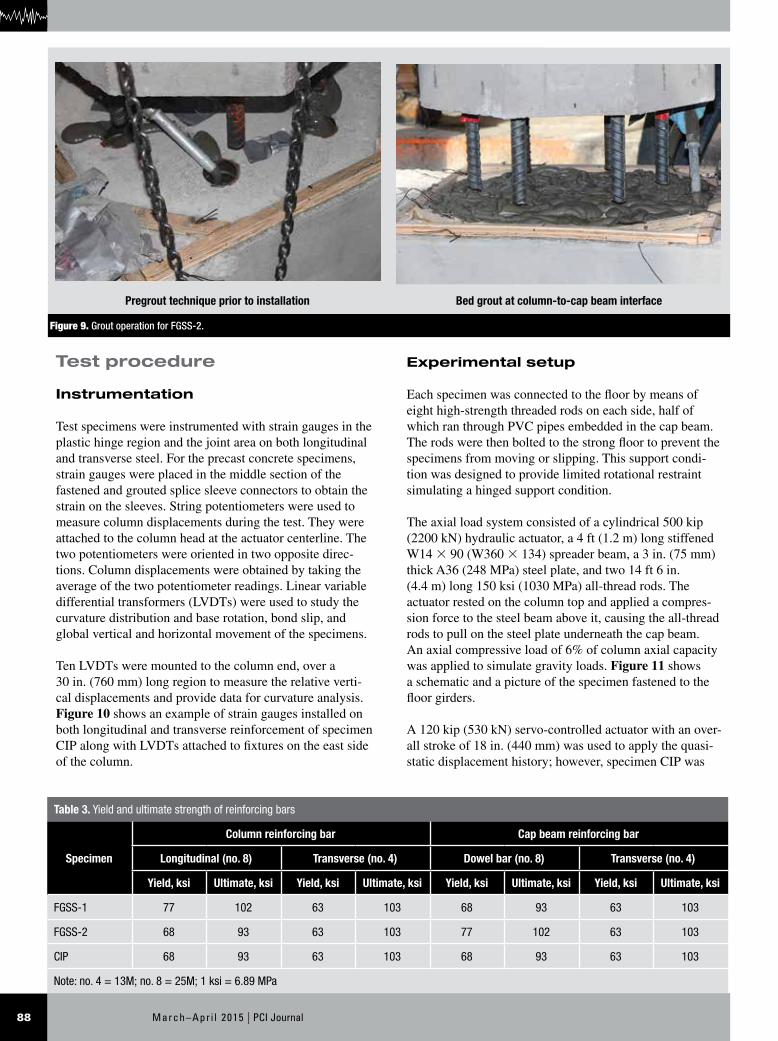
(2.6 L) of water was sufficient to fill all six fastened and grouted splice sleeve connectors and cast the 1⁄4 in. (6 mm) bed grout. An electric mortar mixer with a jiffler paddle attachment was used to continuously mix the grout with water for five minutes. The flow test conducted after mix-ing indicated that the grout had a good consistency with an acceptable spread diameter of 5 in. (130 mm) for specimen FGSS-1. The high-strength grout was used to complete the installation. A postgrout technique was implemented for specimen FGSS-1 in which the grout was pumped into the bottom nozzle of the connector. The grout traveled up against gravity and filled the inside space of the connec-tor using a hand pump. Both inlet and outlet ports were plugged when the connector was completely filled with grout. A pregrout technique was conducted for specimen FGSS-2 to facilitate installation. Both inlet and outlet ports of the six connectors were sealed during construction of the cap beam reinforcing bar cage. During erection of specimen FGSS-2 and before lowering and positioning the column, the high-strength grout was pumped into the wide end opening (Fig. 9). The flow test showed an acceptable grout consistency with a spread diameter of 5.25 in. (133 mm) for specimen FGSS-2.
Tension tests of reinforcing bars were conducted along with compression tests on concrete cylinders and grout cubes for each specimen.21–23 Table 3 presents the results of tension tests on reinforcing bars. The column bars for specimen FGSS-1 and the cap beam dowel bars for speci-men FGSS-2 had different material properties than the rest of the steel bars because these were obtained from the manufacturer as threaded bars. Table 4 contains the com-pression test results for the concrete and grout reported for both the 28th day of curing and the day of the specific test.
disruption to the column plastic hinge region compared with specimen FGSS-1. Such a configuration was suc-cessfully implemented in the Provo to Salt Lake Frontrun-ner rail bridge construction using an alternative grouted splice sleeve connector in which both connecting bars were grouted inside the splice sleeve. The precast concrete column reinforcing bar cage was built first for speci-men FGSS-2. Dowel bars measuring 7 in. (180 mm) long protruded from the column end. The joint core was built and centered in the cap beam. Threaded hooked bars were previously fastened onto the fastened and grouted splice sleeve connectors by means of a pipe wrench and arranged in a circular fashion using a template. Horizontal joint reinforcement consisting of a closely spaced spiral was tied to both the vertical fastened bars and the fastened and grouted splice sleeve connectors. The tails of the fastened bars were oriented into the joint core and had a length of 2 ft 4 in. (0.7 m).
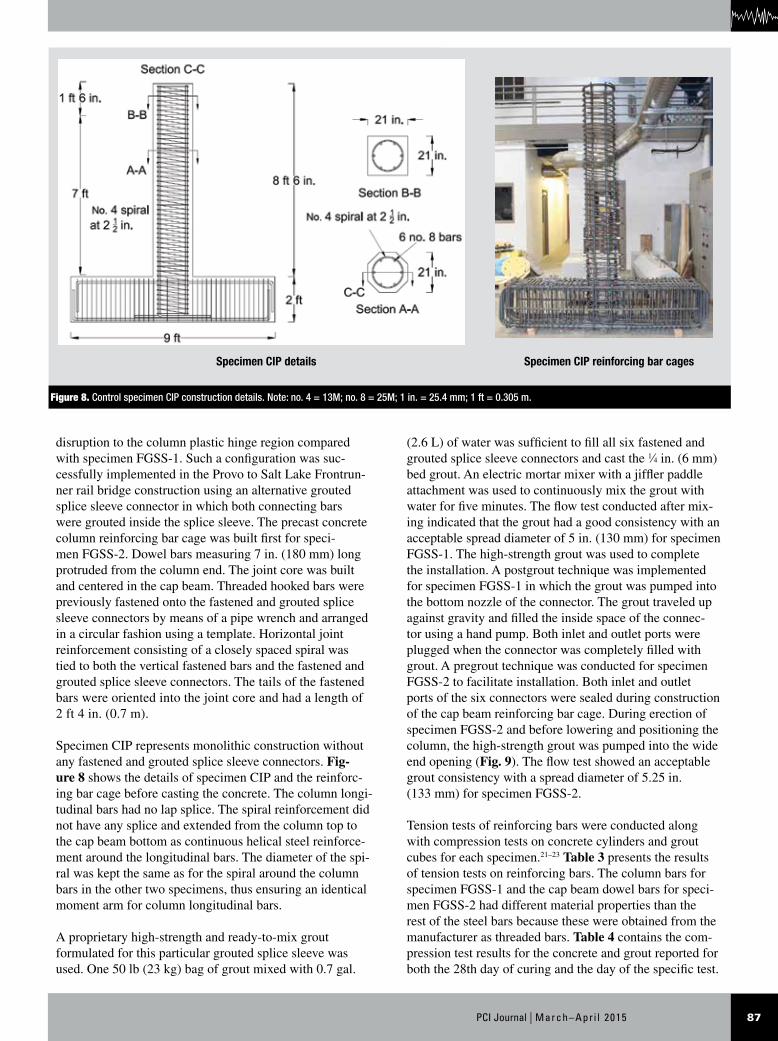
Specimen CIP represents monolithic construction without any fastened and grouted splice sleeve connectors. Fig-ure 8 shows the details of specimen CIP and the reinforc-ing bar cage before casting the concrete. The column longi-tudinal bars had no lap splice. The spiral reinforcement did not have any splice and extended from the column top to the cap beam bottom as continuous helical steel reinforce-ment around the longitudinal bars. The diameter of the spi-ral was kept the same as for the spiral around the column bars in the other two specimens, thus ensuring an identical moment arm for column longitudinal bars.
A proprietary high-strength and ready-to-mix grout formulated for this particular grouted splice sleeve was used. One 50 lb (23 kg) bag of grout mixed with 0.7 gal.
Figure 8. Control specimen CIP construction details. Note: no. 4 = 13M; no. 8 = 25M; 1 in. = 25.4 mm; 1 ft = 0.305 m.
Specimen CIP details Specimen CIP reinforcing bar cages
March–Apr i l 2015 | PCI Journal88
Experimental setup
Each specimen was connected to the floor by means of eight high-strength threaded rods on each side, half of which ran through PVC pipes embedded in the cap beam. The rods were then bolted to the strong floor to prevent the specimens from moving or slipping. This support condi-tion was designed to provide limited rotational restraint simulating a hinged support condition.
The axial load system consisted of a cylindrical 500 kip (2200 kN) hydraulic actuator, a 4 ft (1.2 m) long stiffened W14 × 90 (W360 × 134) spreader beam, a 3 in. (75 mm) thick A36 (248 MPa) steel plate, and two 14 ft 6 in. (4.4 m) long 150 ksi (1030 MPa) all-thread rods. The actuator rested on the column top and applied a compres-sion force to the steel beam above it, causing the all-thread rods to pull on the steel plate underneath the cap beam. An axial compressive load of 6% of column axial capacity was applied to simulate gravity loads. Figure 11 shows a schematic and a picture of the specimen fastened to the floor girders.
A 120 kip (530 kN) servo-controlled actuator with an over-all stroke of 18 in. (440 mm) was used to apply the quasi-static displacement history; however, specimen CIP was
Test procedure
Instrumentation
Test specimens were instrumented with strain gauges in the plastic hinge region and the joint area on both longitudinal and transverse steel. For the precast concrete specimens, strain gauges were placed in the middle section of the fastened and grouted splice sleeve connectors to obtain the strain on the sleeves. String potentiometers were used to measure column displacements during the test. They were attached to the column head at the actuator centerline. The two potentiometers were oriented in two opposite direc-tions. Column displacements were obtained by taking the average of the two potentiometer readings. Linear variable differential transformers (LVDTs) were used to study the curvature distribution and base rotation, bond slip, and global vertical and horizontal movement of the specimens.
Ten LVDTs were mounted to the column end, over a 30 in. (760 mm) long region to measure the relative verti-cal displacements and provide data for curvature analysis. Figure 10 shows an example of strain gauges installed on both longitudinal and transverse reinforcement of specimen CIP along with LVDTs attached to fixtures on the east side of the column.
Figure 9. Grout operation for FGSS-2.
Pregrout technique prior to installation Bed grout at column-to-cap beam interface
Table 3. Yield and ultimate strength of reinforcing bars
Specimen
Column reinforcing bar Cap beam reinforcing bar
Longitudinal (no. 8) Transverse (no. 4) Dowel bar (no. 8) Transverse (no. 4)
Yield, ksi Ultimate, ksi Yield, ksi Ultimate, ksi Yield, ksi Ultimate, ksi Yield, ksi Ultimate, ksi
FGSS-1 77 102 63 103 68 93 63 103
FGSS-2 68 93 63 103 77 102 63 103
CIP 68 93 63 103 68 93 63 103
Note: no. 4 = 13M; no. 8 = 25M; 1 ksi = 6.89 MPa

89PCI Journal | March–Apr i l 2015
the 3 in. (75 mm) displacement cycle, after which it was changed to 4 in./min (100 mm/min) and was kept constant until test completion.
Test results
Hysteretic response
Figure 12 shows the hysteresis curves of the specimens. They include four major damage states: concrete cracking and spalling, reinforcing bar pullout, yield penetration, and reinforcing bar fracture.
Hysteresis response of specimen FGSS-1 The pinched hysteresis loops for specimen FGSS-1 (Fig. 12) indicate that the overall force-displacement performance was controlled by the bond-slip characteristics of the fastened and grouted splice sleeve connectors. In addi-tion to pinching from excessive slippage of the cap beam dowel bars inside the fastened and grouted splice sleeve connectors, reinforcing bar slippage introduced another type of disruption in the unloading branch of the response in the east direction. This was attributed to closure of the gap originally formed as a result of bond deterioration and
tested using a 250 kip (1100 kN) servo-controlled actuator with an overall stroke of 24 in. (610 mm).
Displacement history
A reversed cyclic quasi-static displacement-controlled protocol was applied to the column 8 ft (2.4 m) above the cap beam. The history comprised increasing amplitudes as multiples of the predicted yield displacement of the column.24 Two cycles were employed for each displace-ment cycle to the east and west (Fig. 11). The displacement rate was set to 1.2 in./min (30 mm/min) up to the end of
Table 4. Compressive strength of concrete and grout
Specimen
Concrete Grout
28-day, ksi
Test day, ksi
28-day, ksi
Test day, ksi
FGSS-1 5.3 6.2 12.5 13.3
FGSS-2 3.9 5.2 10.3 10.3
CIP 5.2 6.7 n/a n/a
Note: n/a = not applicable. 1 ksi = 6.89 MPa.
Figure 10. Instrumentation details.
Strain gauges on reinforcing bars LVDTs adjacent to column end

March–Apr i l 2015 | PCI Journal90
east and west directions, respectively. Failure of specimen FGSS-1 was caused by excessive bar slippage and pullout of reinforcing bar from the fastened and grouted splice sleeve connectors. The axial load applied to this specimen was unintentionally 40% higher than for the other two test specimens. This introduced a slight increase in the lateral force capacity for FGSS-1.
Hysteresis response of specimen FGSS-2 Hyster-esis loops of specimen FGSS-2 (Fig. 12) were relatively
bar slip. This gap closure phenomenon at the column–to–cap beam interface is visible for the unloading branch of the hysteresis loops at the 4% to 6% drift ratio in the east direction. The lateral force peaked at the 5% and 3% drift ratio in the east and west direction, respectively. A gradual strength reduction or cyclic strength deterioration was noted as a result of bond degradation between the dowel bar and grout inside the fastened and grouted splice sleeve connectors. The test was terminated at the end of the 6% drift ratio due to a load reduction of 20% and 30% for the
Figure 11. Experimental configuration and displacement history. Note: 1 kip = 4.448 kN.
Schematic test setup
Actual test setup

91PCI Journal | March–Apr i l 2015
reinforcing bar fractured in the first cycle of the 7% drift ratio, while the column east bars underwent excessive slippage, which resulted in considerable strength reduc-tion. Ultimately, the test was terminated after the 7% drift ratio because a strength drop of 42% and 45% occurred in the lateral force capacity as a result of west reinforcing bar
wide and stable compared with specimen FGSS-1, without any considerable strength degradation before reinforcing bar fracture or pullout, in the last drift ratio of 7%. The peak lateral force of 34.7 kip (154 kN) and 36.3 kip (161 kN) occurred at the 4% and 5% drift ratios, in the east and west directions, respectively. The column west
Figure 12. Hysteresis response of precast concrete and control specimens. Note: F = force; P = axial load.
Specimen FGSS-1
Specimen FGSS-2
Specimen CIP

March–Apr i l 2015 | PCI Journal92
Experimental observations and damage states
Visual observations made during testing of the precast concrete and control specimens are summarized in Fig. 13 to 15. This includes damage progression along with damage states of the most significant events throughout the response.
Visual observations for specimen FGSS-1 All ma-jor cracks had developed by the end of the 3% drift ratio. Spalling initiated at the corners of the octagonal column during the first cycle of the 3% drift ratio. The longest and widest crack, which had formed previously at the bed grout section, became a gap at the column–to–cap beam interface during the 3% drift ratio. This is evident in Fig. 13, which shows the gap opening while the column was at the peak displacement of the 3% drift ratio.
Cracks widened and concrete spalling progressed at higher drift ratios. During the 6% drift ratio, the conical shape of the expelled grout became visible; this condition is pre-sented in Fig. 13. This grout failure resembles the air test results in Fig. 4. The test was terminated after the 6% drift ratio due to bond deterioration and subsequent reinforcing bar pullout. The height of the spalled concrete was 8 in.
fracture and east reinforcing bar pullout. This was a unique failure mode because it included both a ductile failure and a bond-slip failure. The gap closure phenomenon at the column–to–cap beam interface described for specimen FGSS-1 was also observed for this specimen, an indication of excessive reinforcing bar slip at the 4% drift ratio.
Hysteresis response of specimen CIP The overall response of specimen CIP was satisfactory, and the wide and stable hysteresis loops indicated a high energy dissipa-tion capacity. This desirable performance represents a duc-tile response of a well-detailed reinforced concrete flexural component under both axial and lateral loading. The peak lateral force was 37.8 kip (168 kN) during the 2% drift ratio and 33.9 kip (151 kN) during the 3% drift ratio for the east and west direction, respectively.
This test was terminated after the 10% drift ratio due to the fracture of the extreme east and west column longitudinal steel bars. The west reinforcing bar fractured when the column top was close to the peak displacement during the first cycle of the 10% drift ratio. Subsequently, the bar on the east side of the column fractured during the first cycle of the 10% drift ratio. The superior hysteretic response of the control specimen is evident when compared with both precast concrete alternatives in Fig. 12.
Figure 13. Specimen FGSS-1 visual observations.
Bed grout opening at 3% drift ratio (peak)
Bar pullout during 6% drift ratio
Damage state at 3% drift ratio
Damage state at end of test (6%)
93PCI Journal | March–Apr i l 2015
0.03 in. (0.8 mm) at the end of the 3% drift ratio. Concrete cover spalling initiated during this drift ratio with a height of 8 in. on the column east side (Fig. 14). Cracks opened further and concrete spalling intensified after the 3% drift ratio up to test termination. Flexure-shear cracks formed on the north and south sides of the column during the 5% drift ratio, and the representative crack at 8 in. above the column base had a width of 0.04 in. (1 mm). Spalling became deeper and wider during the 6% drift ratio, and a strength reduction was noted at the end of the second cycle in the west direction. This was attributed to bond deteriora-tion between the grout and the embedded column dowel. The column extreme west bar broke at the end of the first cycle in the 7% drift ratio, whereas the east bar did not fracture; however, the drop in the lateral force capacity for the west direction implied that a bond-related phenom-enon had caused a sudden reduction in strength. Posttest observations showed that the spiral became exposed near the column end, and the largest flexural crack was found
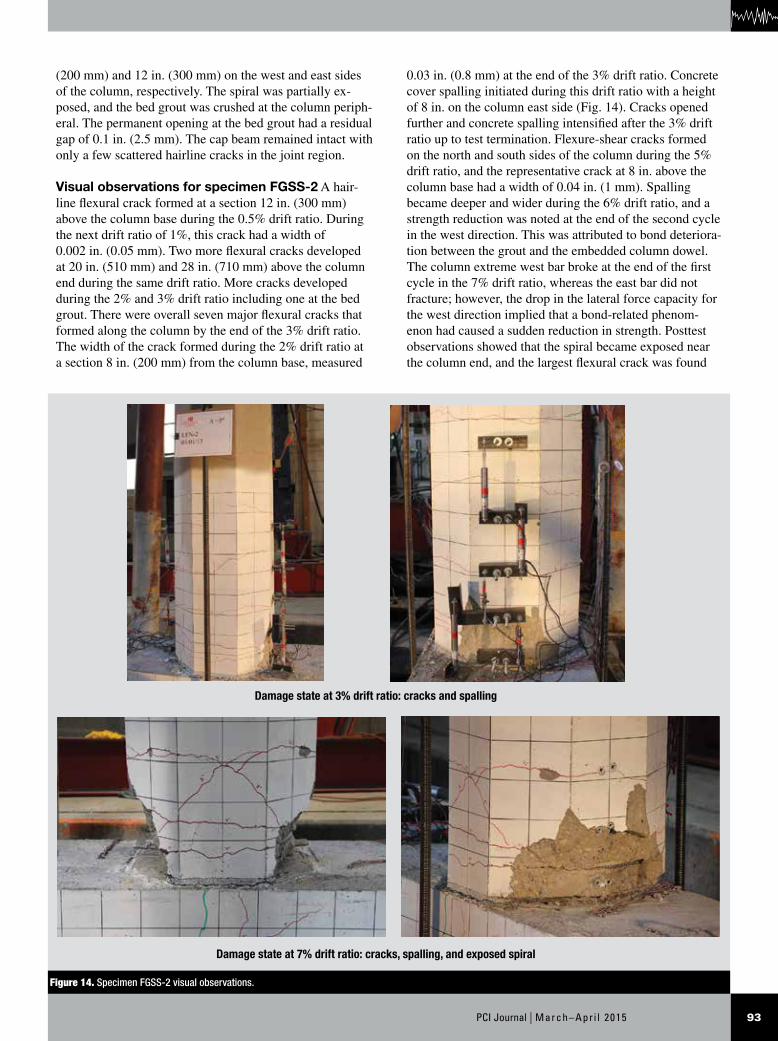
(200 mm) and 12 in. (300 mm) on the west and east sides of the column, respectively. The spiral was partially ex-posed, and the bed grout was crushed at the column periph-eral. The permanent opening at the bed grout had a residual gap of 0.1 in. (2.5 mm). The cap beam remained intact with only a few scattered hairline cracks in the joint region.
Visual observations for specimen FGSS-2 A hair-line flexural crack formed at a section 12 in. (300 mm) above the column base during the 0.5% drift ratio. During the next drift ratio of 1%, this crack had a width of 0.002 in. (0.05 mm). Two more flexural cracks developed at 20 in. (510 mm) and 28 in. (710 mm) above the column end during the same drift ratio. More cracks developed during the 2% and 3% drift ratio including one at the bed grout. There were overall seven major flexural cracks that formed along the column by the end of the 3% drift ratio. The width of the crack formed during the 2% drift ratio at a section 8 in. (200 mm) from the column base, measured
Figure 14. Specimen FGSS-2 visual observations.
Damage state at 3% drift ratio: cracks and spalling
Damage state at 7% drift ratio: cracks, spalling, and exposed spiral

March–Apr i l 2015 | PCI Journal94
4 in. (100 mm) above the column base measuring 0.06 in. (1.5 mm) wide. The location of the reinforcing bar fracture was 1 in. (25 mm) above the column base, just below the spiral. Low cycle fatigue was the cause of reinforcing bar fracture as a result of successive bending and straighten-ing of the column extreme bars. A permanent gap equal to 0.125 and 0.0625 in. (3.18 and 1.59 mm) remained at the bed grout section on the east and west sides of the column, respectively. Figure 13 shows the damage condition at the 3% and 7% drift ratio for specimen FGSS-2.
Visual observations for specimen CIP A few hairline flexural cracks appeared at the end of the 0.5% drift ratio over a 40 in. (1020 mm) long region up from the column end. More hairline flexural cracks developed during the 1% drift ratio, up to 60 in. (1500 mm) above the column end. The cracks, which had formed within the lowermost 12 in. (300 mm) portion of the column, widened during the 2% drift ratio. Also, a 0.03 in. (0.8 mm) wide crack formed at the column–to–cap beam interface. The crack at 12 in. from the column end had a width of 0.005 in. (0.1 mm) at this drift ratio. All major flexural cracks developed by the end of the 3% drift ratio, and concrete cover spalling began at the column corners. The crack at the column–to–cap beam interface remained unchanged, while the crack at 12 in. (300 mm) from the column end was 0.01 in. (0.3 mm) wide. Figure 15 shows the damage condition at the end of the 3% drift ratio.
Inclined cracks formed on the north and south sides of the column base in the 4% drift ratio. By the end of the 4% drift ratio, the largest three cracks measured 0.04, 0.06, and 0.013 in. (1, 1.5, and 0.30 mm) wide for the crack at the column–to–cap beam interface, 6 in. (150 mm) from the column end, and 12 in. (300 mm) from the column end, respectively.
Yield penetration was noted around the two column extreme bars at the end of the 6% drift ratio. Spalling became wider and deeper, covering the cracks that devel-oped in the previous cycles. Figure 14 shows the state of damage to the column at the end of the 6% drift ratio. In the 7% drift ratio, the column spiral became visible and the depth of yield penetration increased to 11⁄8 in. (29 mm). The column extreme longitudinal reinforcing bar was visible during the 8% drift ratio. The concrete cover was
crushed, which led to buckling of the reinforcing bar dur-ing the next drift ratio.
Low cycle fatigue caused fracture of the column extreme bars on both sides in the first cycle of the 10% drift ratio. The west column bar fractured first when the load was applied in the east direction, and then the east column bar fractured when the load was applied in the west direction. Reinforcing bar fracture occurred in the column end, at 1 and 11⁄2 in. (25 and 38 mm) from the cap beam surface for the west and east column bars, respectively. The spalled region had an effective width of 21 in. (530 mm) and height of 8 in. (200 mm), though the maximum height of the spalled area was 16 and 20 in. (400 and 510 mm) for the east and west column sides, respectively. The cap beam horizontal reinforcing bar was revealed as a result of continuous yield penetration of the column reinforcing bar. Figure 14 shows the damage state for this specimen at the end of the test. The cap beam remained intact with only two hairline cracks developed in the joint region during the 2% drift ratio.
Displacement ductility
Displacement ductility capacity is the ability of a structural component to perform beyond the yield point without ex-cessive strength deterioration; this was computed based on the concept of equal energy of an idealized elasto-plastic system.25 The average backbone curve was first constructed using the peak values of the first cycle for each drift ratio. To obtain the effective yield displacement of the system, it was assumed that the ideal elasto-plastic curve intersects the average backbone curve at a force equal to 70% times the effective yield force.24 The ultimate displacement was taken as the displacement corresponding to a 20% drop in lateral load capacity.26 Displacement ductility is the ratio of the ultimate displacement to the yield displacement. Table 5 shows the displacement ductility of all specimens.
The displacement ductility of specimen FGSS-1 was 4.9, while specimen FGSS-2 had an improved value equal to 5.8 due to a more pronounced bending action along the entire column height. Specimen CIP had a ductile performance and a displacement ductility of 9.9, which was superior to the precast concrete specimens. The displacement ductility capacity obtained for the precast
Table 5. Effective yield properties and displacement ductility values
Specimen Last drift ratio, % Fy, kip Δy, in. Δu, in. Keff, kip/in. μΔ
FGSS-1 6 35.35 1.08 5.32 32.70 4.9
FGSS-2 7 33.29 1.11 6.50 29.92 5.8
CIP 10 32.33 0.90 8.95 35.84 9.9
Note: Fy = effective yield force; Keff = effective stiffness; Δu = effective ultimate displacement; Δy = effective yield displacement; μΔ = displacement ductility. 1 in. = 25.4 mm; 1 kip = 4.448 kN.

95PCI Journal | March–Apr i l 2015
Figure 15. Specimen CIP visual observations.
Damage state at 3% drift ratio
Damage state at 6% drift ratio: cracks and spalling, yield penetration
Damage state at end of test: cracks and spalling, reinforcing bar buckling and fracture

March–Apr i l 2015 | PCI Journal96
reason is the additional compression component from the cast-iron connectors, which provide some resistance against the applied lateral forces. Hence, the lateral force capacity of specimen FGSS-1 was 11% greater than that of specimen CIP.
Energy dissipation
One desirable feature of ductile elements in high seismic regions is their ability to dissipate energy through inelastic deformations. This is an indication of the quality of the hysteretic response. The area enclosed by the hysteresis loops, referred to as the hysteretic energy, was computed cumulatively for each specimen to obtain the energy dis-sipation capacity.
Figure 17 shows the cumulative hysteretic energy capac-ity. The three specimens had similar hysteretic energy dissipation up to 3% drift ratio, after which specimens CIP and FGSS-2 had a slightly better performance. Specimen FGSS-2 with the fastened and grouted splice sleeve con-nectors inside the cap beam had wide and stable hysteresis loops that compared well with specimen CIP.
concrete specimens exceeded the minimum displacement ductility capacity of 3.0 for ductile components specified in Caltrans SDC.20 According to the AASHTO seismic bridge design provisions, the local ductility demand for ductile members in high seismic zones is limited to 5.0 for single-column bents and 6.0 for multiple-column bents.19 The backbone curve of the force-displacement response or cyclic envelope was constructed by joining the peak values of the load for the first cycle at each drift ratio. Figure 16 presents the cyclic envelopes for the three specimens. The response is similar up to 0.5% drift ratio, after which there were differences in the nonlinear response, especially in terms of displacement capacity. The lateral load capac-ity was similar for specimens FGSS-2 and CIP, whereas specimen FGSS-1 had a relatively higher strength. This is attributed to the fact that the axial load applied to speci-men FGSS-1 was unintentionally 40% higher than the other two specimens. In addition, based on previous ex-periments, when the bulky cast-iron grouted splice sleeve connectors are incorporated in the column plastic hinge, there is a 7% to 13% increase in the lateral force capac-ity due to a partial transition of the flexural action to the section right above the grouted splice sleeve.12,16,27 A third
Figure 16. Force-displacement response. Note: F = force; P = axial load; μ∆ = displacement ductility.
Specimen FGSS-1, µ∆ = 4.9
Specimen FGSS-2, µ∆ = 5.8Specimen CIP, µ∆ = 9.9
Figure 17. Cumulative hysteretic energy.
Specimen FGSS-1Specimen FGSS-2Specimen CIP

97PCI Journal | March–Apr i l 2015
(2)
where
ϕ = average curvature
A = west LVDT reading
B = east LVDT reading
w = width of curvature segment
h = height of curvature segment
The average curvature profile was constructed over a 30 in. (760 mm) column height above the column end. The average curvature values were normalized by multi-plying by the column dimension of 21 in. (530 mm), and the curvature segment heights were divided by the overall column height of 96 in. (2440 mm). Positive curvature was associated with the load applied in the east direction. The calculated curvature was assumed to be an average over the segment height. Figure 19 presents the normalized curvature distribution along the column for all specimens. Curvatures were included up to a 6% drift ratio, which was the last common drift ratio. Dashed lines mark the top of the fastened and grouted splice sleeve connectors in the column for specimen FGSS-1.
The normalized curvature profile of specimen FGSS-1 indicates that curvature capacity was a minimum over the FGSS connectors and that flexural action was concentrated at sections above and below the fastened and grouted splice sleeve connectors. An examination of this curvature profile reveals that the fastened and grouted splice sleeve connectors did not develop considerable stresses. The asymmetric curvature profile of specimen FGSS-1 was attributed to early bond deterioration of the east cap beam
Equivalent viscous damping is another quantity used to evaluate relative energy dissipation capacity under cyclic loads. The equivalent viscous damping offers more infor-mation about the hysteretic response of the system because both hysteretic and strain energy are considered. The equivalent viscous damping ratio ξeq was obtained as the ratio of the hysteretic energy to the energy of the equivalent viscous system as defined in Eq. (1).28
(1)
where
ED = hysteretic energy (area inside hysteresis loop)
ES0 = strain energy
Figure 18 presents the average ξeq of both cycles for each drift ratio. Specimen FGSS-2 had the closest hys-teretic performance to specimen CIP. Specimen CIP had a ξeq of 35% at the 10% drift ratio, which is a desirable value for ductile components. The equivalent viscous damping ratio at 6% drift ratio was 14%, 22%, and 24% for specimens FGSS-1, FGSS-2, and CIP, respectively. This implies that the hysteretic response was improved when the fastened and grouted splice sleeve connectors were located inside the cap beam because of a reduced flexural demand in the fastened and grouted splice sleeve region.
Column curvature and dowel bar yielding patterns
LVDTs installed on both the east and west sides of the column were used to study curvature distribution. Four curvature segments were specified by using four LVDTs on each side of the column. The average curvature was computed using Eq. (2):
Figure 18. Equivalent viscous damping.
Specimen FGSS-1Specimen FGSS-2Specimen CIP

March–Apr i l 2015 | PCI Journal98
A satisfactory curvature distribution was achieved for specimen FGSS-2 (Fig. 19). This is similar to the curvature distribution for cast-in-place concrete bridge bents with either well-detailed standard lapped splices or monolithic construction. Neglecting the asymmetric curvature distri-bution for the load applied in the west and east directions, this curvature profile resembles an acceptable distribution of curvature demand along the column, with the highest
dowels inside the connectors. Considering the hysteretic response of this specimen (Fig. 12), a drastic strength drop was noted after the 3% drift ratio, when the load was ap-plied in the west direction. This implies gradual strength degradation as a result of severe bond deterioration, which caused a more pronounced rocking behavior than bending, and thus smaller curvature values when the column was in the west direction.
Figure 19. Normalized curvature distribution. Note: F = force; P = axial load.
Curvature distribution for specimen FGSS-1
Curvature distribution for specimen FGSS-2
Curvature distribution for specimen CIP

99PCI Journal | March–Apr i l 2015
indicating the system is in the inelastic range of response and unable to return to its original position. A reduced residual drift is more desirable in regions of high seismic-ity as it implies less significant damage to the plastic hinge region of bridge columns. To compare the residual drift of the three test specimens, this parameter was obtained by collecting the drift values associated with zero lateral force for each drift ratio.
The average residual drift of the push and pull response was considered from the second cycle of each drift ratio.
Figure 20 shows that specimen CIP had larger residual drift values within the inelastic range of response start-ing at 1% drift ratio. The response of FGSS-2 is similar to CIP as anticipated, since the connectors were outside the column. Specimen FGSS-1 had the smallest residual drift values for every cycle. This was mainly attributed to the pinched hysteretic response of FGSS-1.
Conclusion
The experimental evaluation of the column–to–cap beam joint tests conducted in this research provided qualitative and quantitative measures to evaluate the specimens under quasi-static lateral cyclic loads. A summary of findings is offered:
• The cast-in-place control specimen had a good hyster-etic response with ductile failure (reinforcing bar frac-ture on opposite sides of the column). Well-distributed flexural cracks formed along the column height and the concrete cover spalled completely at the column end. The overall performance of this specimen was dominated by flexural action and formation of a plas-tic hinge at the column end. More localized damage was observed for the precast concrete specimen with the fastened and grouted splice sleeve connectors in the column. This involved fewer flexural cracks along the column height compared with the cast-in-place
curvature values at the column end where moment is also a maximum and a gradual decrease in curvature away from the joint. The asymmetric curvature profile resulted from movement of one of the LVDT fixtures located on the column east side due to damage in the plastic hinge zone during the 3% drift ratio.
Specimen CIP had a desirable curvature distribution along the column base. This was attributed to the well-detailed column plastic hinge region without fastened and grouted splice sleeve connectors.
Strain gauges, located on the two extreme longitudinal bars in the column end within the joint core of specimen FGSS-1, covered an area with a depth of 7 in. (180 mm) into the cap beam and 16 1⁄4 in. (413 mm) above the column end. Both extreme bars yielded over the whole range covered by strain gauges, except for the initial 5 in. (125 mm) portion of the field dowels, which was embedded and confined inside the fastened and grouted splice sleeve connectors.
For specimen FGSS-2, strain gauges were installed over an area with a depth of 13 in. (330 mm) into the cap beam and 18 in. (460 mm) above the column end. The extreme column dowels yielded starting at 5 in. (125 mm) from the tip of the column dowel bars, which were confined within the fastened and grouted splice sleeve connectors, or 2 in. (50 mm) into the cap beam from the column–to–cap beam interface. The cap beam dowel bars did not yield.
Strain gauges located on the extreme longitudinal bars, in the column end, and within the joint core of specimen CIP showed that the extreme bars yielded over an area with a depth of 9 1⁄2 in. (240 mm) into the cap beam and 38 in. (970 mm) above the column end.
Residual drift
During a major seismic event bridge piers are highly likely to experience permanent residual displacement (drift),
Figure 20. Residual drift for all test specimens.
Specimen FGSS-1Specimen FGSS-2Specimen CIP

March–Apr i l 2015 | PCI Journal100
attributed to the presence of the connectors in the column end and the inelastic action shifting to the top and bottom of the connectors. Strain gauge data for this specimen showed that dowel bars developed their yield strength both in the column and cap beam. By contrast, for the precast concrete specimen with the fastened and grouted splice sleeve connectors inside the cap beam, the bars in the column yielded, but the bars in the cap beam did not yield. This is desirable and closely emulates cast-in-place concrete construction.
• The precast concrete specimen with the fastened and grouted splice sleeve connectors inside the cap beam achieved a drift capacity of 7.0%, which exceeds the drift demand expected in large earthquakes. It achieved satisfactory hysteretic performance and energy dissipation. In addition it achieved a displace-ment ductility of 5.8 and a curvature distribution that closely emulates cast-in-place construction. Precast concrete joints constructed with the specific details of this specimen are expected to perform adequately in moderate to high seismic regions.
Acknowledgments
The authors would like to acknowledge the financial sup-port of the Utah, New York State, and Texas departments of transportation. The authors wish to thank Lawrence D. Reaveley, a professor at the University of Utah, for his invaluable input throughout the project. Special thanks are extended to Mark Bryant of the University of Utah for his untiring efforts and support. The authors are also grateful for the donation of materials by ERICO and the assistance of Hanson Structural Precast.
References
1. Pang, J. B. K., M. O. Eberhard, and J. F. Stanton. 2010. “Large-Bar Connection for Precast Bridge Bents in Seismic Regions.” Journal of Bridge Engineering 15 (3): 231–239.
2. Matsumoto, E. E. 2009. “Emulative Precast Bent Cap Connections for Seismic Regions: Component Tests—Grouted Duct Specimen (Unit 2).” ECS report ECS‐CSUS‐2009‐02. Sacramento, CA: California State University, Sacramento.
3. Mashal, M., and A. Palermo. 2014. “Experimen-tal Investigation into the Seismic Performance of Half-Scale Fully Precast Bridge Bent Incorporat-ing Emulative Solution.” In 10th National Con-ference in Earthquake Engineering: Frontiers of Earthquake Engineering, Proceedings, CD Rom, Earthquake Engineering Research Institute, Oak-land, CA.
specimen. The spalled region was also smaller as a re-sult of the presence of the fastened and grouted splice sleeve connectors in the column end. The precast con-crete specimen with the fastened and grouted splice sleeve connectors in the cap beam had a damage state similar to the cast-in-place control specimen because there were no sleeve connectors in the column. More flexural cracks formed along the column compared with the precast concrete specimen with the fastened and grouted splice sleeve connectors in the column, and the spalled region had a similar height, width, and depth to that of the cast-in-place specimen.
• Reinforcing bar fracture for the cast-in-place control specimen occurred at a 10% drift ratio due to low cycle fatigue. Premature reinforcing bar fracture oc-curred in the west column bar of the precast concrete specimen with the fastened and grouted splice sleeve connectors in the cap beam at a 7% drift ratio, which was accompanied by pullout failure of the east column bar. The precast concrete specimen with the fastened and grouted splice sleeve connectors in the column failed early at a drift of 6% because of reinforcing bar pullout due to excessive bond slip.
• The cast-in-place control specimen had a displace-ment ductility of 9.9 with hysteresis loops that were wide and stable, implying excellent energy dissipation. A displacement ductility of 5.8 was achieved for the precast concrete specimen for which the fastened and grouted splice sleeve connectors were inside the cap beam. Compared with the precast concrete specimen with the fastened and grouted splice sleeve connectors in the column, with a displacement ductility of 4.9, a more ductile response along with a better hysteretic performance was obtained by placing the fastened and grouted splice sleeve connectors in the cap beam. The displacement ductility obtained for all alterna-tives exceeded the minimum component displacement ductility of 3.0 specified in the Caltrans SDC. The dis-placement ductility for the precast concrete specimen with the fastened and grouted splice sleeve connectors inside the cap beam was greater than the maximum ductility of 5.0 for single-column bridge bents but less than the maximum ductility of 6.0 for multiple-column bridge bents specified in the AASHTO seismic guide for ductile members in high seismic zones.
• The distribution of inelasticity at the column end for the precast concrete specimen with the fastened and grouted splice sleeve connectors inside the cap beam was similar to that of the cast-in-place control speci-men because there was no disruption of the natural stress transfer in the column end; however, for the pre-cast concrete specimen with the fastened and grouted splice sleeve connectors in the column a different distribution of inelasticity was observed. This was

101PCI Journal | March–Apr i l 2015
08. Reno, NV: Center for Civil Engineering Earth-quake Research, Department of Civil and Environ-mental Engineering, University of Nevada, Reno.
13. Matsuzaki, Y., et al. 1987. “Effects of Sleeves on Member Properties, Study on the Behavior of Rein-forced Concrete Beams with Grout-Filled Steel Splice Sleeves.” Architectural Institute of Japan, Tokyo, Japan.
14. Splice Sleeve Japan Ltd. “Tests on Re-Bar Splices in Reinforced Concrete Columns Using NMB Splice Sleeves.” NPD-024, Splice Sleeve Japan, Ltd., Tokyo, Japan.
15. Yoshino, T., K. Kobayashi, and M. Ase. 1996. “In-tensive Shear Reinforcing Method for PCA Mem-bers with Splice Sleeve Joint.” In Proceedings of the Eleventh World Conference on Earthquake Engineer-ing June 23–28, Acapulco, Mexico, Oxford: Elsevier Science. CD-Rom.
16. Aida, H., Y. Tanimura, T. Tadokoro, and K. Takimoto. 2005. “Reversed Cyclic Loading Test of Precast Col-umns with Grout-filled Sleeves for Railway Viaducts.” Japan Concrete Institute, Proceedings of the Japan Concrete Institute 27 (2).
17. Reetz, R. J., M. V. Ramin, and A. Matamoros. 2004. “Performance of Mechanical Splices within the Plastic Hinge Region of Beams Subject to Cyclic Loading.” Paper No. 1073, Proceedings of 13th World Confer-ence on Earthquake Engineering. Vancouver, B.C., Canada: Canadian Association for Earthquake Engi-neering. CD-Rom.
18. AASHTO (American Association of State Highway and Transportation Officials). 2012. AASHTO LRFD Bridge Design Specifications. Washington, DC: AAS-HTO.
19. AASHTO. 2011. AASHTO Guide Specifications for LRFD Seismic Bridge Design. Washington, DC: AASHTO.
20. California Department of Transportation. 2010. Seismic Design Criteria. Sacramento, CA: Division of Engineering Services.
21. ASTM A370-09a. 2009. Standard Test Method and Definitions for Mechanical Testing of Steel Products. West Conshohocken, PA: ASTM International. doi: 10.1520/A0370-09A.
22. ASTM C39. 2012. Standard Test Method for Com-pressive Strength of Cylindrical Concrete Specimens. ASTM International, West Conshohocken, PA. doi: 10.1520/C0039_C0039M-12.
4. Matsumoto, E. E. 2009. “Emulative Precast Bent Cap Connections for Seismic Regions: Component Tests—Cap Pocket Full Ductility Specimen (Unit 3).” ECS report ECS‐CSUS‐2009‐03. Sacramento, CA: Califor-nia State University, Sacramento.
5. Restrepo J. I., M. J. Tobolski, and E. E. Matsumoto. 2011. “Development of a Precast Bent Cap System for Seismic Regions.” NCHRP (National Cooperative Highway Research Program) 681. Washington, DC: NCHRP.
6. Haraldsson, O. S., M. J. Schoettler, G. Finnsson, P. M. Davis, J. F. Stanton, and M. O. Eberhard. 2013. “Seis-mic Resistance of Precast Concrete Bridge Columns Made with Unbonded Pre-Tensioning and Hybrid Fiber Reinforced Concrete.” In Proceedings of the Seventh National Seismic Conference on Bridges & Highways: Bridge Resilience for Earthquakes & Other Natural Hazards. J. Kapur and T. Ostrom, eds. Buffalo, NY: University at Buffalo, State University of New York. CD Rom.
7. Haber, Z. B., M. S. Saiidi, and D. H. Sanders. 2014. “Seismic Performance of Precast Columns with Me-chanically Spliced Column-Footing Connections.” ACI Structural Journal 111 (3): 639–650.
8. Tazarv, M., and M. S. Saiidi. 2014. “Next Generation of Bridge Columns for Accelerated Bridge Construc-tion in High Seismic Zones.” CCEER (Center for Civil Engineering Earthquake Research) 14-06. Reno, NV: Department of Civil and Environmental Engineering, University of Nevada, Reno.
9. Marsh, M. L., M. Wernly, B. E. Garett, J. F. Stanton, M. O. Eberhard, and M. D. Weinert. 2011. “Applica-tion of Accelerated Bridge Construction Connections in Moderate-to-High Seismic Regions.” NCHRP (Na-tional Cooperative Highway Research Program) 698. Washington, DC: NCHRP.
10. Jansson, P. O. 2008. “Evaluation of Grout-Filled Me-chanical Splices for Precast Concrete Construction.” Report R-1512. Lansing, MI: Michigan Department of Transportation.
11. Rowell, S. P., C. E. Grey, S. C. Woodson, and K. P. Hager. 2009. “High Strain Rate Testing of Mechanical Couplers.” ERDC (Engineer Research and Develop-ment Center) TR-09-8. Vicksburg, MS: U.S. Army Corps of Engineers, Engineer Research and Develop-ment Center, Geotechnical and Structures Laboratory.
12. Haber, Z. B., M. S. Saiidi, and D. H. Sanders. 2013. “Precast Column-Footing Connections for Accelerated Bridge Construction in Seismic Zones.” CCEER 13-
March–Apr i l 2015 | PCI Journal102
Notation
A = west linear variable differential transformers reading
B = east linear variable differential transformers reading
ED = hysteretic energy (area inside hysteresis loop)
ES0 = strain energy
fy = nominal yield strength of reinforcing bars
F = force
Fy = effective yield force
h = height of curvature segment
Keff = effective stiffness
P = axial load
w = width of curvature segment
∆u = effective ultimate displacement
∆y = effective yield displacement
μ∆ = displacement ductility
ξeq = equivalent viscous damping
ϕ = average curvature
23. ASTM C109. 2012. Standard Test Method for Com-pressive Strength of Hydraulic Cement Mortars (Using 2-in. or [50-mm] Cube Specimens). ASTM International: West Conshohocken, PA. doi: 10.1520/C0109_C0109M-12.
24. ACI Committee 374. 2013. Guide for Testing Rein-forced Concrete Structural Elements Under Slowly Applied Simulated Seismic Loads. ACI 374.2R-13. Farmington Hills, MI: ACI.
25. Park, R. 1989. “Evaluation of Ductility of Structures and Structural Assemblages from Laboratory Test-ing.” Bulletin of the New Zealand National Society for Earthquake Engineering 22 (3): 155–166.
26. Priestley, M. J. N., and R. Park. 1987. “Strength and Ductility of Concrete Bridge Columns Under Seismic Loading.” ACI Structural Journal 84 (1): 61–76.
27. Ameli, M. J., J. E. Parks, D. N. Brown, and C. P. Pan-telides. 2014. “Seismic Evaluation of Grouted Splice Sleeve Connections for Precast RC Bridge Piers.” Re-port UT-14.09. Salt Lake City, UT: Utah Department of Transportation.
28. Chopra, A. 2007. Dynamics of Structures, Theory and Applications to Earthquake Engineering. 4th ed. Up-per Saddle River, NJ: Pearson Prentice Hall.

103PCI Journal | March–Apr i l 2015
About the authors
M. J. Ameli is a PhD candidate in the Civil and Environmental Engineering Department of the University of Utah in Salt Lake City, Utah, where he also received his MSc. His research interests include large-scale testing of
structural components, nonlinear design and analysis of reinforced concrete structures and use of composites in repair and retrofit of concrete components.
Joel E. Parks is a PhD candidate in the Civil and Environmental Engineering Department of the University of Utah, where he also received his MSc. His research interests include nonlinear design and analysis of reinforced concrete
structures and use of composites in repair and retrofit.
Dylan N. Brown is a bridge engineer at Michael Baker International in Madison, Wis. He earned his MSc in structural engineering from the Civil and Environmental Engineering Department at the University of
Utah. His research interests include testing, evaluation, and modeling of repaired precast concrete bridge components designed for accelerated bridge construc-tion in seismic regions.
Chris P. Pantelides is a professor in the Civil and Environmental Engineering Department of the University of Utah. His research interests include seismic design and rehabilitation of reinforced concrete, precast and prestressed
concrete buildings and bridges, and the application of fiber-reinforced-polymer composites.
Abstract
Connections between precast concrete elements must be able to withstand significant stresses and deformations in earthquakes. The grouted splice sleeve connector is being considered for use in accelerated bridge construction. Although grouted splice sleeve connectors facilitate the construction of precast concrete bridges and accelerate construction, seismic bridge design codes prohibit their use in column plastic hinges. Half-scale bridge column–to–cap beam assemblies were tested to investigate their response under cyclic quasi-static load. The grouted splice sleeve connectors were located in the column plastic hinge zone for the first alternative and in the cap beam for the second. A monolithic cast-in-place concrete specimen with identi-cal details served as a control. Satisfactory drift capacity and displacement ductility were achieved when the grouted splice sleeve connectors were inside the cap beam joint. The research shows that precast concrete joints constructed with the specific type of grouted splice sleeve connectors in the cap beam should perform adequately in moderate to high seismic regions.
Keywords
Accelerated bridge construction; column; connection; cyclic load test; grouted splice sleeve; joint; mechani-cal coupler.
Review policy
This paper was reviewed in accordance with the Precast/Prestressed Concrete Institute’s peer-review process.
Reader comments
Please address and reader comments to journal@pci .org or Precast/Prestressed Concrete Institute, c/o PCI Journal, 200 W. Adams St., Suite 2100, Chicago, IL 60606. J


![Tensile Capacity of Head-splice Sleeve Connection after a ...[2] Jen Hua Ling, Ahmad Baharuddin Abd. Rahman, Izni Syahrizal Ibrahim, Zuhairi Abdul Hamid, “Behaviour of Grouted Pipe](https://img.dokumen.tips/doc/110x75/60eb9219999a60532320e2bf/tensile-capacity-of-head-splice-sleeve-connection-after-a-2-jen-hua-ling.jpg)