Embed Size (px)
Citation preview
WATTS BAR NUCLEAR PLANT
SEISMIC ANALYSIS
CORRECTIVE ACTION PROGRAM PLANREVISION 1
Prepared v
4.• 2 $. & £. -4t9Keviewed (LKead Engineer) ,(4Binch S"ecialist)
-A Approved (Branch" hief)
Concurred (Watts Bar Program Team)
onP u O(ýred (Site Qualfty M(n ger)
'-':90705 0.36 7 '8906.29FDR DC: 05:;000390
A FPDC
J
TVA
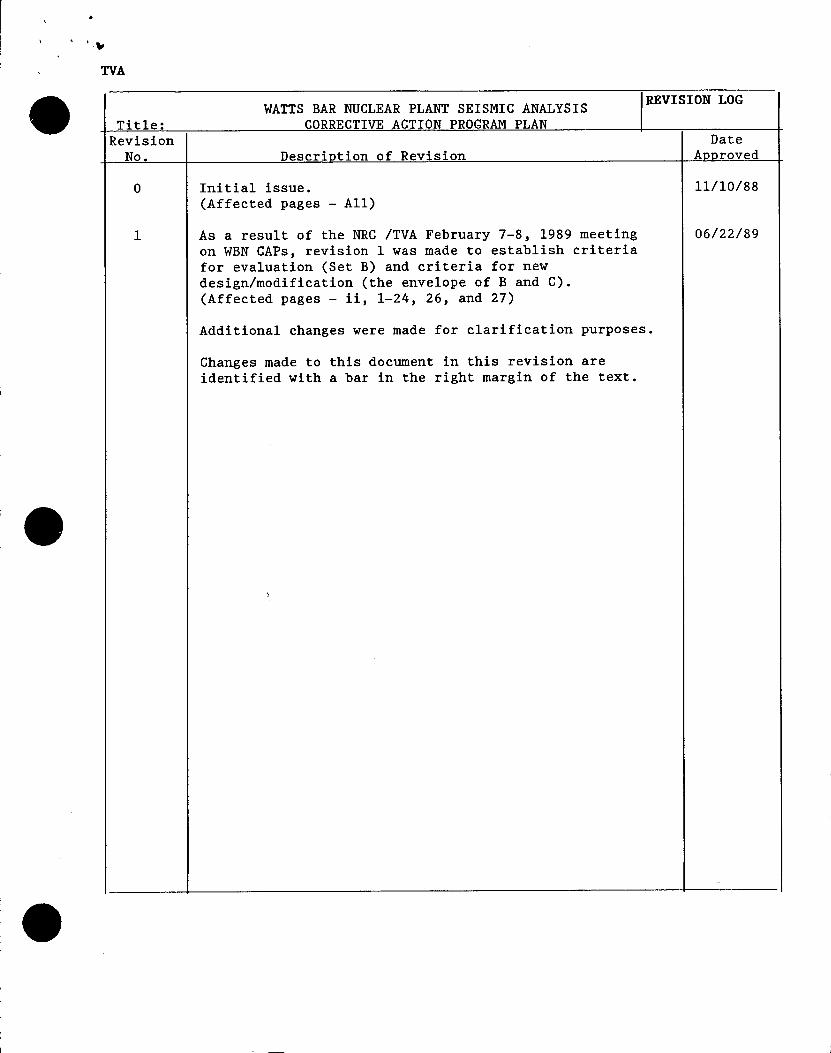
WATTS BAR NUCLEAR PLANT SEISMIC ANALYSIS REVISION LOG
Title: CORRECTIVE ACTION PROGRAM PLAN -_____
Revision DateNo. Description of Revision Approved
0 Initial issue. 11/10/88(Affected pages - All)
1 As a result of the NRC /TVA February 7-8, 1989 meeting 06/22/89on WBNŽ CAPs, revision 1 was made to establish criteriafor evaluation (Set B) and criteria for newdesign/modification (the envelope of B and C).(Affected pages - ii, 1-24, 26, and 27)
Additional changes were made for clarification purposes.
Changes made to this document in this revision areidentified with a bar in the right margin of the text.
I i
SEISMIC ANALYSIS
CORRECTIVE ACTION PROGRAM PLAN
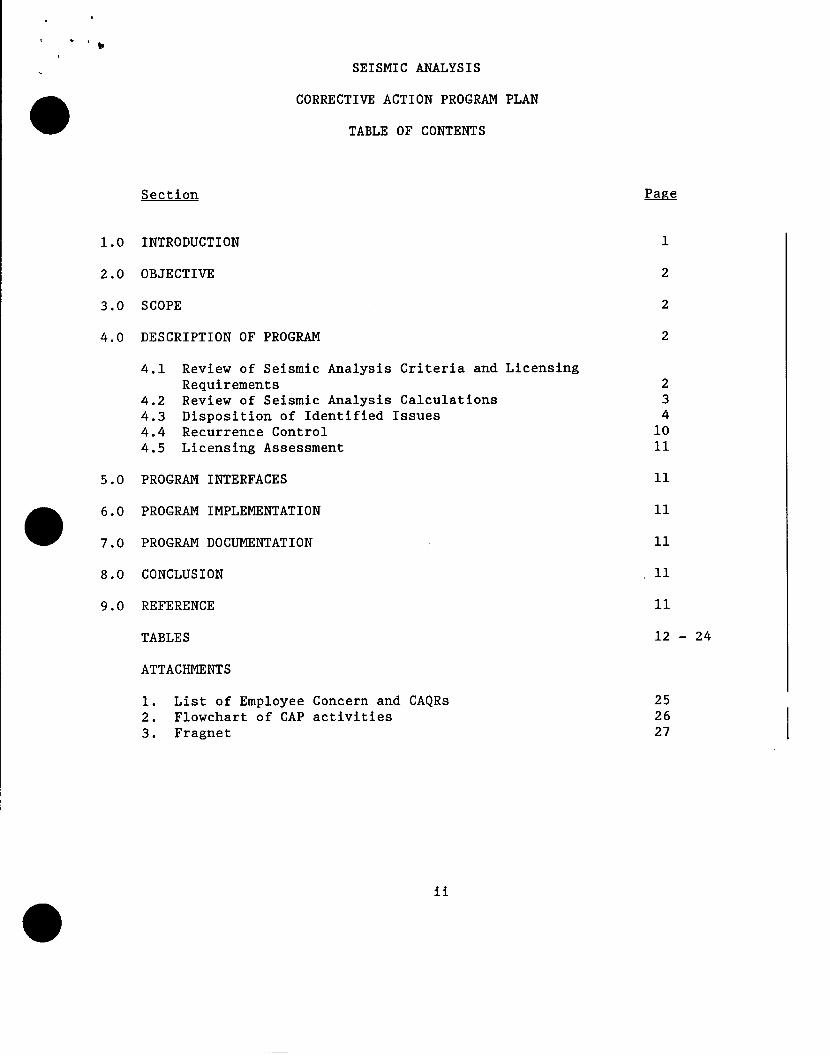
TABLE OF CONTENTS
Sect ion Page
1.0 INTRODUCTION 1
2.0 OBJECTIVE 2
3.0 SCOPE 2
4.0 DESCRIPTION OF PROGRAM 2
4.1 Review of Seismic Analysis Criteria and LicensingRequirements 2
4.2 Review of Seismic Analysis Calculations 34.3 Disposition of Identified Issues 44.4 Recurrence Control 10
4.5 Licensing Assessment 11
5.0 PROGRAM INTERFACES 11
P6.0 PROGRAM IMPLEMENTATION 11
7.0 PROGRAM DOCUMENTATION 11
8.0 CONCLUSION 11
9.0 REFERENCE 11
TABLES 12 - 24
ATTACHMENTS
1. List of Employee Concern and CAQRs 252. Flowchart of CAP activities 263. Fragnet 27

SEISMIC ANALYSIS
CORRECTIVE ACTION PROGRAM (CAP) PLAN
1.0 INTRODUCTION
The seismic design basis for Watts Bar Nuclear Plant (WBN) (Reference 1)is the Modified Newmark design spectrum anchored at 0.18 g horizontal and0.12 g vertical for the Safe Shutdown Earthquake (SSE). The OperatingBasis Earthquake (OBE) is equal to one-half the SSE. The design basisspectrum was confirmed to be an acceptable design basis by comparisonwith the Site Specific Response Spectra developed in 1979. The seismicdesign basis was documented in the WBN Final Safety Analysis Report(FSAR) and the NRC review and acceptance was documented in the WBN SafetyEvaluation Report (SER). (SER is based on FSAR through Amendment 46).
An independent review of the seismic analysis calculations for SeismicCategory I structures was initiated in September 1987 as part of theCivil Calculation Activity of the Design Baseline Verification Program.The Civil Calculation Activity is being performed to ensure thatessential civil calculations exist., are retrievable, and are technicallyadequate. The seismic analysis calculations were selected for an earlyreview to ensure that the analysis and the resulting Amplified ResponseSpectra (ARS) used for seismic design of structures, systems, andcomponents are technically adequate and satisfy licensing requirements.
Based on this review, certain aspects of the structural seismic analysiswere identified as requiring further evaluation and justifications.
An area of seismic analysis methodology was also identified from the WBNEmployee Concern Program which required additional evaluation. Theconcern is related to the time interval of integration used forperforming seismic analyses. Also, three CAQRs identified issues relatedto soil properties used in seismic analyses and consideration of soil andpile interaction effects. The employee concern, CAQRs, and their briefdescriptions are provided in Attachment 1. The issues identified fromthe calculation review, employee concern, and CAQRs are tabulated inTable 1.
To complement the calculation review, a comparison of the seismiccriteria used in the analysis of structures with the FSAR commitments andSER provisions was initiated in July 1988. The purpose of this activitywas to assure that the criteria used in the original seismic analysis ofstructures are technically adequate and consistent with the licensingrequirements. The matrix comparing the seismic analysis criteria, FSARand SER for Seismic Category I structures is shown in Table 2.
A review of Table 2 indicates that the seismic analysis criteria used inoriginal analysis of WBN structures are consistent with the FSAR andSER. Due to the issues identified in Table 1, an evaluation of severalCategory I structures is planned to assure that the original seismicanalysis of WBN is adequate.
The root cause of the issues identified in this CAP is attributed to theuse of engineering judgments in the original seismic analysis withoutsupporting documentation.
-1-
2.0 OBJECTIVE
The objectives of this CAP are to ensure that the criteria for and theseismic analysis of Category I structures, including the generation of thestructural loads and ARS, are technically adequate and meet licensingrequirements. Based on the results of the review thus far, some revisionswill be necessary to the design criteria and the FSAR. Licensingcommitment changes will be proposed only when technically justified.
3.0 SCOPE
The scope of this CAP includes:
" Review, revision, and augmentation of the seismic analysis criteria usedfor Category I structures to assure compliance with the licensingrequirements.
o Review, revision, and augmentation of seismic calculations for CategoryI structures as required to resolve the issues identified in this CAP.
" Define the seismic criteria for future evaluations and new designs ormodifications of structures, systems, and components.
4.0 DESCRIPTION OF PROGRAM
This CAP consists of the following activities:
" Review of seismic analysis criteria and licensing requirements forCategory I structures.
o Review of seismic analysis calculations for Category I structures andrevisions as required, or preparation of new calculations when necessary.
o Disposition of identified issues.
o Definition of the seismic criteria for future evaluations and newdesigns or modifications of structures, systems, and components.
Additionally, recurrence control is addressed and licensing assessment isprovided. A flow chart and fragnet for the work are included inAttachments 2 and 3, respectively.
4.1 Review of Seismic Analysis Criteria and Licensing Requirements
The seismic analysis criteria have been reviewed for technicaladequacy. The criteria have also been compared with the applicableFSAR and SER sections to ensure that the criteria are consistent withthe licensing requirements. For the Category I structures, Table 2shows the comparison between the original seismic analysis criteria,FSAR commitments, and SER provisions.

As demonstrated by Table 2, the seismic analysis criteria used inthe original analysis of WBN structures are consistent with the FSARrequirements and SER provisions. In addition, in view of thecurrent industry practice, a study has been initiated to evaluatethe effects of floor vertical flexibility on the design of systemsand components.
Table 2 is based on Revision 3 of the seismic design criteria,WB-DC-20-24, which has been revised to include the criteria discussedin Section 4.3.5 of this CAP.
The criteria for seismic analysis of the Additional Diesel GeneratorBuilding (ADGB), which was included in Amendment 57 of the FSAR(after the SER was issued), will be deleted and the ADGB will bereanalyzed as discussed in Section 4.3.5.
4.2 Review of Seismic Analysis Calculations
An independent review of the seismic analysis of each Category Istructure has recently been performed. The review included thefollowing structures.
o Reactor Building Interior Concrete Structure (ICS).
o Reactor Shield Building (SB).
o Steel Containment Vessel (SCV).
o Auxiliary Control Building (ACB).
O Intake Pumping Station (IPS).
o Diesel Generator Building (DGB).
o Additional Diesel Generator Building (ADGB).
o Refueling Water Storage Tanks (RWST).
o North Steam Valve Room (NSVR).
O Pipe Tunnels
o Waste Packaging Area (WPA).
O Condensate Demineralizer Waste Evaporator Building (CDWE).
The WPA and CDWE contain no safety-related systems or components.They were designed as Category I structures to ensure that they willnot impact the adjacent ACB during a seismic event.
-3-

Several engineering judgments without supporting documentation wereidentified during the review of the calculations for the ADGB, DGB,and the CDWE. There are also two CAQRs related to the modeling ofthe supporting piles in the seismic analysis of the ADGB and CDWE(See Attachment 1). In order to resolve questions related to theengineering judgments and the CAQRs, reanalysis of these structuresis being performed as discussed in Section 4.3.2.
The calculation review also identified the need to review thetorsional modeling of the ICS, ACB, and NSVR. This issue is beingaddressed as described in Section 4.3.3.
4.3 Disposition of Identified Issues
Issues have been identified through employee concerns, CAQRs, andreview of seismic analysis calculations, criteria, and licensingrequirements. These issues deal with the following areas:
" Integration time step used to perform time history analysis.
" Soil properties and soil-structure interaction concerns.
" Torsional modeling of structures.
O Seismic analysis criteria for the Additional Diesel GeneratorBuilding (ADGB).
The above issues and the approach to resolve them are discussed inthe following sections. The effects of these issues on the analysisof Seismic Category I structures are discussed in Section 4.3.5.
4.3.1 Integration Time Step Used in Time History Analysis
An integration time step of 0.01 second was used in theoriginal time history analysis of structures to generate theARS. An engineering judgment was made that 0.01 second wasadequate for structural analysis and the earthquake recordswere digitized at 0.01 second. An employee concernidentified that this integration time step might be too largeand could result in an underestimation of the response ofthose modes which have frequencies greater than 20 Hz.
Seismic Category 1 structures are being reanalyzed,addressing the integration time interval issue, as discussedin the subsection 4.3.5.5. Evaluation of existingstructures, systems and components using the new analysisresults will also address the adequacy of integrationtimestep used in the original analysis. New designs ormodifications will be based on new analysis results whichincorporate an adequate integration time step in thedevelopment of ARS.
4.3.2 Soil Properties and Soil-Structure Interaction Concerns
The value of shear modulus for the crushed stone supportingmedia used in the analysis of the Diesel Generator Building(DGB) and the Waste Packaging Area (WPA) was identified as aconcern in a CAQR. The design value originally used wasbased on the assumption that in situ geophysical measurementsmade on other similar materials were suitable for the crushedstone. Later, in situ testing of crushed stone and review oftechnical literature resulted in a lower shear modulus thanthe one used in the DGB and WPA analysis.
In order to resolve this issue for the DGB, a newsoil-structure interaction (SSI) analysis using the revisedshear modulus will be performed.
As stated previously, the WPA does not house anysafety-related systems and components and the originalanalysis predicted conservative internal structural forces.In the original analysis, a decoupled, two-stage SSI analysiswas used to determine the seismic response of the structureand the results were conservative. An analysis using therevised shear modulus is being performed to confirm that thegap between the WPA and adjacent ACB is adequate.Preliminary results confirm that there is sufficient gapbetween the two structures such that they will not impacteach other during a seismic event.
The Condensate IDemineralizer Waste Evapor ator Building (CDWE)and the Additional Diesel Generator Building (ADGB) analysesincluded engineering judgments related to the modeling of thesupporting piles. The engineering judgments were questionedby a CAQR and involved stiffness consideration of pile groupsand an assumption of full contact between the building's matfoundation and the underlying soil. These judgments weremade to maximize the structural responses and may not havepredicted conservative reactions for the piles.
There are no safety-related systems and components in theODWE. Calculations are being performed to more accuratelyconsider the stiffness of the pile groups and the postulatedgap between the slab and soil. Preliminary results confirmthat the gap between the buildings is sufficient for seismicseparation and the design of the structure and piles isadequate even when a gap is assumed to exist between the slaband soil.
The seismic analysis of the ADGB is addressed in Sections
4.3.4 and 4.3.5.
4.3.3 Torsional Modeling
During the review of the calculations discussed in Section4.2, two torsional modeling issues identified were themechanics of modeling eccentric masses and the methodologyused in calculating torsional constants for open cross0 sections.
-5-

Modeling of Eccentricities
In the original seismic models, the eccentricity between thecenter of mass and the center of rigidity was included ateach mass point. However, the physical location of thecenter of rigidity was not incorporated into the model.
The Interior Concrete Structure (ICS) and the AuxiliaryControl Building (ACB) are the two structures affected by theissue of modeling of eccentricities. Seismic analysiscalculation of these two structures has been performed,taking into account actual location of shear centers.
Torsional Constants
The only two structures with significant open sections, wherethe issue of the effect of warping on the calculation of thetorsional constant becomes important, are the ICS and theNorth Steam Valve Room (NSVR). In both of these cases theoriginal calculations did not include the warpingcontribution to torsional stiffnesses and thus the resultingcalculated torsional constant was lower. This approach wasconsidered to be conservative since calculated torsionalresponses would be greater. However, the lower torsionalconstant can cause shifts in the calculated frequencies ofthe structure and thus, the shape of the ARS can be affected.
Calculations were performed for the ICS considering themodeling of eccentric masses and the revised torsionalconstants for open sections. An equivalent stick model wasdeveloped from a 3-dimensional finite element model to studythe effect of the revised torsional constants. Thecalculations indicated that further evaluations will berequired to justify the adequacy of the original calculations(see Section 4.3.5).
A reanalysis of the NSVR considering torsional constantsincluding the warping contribution will also be performed toevaluate the adequacy of the original calculations.
4.3.4 Seismic Analysis Criteria for the Additional Diesel GeneratorBuilding (ADGB)
When the ADGB was added to the WBN design, new criteria forseismic analysis of the ADGB were developed. These criteriawere based on the current NRC Standard Review Plans (Revision1) and Regulatory Guides. These criteria were incorporatedin the FSAR by Amendment 57, after the NRC had issued the SERand the supplements. The criteria defined in Amendment 57will be eliminated and the ADGB will be reanalyzed asdiscussed in Section 4.3.5. This will bring the criteria forADGB analysis in line with other Category 1 structures at theplant.
4.3.5 Summary of Seismic Analysis Review for Category I Structures
4.3.5.1 Original Analyses
The original analyses of Category I structures wereperformed consistent with the FSAR requirements andusing methodologies that were prevalent at thattime. The criteria used and analytical results werereviewed by the NRC prior to issuance of the SER.The seismic analysis results, in the form ofstructural loads and floor or amplified responsespectra (ARS) were used in the design of structures,systems, and components. The Additional DieselGenerator Building (ADGB) was designed at a laterdate using a different criteria, added to the FSARin Amendment 57.
The criteria used to perform the original analysesand the significant analysis parameters, called SetA, are shown in Table 3. As can be seen from thistable, the original analyses (except for theAdditional Diesel Generator Building) utilized fourdifferent time-history records. The average of theresponse spectra of the four time-history recordsenveloped the Modified Newmark ground responsespectrum which was the design basis. The same fourrecords were used in three directions independently.The vertical input was taken as two-thirds of thehorizontal. The structural models used in analysesand described in the FSAR were essentiallyone-dimensional models but included the torsionaleffects in the direction of excitation.
4.3.5.2 Analyses Using Site Specific Response Spectra
As a result of the issues discussed inSections 4.3.1 through 4.3.4, it is concluded thatreanalysis of some structures is necessary. Theinte~nt-of the reanalysis is to demonstrate theadequacy of structures, systems, and componentsconsidering the effects of the issues identifiedthrough the calculation review, employee concern,and CAQR programs. In order to determine thesignificance of these issues, i.e., whether theexisting hardware meets design requirements orwhether modifications would be required, theevaluations will be based on criteria compatiblewith current practices. This will include the SiteSpecific Response Spectra (SSRS) developed for WBNevaluations which were reviewed and concurred by theNRC in the SER. It will also include soil-structureinteraction analysis methods (strain-dependent soilproperties and damping) that are consistent with theStandard Review Plan.
The criteria for SSRS analysis and the significantparameters related to the criteria, called Set B,are shown in Table 4.
4.3.5.3 Reanalysis Using the Original Criteria and CurrentModeling Techniques
Category I structures will be reanalyzed using theoriginal criteria with modeling improvements,consistent with the current techniques, to develop anew set of response spectra, called Set C. The newanalyses will also include soil-structureinteraction analysis methods (strain-dependent soilproperties and damping) that are consistent with theStandard Review Plan.
The criteria for this reanalysis and the significantanalysis parameters are shown in Table 5. Comparisonof Tables 3 and 5 indicates that the two sets ofcriteria are identical except in the area of modeling(including modal and spatial combinations, and SSImethodology) where current practices differ fromthose used during the original analysis.
4.3.5.4 Use of Results from Various Analyses
In order to assure uniformity of application andcorrect interpretation of the results generated fromvarious analyses, the following guidelines areestablished:
Set A Results:
Set B Results:
Results of Set A analyses (e.g., ARS, forces, anddisplacements) are the design data of record.Calculations supporting existing structures,systems, and components are based on Set A results.Any new calculations for new design or modificationsshall be generated as described later in thissection.
ARS from the original analyses are termed OriginalSpectra.
Results of Set B analyses (e.g., ARS, forces, anddisplacements) will be used to evaluate adequacy ofstructures, systems, and components. Theevaluations will be performed in accordance withspecific CAP requirements such as HAAUP, HYAC, CableTray, Conduit, Equipment Seismic, and InstrumentLines. These evaluations can be performed at thespectra level or component level.
ARS from Set B results are termed Evaluation Spectra.
-8-
Envelope ofSet B andC Results: Results obtained by enveloping the Set B and Set C
(e.g., ARS, forces, and displacements) will be usedfor new designs or modifications. Any class ofcomponents or individual items that are not designedusing the original seismic design basis i.e., Set AARS, will require new calculations based on theenvelope of Set B and C results.
The envelope of Set B and C ARS are termed NewDesign or Modification Spectra.
4.3.5.5 Criteria for Evaluation and New Design orModification of Structures, Systems, and Components
The various structural analyses discussed above andtheir use are summarized in Table 6 for eachstructure housing Category I systems andcomponents. The criteria used for original analysisof the Additional Diesel Generator Building will beeliminated. New analysis will be performed togenerate Set B and Set C results.
The Young's and shear moduli of the concrete havebeen reevaluated for use in the reanalyses. Theevaluation concluded that lower moduli values shouldbe used for Interior Concrete Structure, AdditionalDiesel Generator Building, and North Steam ValveRoom. The revised moduli will be incorporated intoboth Set B and Set C analysis.
As shown in Table 6 and as discussed inSection 4.3.5.41, evaluation of structures and thesystems and components contained in these structureswill be based on Set B. For rigorously analyzedpiping, the envelope of Set B and C response spectrawill be used in the HAAUP program. The scope of'evaluations for systems and components are discussedin the other CAPs (Cable Tray, Conduit, HVAC,Instrument Lines., HAAUP, and Equipment SeismicQualification) in detail. Any new design ormodification of structures, systems, and componentswill be based on the envelope of Set B and C.

The criteria and methodology to be used in theevaluations and new designs or modifications ofsystems and components are shown in Table 7. Asshown in the table, damping values based onRegulatory Guide 1.61, Code Case N~411, and applicabletest data will be used. Damping values for eachcommodity are shown in Table 8. Use of higherdamping is justified since the evaluation criteria(Set B) are consistent with the SRP provisions. Thenew design or modification criteria (envelope of SetB and C) is more conservative than the evaluationcriteria and, therefore, use of higher damping valuesis appropriate for this case also.
The analysis techniques to be used for system andcomponent analysis in the new work are alsoconsistent with the SRP provisions. Equivalentstatic, response spectrum, and time-history analysismethods will be used. The time-history analysismay be used if the system input time-history recordsare demonstrated to contain sufficient energy over theentire frequency range by an analysis of its powerspectral density. Uncertainties in time-historyanalysis will be addressed through the use of peakshifting technique.
In the design of structures, systems, and componentsthe 2D absolute sum method will continue to be usedfor structures and commodities except piping. Thisis consistent with the FSAR requirements. Studiesshow that the difference resulting from the use of 2Dabsolute sum and 3D square-root-of-sum-of-squares issmall and, therefore, use of the 2D absolute summethod for maintaining the licensing basis andcontinuity is acceptable. For piping analysis, the3D SRSS approach will be used, as indicated inTable 7 in order to be able to use N411 dampingvalues.
In summary, the seismic criteria for systems andcomponents as shown in Tables 7 and 8, when used inconjunction with ARS from the new analyses, willprovide assurance that WBN plant will have beendesigned to meet licensing requirements and to beconsistent with the current SRP provisions.
4.4 Recurrence Control
The root cause identified in this CAP has been addressed through
procedural improvement.
A procedure is now in place (N~EP 3.1) to ensure that engineeringjudgments used in the design process will be adequately documented.
-10-
4.5 Licensing Assessment
In order to resolve the issues identified in this CAP and toestablish the seismic design basis for future work, revisions to thedesign criteria and FSAR may be necessary. Any changes to thelicensing commitments will be proposed only when technicallyjustified.
5.0 PROGRAM INTERFACES
The ARS are used in the design of safety-related systems and components.Therefore., the output of this CAP will provide input to other CAPs suchas HAAUP, Cable Trays, Conduit, Instrument Lines, HVAC, and EquipmentSeismic Qualification.
6.0 PROGRAM IMPLEMENTATION
Nuclear Engineering (NE) is the lead organization for implementing andcompleting the Seismic Analysis CAP. Calculations will be performed inaccordance with standard TVA procedures and practices.
7.0 PROGRAM DOCUMENTATION
Results of this CAP will be documented in design criteria, calculationsand reports. The FSAR revisions resulting from this CAP will besubmitted to the NRC. Affected documents will be revised in accordancewith NE procedures. A final report will be prepared documenting theresults of evaluations performed to resolve identified issues.
8.0 CONCLUSION
The completion of the Seismic Analysis CAP will confirm that the seismicanalysis of structures and the ARS generated from the analyses aretechnically adequate and satisfy licensing requirements. In addition,related employee concern and CAQRs dealing with seismic analysis issueswill be resolved.
9.0 REFERENCE
1. Dynamic Earthquake Analysis of Category I Structures and EarthEmbankments, WB-DC-20-24, Revision 3, July 1988
-11-
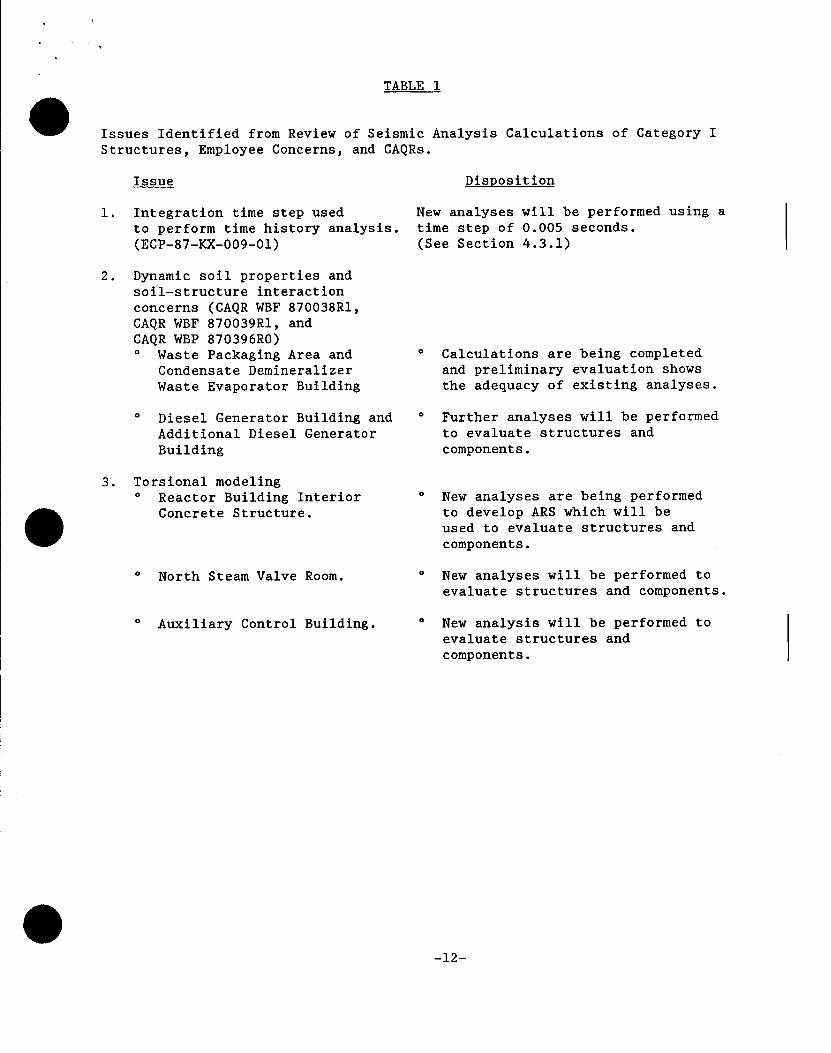
TABLE 1
Issues Identified from Review of Seismic Analysis Calculations of Category IStructures, Employee Concerns, and CAQRs.
Issue Disposition
1. Integration time step usedto perform time history analysis.(ECP-87-KX-009-01)
2. Dynamic soil properties andsoil-structure interactionconcerns (CAQR WBF 870038R1,CAQR WBF 870039R1, andCAQR WBP 870396R0)O Waste Packaging Area and
Condensate DemineralizerWaste Evaporator Building
o Diesel Generator Building and
Additional Diesel GeneratorBuilding
3. Torsional modelingo Reactor Building Interior
Concrete Structure.
" North Steam Valve Room.
o Auxiliary Control Building.
New analyses will be performed using atime step of 0.005 seconds.(See Section 4.3.1)
" Calculations are being completed
and preliminary evaluation showsthe adequacy of existing analyses.
O Further analyses will be performed
to evaluate structures andcomponents.
0 New analyses are being performed
to develop ARS which will beused to evaluate structures andcomponents.
O New analyses will be performed to
evaluate structures and components.
" New analysis will be performed to
evaluate structures andcomponents.
-12-

COMPARISON OF SEISMIC ANAL* CRITERIA, FSAR, AND SERFOR SEISMIC CATEGORY I STRUCTURES
ATTRIBUTE
DYNAMIC ANALYSISPARAMETERS
DESIGN CRITERIA (DC)(1 ,2 )
WB-DC-20-24, Rev. 3FSAR SER
Sheet 1 of
DIFFERENCES BETWEENDC AND FSAR, SER
Design Response Spectra(input ground motionspectra)
Max. top-of-rock SSE:accelerations OBE:
Ratio of vertical tohorizontal responsespectrum
Design time histories(input ground motionT-H)
O Modified Newmark
o 0.18 gH, 0.12gVo 0.09gH, 0.06gV
(3.1)
o 2/3 to 1(3.1)(3.2.1.2)
* 4 artificial E/Q'sO The same 4 T-Hs are
used in all 3 directions
O Same (3)
(2.5.2.6)(2.5.2.7)(3.7.1.1.1)
o Same (5)
(2.5)(3.7.1.1.1)
o Same
(3.7.1.1.1)(3.7.2.4.1)
O Same(3.7.1.2.1)
O Same (4)
(2.5.2.1)(3.7.1)
O Same(2.5)(3.7.1)
o No explicit
statement.Concurrencewith FSARis implicitper section3.7.1.
= No explicit
statement.Concurrencewith FSAR isimplicit persection 3.7.2.
o None - Design basishas been accepted byNRC based on sitespecific spectraevaluation
o None
o None
o None
Notes:
01) This Column indicates design criteria provisions. If no explicit statement is included in DC, the columnindicates the actual methodology adopted in analysis.
(2) Basis of comparisons is revision 3 of WB-DC-20-24. Design criteria will be revised to include thecriteria for evaluation and new design or modification of structures, systems, and componentsdiscussed in Section 4.3.5 of this CAP.
(3) FSAR provision same as DC. (Typical for FSAR column.)(4) SER agrees with FSAR. (Typical for SER column.)(5) Due to a typo, the FSAR in Section 3.7.1.1.1 states that the OBE horizontal acceleration is 0.08g, not
0.09g and that the OBE vertical acceleration is 0.6g, not 0.06g.
-13-

Sheet 2
COMPARISON OF SEISMIC ANAM'•IS CRITERIA, FSAR, AND SERFOR SEISMIC CATEGORY I STRUCTURES
ATTRIBUTE
Frequency (period)interval for generatingground motion inputspectra
DESIGN CRITERIA (DC)WB-DC-20-24, Rev. 3
O Calculated at 55 periods(Table 6)
FSAR
O Table does 0
not coverperiod range.03 to .05 sec.(Table 3.7-1)
No explicitstatement.Concurrencewith FSAR isimplicit perSection 3.7.2
DIFFERENCES BETWEENDC AND FSAR, SER
0 Minor differences
FSAR will beupdated
Damping values
Supporting media
DYNAMIC ANALYSISMETHODS
Analysis method
o FSAR Table 3.7-2A
o Shear wave velocity andembedment and overburdendepths are defined
O Time-history modal analysis
using four artificialearthquake records forgeneration of ARS andResponse Spectrum Analysis(RSA) for structuralloads (3.2.1)
O Same 0 Same
(Table 3.7-2A) (3.7.1)
o Same(Table 3.7-3)(3.7.1.4)
Same(3.7.2.1)
o No explicitstatement.Concurrencewith FSAR isimplicit perSection 3.7.2.
O Same
(3.7.2)
0 Integration time step0.01 sec
O Same(3.7.2.5.1)
o No explicit
statement.Concurrencewith FSAR isimplicit persection 3.7.2.
o None - Howeveradequacy of timestep has beenaddressed.
-14-
o None
o None
o None
Sheet 3 of
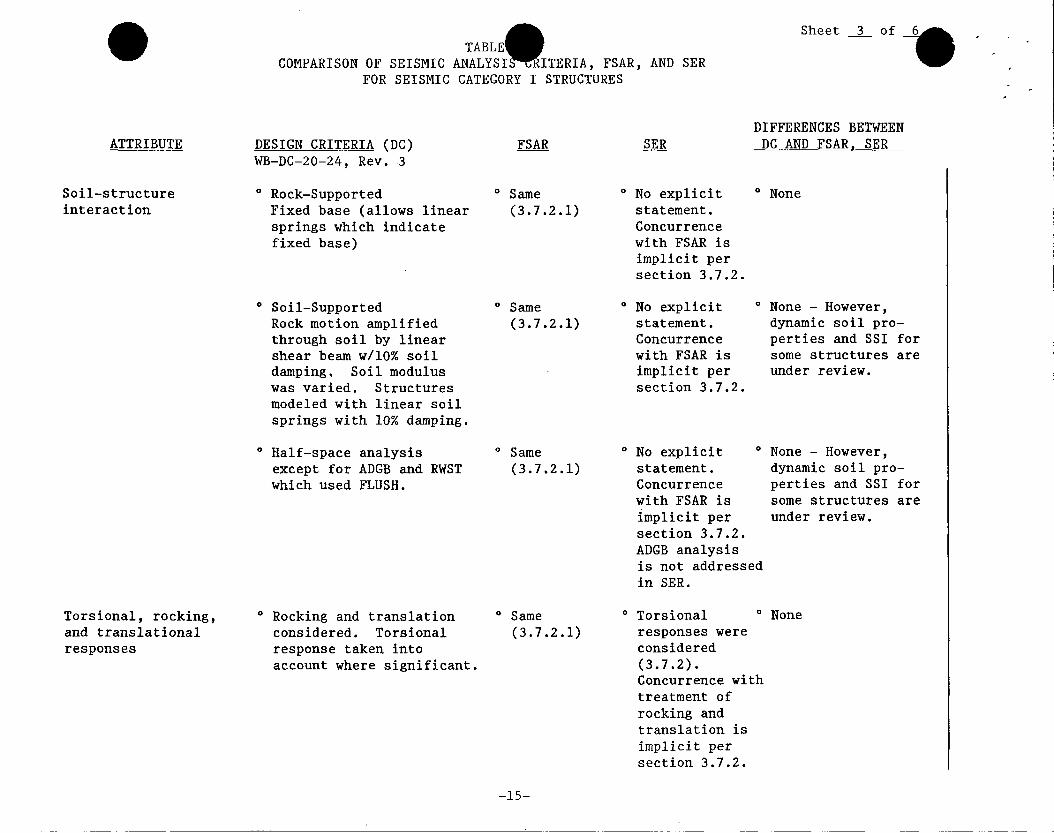
TABLE-COMPARISON OF SEISMIC ANALYSI ITERIA, FSAR, AND SER
FOR SEISMIC CATEGORY I STRUCTURES
ATTRIBUTE DESIGN CRITERIA (DC)WB-DC-20-24, Rev. 3
DIFFERENCES BETWEENDC AND FSAR, SERFSAR
Soil-structureinteraction
O Rock-SupportedFixed base (allows linearsprings which indicatefixed base)
0 Same(3.7.2.1)
O No explicitstatement.
Concurrence
with FSAR is
implicit per
section 3.7.2.
O Soil-Supported
Rock motion amplifiedthrough soil by linearshear beam w/10% soildamping. Soil moduluswas varied. Structuresmodeled with linear soilsprings with 10% damping.
" Half-space analysis
except for ADGB and RWSTwhich used FLUSH.
o Same(3.7.2.1)
o Same
(3.7.2.1)
0 No explicit
statement.
Concurrence
with FSAR isimplicit persection 3.7.2.
o No explicit °
statement.Concurrence
with FSAR isimplicit persection 3.7.2.ADGB analysisis not addressedin SER.
None - However,dynamic soil pro-perties and SSI forsome structures areunder review.
None - However,dynamic soil pro-perties and SSI forsome structures areunder review.
Torsional, rocking,and translationalresponses
o Rocking and translationconsidered. Torsionalresponse taken intoaccount where significant.
o Same
(3.7.2.1)0 Torsional 0 None
responses wereconsidered(3.7.2).Concurrence withtreatment ofrocking andtranslation isimplicit persection 3.7.2.
-15-
* None

Sheet 4 ofTABLE -
COMPARISON OF SEISMIC ANALYSI 9ITERIA, FSAR, AND SERFOR SEISMIC CATEGORY I STRUCTURES
ATTRIBUTE DESIGN CRITERIA (DC)WB-DC-20-24, Rev. 3
DIFFERENCES BETWEENDC AND FSAR, SERFSAR
Methods to accountfor torsional effects
Adequate number ofmasses
Adequate number ofmodes to assureparticipation ofsignificant modes
Maximum relativedisplacementsbetween structures
Acceleration timehistory or responsespectra at floors
o Lumped-mass modelsconsidered eccentricitiesbetween center ofrigidity andcenter of mass
o Responses calculated
at extreme points.
O Based on judgment.
Mass points were locatedat floor slabs, change togeometry, and atintermediate points.
o Response to be calculated
using all significantmodes (3.2.1)
0 Maximum relative
displacements werecalculated by sum ofthe absolute values
o Response spectra generated
at ground level, at allmajor floors, and at otherpoints where input isneeded for further analysis(3.2.2).
o Same
(3.7.2.11)
o Same(3.7.2.1)
o Same
(3.7.2.1)Modesconsideredare shown intables.
o Same
(3.7.3.8.4)
= Same
(3.7.2.5.1)
Torsionaleffects wereconsidered.(3.7.2)
o No explicitstatement.Concurrencewith FSAR isimplicit persection 3.7.2.
o No explicit
statement.Concurrencewith FSAR isimplicit perSection 3.7.2.
o No explicit
statement.Concurrencewith treatmentof supportmotions isimplicit inSection 3.7.3.
o None
o None
O None
o None
O No explicit 0 None
statement.Concurrence with
FSAR is implicit
in Section 3.7.2.
-16-

2COMPARISON OF SEISMIC ANA[S CRITERIA, FSAR, AND SER
FOR SEISMIC CATEGORY I STRUCTURES
ATTRIBUTE
ANALYTICAL MODELING
Decoupling criteria
for subsystems
Modeling for three
components of inputmotion
DESIGN CRITERIA (DC)WB-DC-20-24, Rev. 3
o No explicit statement fordecoupling. Subsystemswere considered rigidin analysis.
o Three components of input
motion were considered.However, no coupling ofhorizontal and verticalanalyses (3.2.1).
FSAR
o Same(3.7.2.3).
o Same
(3.7.2.1)
SER
" No explicitstatement.Concurrencewith FSAR isimplicit perSection 3.7.2.
o No explicit
statement.Concurrencewith FSAR isimplicit persection 3.7.2.
Sheet 5 _
DIFFERENCES BETWEENDC AND FSAR, SER
" None
O None
DEVELOPMENT OF FLOORRESPONSE SPECTRA
Note:
O Fixed and variable (N411) 0
Damping (2)O Spectra broadened by + 10%O Optional use of ASME Code
Case N-397 for peakshifting (2)
o Torsion calc at extreme edges" Spectra was computed for 0
55 periods given in Table 6and at significant periodsof the structure and atstructural periods shiftedby fine interval.
" Vertical spectra generatedusing wall stiffnesses andvertical input motion only.(I)(3.2.2)
Same(3.7.2.9)
0 Development of 0
floor responsespectra wasreviewed (3.7.2).
Minor differencesin period range.FSAR will beupdated.
Cable does notcover periodrange.03 to .05 sec(Table 3.7-1)
(1) A study is being performed to evaluate the effects of floor vertical flexibility on systemsand components.
(2) Added after SER.
-17-

TABLEý
COMPARISON OF SEISMIC ANALYSIS ITERIA, FSAR, AND SER
FOR SEISMIC CATEGORY I STRUCTURES
ATTRIBUTE
THREE COMPONENTS OFEARTHQUAKE MOTION
COMBINATION OF MODALRESPONSES
INTERACTION OFNON-CAT I WITHCAT I STRUCTURES
USE OF EQUIVALENTSTATIC FACTORS
DESIGN CRITERIA (DC)
WB-DC-20-24, Rev. 3
" Critical horizontal
responses combined withvertical by ABSUM.
" Modes combined by SRSS.
Closely spaced modes bythe grouping method inRG 1.92.
O Need to consider
interaction of non-Cat Iwith Cat I structures.
O Vertical ARS were developed
considering structuralamplification
FSAR
O Same 0 Same(3.7.2.10.1.1) (3.7.3)
O Same
(3.7.2.7.1.1)
O Same
(3.7.2.8)
" Same
(3.7.2)
o Same
(3.7.2)
o Same 0 Same(3.7.2.10.1.1) (3.7.2)
Sheet 6 of 6
DIFFERENCES BETWEENDC AND FSAR. SER
* None
o None
o None
* None
COMPARISON OF RESPONSES 0
COMPOSITE MODALDAMPING
Results for responsespectra and time history
analysis of ICS provided
in FSAR Figure 3.7-38.
o For rock-supportedstructures, no need toconsider composite modaldamping.
O For soil-supported
structures, modal dampingwas limited to 10%.
o Structure overturning
moments were calculatedfor critical horizontalresponse combined withvertical.
O Same(3.7.2.12)(Figure3.7-38)
O Same(3.7.2.15)
O Same(3.7.2.14.1)
" No explicitstatement.Concurrencewith FSAR isimplicit perSection 3.7.2.
" No explicit
statement.Concurrencewith FSAR isimplicit perSection 3.7.2.
o None
0 None
O Same 0 None
Stabilityagainstoverturningwas considered.(3.7.2)
-18-
STRUCTURE OVERTURNINGMOMENTS
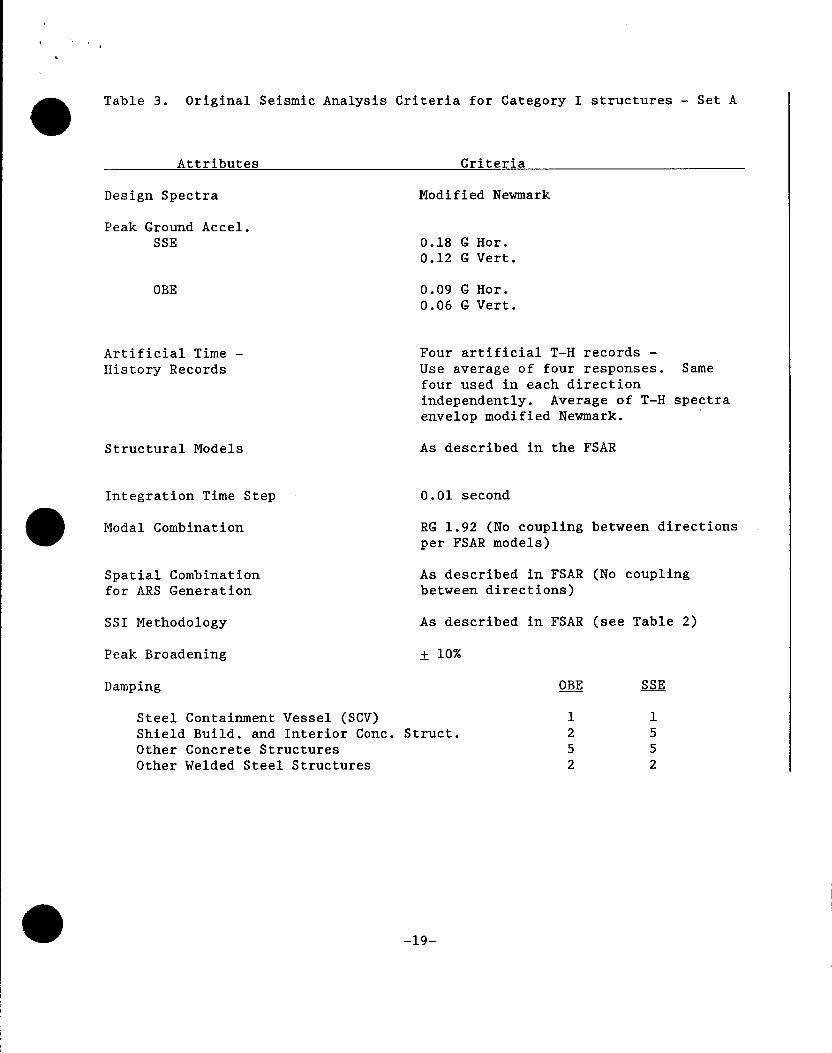
Table 3. Original Seismic Analysis Criteria for Category I structures - Set A
Attributes Criteria
Design Spectra
Peak Ground Accel.
SSE
OBE
Modified Newmark
0.18 G Hor.0.12 G Vert.
0.09 G Hor.0.06 G Vert.
Artificial Time -History Records
Structural Models
Integration Time Step
Modal Combination
Spatial Combinationfor ARS Generation
Four artificial T-H records -Use average of four responses. Samefour used in each directionindependently. Average of T-H spectraenvelop modified Newmark.
As described in the FSAR
0.01 second
RG 1.92 (No couplingper FSAR models)
As described in FSARbetween directions)
between directions
(No coupling
SSI Methodology
Peak Broadening
As described in FSAR (see Table 2)
+ 10%
OBEDamping
Steel Containment Vessel (SCV)Shield Build. and Interior Conc. Struct.Other Concrete StructuresOther Welded Steel Structures
-19-
SSE
1552
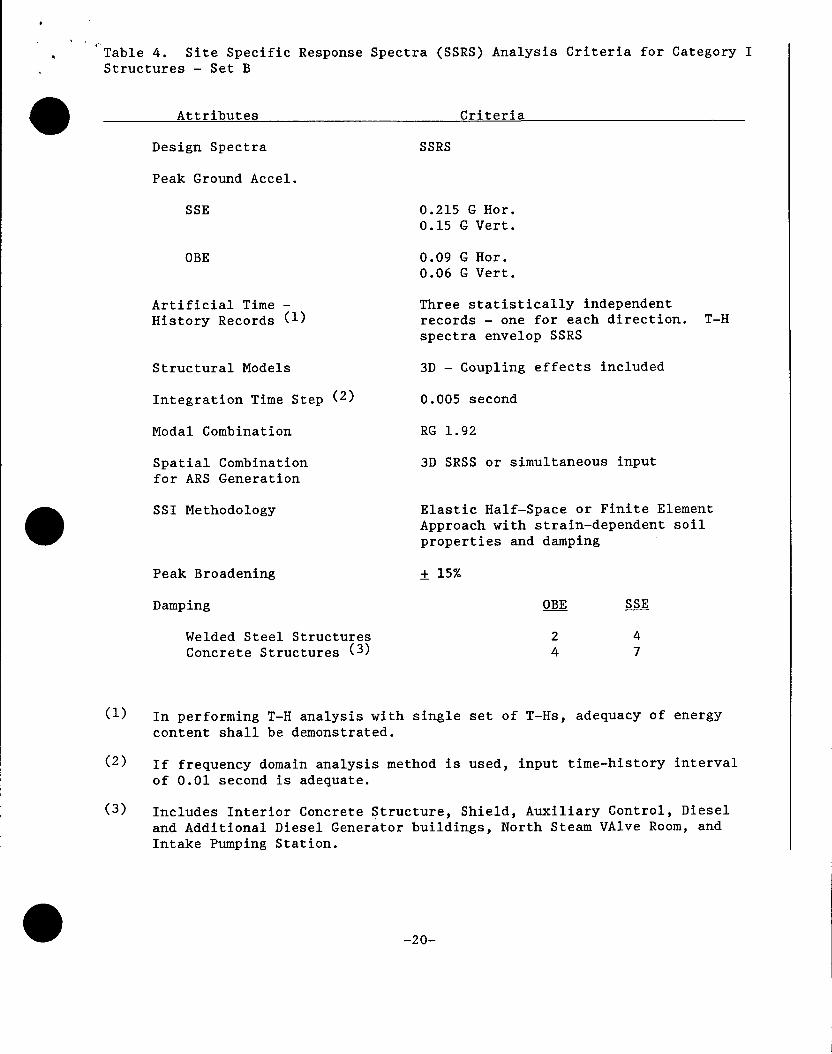
Table 4. Site Specific Response Spectra (SSRS) Analysis Criteria for Category IStructures - Set B
('vi I-pr! ~
Design Spectra
Peak Ground Accel.
SSRS
0.215 G Hor.0.15 G Vert.
0.09 G Hor.0.06 G Vert.
Artificial Time -
History Records (1)
Structural Models
Integration Time Step (2)
Modal Combination
Spatial Combinationfor ARS Generation
SSI Methodology
Peak Broadening
Damping
Three statistically independentrecords - one for each direction. T-Hspectra envelop SSRS
3D - Coupling effects included
0.005 second
RG 1.92
3D SRSS or simultaneous input
Elastic Half-Space or Finite ElementApproach with strain-dependent soilproperties and damping
+ 15%
OBE
Welded Steel StructuresConcrete Structures (3)
SSE
47
i-L) In performing T-H analysis with single set of T-Hs, adequacy of energycontent shall be demonstrated.
(2) If frequency domain analysis method is used, input time-history interval
of 0.01 second is adequate.
(3) Includes Interior Concrete Structure, Shield, Auxiliary Control, Dieseland Additional Diesel Generator buildings, North Steam VAlve Room, andIntake Pumping Station.
-20-
SSE
OBE
A t- V -ri'hiit a c C-4 teria
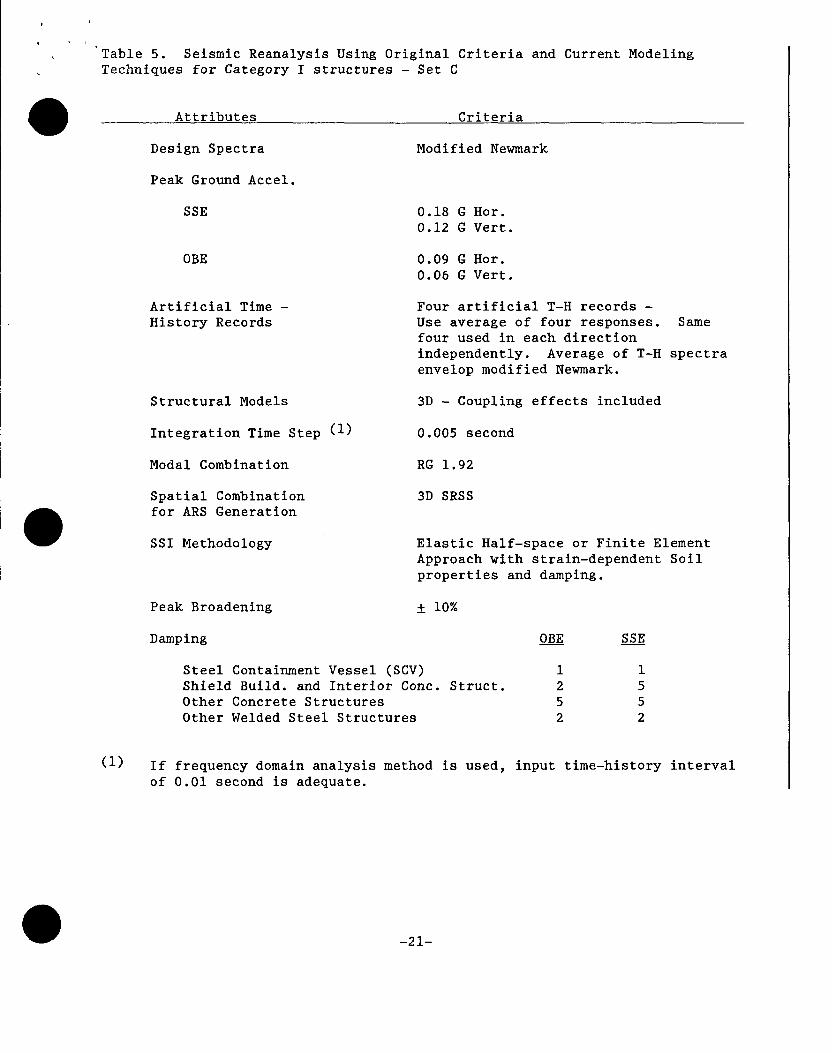
Table 5. Seismic Reanalysis Using Original Criteria and Current ModelingTechniques for Category I structures - Set C
Attributes Criteria
Design Spectra
Peak Ground Accel.
SSE
OBE
Modified Newmark
0.18 G Hor.0.12 G Vert.
0.09 G Hor.0.06 G Vert.
Artificial Time -History Records
Structural Models
Integration Time Step (i)
Modal Combination
Spatial Combinationfor ARS Generation
SSI Methodology
Peak Broadening
Four artificial T-H records -Use average of four responses. Samefour used in each directionindependently. Average of T-H spectraenvelop modified Newmark.
3D - Coupling effects included
0.005 second
RG 1.92
3D SRSS
Elastic Half-space or Finite ElementApproach with strain-dependent Soilproperties and damping.
+ 10%
Damping
Steel Containment Vessel (SCV)Shield Build. and Interior Conc. Struct.Other Concrete StructuresOther Welded Steel Structures
OBE SSE
1552
If frequency domain analysis method is used, input time-history intervalof 0.01 second is adequate.
-21-
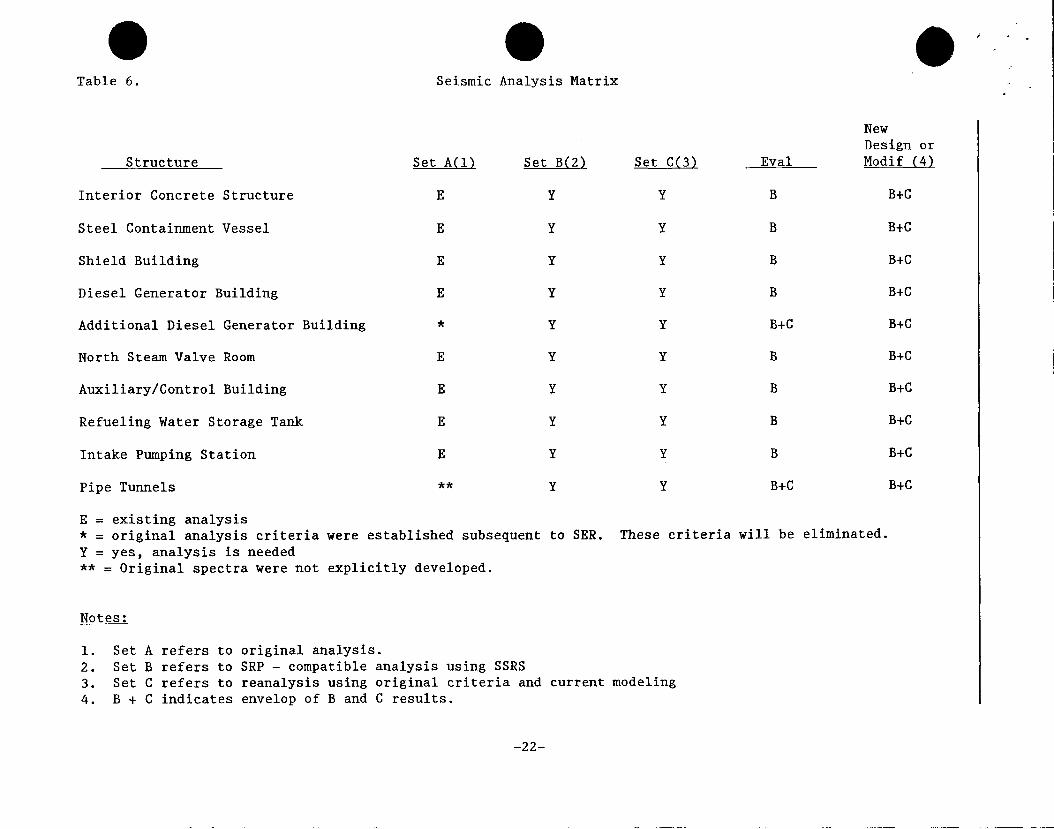
Seismic Analysis Matrix
Structure Set A(l) Set
Interior Concrete Structure E
Steel Containment Vessel E
Shield Building E
Diesel Generator Building E
Additional Diesel Generator Building *
North Steam Valve Room E
Auxiliary/Control Building E
Refueling Water Storage Tank E
Intake Pumping Station E
Pipe Tunnels **
E = existing analysis* = original analysis criteria were established subsequentY = yes, analysis is needed** = Original spectra were not explicitly developed.
tB(2)
Y
Y
Y
Y
Y
Y
Y
Y
Y
Y
Set C(3)
Y
Y
Y
Y
Y
Y
Y
Y
Y
Y
Eval
B
B
B
B
B+C
B
B
B
B
B+C
NewDesign orModif (4)
B+C
B+C
B+C
B+C
B+C
B+C
B+C
B+C
B+C
B+C
to SER. These criteria will be eliminated.
Notes:
1. Set A refers to original analysis.
2. Set B refers to SRP - compatible analysis using SSRS3. Set C refers to reanalysis using original criteria and current modeling
4. B + C indicates envelop of B and C results.
-22-
Table 6.
) -

Table 7. Seismic Criteria and Methodology for Systems and Components forEvaluation and New Design or Modification
(~rii-pr~ nnei Mpt-hotloloRv
Damping for Sets B, C,and the envelop of B and C(See Table 8 for values)
Use0
0
Use0
0
0
Analysis techniques
Accounting for Uncertainties
Spatial Combinations
damping values based onRG 1.61N411Test Results
SRP - Compatible approachesEquivalent StaticResponse Spectrum Analysis (RSA)T-H Analysis (THA) (1)
Peak broadening (RSA)Peak shifting (THA)
2D Absolute sum except for piping
3D Square-root-of-sum-of-squares for
piping
(1) In performing T-H analysis with single set of T-Hs, adequacy of energy
content shall be demonstrated.
-23-
A +- +- ý 4'k" t- a a Criteria and Methodolopv
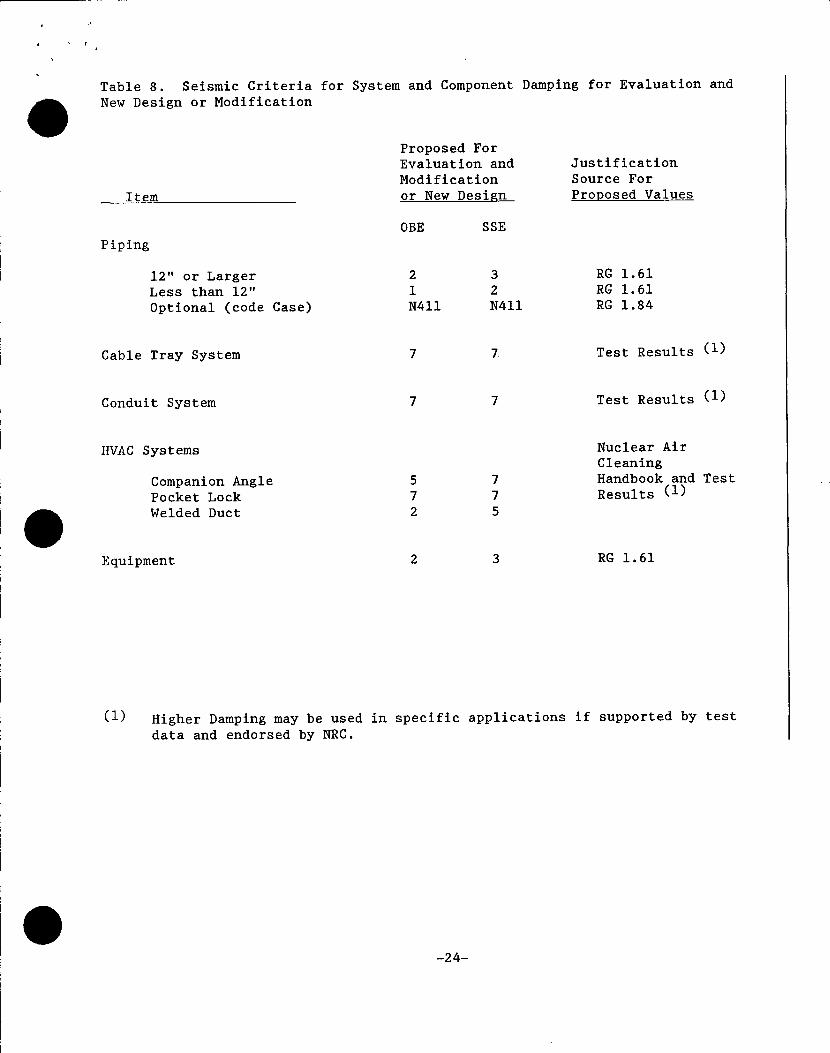
Table 8. Seismic Criteria for System and Component Damping for Evaluation andNew Design or Modification
Proposed ForEvaluation andModificationor New Design
JustificationSource ForProposed Values
12"1 or LargerLess than 12"Optional (code Case)
Cable Tray System
Conduit System
HVAC Systems
Companion AnglePocket LockWelded Duct
Test Results(1
Test Results(1
Nuclear AirCleaningHandbook and TestResults (1)
RG 1.61Equipment
() Higher Damping may be used in specific applications if supported by test
data and endorsed by NRC.
-24-
Item
Piping
21N4 11
32N4 11
RG 1. 61RG 1. 61RG 1.84
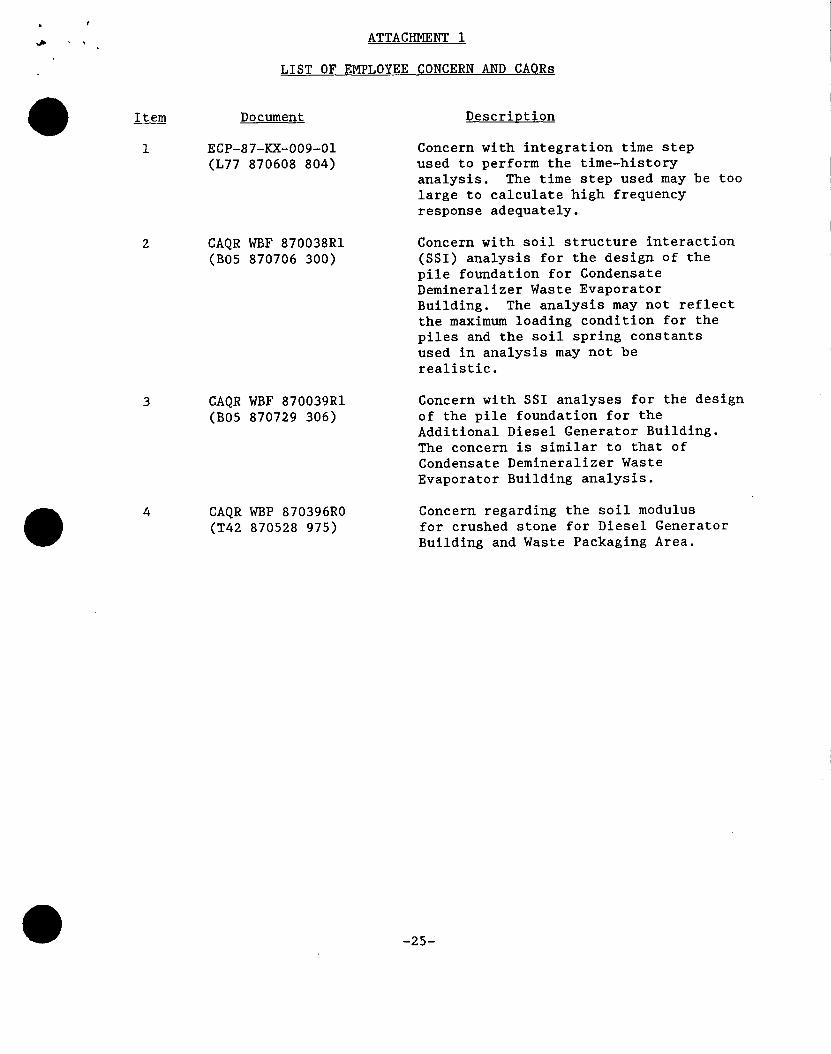
ATTACHMENT 1
LIST OF EMPLOYEE CONCERN AND CAQRs
Item
1
2
3
4
Document
ECP-87-KX-009-01(L77 870608 804)
CAQR WBF 870038R1(B05 870706 300)
CAQR WBF 870039R1(B05 870729 306)
CAQR WBP 870396R0(T42 870528 975)
-25-
Description
Concern with integration time step
used to perform the time-history
analysis. The time step used may be too
large to calculate high frequencyresponse adequately.
Concern with soil structure interaction
(SSI) analysis for the design of the
pile foundation for Condensate
Demineralizer Waste Evaporator
Building. The analysis may not reflect
the maximum loading condition for the
piles and the soil spring constants
used in analysis may not be
realistic.
Concern with SSI analyses for the design
of the pile foundation for the
Additional Diesel Generator Building.
The concern is similar to that of
Condensate Demineralizer Waste
Evaporator Building analysis.
Concern regarding the soil modulus
for crushed stone for Diesel Generator
Building and Waste Packaging Area.
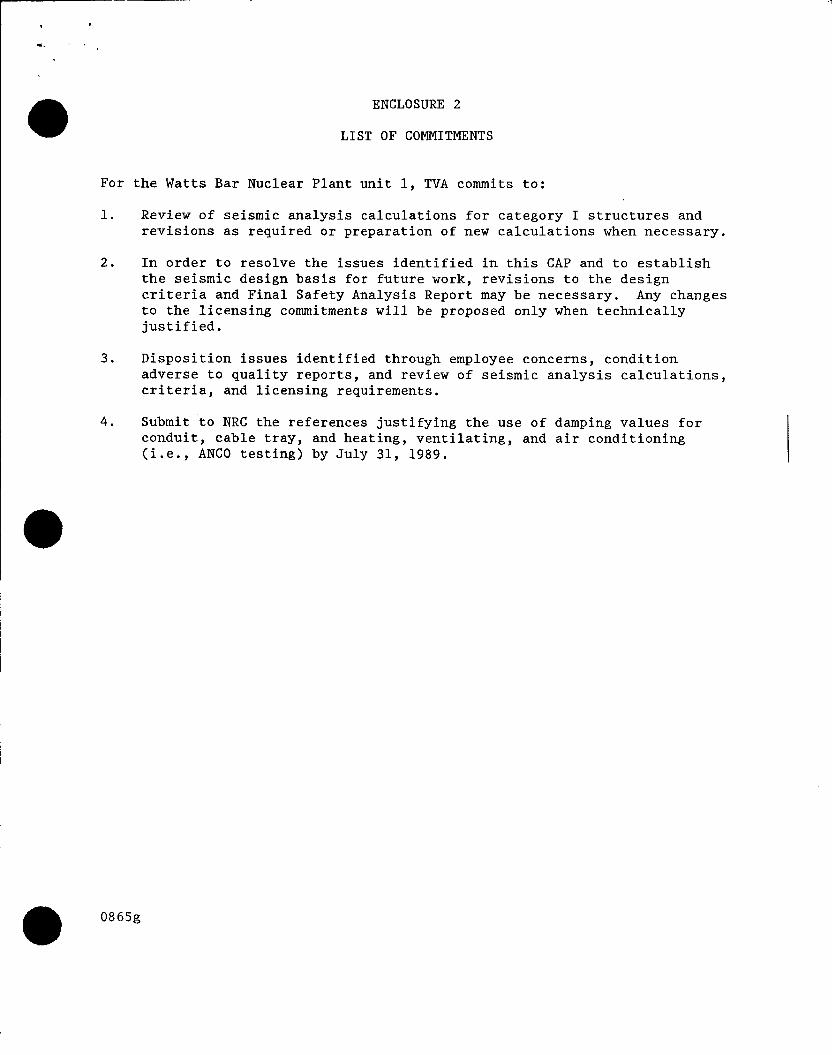
ENCLOSURE 2
LIST OF COMMITMENTS
For the Watts Bar Nuclear Plant unit 1, TVA commits to:
1. Review of seismic analysis calculations for category I structures andrevisions as required or preparation of new calculations when necessary.
2. In order to resolve the issues identified in this CAP and to establishthe seismic design basis for future work, revisions to the designcriteria and Final Safety Analysis Report may be necessary. Any changesto the licensing commitments will be proposed only when technicallyjustified.
3. Disposition issues identified through employee concerns, conditionadverse to quality reports, and review of seismic analysis calculations,criteria, and licensing requirements.
4. Submit to NRC the references justifying the use of damping values forconduit, cable tray, and heating, ventilating, and air conditioning(i.e., ANCO testing) by July 31, 1989.
0865g

ENCLOSURE 3
RESPONSES TO ACTION ITEMS RESULTINGFROM NUCLEAR REGULATORY COMMISSION (NRC)/TVA MEETING
OF FEBRUARY 7 AND 8, 1989ON SEISMIC ANALYSIS CORRECTIVE ACTION PROGRAM (CAP) PLAN
1. TVA is to submit a revision to the seismic analysis CAP to reflect the"Set B" and "Set C" criteria and how TVA will use each criteria set.
Response: The revised CAP which reflects the "Set B" and "Set C"criteria and how TVA will use each criteria set is provided asenclosure 1 to this submittal. The revision also incorporatescomments resulting from an informal NRC/TVA meeting held onMarch 22, 1989, atKnoxville, TN.
2. TVA will provide a copy of the seismic design criteria when revised toreflect "Set B" and "Set C" criteria.
Response: The revised Seismic Design Criteria WB-DC-20-24, revision 4,reflects the "Set B" and "Set C" criteria incorporated in thisCAP plan revision and is available for NRC review.
3. TVA and NRC are to assess the use of envelope of the amplified response
spectra (ARS) obtained from "Set B" and "Set C" analysis for use with
American Society of Mechanical Engineers (ASME) Code Case N-411.
Response: A conference call was held on March 9, 1989, between TVA and
NRC, and it was agreed that the envelope of "Set B" and "Set
C" response spectra may be used for piping analysis with ASME
Code Case N-411 damping. It was also agreed that any
modifications or new design of structures or other commodities
can also use an envelope of "Set B" and 'Set C" response
spectra. This position is incorporated in the revised seismic
analysis CAP and design criteria.
4. Table 2 of the seismic CAP needs to be clarified in a number of areas toexplicitly convey TVA's intent (e.g., explain what is meant by "same").
Response: The revised CAP (enclosure 1) incorporates the appropriaterevisions in Table 2 to clarify areas where "same" is used andthe intent of the table.
5. TVA and NRC are to check on the previous NRC acceptance of use of SASSIcomputer code.
Response: TVA has determined that the SASSI computer program to be usedfor WBN plant structures is the same version which was appliedto the seismic soil-structure interaction for the DiabloCanyon Power Plant Long Term Seismic Program. The resultsobtained from this version of the SASSI program were auditedby the NRC staff and its consultants and, subsequently,documented July 1987 in a trip report prepared by NRC'sconsultant, Dr. C. J. Constantino. Also, an NRC audit toassess the use of SASSI on WBN was held at Bechtel'sSan Francisco office on April 26, 1989.
ENCLOSURE 3
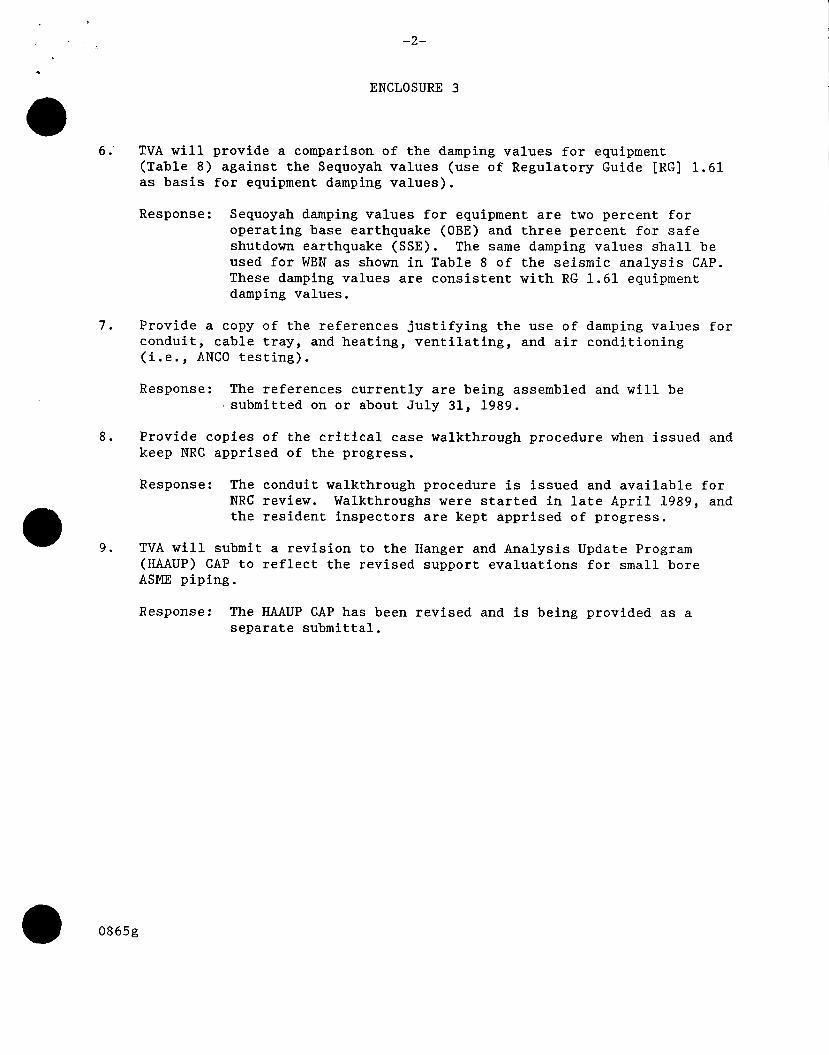
6. TVA will provide a comparison of the damping values for equipment(Table 8) against the Sequoyah values (use of Regulatory Guide [RG] 1.61as basis for equipment damping values).
Response: Sequoyah damping values for equipment are two percent foroperating base earthquake (OBE) and three percent for safeshutdown earthquake (SSE). The same damping values shall beused for WBN as shown in Table 8 of the seismic analysis CAP.These damping values are consistent with RG 1.61 equipmentdamping values.
7. Provide a copy of the references justifying the use of damping values forconduit, cable tray, and heating, ventilating, and air conditioning(i.e., ANCO testing).
Response: The references currently are being assembled and will besubmitted on or about July 31, 1989.
8. Provide copies of the critical case walkthrough procedure when issued andkeep NRC apprised of the progress.
Response: The conduit walkthrough procedure is issued and available forNRC review. Walkthroughs were started in late April 1989, andthe resident inspectors are kept apprised of progress.
9. TVA will submit a revision to the Hanger and Analysis Update Program(HAAUP) CAP to reflect the revised support evaluations for small boreASME piping.
Response: The HAAUP CAP has been revised and is being provided as aseparate submittal.
0865g

ENCLOSURE 4
APPENDIX 0
DYNAMIC SOIL AND BACKFILL PARAMETERS
SEISMIC ASSESSMENT REPORT
FOR
WATTS BAR NUCLEAR PLANT
0865g

WATTS BAR N•EAR PLANTSEISMIC ANALYSIS CAP FRAGNET
DEVELOPT-H RECORDS
REANALYZESTRUCTURES
ESTABLISHEVALUATIONSPECTRA &NEW DESIGN ORMODIFICATIONSPECTRA
NEW
EVALUATENEW ARS
OR MODIFICATION
EVALUATEEXCEEDANCES
FINALIZE CRITERIA NRC REVIEW OF& PREPARE FSAR REVISION FSAR REVISION
EVALUATE
ATTACHMENT 3
-27-VN COMP4UTER GRAPHlCS tCNC)
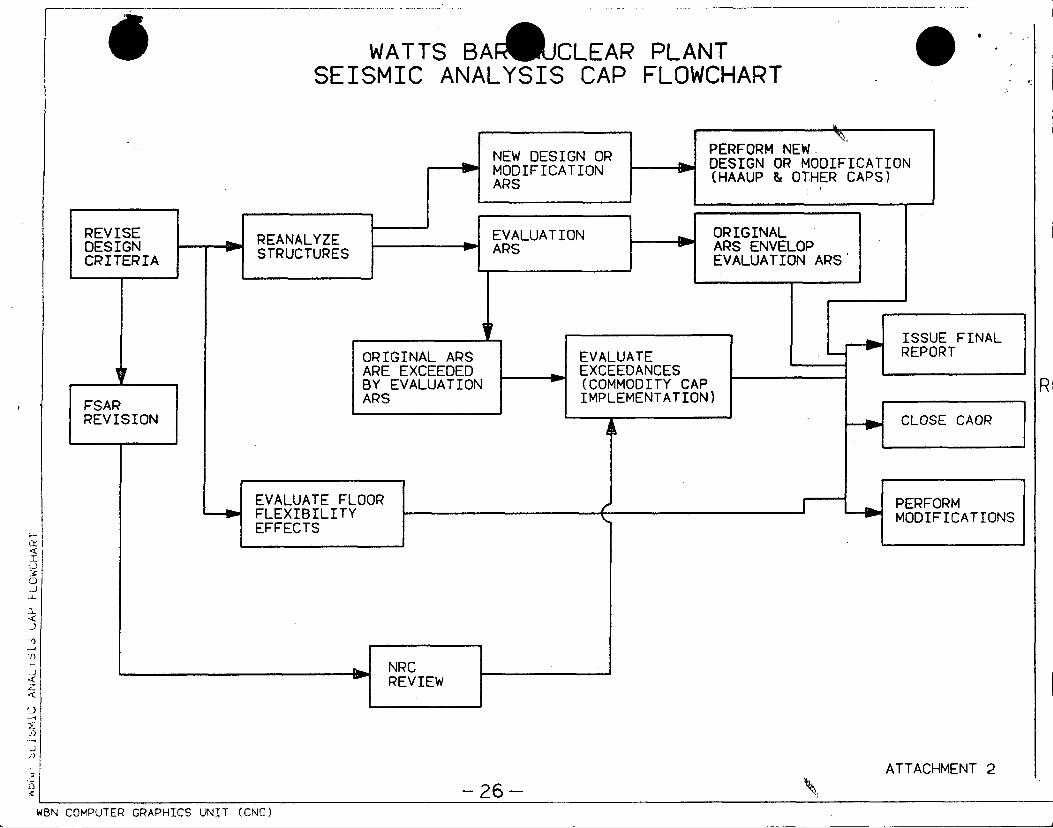
WATTS BAFJ CLEARSEISMIC ANALYSIS CAP
PLANTFLOWCHART
- 26-ATTACHMENT 2
-26--A U,WBN COMPUTER GRAPHICS UNIT (CNC]
APPENDIX 0
DYNAMIG-SOIL AND BACKFILL PARAMETERS
TABLE OF CONTENTS
01.0 INTRODUCTION ..............02.0 BACKGROUND ...............
02.1 WBN Site Geology ....... . .02.2 WBN Soil Supported Structures . . .
03.0 DYNAMIC SOIL PROPERTIES ... ...........03.1 Original Evaluation ............03.2 Consultant's Review of Dynamic Soil
04.0 FIELD AND LABORATORY DATA ..............05.0 BACKFILL MATERIALS - BECHTEL REVIEW . . .
05.1 Class A Backfill .........05.2 Crushed Stone Backfill ......
06.0 IN-SITU MATERIALS - BECHTEL REVIEW . . .06.1 In-Situ Cohesive Soils ......06.2 In-Situ Non-Plastic Soils .......06.3 Basal Gravel ...........06.4 Weathered Shale .... ...........
07.0 CONCLUSIONS AND RECOMMENDATIONS .......08.0 REFERENCES . . . . . ... . . . . . .
Properties
TABLES
0-1 CATEGORY I STRUCTURES/FEATURES SUPPORTED BYSOILS OR INFLUENCED BY SOILS .................
0-2 DYNAMIC SOIL PROPERTIES - ORIGINAL EVALUATIONS ... ...........0-3 DYNAMIC SOIL PROPERTIES - CONSULTANT'S REVIEW .........0-4 SHEAR WAVE VELOCITY FROM SEISMIC SURVEYS, IN-SITU SOILS ....0-5 SUMMARY OF RECOMMENDED DYNAMIC SOIL PROPERTIES ... ...........
FIGURES
0-1 SHEAR MODULUS VS MOISTURE CONTENT, REMOLDED CL LOW LEVELRADWASTE BORROW AREA ..................
0-2 SHEAR MODULUS VS MOISTURE CONTENT FROM SPT EMERGENCY RAWCOOLING WATER PIPELINE .................
0-3 SHEAR MODULUS REDUCTION WITH SHEAR STRAIN -CLASS A BACKFILL ....................
0-4 DAMPING RATIOS - CLASS A BACKFILL ....... .............0-5 SHEAR MODULUS REDUCTION WITH SHEAR STRAIN - CRUSHED
STONE BACKFILL . . . . . . . . . . . . . . . . . . . . .
OTGRT51403/29/89
Page
0-10-10-10-20-20-20-20-20-30-30-50-60-60-80-80-100-110-12
0-140-150-160-170-18
0-19
0-19
0-200-20
0-21
-.. APPENDIX 0
DYNAMIC SOIL-AND BACKFILL PARAMETERS
TABLE OF CONTENTS(Continued)
Page
FIGURES
0-6 DAMPING RATIOS - CRUSHED STONE BACKFILL ... ...........0-7 SHEAR MODULUS VS MOISTURE CONTENT, UNDISTURBED CL LOW
LEVEL RADWASTE BORROW AREA .........0-8 SHEAR MODULUS REDUCTION WlTH SHEAR STRAIN, IN-SITU
COHESIVE SOILS ..........0-9 DAMPING RATIOS, IN-SITU COHESIVE SOILS .........0-10 SHEAR MODULUS REDUCTION WITH SHEAR STRAIN,
NON-PLASTIC IN-SITU SOILS ...............0-11 DAMPING RATIOS, NON-PLASTIC IN-SITU SOILS .......... . .0-12 PARTICLE SIZE DISTRIBUTION FOR BASAL GRAVEL ... .......0-13 SHEAR MODULUS REDUCTION WITH SHEAR STRAIN - BASAL GRAVEL0-14 DAMPING RATIOS - BASAL GRAVEL ....... ...............0-15 SHEAR MODULUS AND DAMPTNG CHARACTERISTICS FOR ROCK . . .
0-21
0-22
0-220-23
. . . . 0-23. . . 0-24
. . . 0-24
. . . 0-250-25
. . . 0-26
ATTACHMENTS
0-1 CALCULATIONS .................................... 0-1-10-2 RECOMMENDED SOIL PROPERTIES FOR STRUCTURES WITH SOIL
STRUCTURE INTERACTION ......... .......... .............. . 0-2-1
,iG'R5 14041/13/89

APPENDIX 0
DYNAMIC SOIL AND BACKFILL PARAMETERS
01.0 INTRODUCTION
Major structures and features at WBN are supported on a variety offoundation media. Relatively large structures bear directly on thebedrock. Other structures are either founded on fill material overbasal gravel or supported by piles driven through in-situ soils to rock.
For soil supported structures, some concerns (CAQRs) have been raisedregarding the appropriateness of soil properties used in the soilstructure interaction and other analyses.
Soil properties selected by TVA and used in the original analyses ofWBN structures have been previously reviewed by other TVA consultantssuch as SWEC and Sargent and Lundy. As a part of SAP, Bechtel hasevaluated all previous work performed to date and using objectiveevidence such as contained in the borehole logs, laboratory test-results, geophysical surveys, and the research performed by others,evaluated the soil properties that would be appropriate for the seismicanalysis of WBN structures. This Appendix documents the Bechtel effortand provides recommended dynamic soil properties for TVA'sconsideration and use.
02.0 BACKGROUND
This section briefly describes the WBN site geology, and provides alisting of the various soil supported structures whose seismicresponses may be affected by use of modified dynamic soil properties.
02.1 WBN Site Geology
The site is characterized by unconsolidated alluvial depositsoverlying weathered to fresh shale bedrock.
The alluvial deposits have an average thickness of about 25 feet,and consist of clay, silty clay, sandy clay, clayey sand, silt,silty sand, and gravel. Soils are g'enerally cohesive In theupper zone with clay fractions predominating, grading to lesscohesive or non-plastic soils at depth where silt and sandfractions predominate. The lowest portion consists of basalgravel of varying thickness, but generally not exceeding fivefeet.
The alluvial deposits are-underlain by weathered to fresh shalebedrock with thin limestone interbeds. Reported depth ofweathering is variable, ranging from a few feet to more than 20feet in the main plant area.
OPGRT514 0-104/13/89

02.2 WEN Soil Supported Structures
The following is a listing of the main WBN structures that aresoil supported or influenced:
o Diesel Generator Building
o Additional Diesel Generator Building ("H" piles to rock)
o Waste Packaging Area
o Condensate Demineralizer and Waste Evaporator Building ("H"piles to rock)
o North Steam Valve Room (concrete walls to rock)
o Refueling Water Storage Tank
o Essential Raw Cooling Water Pipe Tunnel
o Essential Raw Cooling Water Pipe Support Slab ("H" piles to
rock) and Sheet Pile Retaining Wall
Site geotechnical materials underneath these structures are
described in Table 0-1.
03.0 DYNAMIC SOIL PROPERTIES
03.1 Original Evaluation
Dynamic soil properties used by TVA for the original evaluationsare listed in Table 0-2 (Ref. 1, Table 3.7-3 and TVAcalculations). As reflected in Table 0-2, the originalproperties were revised in August 1987 to-account for incorrectdynamic soil properties used for in-situ materials and forcrushed stone backfill, and to more precisely define separatezones of in-situ materials. This revision applied to the DGBonly.
03.2 Consultants' Review of Dynamic Soil Properties
Selected structures were evaluated in 1988 by Sargent & Lundy(Ref. 3) and SWEC (Refs. 4 & 5). Dynamic soil properties used inthese reviews are shown in Table 0-3.
04.0 FIELD AND LABORATORY DATA
For the present review, dynamic soil properties were evaluated on thebasis of field and laboratory data available at TVA headquarters inKnoxville, as described below:
OPGRT514 0-204/13/89

Geophysical surveys were available for the followingstructures/features:
o Low Level Radwaste Borrow Area (Reference 6)
o Diesel Generator Building (Reference 1, Figure 2.5-233)
o Intake Channel (Reference 1, Figures 2.5-228 to 232)
o Class lE Conduits and Essential Raw Cooling Water Piping(Reference 1, Table 2.5-17)
o Crushed Stone Backfill (Reference 13)
Other field data included:
o Borehole logs withstandard penetration testing (Reference 1).
o Placement records for crushed stone backfill (Reference 1,Table 2.5-56 and 2.5-57).
Laboratory test data utilized in this evaluation included:
o Index properties and static strength properties for undisturbedand remolded samples (Reference 1).
o Engineering properties of crushed stone backfill (Reference 1).
o Engineering properties of Class A backfill (Reference 1).
o Resonant column testing for undistrubed and remolded samplesfor the Low Level Radwaste Borrow Area (Reference 7).
05.0 BACKFILL MATERIALS - BECHTEL REVIEW
Two types of backfill were used at the site, fine-grained soil (Class ABackfill) and crushed'stone (1032 Engineered Fill). Due to concernabout excessive settlement, in situ materials, were excavated down tothe top of basal gravel for selected structures, or in the case of WPAto bedrock, and backfilled with crushed stone. Class A Backfill wasused beneath selected auxiliary (Non-Category I) structures, andadjacent to selected Category I structures to bring the surface tofinal grade.
05.1 Class A Backfill
Class A Backfill was used beneath the CDWE Building and the ERCWpipe support slab, and was also placed adjacent to otherstructures to bring the surface to finish grade. This materialconsists of sandy or silty lean clay placed in six inch layers
OPGRT514 0-303/22/89
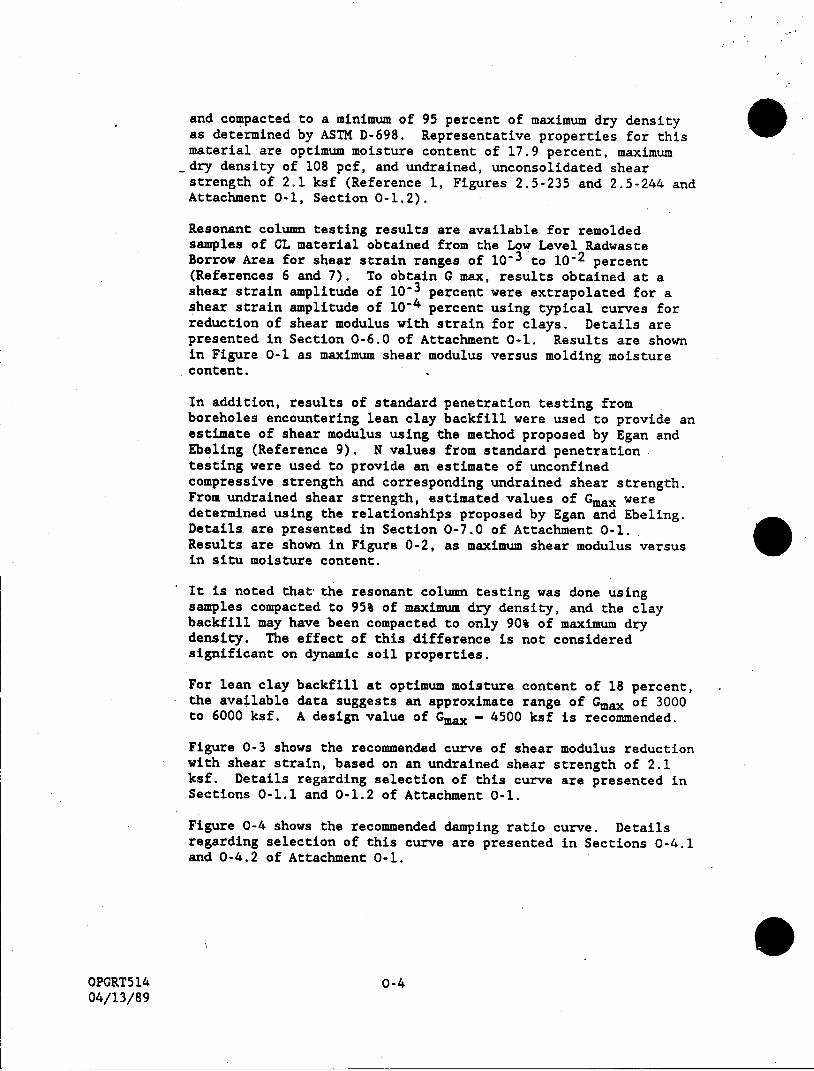
and compacted to a minimum of 95 percent of maximum dry densityas determined by ASTM D-698. Representative properties for thismaterial are optimum moisture content of 17.9 percent, maximum
_dry density of 108 pcf, and undrained, unconsolidated shearstrength of 2.1 ksf (Reference 1, Figures 2.5-235 and 2.5-244 andAttachment 0-1, Section 0-1.2).
Resonant column testing results are available for remoldedsamples of CL material obtained from the Low Level RadwasteBorrow Area for shear strain ranges of 10-3 to 10-2 percent(References 6 and 7). To obtain G max, results obtained at ashear strain amplitude of 10-3 percent were extrapolated for ashear strain amplitude of 10-4 percent using typical curves forreduction of shear modulus with strain for clays. Details arepresented in Section 0-6.0 of Attachment 0-1. Results are shownin Figure 0-1 as maximum shear modulus versus molding moisturecontent.
In addition, results of standard penetration testing fromboreholes encountering lean clay backfill were used to provide anestimate of shear modulus using the method proposed by Egan andEbeling (Reference 9). N values from standard penetrationtesting were used to provide an estimate of unconfinedcompressive strength and corresponding undrained shear strength.From undrained shear strength, estimated values of Gmax weredetermined using the relationships proposed by Egan and Ebeling.Details are presented in Section 0-7.0 of Attachment 0-1.Results are shown in Figure 0-2, as maximum shear modulus versusin situ moisture content.
It is noted that the resonant column testing was done usingsamples compacted to 95% of maximum dry density, and the claybackfill may have been compacted to only 90% of maximum drydensity. The effect of this difference is not consideredsignificant on dynamic soil properties.
For lean clay backfill at optimum moisture content of 18 percent,the available data suggests an approximate range of Gmax of 3000to 6000 ksf. A design value of Gmax - 4500 ksf is recommended.
Figure 0-3 shows the recommended curve of shear modulus reductionwith shear strain, based on an undrained shear strength of 2.1ksf. Details regarding selection of this curve are presented inSections 0-1.1 and 0-1.2 of Attachment 0-1.
Figure 0-4 shows the recommended damping ratio curve. Detailsregarding selection of this curve are presented in Sections 0-4.1and 0-4.2 of Attachment 0-1.
OPGRT514 0-404/13/89
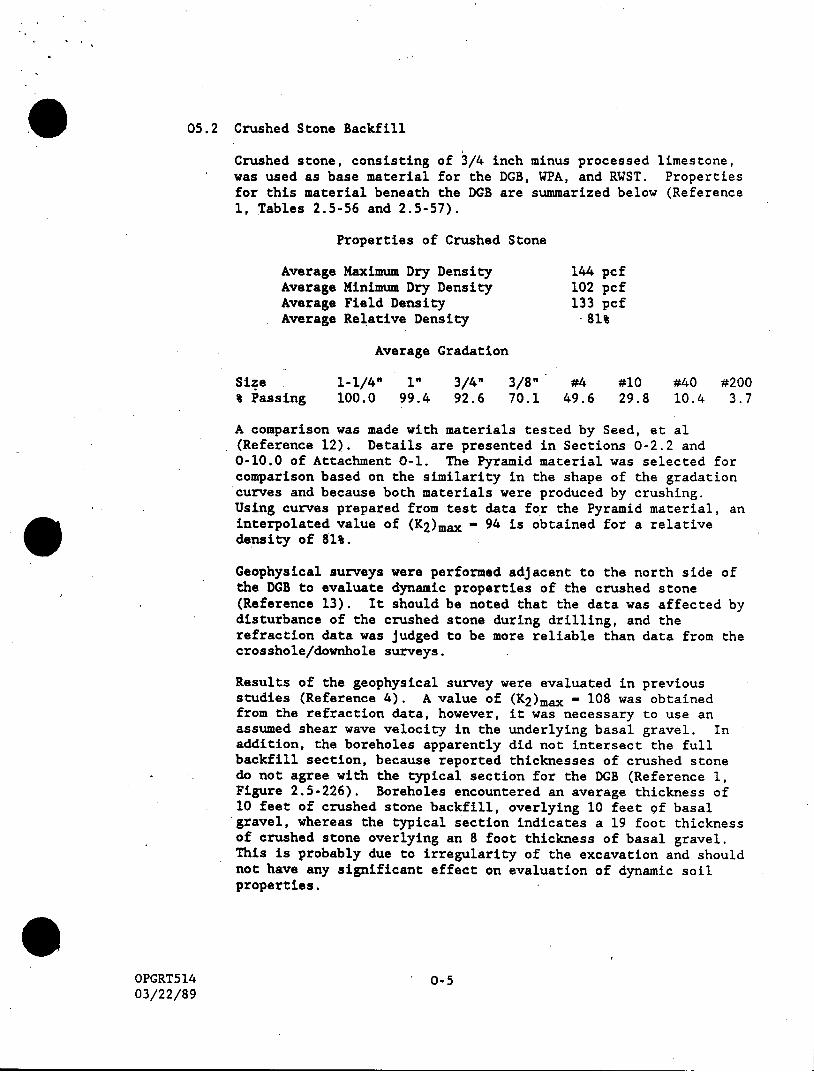
05.2 Crushed Stone Backfill
Crushed stone, consisting of 3/4 inch minus processed limestone,was used as base material for the DGB, WPA, and RWST. Propertiesfor this material beneath the DGB are summarized below (Reference1, Tables 2.5-56 and 2.5-57).
Properties of Crushed Stone
Average Maximum Dry Density 144 pcfAverage Minimum Dry Density 102 pcfAverage Field Density 133 pcfAverage Relative Density 81%
Average Gradation
Size 1-1/4" 1" 3/4" 3/8" #4 #10 #40 #200% Passing 100.0 99.4 92.6 70.1 49.6 29.8 10.4 3.7
A comparison was made with materials tested by Seed, et al(Reference 12). Details are presented in Sections 0-2.2 and0-10.0 of Attachment 0-1. The Pyramid material was selected forcomparison based on the similarity in the shape of the gradationcurves and because both materials were produced by crushing.Using curves prepared from test data for the Pyramid material, aninterpolated value of (K2)max - 94 is obtained for a relativedensity of 81%.
Geophysical surveys were performed adjacent to the north side ofthe DGB to evaluate dynamic properties of the crushed stone(Reference 13). It should be noted that the data was affected bydisturbance of the crushed stone during drilling, and therefraction data was judged to be more reliable than data from thecrosshole/downhole surveys.
Results of the geophysical survey were evaluated in previousstudies (Reference 4). A value of (K2)max - 108 was obtainedfrom the refraction data, however, it was necessary to use anassumed shear wave velocity in the underlying basal gravel. Inaddition, the boreholes apparently did not intersect the fullbackfill section, because reported thicknesses of crushed stonedo not agree with the typical section for the DGB (Reference 1,Figure 2.5-226). Boreholes encountered an average thickness of10 feet of crushed stone backfill, overlying 10 feet Qf basalgravel, whereas the typical section indicates a 19 foot thicknessof crushed stone overlying an 8 foot thickness of basal gravel.This is probably due to irregularity of the excavation and shouldnot have any significant effect on evaluation of dynamic soilproperties.
OPGRT514 0-503/22/89
In summary, estimates of (K2)max based on geophysical surveys maybe influenced by disturbance during drilling and uncertaintyregarding the subsurface profile. Accurate records are availablefor in-place relative density. Using data developed by Seed, etal (Reference 12), an approximate value of (K2)max - 94 isindicated. Previous studies (References 2 and 4) have suggestedvalues of 100 and 120.
A design value of (K2)max - 100 is recommended for crushed stone.
Figure 0-5 shows the recommended curve of shear modulus reductionwith shear strain. Details regarding selection of this curve arepresented in Sections 0-2.1 and 0-2.2 of Attachment 0-1.
Figure 0-6 shows the recommended damping ratio curve. Detailsregarding selection of this curve are presented in Sections 0-4.1and 0-4.3 of Attachment 0-1.
06.0 IN-SITU MATERIALS - BECHTEL REVIEW
in-situ materials include fine-grained soils, basal gravel, andweathered shale. Fine grained soil deposits consist of clay,silty clay, sandy clay, clayey sand, silt, and silty sand. Soilsare generally cohesive in the upper zone with clay fractionspredominating, grading to less cohesive or non-plastic soils atdepth where silt and sand fractions predominate. Availablegeophysical data for in-situ soils is summarized in Table 0-4.Two zones are of interest; cohesive soils (CL, ML) which arefound in the upper portion of the profile, and non-plastic soils(SM, ML) found generally in the lower 2 to 5 feet of theprofile. Underlying these materials are basal gravel andweathered shale.
06.1 In-Situ Cohesive Soils
In-situ soils are found beneath the ADGB and the ODWEB.Available-geophysical data is summarized in Table 0-4.Additional details are presented in Sections 0-8.0 to 0-8.5 ofAttachment 0-1.
This section applies to cohesive soils (CL, ML) found in theupper portion of the soil profile, at a depth of 0 to about 20feet below original ground surface. These materials generallyhave N values ranging from 10 to 30 blows per foot. Occasionalthin deposits of low plasticity or non-plastic sands or siltysands may be found in this portion of the profile. The presenceof these thin deposits is not considered significant with regardto selection of recommended soil properties.
Rela ,tively low shear wave velocities were' obtained for surficialsoil deposits. In the depth zone of 0 to 6 ft, typical valuesrange between 500 and 600 fps. Surficial soils are not ofinterest in this study as this upper zone was normally removed
OPGRT5 14 0-604/13/89

prior to construction of facilities. For the remaining soilprofile, velocities range generally from 800 to 1200 fps, with afew values to 1600 fps. These values are nearly identical withshear wave velocities calculated from the range of Gmax valuesfor Class A Backfill. Additionally, it was found that moistdensity for in-situ soils was the same as moist density for ClassA Backfill, i.e., 120 pcf.
Resonant column testing results are available for undisturbedsamples of cohesive soils taken from the Low Level RadwasteBorrow Area for shear strain ranges of 10- 3 to 10-2 percent(Reference 7). To obtain Gmax, results obtained at a shearstrain amplitude of 10-3 percent were extrapolated for a shearstrain amplitude of 10-4 percent using typical curves forreduction of shear modulus with shear strain for clays. Detailsare presented in Section 0-9.0 of Attachment 0-1. Results areshown in Figure 0-7.
For a moisture content of 30%, laboratory data indicates valuesof Gmax ranging from 800 to 3500 ksf. Previous studies haveshown that shear modulus values at low shear strain obtained bylaboratory testing of undisturbed samples are lower thancorresponding values obtained from in-situ field measurements.This is attributed primarily to sample disturbance andtime-dependent increases in shear modulus for laboratoryspecimens (Reference 14). A factor of 2.5 was used by Seed andIdriss (Reference 11) to reflect these effects for variouslaboratory test methods. Subsequent studies by Arango,. et al(Reference 10) obtained a factor of 2.0 specifically for resonantcolumn testing, which is used here, giving values of Gmax rangingfrom 1600 to 7000 ksf. Using a moist density of 120 pcf,corresponding shear wave velocities ranging from 650 to 1370 fpsare obtained, which is consistent with values obtained fromgeophysical surveys.
For in-situ cohesive soils the available data suggests anapproximate range- of Gmax of 3,000 to 6,000 ksf. A design valueof Gmax - 4,500 ksf is recommended.
Figure 0-8 shows the recommended curve of shear modulus reductionwith shear strain, based on an undrained shear strength of 1.2ksf. Details regarding selection of this curve are presented inSections 0-1.1 and 0-1.3 of Attachment 0-1. For specificareas/structures where a higher strength can be justified, thefamily of curves shown in Figure 01-5 of Attachment 1 can be'usedto obtain the appropriate modulus reduction curve.
Figure 0-9 shows the recommended damping ratio curve. Detailsregarding selection of this curve are presented in Sections 0-4.1and 0-4.2 of Attachment 0-1.
OPGRT514 0-703/22/89
06.2 In-Situ Non-Plastic Soils
In-situ soils are found beneath the ADGB and the CDWEB.Available geophysical data is summarized in Table 0-4.Additional details are presented in Sections 0-8.0 to 0-8.5 ofAttachment 0-1.
This section applies to non-plastic soils (SM, ML) which arefound generally in the lower 2 to 5 feet of the soil profile, atan approximate depth of 20 feet below original ground surface.These materials typically have N values of less than 10 blows perfoot.
An average shear wave velocity of 613 fps was obtained for thismaterial by crosshole testing. Using this value and a moist unitweight of 120 pcf, a (K2)max - 38 was obtained for a typicalprofile. This is a low value when compared with typical rangesof (K2)max for sands (Reference 11), but is verified by aseparate evaluation based on measured in-situ void ratios forthis material (see Section 0-11.0 of Attachment 0-1).
A design value of (K2)max - 38 is recommended for in-situnon-plastic soils in the lower portion of the profile.
Figure 0-10 shows the recommended curve of shear modulusreduction with shear strain. Details regarding selection of thiscurve are presented in Sections 0-1.1 and 0-1.4 of Attachment 0-1.
Figure 0-11 shows the recommended damping ratio curve. Detailsregarding selection of this curve are presented in Sections 0-4.1and 0-4.3 of Attachment 0-1.
06.3 Basal Gravel
Basal gravel is present beneath the DGB, ADGB, CDWEB, RWST, andERCW Pipe Tunnel. Representative properties for this materialare dry density of 125 pcf, specific gravity of 2.60, and voidratio of 0.30. Average gradation and envelopes for samples takenfrom the main plant area are shown in Figure 0-12 (Reference 1,Tables 2.5-42 and 43 and Figures 2.5-366 through 371).Additional information is presented in Section 0-2.3 ofAttachment 0-1.
Boreholes SS-26 through SS-30 (Reference 1, Figure 2.5-190) weredrilled to define in-situ materials at each corner of the DGB.The drilling program included standard penetration testing. Forthese holes an extremely high average count of N - 124 blows perfoot was obtained in the basal gravel.
OPGRT514 0-804/13/89
A subsequent investigation was conducted in the main plant areawith drilling of Boreholes US-125 through US-130 (Reference 1,Tables 2.5-42 and 43, and Figures 2.5-358 through 364). Blowcounts in the basal gravel ranged from 14 to 50+. Relativedensity for the basal gravels was estimated using relationshipsbetween blow counts and effective overburden pressure (Reference15). Details are presented in Section 0-2.3 of Attachment 0-1.Estimated relative density for nine of the eleven zones testedranged from 80% to more than 90%, while values of slightly over60% were obtained for the remaining two zones. It should benoted, however, that the basal gravel contains particles up tofive inches in diameter and data from standard penetrationtesting may not be reliable. Separate calculations (see Section0-2.3 of Attachment 0-1) indicate that actual relative densitymay range from 70% to 90%.
Very little data is available from geophysical surveysspecifically for basal gravel. Downhole testing generallyapplies to a combination of in-situ soils and basal gravel/weathered shale. Refraction surveys for the DGB (Reference 1,Table 2.5-233) gave an average shear wave velocity of 1660 fps inan approximate depth zone of 19 to 39 feet. Borehole logsindicate that this zone consists of 6 feet of basal graveloverlying 14 feet of weathered to fresh shale bedrock. The shearwave velocity of 1660 fps obtained in this zone is believed to bea representative value for the basal gravel because the seismicpulse recognized in the refraction data coming from this zone ismost likely propagating along the top of bedrock.
Values of (K2)max for natural gravels, based on laboratorytesting of large diameter remolded samples, were determined bySeed, Wong, Idriss, and Tokimatsu in 1984 (Reference 12).(K2)max values ranged from about 60 to 140, depending uponrelative density of the sample. Subsequent investigations haveshown that in-situ values are often much higher than thosedetermined for remolded laboratory'samples. The following arein-situ measured field values and corresponding values of (K2)maxfor gravels in the same approximate depth range.
Location Depth. Vs (K2)max Ref.
(ft) jfps No.
San Juan, Argentina 24 1540 204 16
Lima, Peru 26 2300 463 17
Alicura Dam, Argentina 35 1800 331 18
Santiago, Chile 44 2180 316 19
OPGRT514 0-903/22/89
Using a shear wave velocity of 1660 fps and a saturated unitweight of 143 pcf for a typical section beneath the DGB, a(K2)max - 365 is obtained (see Section 0-12.0 of Attachment0-1). As can be seen, this is consistent with values obtainedfrom in-situ field measurements.
A design value of (K2)max - 365 is recommended for basal gravel.
Figure 0-13 shows the recommended curve of shear modulusreduction with strain. Details regarding selection of this curveare presented in Sections 0-2.0 and 0-2.3 of Attachment 0-1.
Figure 0-14 shows the recommended damping ratio curve. Detailsregarding selection of this curve are presented in Sections 0-4.1and 0-4.3 of Attachment 0-1.
06.4 Weathered Shale
Weathered shale is present beneath all listed structures exceptthe WPA and NSVR. Original subsurface investigations generallyshow less than five feet of weathered shale overlying bedrock.For these investigations bedrock was defined as auger refusal.Subsequent investigations in the main plant area show a range inthickness of 8 to 23 feet, with an average of 15 feet. The basisfor defining top of bedrock is not given. Additional informationis presented in Section 0-3.2 of Attachment 0-1.
For the DGB, an average shear wave velocity of 1660 fps wasobtained in the zone of silty sands and gravel directly abovebedrock (Reference 1, Figure 2.5-233). For the Intake Channel,an average shear wave velocity of 2218 fps was, obtained in thezone of gravel directly above bedrock (Reference 1, Figure2.5-232).
Original seismic surveys in bedrock beneath the reactor buildingconsistently show shear wave velocities in the range of 5300 to7200 fps, with an average of 6300 fps (Reference 1, Figure2.5-109).
There is no site specific data regarding shear wave velocity inweathered shale for WBN. TVA reports a measured shear wavevelocity of 1800 fps in similar material at the Fort LoudounDam. In the absence of other data, this shear wave velocity of1800 fps is recommended for use at WBN.
Figure 0-15 shows recommended damping ratios -and reduction ofshear modulus with shear strain. Details regarding selection ofthese curves are presented in Sections 0.30 and 0.50 ofAttachment 0-1.
OPGRT5 14 0-1003/22/89

07.0 CONCLUSIONS AND RECOMMENDATIONS
The previous sections provide estimates of dynamic soil properties forWBN geotechnical materials, based on general reference sources andavailable site-specific data. Recommended values are summarized inTable 0-5.
It is TVA's practice to vary shear moduli by ± 50% to allow forpossible variations in soil properties. TVA has requested Bechtel'scomments on this practice.
For Class A Backfill and in-situ cohesive soils, this appears to bereasonable, and brackets the possible range of shear moduli identifiedfor these materials.
For in-situ non-plastic soils, a relatively low value of (K2)max - 38was obtained. Application of a + 50% variation in shear modulus wouldappear to be appropriate, however, use of a - 50% variation wouldresult in a shear modulus well below reasonable limits for thismaterial. Typical values of (K2)max obtained by Seed and Idriss forsands (Reference 11) range from about 30 to 70.
For crushed stone backfill, a value of (K2)max - 100 is recommended.Typical values for similar materials obtained by Seed, et al (Reference12) range from about 70 to 140. Use of a + 50% variation in shearmodulus would go well beyond what appear to be reasonable limits forthis material.
For basal gravel, a value of (K2)max - 365 is recommended, based onin-situ data for similar materials. Typical values range from about200 to 500. Application of a - 50% variation in shear modulus wouldappear reasonable, however, use of a + 50% variation would result in ashear modulus well above observed values, but may not significantlyaffect-the analysis.
A shear wave velocity of 1800 fps is assumed for weathered shale. Dueto the lack of site specific information for this material, a + 50%variation in shear modulus is considered appropriate.
OPGRT514 0-1103/22/89
08.0 REFERENCES
1. Watts Bar Nuclear Plant, Final Safety Analysis Report IncludingAmendments Through No. 59, Tennessee Valley Authority, August 1986.
2. Diesel Generator Building, Dynamic Analysis, Soil Profile andProperties, Document B45-880620-239, Tennessee Valley Authority,August 1987.
3. Diesel Generator Building, Calculation for Dynamic Analysis, SoilProfile and Properties, Discrepancy Report OR No. 378, Sargent andLundy Vertical Slice Review, October 1988.
4. Seismic Response of Waste Packaging Area by SHAKE Analysis,Calculation 17190.2922-CS(B)-31, Stone and Webster EngineeringCorp., September 1988.
5. Evaluation of Pile Foundation Stiffness for the CondensateDemineralizer Waste Evaporator Building, Calculation17190-CS(B)-32, Stone and Webster Engineering Corp., September1988.
6. Long Term Onsite Storage Facility Foundation Investigations,Document CEB-810811-001, Tennessee Valley Authority, April 1981.
7. Low Level Radwaste Storage Soil Investigation, DocumentCEB-820827-012, Tennessee Valley Authority, August 1982.
8. Earthquake Activity and Dam Stability Evaluations for the AswanHigh Dam, Egypt, Volume 4, Woodward - Clyde Consultants, WalnutCreek, California, December 1985.
9. Egan, J. A.., and Ebeling, R. M., Variation of Small-Strain ShearModulus with Undrained Shear Strength of Clays, SecondInternational Conference on Soil Dynamics and EarthquakeEngineering, June 1985.
10. Arango, I., Morlwaki, Y., and Brown, F., In-Situ and LaboratoryShear Velocity and Modulus, Proceeding of ASCE GeotechnicalEngineering Specialty Conference, Volume I, Pasadena, California,1978.
11. Seed, H. B., and Idriss, I. M., Soil Moduli and Damping Factorsfor Dynamic Response Analyses, Report No. EERC 70-10, EarthquakeEngineering Research Center, University of California, Berkeley,California, December 1970.
12. Seed, H. B., Wong, R. T., Idriss, I. M., and Tokimatsu, K., Moduliand Damping Factors for Dynamic Analyses of Cohesionless Soils,Report No. UCB/EERC-84/14, Earthquake Engineering Research Center,University of California, Berkeley, California, September 1984.
OPGRT514 0-1203/22/89
13. Memorandum from R. A. Hopkins to J. M. Kellberg, Watts Bar NuclearPlant - Testing of 1032 Engineered Granular Fill Below the DieselGenerator Building Slab, Document B41-861030-017, Tennessee ValleyAuthority, February 5, 1976.
14. Anderson, D. G., Espana, C., and McLamore, V. R., EstimatingIn-Site Shear Moduli at Competent Sites, ASCE Specialty Conferenceon Earthquake Engineering and Soil Dynamics, Pasadena, California,June 1978.
15. Tokimatsu, K., and Seed, H. B., Simplified Procedures for theEvaluation of Settlements in Clean Sands, Report No.UCB/EERC-84/16, Earthquake Engineering Research Center, Universityof California, Berkeley, California, October 1984.
16. Woodward Clyde Consultants, Microzonation Study of the San JuanProvince, Argentina, Report to Gil-Nafa-Zamarbide and InstituteNacional de Prevencion Sismica (INPRES), April 1982.
17. Repetto, P., Arango, I., and Seed, H. B., Influence of SiteCharacteristics on Building Damage During the October 3, 1974,Lima Earthquake, Report No. UCB/EERC-80/4, Earthquake EngineeringResearch Center, University of California, Berkeley, California,September 1980.
18. Varde, 0., and Anderson, C. A., Investigations of Gravels for anEarthfill Dam, Proc. VII Pan American Conference on Soil Mechanicsand Foundation Engineering, Vancouver, Canada, June 1983.
19. Ortigosa, P., Mustante, H., and Kort, I., Mechanical Properties ofthe Gravel of Santiago, Proceedings X ICSMFE, Page 545, Stockholm,1981.
20. Schnable, P., Seed, H. B., and Lysmer, J., Modification ofSeismograph Records for Effects of Local Soil Conditions, ReportNo. EERC 71-8, Earthquake Engineering Research Center, Universityof California Berkeley, California, December 1971.
21. Shannon,& Wilson, Inc., and Agbabian-Jacobsen Associates, SoilBehavior Under Earthquake Loading Conditions, State of the ArtEvaluation of Soil Characteristics for Seismic Response Analysis,Prepared for the U.S. Atomic Energy Commission, Contract No.W-7405-eng-26, January 1972.
22. Shannon & Wilson, Inc., - Agbabian Associates, In-Situ ImpulseTest for Determination of Shear Modulus for Seismic ResponseAnalysis, Report to U.S. NUREG 0028.
23. Soil Mechanics, Design Manual 7.1, Department of the Navy, NavalFacilities Engineering Command, Alexandria, Virginia.
OPGRT514 0-1303/22/89
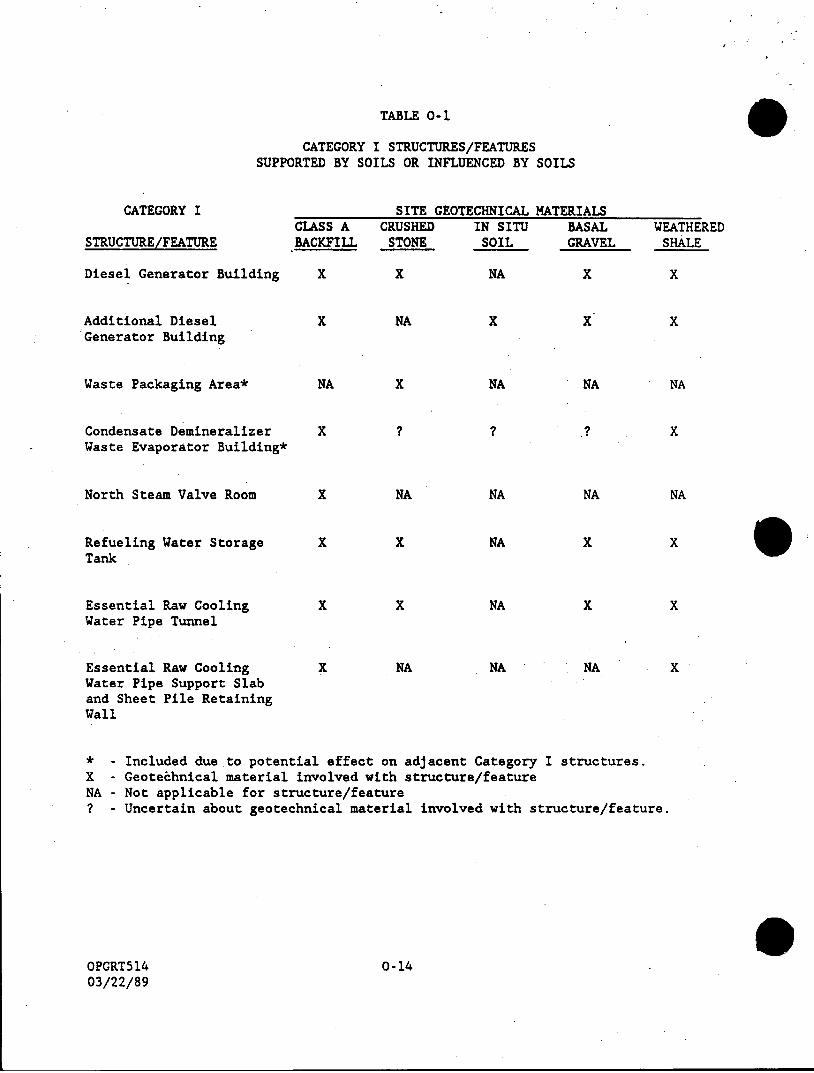
TABLE 0-1
CATEGORY I STRUCTURES/FEATURESSUPPORTED BY SOILS OR INFLUENCED BY SOILS
CATEGORY I
STRUCTURE/FEATURE
SITE GEOTECHNICAL MATERIALSCLASS ABACKFILL
CRUSHEDSTONE
IN SITUSOIL
BASALGRAVEL
Diesel Generator Building
Additional DieselGenerator Building
Waste Packaging Area*
Condensate DemineralizerWaste Evaporator Building*
North Steam Valve Room
Refueling Water StorageTank
Essential Raw CoolingWater Pipe Tunnel
Essential Raw CoolingWater Pipe Support Slaband Sheet Pile RetainingWall
- Included due to potential effect on adjacent Category I structures.- Geoteihnical material involved with structure/feature- Not applicable for structure/feature- Uncertain about geotechnical material involved with structure/feature.
OPGRT51403/22/89
0-14
WEATHEREDSHALE
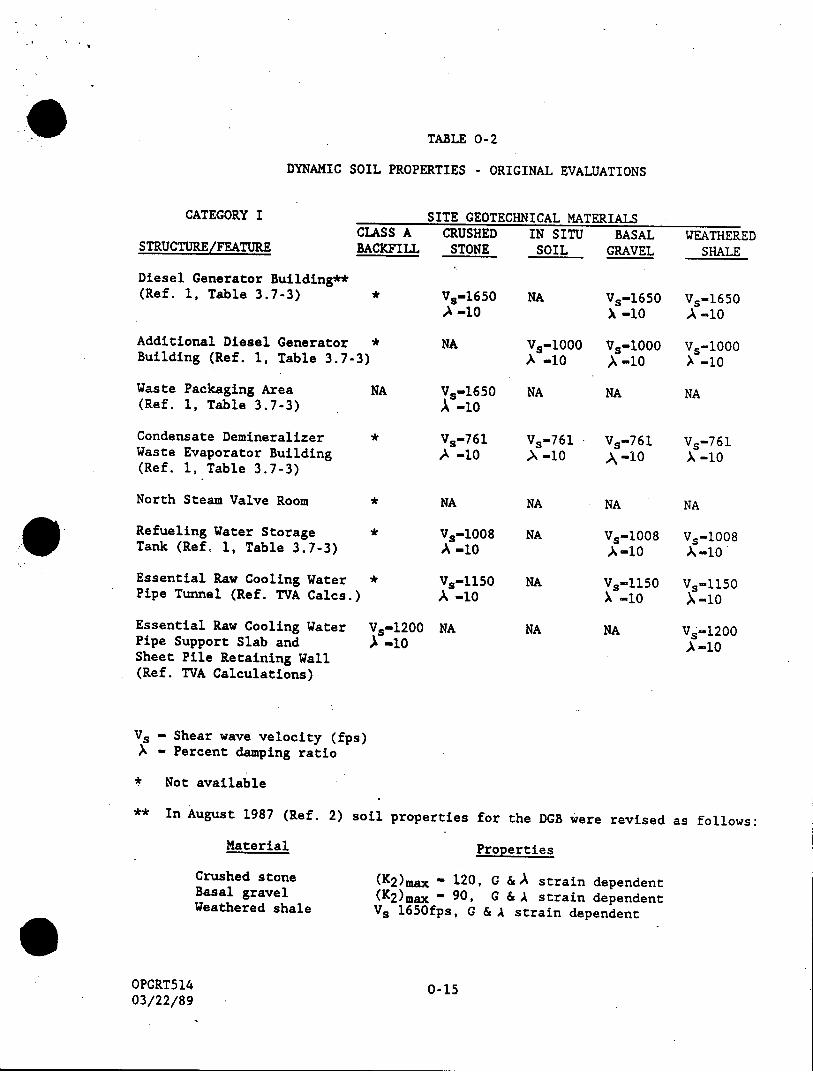
TABLE 0-2
DYNAMIC SOIL PROPERTIES - ORIGINAL EVALUATIONS
CATEGORY I
STRUCTURE/FEATURE
Diesel Generator Building**(Ref. 1, Table 3.7-3)
SITE GEOTECHNICAL MATERIALSCLASS ABACKFILL
Additional Diesel Generator *Building (Ref. 1, Table 3.7-3)
Waste Packaging Area N1(Ref. 1, Table 3.7-3)
Condensate Demineralizer *Waste Evaporator Building(Ref. 1, Table 3.7-3)
North Steam Valve Room *
Refueling Water Storage *Tank (Ref. 1, Table 3.7-3)
Essential Raw Cooling Water *Pipe Tunnel (Ref. TVA Calcs.)
Essential Raw Cooling WaterPipe Support Slab andSheet Pile Retaining Wall(Ref. TVA Calculations)
CRUSHEDSTONE
Vs-1650'A -10
NA
Vs-1650A -10
Vs-761A -10
Vs-1008A -10
Vs-1150A -10
IN SITU BASAL WEATHEREDSOIL GRAVEL SHALE
NA Vs-1650 Vs-1650t-10 A -10
Vs-1000 Vs-1000 Vs-1000A -i0 \ -10 , -10
Vs-761 Vs-761 Vs-7611 -10 A-10 X -10
Vs-1008 Vs-1008A-10 b-10
Vs-1150 Vs-b150-1O -10
Vs-1200-10
Vs-1200A-10
Vs - Shear wave velocity (fps)- Percent damping ratio
* Not available
** In August 1987 (Ref. 2) soil properties for the DGB were revised as follows:
Properties
Crushed stoneBasal gravelWeathered shale
OPGRT51403/22/89
(K2)max - 120, G &A strain dependent(K2)max - 90, G & A strain dependentVs 1650fps, G & A strain dependent
0-15
Material
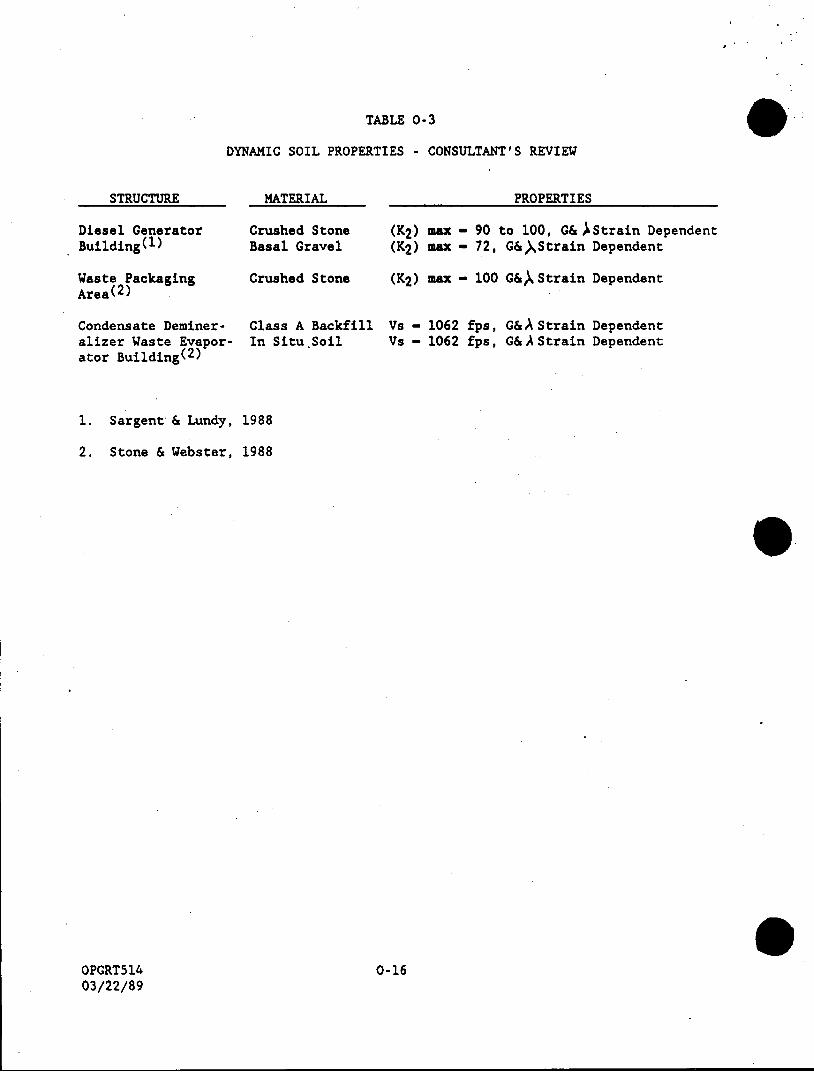
TABLE 0-3
DYNAMIC SOIL PROPERTIES - CONSULTANT'S REVIEW
STRUCTURE MATERIAL
Diesel GeneratorBuilding(1)
Waste PackagingArea(
2)
Condensate Deminer-alizer Waste Evapor-ator Building(
2 )
Crushed StoneBasal Gravel
Crushed Stone
PROPERTIES
(K2) max - 90 to 100, G& ,Strain Dependent(K2) max - 72, G&XStrain Dependent
(K2) max - 100 G&, Strain Dependent
Class A Backfill Vs - 1062 fps, G&A Strain DependentIn Situ.Soil Vs - 1062 fps, G&A Strain Dependent
1. Sargent & Lundy, 1988
2. Stone & Webster, 1988
OPGRT51403/22/89
0-16
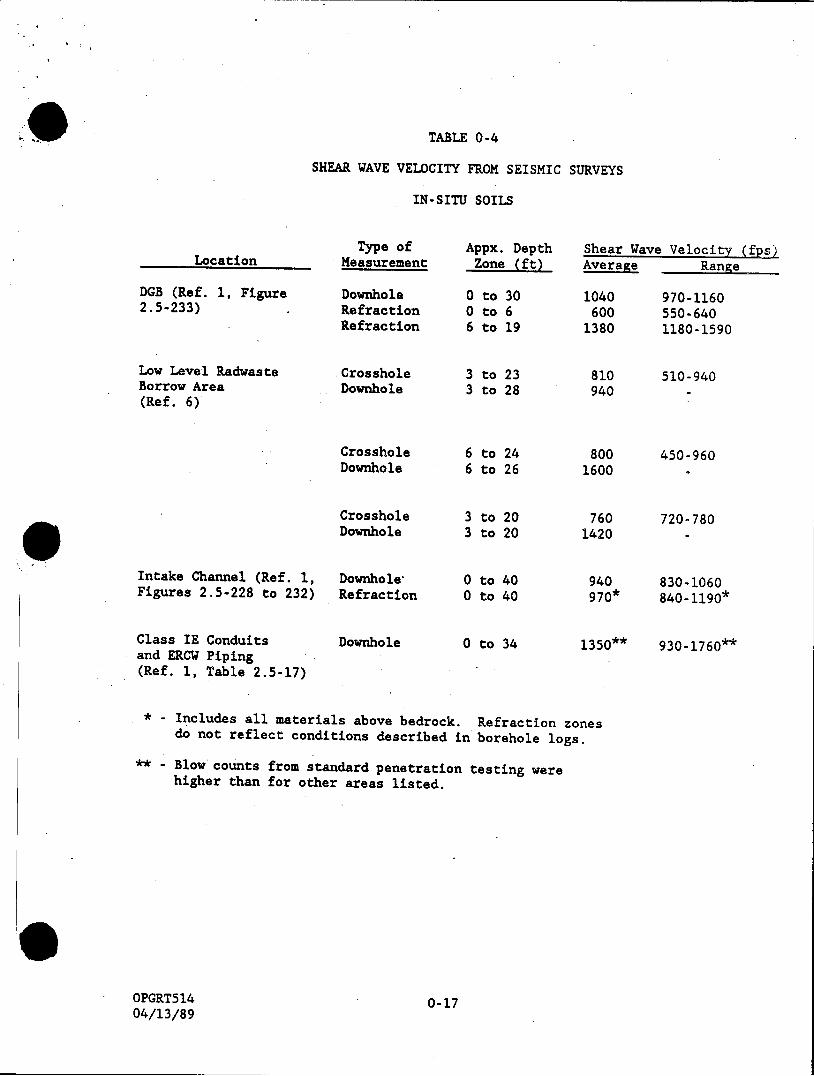
TABLE 0-4
SHEAR WAVE VELOCITY FROM SEISMIC SURVEYS
IN-SITU SOILS
Location
DGB (Ref. 1, Figure2.5-233)
Low Level RadwasteBorrow Area(Ref. 6)
Type ofMeasurement
DownholeRefractionRefraction
CrossholeDownhole
Appx. Depth
Zone (ft)Shear Wave Velocity (fps)Average Range
1040600
1380
3 to 233 to 28
810940
970-1160550-6401180-1590
510-940
Intake Channel (Ref. 1,Figures 2.5-228 to 232)
Class IE Conduitsand ERCW Piping(Ref. 1, Table 2.5-17)
CrossholeDownhole
CrossholeDownhole
Downhole"Refraction
Downhole
6 to 246 to 26
3 to 203 to 20
0 to 400 to 40
0 to 34
8001600
7601420
940970*
450-960
720-780
830-1060840-1190*
1350** 930-1760**
* - Includes all materials above bedrock. Refraction zonesdo not reflect conditions described in borehole logs.
** - Blow counts from standard penetration testing werehigher than for other areas listed.
OPGRT51404/13/89
0-17
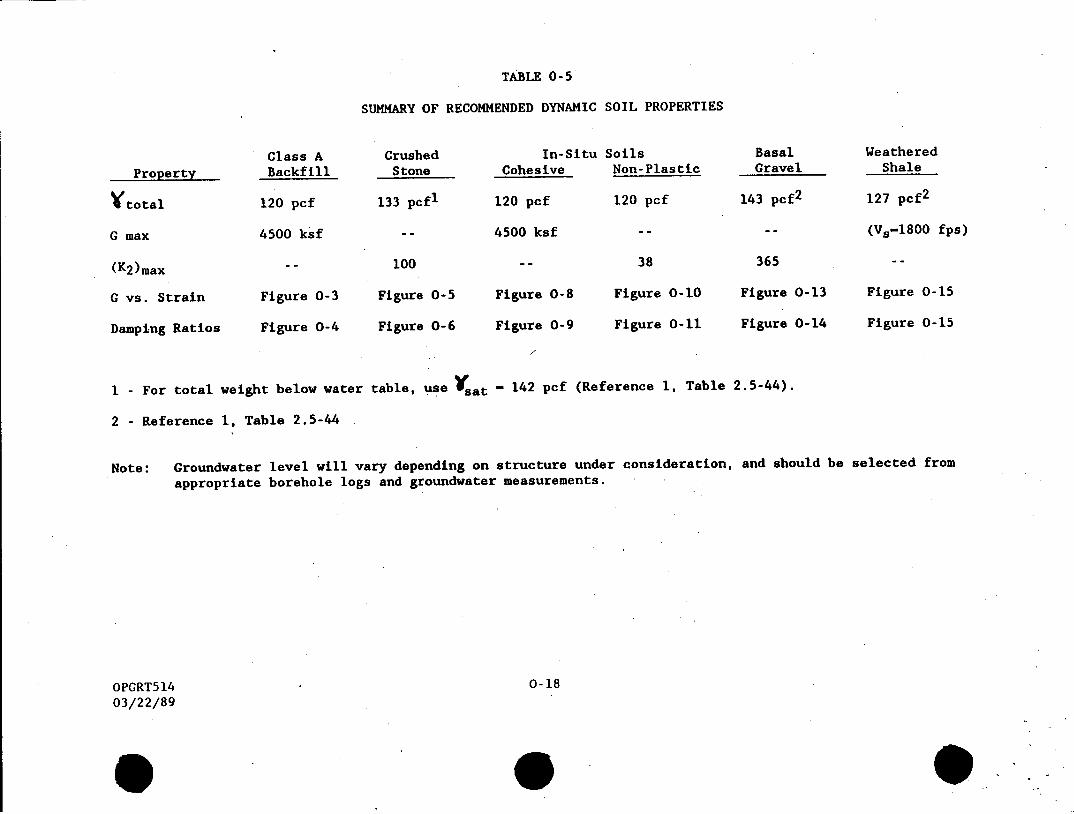
TABLE 0-5
SUMMARY OF RECOMMENDED DYNAMIC SOIL PROPERTIES
Property
Ytotal
G max
(K2)max
G vs. Strain
Damping Ratios
Class ABackfill
120 pcf
4500 ksf
Figure 0-3
Figure 0-4
CrushedStone
133 pcf1
100
Figure 0-5
Figure 0-6
In-Situ SoilsCohesive Non-Plastic
120 pcf 120 pcf
4500 ksf --
Figure 0-8
Figure 0-9
38
Figure 0-10
Figure 0-11
BasalGravel
143 pcf2
365
Figure 0-13
Figure 0-14
WeatheredShale
127 pcf 2
(Vs-1800 fps)
Figure 0-15
Figure 0-15
I - For total weight below water
2 - Reference i, Table 2.5-44
table, use Vsat - 142 pcf (Reference 1, Table 2.5-44).
Note: Groundwater level will vary depending on structure under consideration, and should be selected from
appropriate borehole logs and groundwater measurements.
OPGRT514 0-1803/22/89

16,000
12,000
8,000
4,000
10 12 14 16 18 20
MOISTURE CONTENT (PERCENT)
Figure 0-1SHEAR MODULUS vs. MOISTURE CONTENT, REMOLDED CL
LOW LEVEL RADWASTE BORROW AREA
8.000
4,000
010 12 14 16 18 20 2
MOISTURE CONTENT (PERCENT)
Figure 0-2SHEAR MODULUS vs. MOISTURE CONTENT FROM SPT
EMERGENCY RAW COOLING WATER PIPELINE
0-19
COMPACTED TO 90%STANDARD PROCTORDENSITY I
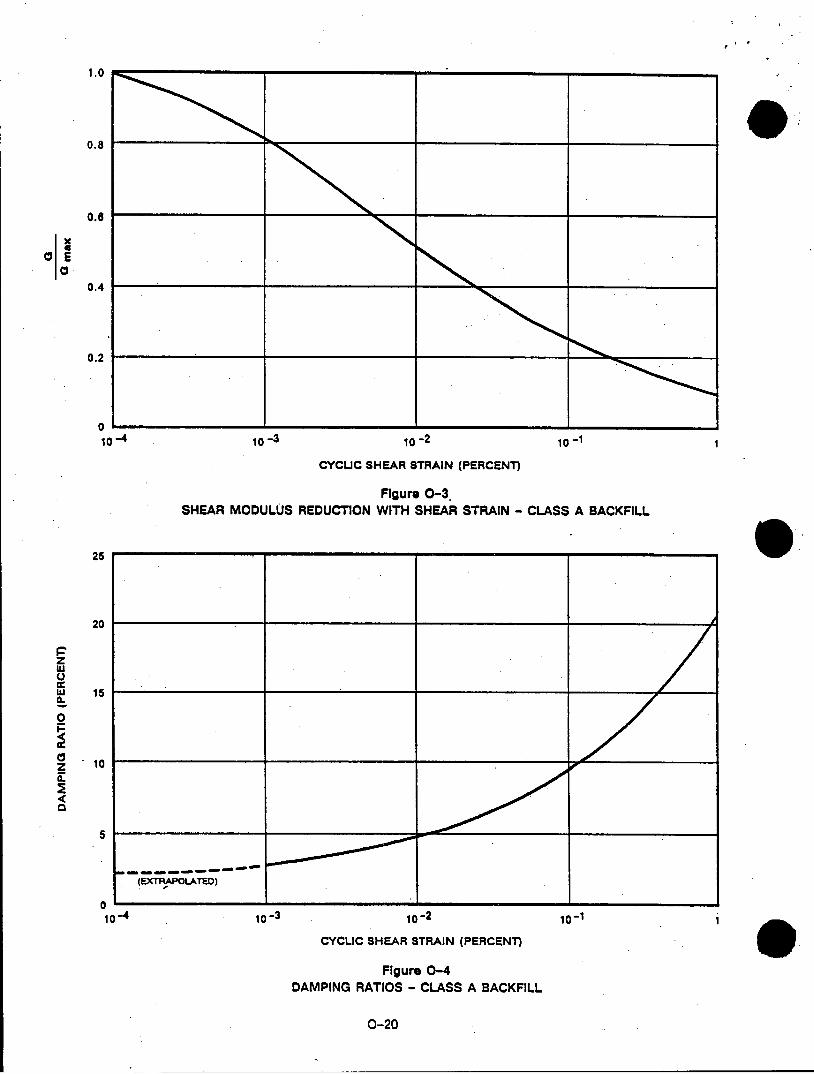
0.8
0.6
E
0.4
0.2
010 -4 10-3 10-2 10- 1
CYCLIC SHEAR STRAIN (PERCENT)
Figure 0-3SHEAR MODULUS REDUCTION WITH SHEAR STRAIN - CLASS A BACKFILL
25
20
zLuQ
0
0z 10
0
10 - 4 10 -3 10-2 10-1
CYCUC SHEAR STRAIN (PERCENT)
Figure 0-4DAMPING RATIOS - CLASS A BACKFILL
0-20
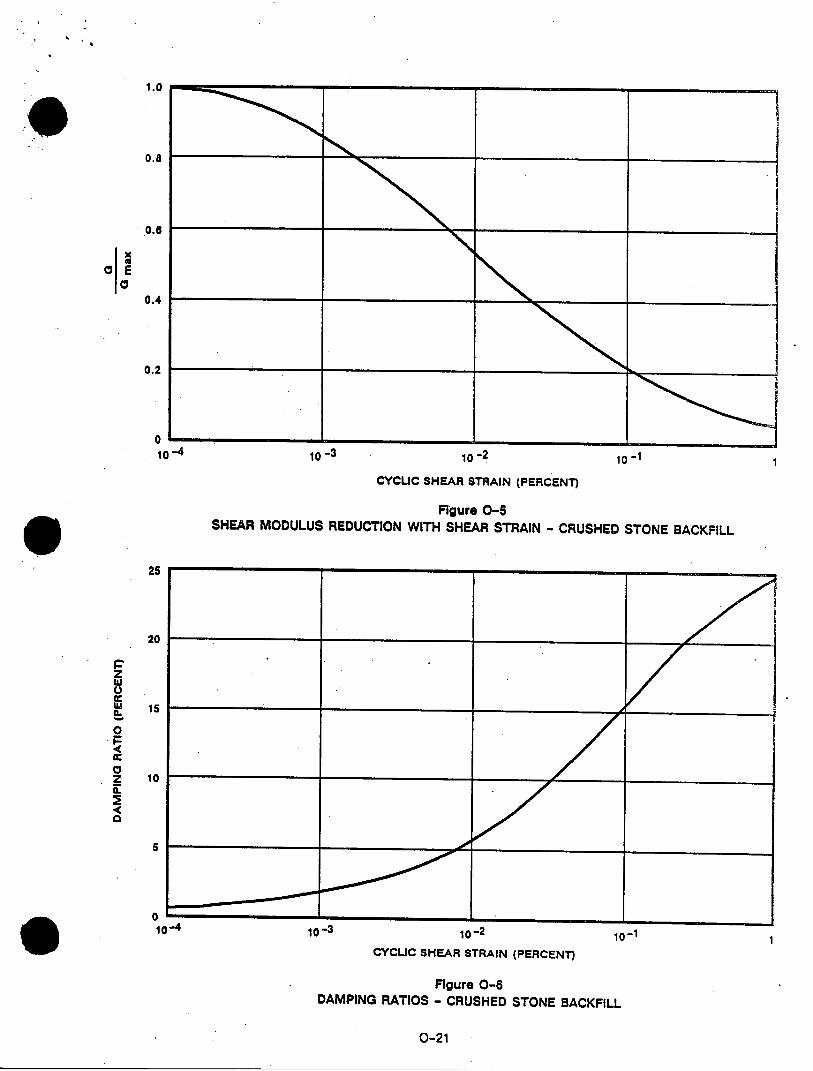
10 -3 10-2 10- 1
CYCUC SHEAR STRAIN (PERCENT)
Figure 0-5SHEAR MODULUS REDUCTION WITH SHEAR STRAIN - CRUSHED STONE BACKFILL
10-3 10-2 10-1CYCUC SHEAR STRAIN (PERCENT)
Figure 0-6DAMPING RATIOS - CRUSHED STONE BACKFILL
0-21
xE4
0
0.2
010-4
0 1-

12,000
8,000
4,000
0
MOISTURE CONTENT, %
Figure 0-7SHEAR MODULUS vs. MOISTURE CONTENT, UNDISTURBED CL
LOW LEVEL RADWASTE BORROW AREA
0'-10 -4 10-3 10-2 101-
CYCLIC SHEAR STRAIN (PERCENT)
Figure 0-8SHEAR MODULUS REDUCTION WITH SHEAR STRAIN - IN SITU COHESIVE SOILS
O-22
o 03 = 8.0 ksf3 a3 = 4.0 ksf
0 Oa = 2.0 ksf
q3 = 1.0 kof
SAMPLES PREPAREDAT 95% STANDARDPROCTOR DENSITY
xaoE
0
o:#
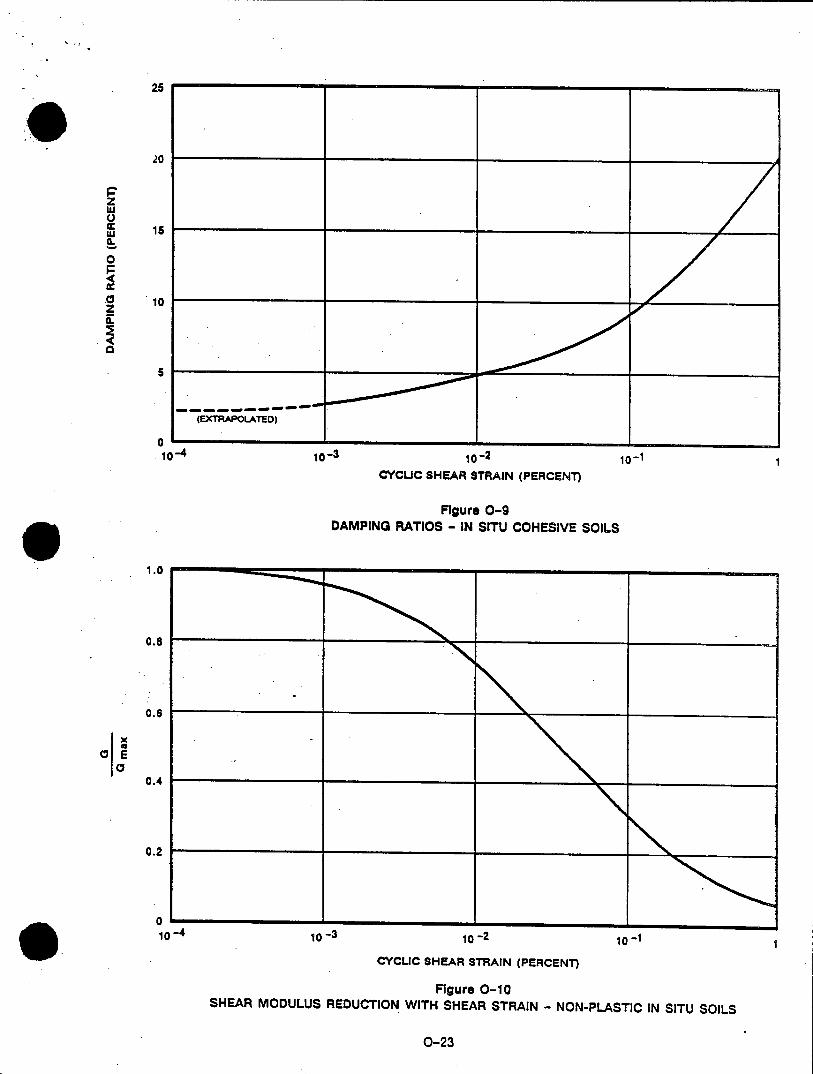
-3 10-2 10-1CYCUC SHEAR STRAIN (PERCENT)
Figure 0-9DAMPING RATIOS - IN SITU COHESIVE SOILS
10-3 10-2 10-1
CYCUC SHEAR STRAIN (PERCENT)
Figure 0-10SHEAR MODULUS REDUCTION WITH SHEAR STRAIN - NON-PLASTIC IN SITU SOILS
0-23
010-4
xCE0
S10-10-

10-3 10-2 10"1
CYCLIC SHEAR STRAIN (PERCENT)
Figure 0-11DAMPING RATIOS - NON-PLASTIC IN SITU SOILS
U.S. STANDARD SIEVE SIZES
3" 1-1/2' 3/4" 3/8" 4 8 16 30 50 100 200
10 3 1.0 0.3 0.1 0.03 0.01 0.003 0.001
PARTICLE SIZE - INCHES
Figure 0-12PARTICLE SIZE DISTRIBUTION FOR BASAL GRAVEL
0-24
0=10,-4

x
a
0.2
0-10-4
101-3 10-2 10-
CYCLIC SHEAR STRAIN (PERCENT)
Figure 0-13SHEAR MODULUS REDUCTION WITH SHEAR STRAIN - BASAL GRAVEL
10 -3 10-2 10o-CYCLIC SHEAR STRAIN (PERCENT)
Figure 0-14DAMPING RATIOS - BASAL GRAVEL
0-25
0 %10- 4

_____________________________________________________________________________ I ______________________________________________________________________________
0.0003 0.001 0.003 0.01 0.03 0.11
0.0003 0.001 0.003 0.01
SHEAR STRAIN, -1 - PERCENT
Figure 0-15SHEAR MODULI AND DAMPING CHARACTERISTICS FOR ROCK
0-26
5
4
3
2
1
00001
0L0.00'01
I I

ATTACHMENT 0-1
CALCULATIONS
TABLE OF CONTENTS
Page
0-1.1.0 CURVES OF REDUCTION OF SHEAR MODULUS WITH SHEARSTRAIN FOR SANDS AND CLAYS ............ ............... 0-1-10-1.1.1 Discussion .......... ................... . .0-1-10-1.1.2 Class A Backfill ........ ................ ... 0-1-20-1.1.3 Cohesive In-Situ Soils (CL, ML) ... ........ .. 0-1-20-1.1.4 Non-Plastic In-Situ Soils (SM, ML) ......... . .0-1-3
0-1.2.0 CURVES OF REDUCTION OF SHEAR MODULUS WITH SHEARSTRAIN FOR GRAVELS ............... ................... 0-1-30-1.2.1 Discussion .......... .................... 0-1-30-1.2.2 Crushed Stone Backfill. ..... ............. ... 0-1-40-1.2.3 Basal Gravel ............ ................... 0-1-4
0-1.3.0 CURVES OF REDUCTION OF SHEAR MODULUS WITHSHEAR STRAIN FOR ROCK ............ .................. 0-1-80-1.3.1 Discussion .......... ................... ... 0-1-90-1.3.2 Weathered Shale ............. ................ 0-1-9
o-1.4.0 DAMPING RATIOS FOR SANDS, GRAVELS, AND CLAYS .... ...... 0-1-100-1.4.1 Discussion .......... ................... . .0-1-100-1.4.2 Class A Backfill and Cohesive
In-Situ Soils (CL, ML) ..... ............. ... 0-1-110-1.4.3 Non-Plastic In-Situ Soils (SM, ML) and Gravel 0-1-11
0-1.5.0 DAMPING RATIOS FOR ROCK ............ ................. 0-1-110-1.5.1 Discussion .......... ................... . .0-1-110-1.5.2 Weathered Shale ......... ................ .. 0-1-11
0-1.6.0 EVALUATION OF RESONANT COLUMN TEST DATA FOR REMOLDED CL . 0-1-120-1.7.0 EVALUATION OF STANDARD PENETRATION TEST RESULTS
FOR CL BACKFILL ............... ..................... 0-1-120-1.8.0 EVALUATION OF GEOPHYSICAL SURVEY DATA FOR IN-SITU SOILS . 0-1-14
0-1.8.1 Discussion ......... . ...... ........... . .0-1-150-1.8.2 Diesel Generator Building ... ........... . .0-1-150-1.8.3 Low Level Radwaste Borrow Area ............ . 0-1-160-1.8.4 Intake Channel .......... ................. 0-1-180-1.8.5 Class IE Conduits and Essential Raw
Cooling Water Piping ..... ......... ..... 0-1-180-1.9.0 EVALUATION OF RESONANT COLUMN TEST DATA FOR
COHESIVE IN-SITU SOILS ....... ....................... 0-1-190-1.10.0 SELECTION OF (K2)MAX VALUE FOR CRUSHED STONE BACKFILL 0-1-200-1.11.0 SELECTION OF (K2)MAX VALUE FOR NON-PLASTIC
IN-SITU SOILS (SM, ML) ............. ......... . ...... 0-1-200-1.12.0 SELECTION OF (K2 )MAX VALUE FOR BASAL GRAVEL ......... . .0-1-22
OPGRT750 O-1-i04/13/89

ATTACHMENT 0-1
CALCULATIONS
TABLE OF CONTENTS(Continued)
FIGURES
Page
0-1-1 MODULUS REDUCTION WITH STRAIN: SANDS AND LOWPLASTICITY SILTS AND CLAYS ...............
0-1-2 TYPICAL REDUCTION OF SHEAR MODULUS WITH SHEAR STRAININ CLAYS . . . . . . . . . . . . . . . . . . . . . .
0-1-3 MODULUS REDUCTION WITH STRAIN ....... .............0-1-4 TYPICAL REDUCTION OF SHEAR MODULUS WITH SHEAR STRAIN
IN CLAYS . . . . . . . . . . . . . . . . . . . . . .0-1-5 TYPICAL REDUCTION OF SHEAR MODULUS WITH SHEAR STRAIN
IN CLAYS . . . . . . . . . . . . . . . . . . . . . .0-1-6 VARIATION OF SHEAR MODULUS WITH SHEAR STRAIN FOR
GRAVELLY SOILS ...................0-1-7 GRAIN SIZE DISTRIBUTION CURVES FOR FIELD AND
MODELED GRADATION ......... . ..................0-1-8 GRAIN SIZE DISTRIBUTION CURVES FOR FIELD AND
MODELED GRADATIONS .................0-1-9 VARIATION OF SHEAR MODULUS WITH SHEAR STRAIN FOR ROCK0-1-10 DAMPING RATIOS FOR SAND AND CLAY ..... . ....0-1-11 DAMPING RATIOS FOR ROCK ......... ........ ........0-1-12 STANDARD PENETRATION RESISTANCE VS MOISTURE CONTENT
IN LEAN CLAY BACKFILL ....... .....................0-1-13 CORRELATION OF STANDARD PENETRATION RESISTANCE . . .0-1-14 VARIATION OF NORMALIZED MODULUS AS MEASURED IN-SITU
WITH UNDRAINED SHEAR STRENGTH FOR SEVERAL SOILS . . .0-1-15 SHEAR MODULI OF MODEL-GRADED PYRAMID MATERIAL . ...
0-1-24
0-1-24. . . 0-1-25
. . . 0-1-25
. . . 0-1-26
. . . 0-1-26
. . . 0-1-27
. . . 0-1-280-1-290-1-29
. . . 0-1-30
. . . 0-1-30
. . . 0-1-31
. . . 0-1-31
0-l-iiOPGRT75004/13/89
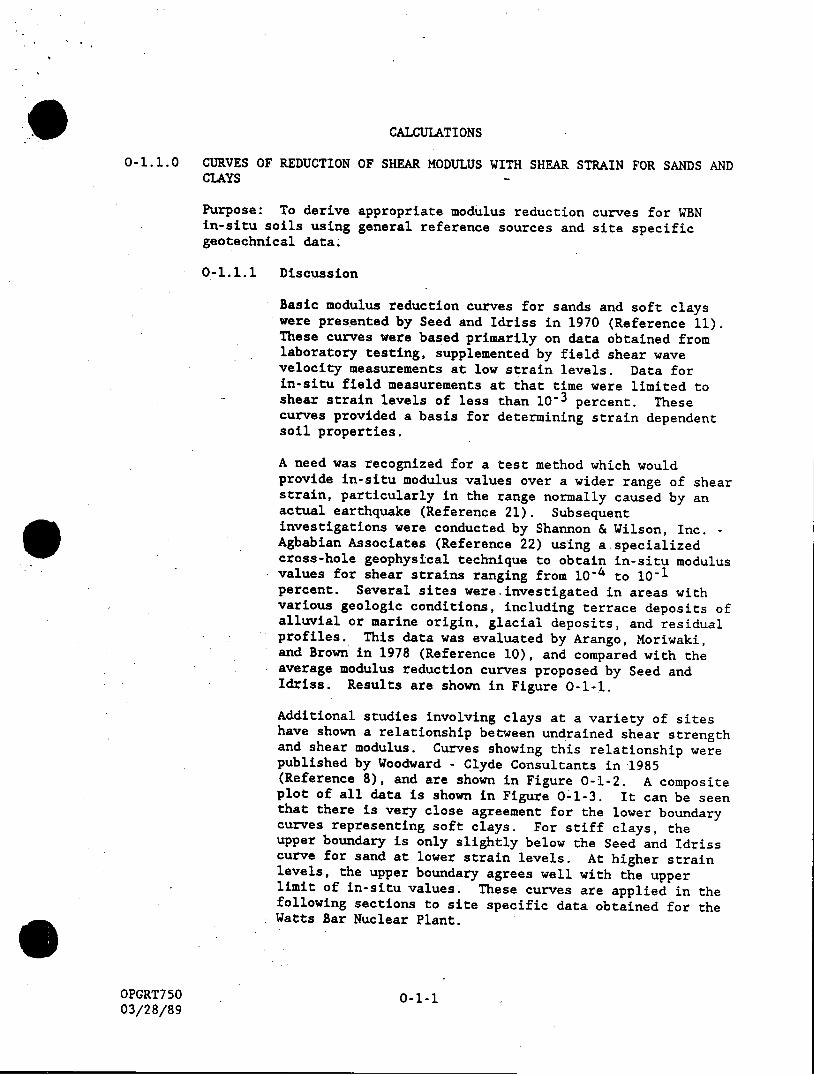
CALCULATIONS
0-1.1.0 CURVES OF REDUCTION OF SHEAR MODULUS WITH SHEAR STRAIN FOR SANDS ANDCLAYS
Purpose: To derive appropriate modulus reduction curves for WBNin-situ soils using general reference sources and site specificgeotechnical data.
0-1.1.1 Discussion
Basic modulus reduction curves for sands and soft clayswere presented by Seed and Idriss in 1970 (Reference 11).These curves were based primarily on data obtained fromlaboratory testing, supplemented by field shear wavevelocity measurements at low strain levels. Data forin-situ field measurements at that time were limited toshear strain levels of less than 10-3 percent. These
curves provided a basis for determining strain dependentsoil properties.
A need was recognized for a test method which wouldprovide in-situ modulus values over a wider range of shearstrain, particularly in the range normally caused by anactual earthquake (Reference 21). Subsequentinvestigations were conducted by Shannon & Wilson, Inc. -Agbabian Associates (Reference 22) using a specializedcross-hole geophysical technique to obtain in-situ modulusvalues for shear strains ranging from 10-4 to 10-1percent. Several sites were-investigated in areas withvarious geologic conditions, including terrace deposits ofalluvial or marine origin, glacial deposits, and residualprofiles. This data was evaluated by Arango, Moriwaki,and Brown in 1978 (Reference 10), and compared with theaverage modulus reduction curves proposed by Seed andIdriss. Results are shown in Figure 0-1-1.
Additional studies involving clays at a variety of siteshave shown a relationship between undrained shear strengthand shear modulus. Curves showing this relationship werepublished by Woodward - Clyde Consultants in 1985(Reference 8), and are shown in Figure 0-1-2. A compositeplot of all data is shown in Figure 0-'1-3. It can be seenthat there is very close agreement for the lower boundarycurves representing *soft clays. For stiff clays, theupper boundary is only slightly below the Seed and Idrisscurve for sand at lower strain levels. At higher strainlevels, the upper boundary agrees well with the upperlimit of in-situ values. These curves are applied in thefollowing sections to site specific data obtained for theWatts Bar Nuclear Plant.
OPGRT7 50 0-1-1-03/28/89

0-1.1.2 Class A Backfill
Class A backfill consists of sandy or silty lean clay (CL)compacted to a minimum of 95% of Standard ProctorDensity. The modulus reduction curve for this materialwill be obtained using undrained shear strength and therelationships presented in Section 0-1.1.1.
Borrow Area No. 4 was one source for any soil necessaryfor the construction of qualified fills (Reference 1,pages 2.5-114). For this material, an undrained shearstrength (UU triaxial shear strength at zero normalstress) of 2.1 ksf was obtained (Reference 1, Table 2.5-12and Figure 2.5-244). For a strength of 2.1 ksf, themodulus reduction curve shown in Figure 0-1-4 isrecommended.
For other borrow areas, modulus reduction curve shall beinterpolated on the curves shown in Figure 0-1-4 for theappropriate undrained shear strength.
0-1.1.3 Cohesive In-Situ Soils (CL, ML)
Fine-grained soils, consisting primarily of silty or sandylean clays with alternating layers of cohesive silts, arepresent in the upper portion of the profile. In the mainplant area, these materials are found in the approximatedepth zone of 0 to 20 feet below original ground surface.Blow counts from standard penetration testing generallyrange from 10 to 30 blows per foot. The modulus reductioncurve for these materials will be obtained using undrainedshear strength and the relationships presented in Section0-1.1.1.
Undrained shear strength (UU triaxial shear strength at
zero normal stress) is summarized below:
Low Level Radwaste Borrow Area (Reference 7, Table 2)
.Depth below ground surface - 6 to 21 feetAverage undrained shear strength - 1.2 ksf
Diesel Generator Building (Reference 1, Table 2.5-6)
Depth below ground surface - 16 to 22 feetAverage undrained shear strength - 1.2 ksf
Essential Raw Cooling Water Supply (Reference 1, Table2.5-7)
Depth below ground surface - 15 feetUndrained shear strength - 1.9 ksf
OPGRT750 0-1-204/13/89
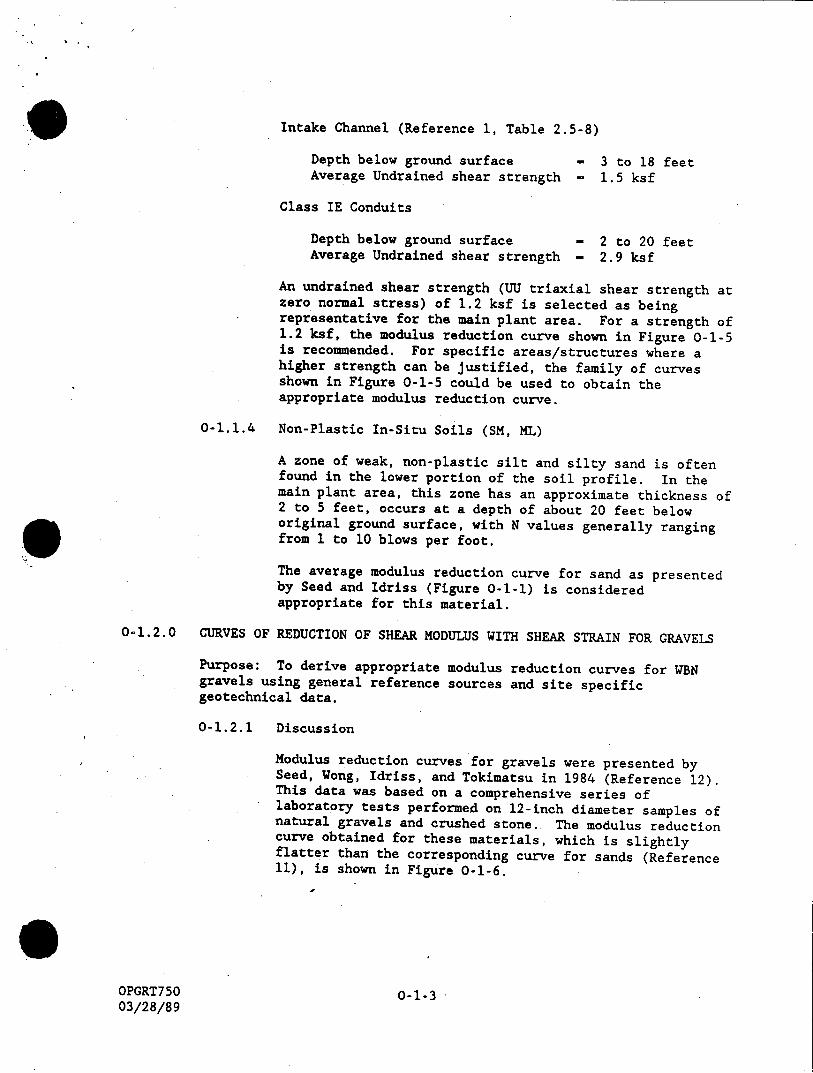
Intake Channel (Reference 1, Table 2.5-8)
Depth below ground surface - 3 to 18 feetAverage Undrained shear strength - 1.5 ksf
Class IE Conduits
Depth below ground surface - 2 to 20 feetAverage Undrained shear strength - 2.9 ksf
An undrained shear strength (UU triaxial shear strength atzero normal stress) of 1.2 ksf is selected as beingrepresentative for the main plant area. For a strength of1.2 ksf, the modulus reduction curve shown in Figure 0-1-5is recommended. For specific areas/structures where ahigher strength can be justified, the family of curvesshown in Figure 0-1-5 could be used to obtain theappropriate modulus reduction curve.
0-1.1.4 Non-Plastic In-Situ Soils (SM, ML)
A zone of weak, non-plastic silt and silty sand is oftenfound in the lower portion of the soil profile. In themain plant area, this zone has an approximate thickness of2 to 5 feet, occurs at a depth of about 20 feet beloworiginal ground surface, with N values generally rangingfrom 1 to 10 blows per foot.
The average modulus reduction curve for sand as presentedby Seed and Idriss (Figure 0-1-1) is consideredappropriate for this material.
0-1.2.0 CURVES OF REDUCTION OF SHEAR MODULUS WITH SHEAR STRAIN FOR GRAVELS
Purpose: To derive appropriate modulus reduction curves for WBNgravels using general reference sources and site specificgeotechnical data.
0-1.2.1 Discussion
Modulus reduction curves for gravels were presented bySeed, Wong, Idriss, and Tokimatsu in 1984 (Reference 12).This data was based on a comprehensive series oflaboratory tests performed on 12-inch diameter samples ofnatural gravels and crushed stone. The modulus reductioncurve obtained for these materials, which is slightlyflatter than the corresponding curve for sands (Reference11), is shown in Figure 0-1-6.
OPGRT750 o-1-303/28/89
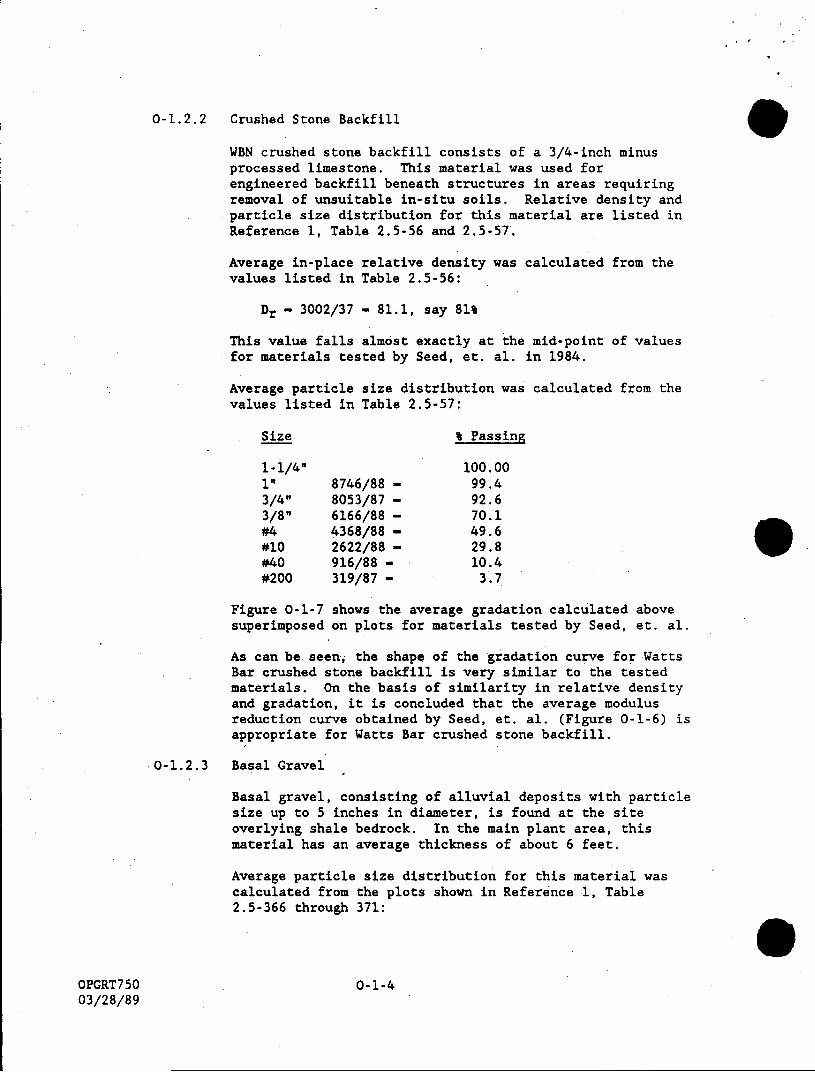
0-1.2.2 Crushed Stone Backfill
WBN crushed stone backfill consists of a 3/4-inch minusprocessed limestone. This material was used forengineered backfill beneath structures in areas requiringremoval of unsuitable in-situ soils. Relative density andparticle size distribution for this material are listed inReference 1, Table 2.5-56 and 2.5-57.
Average in-place relative density was calculated from the
values listed in Table 2.5-56:
Dr - 3002/37 - 81.1, say 81%
This value falls almost exactly at the mid-point of valuesfor materials tested by Seed, et. al. in 1984.
Average particle size distribution was calculated from thevalues listed in Table 2.5-57:
Size % Passing
1-1/4" 100.001" 8746/88 - 99.43/4- 8053/87 - 92.63/8" 6166/88 - 70.1#4 4368/88 - 49.6#10 2622/88 - 29.8#40 916/88 - 10.4#200 319/87 - 3.7
Figure 0-1-7 shows the average gradation calculated abovesuperimposed on plots for materials tested by Seed, et. al.
As can be seen, the shape of the gradation curve for WattsBar crushed stone backfill is very similar to the testedmaterials. On the basis of similarity in relative densityand gradation, it is concluded that the average modulusreduction curve obtained by Seed, et. al. (Figure 0-1-6) isappropriate for Watts Bar crushed stone backfill.
0-1.2.3 Basal Gravel
Basal gravel, consisting of alluvial deposits with particlesize up to 5 inches in diameter, is found at the siteoverlying shale bedrock. In the main plant area, thismaterial has an average thickness of about 6 feet.
Average particle size distribution for this material wascalculated from the plots shown in Reference 1, Table2.5-366 through 371:
OPGRT750 0-1-403/28/89

Size % Passing AverageBorehole Borehole Borehole Borehole Borehole BoreholeUS-125 US-126 US-127 US-128 US-129 US-130
3" 100 100 100 100 100 100 1001-1/2" 88 81 98 74 98 58 833/4" 68 70 61 57 82 56 663/8" 51 56 48 46 65 41 51#4 37 45 38 39 55 32 41#8 29 38 32 33 48 28 35#16 23 32 27 30 43 25 30#30 18 25 18 26 34 20 24#50 10 15 10 16 17 10 13#100 5 10 5 7 12 8 8#200 3 7 4 5 10 8 6
Figure 0-1-8 shows the average gradation calculated abovesuperimposed on plots for materials tested by Seed, et.al.
The gradation curve for Watts Bar basal gravel agreesreasonably well with the Oroville materials, and verywell with the Livermore natural gravel.
Relative density of the basal gravel is of particularinterest in estimating dynamic soil properties, however,a direct computation is-not possible because minimum andmaximum dry densities are not available.
Standard penetration testing is available from thesupplemental field investigations conducted in July 1979(Reference 1, Figures 2.5-359 through 364). With these Nvalues, an estimate of relative density was made usingthe relationships proposed by Tokimatsu and Seed(Reference 23). With this procedure the effectiveoverburden pressure is calculated for-each penetrationtest, and a coefficient Cn is obtained from curves of Cnversus effective overburden pressure. A value of (N1)60is calculated using the equation (N1)60 - N Cn, andrelative density is obtained from a companion curve ofrelative density versus (N1 )60 :
Borehole SS-125, N - 50+, depth - 19', depth togroundwater - 4'Effective overburden pressure - 4(120) + 15(58) - 1350psf (N1)6 0 - 50+ (1.20) - 50+; Dr > 90%
OPGRT750 0-1-503/28/89
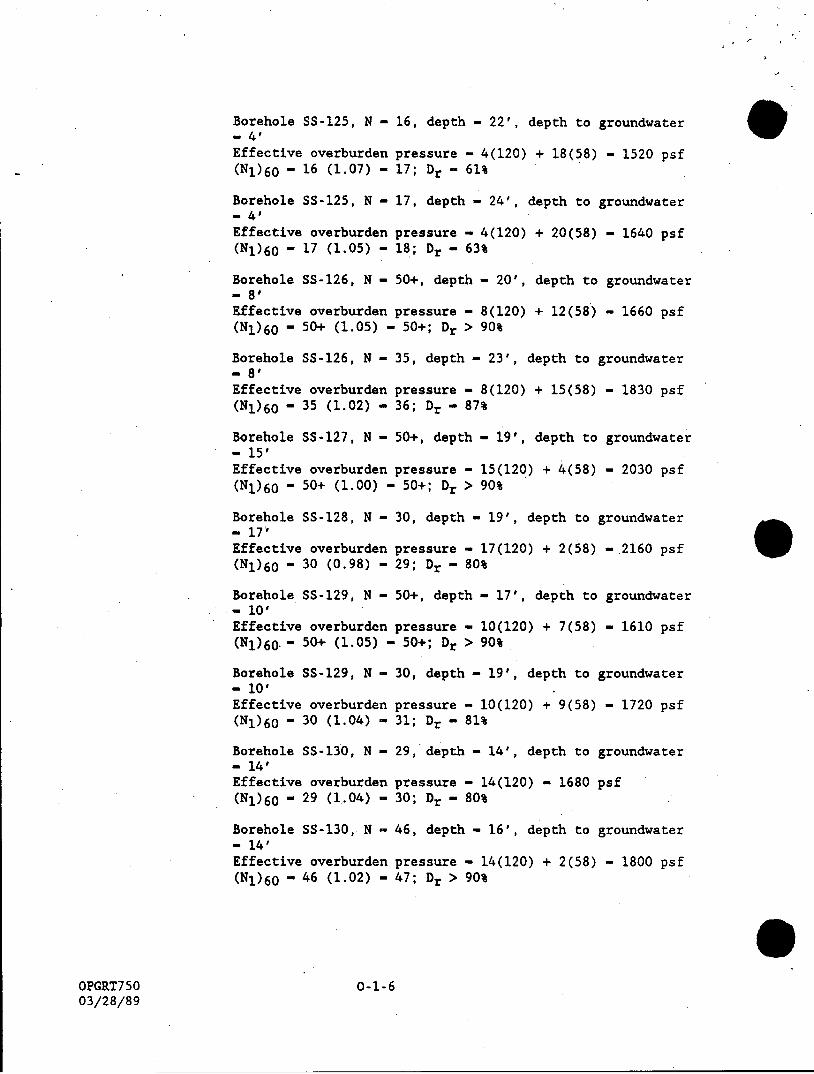
Borehole SS-125, N - 16, depth - 22', depth to groundwater- 4'
Effective overburden pressure - 4(120) + 18(58) - 1520 psf(N1 )60 - 16 (1.07) - 17; Dr - 61%
Borehole SS-125, N - 17, depth - 24', depth to groundwater- 4'
Effective overburden pressure - 4(120) + 20(58) - 1640 psf(N1)60 - 17 (1.05) - 18; Dr - 6 3%
Borehole SS-126, N - 50+, depth - 20', depth to groundwater- 8'Effective overburden pressure - 8(120) + 12(58) - 1660 psf(N1)6 0 - 50+ (1.05) - 50+; Dr > 90%
Borehole SS-126, N - 35, depth - 23', depth to groundwater- 8'
Effective overburden pressure - 8(120) + 15(58) - 1830 psf(N1)6 0 - 35 (1.02) - 36; Dr - 8 7%
Borehole SS-127, N - 50+, depth - 19', depth to groundwater- 15'Effective overburden pressure - 15(120) + 4(58) - 2030 psf(NI)60 - 50+ (1.00) - 50+; Dr > 90%
Borehole SS-128, N - 30, depth - 19', depth to groundwater. 17'Effective overburden pressure - 17(120) + 2(58) - 2160 psf(N1)60 - 30 (0.98) - 29; Dr - 80%
Borehole SS-129, N - 50+, depth - 17', depth to groundwater- 10'Effective overburdon pressure - 10(120) + 7(58) - 1610 psf(N1 )60.- 50+ (1.05) - 50+; Dr > 90%
Borehole SS-129, N - 30, depth - 19', depth to groundwater- 10'Effective overburden pressure - 10(120) + 9(58) - 1720 psf(NI)60 - 30 (1.04) - 31; Dr - 8 1%
Borehole SS-130, N - 29, depth - 14', depth to groundwater- 14'Effective overburden pressure - 14(120) - 1680 psf(N1)60 - 29 (1..04) - 30; Dr - 80%
Borehole SS-130, N - 46, depth - 16', depth to groundwater- 14'Effective overburden pressure - 14(120) + 2(58) - 1800 psf(N1 )60 - 46 (1.02) - 47; Dr > 9 0%
OPGRT750 o-1-603/28/89
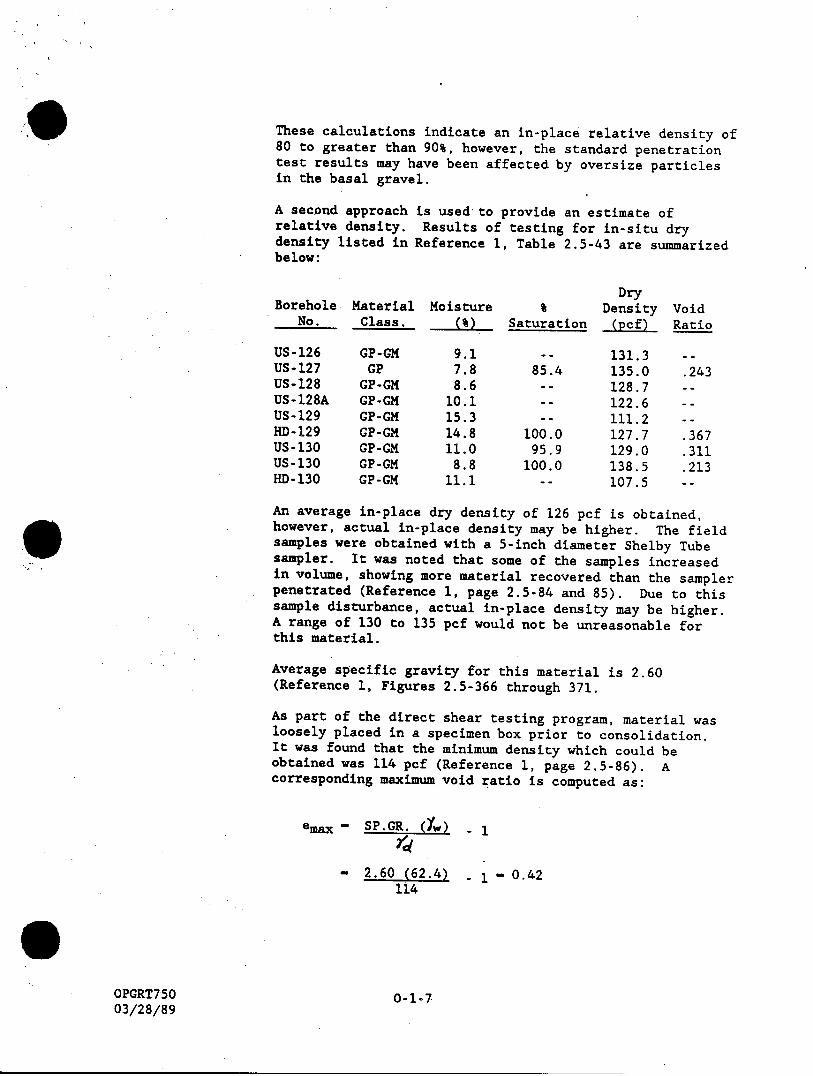
These calculations indicate an in-place relative density of80 to greater than 90%, however, the standard penetrationtest results may have been affected by oversize particlesin the basal gravel.
A second approachrelative density.density listed inbelow:
Borehole MaterialNo. Class.
US-126US-127US-128US-128AUS-129HD-129US-130US-130HD-130
GP-GMGP
GP-GMGP-GMGP-GMGP-GMGP-GMGP-GMGP-GM
is used-to provide an estimate ofResults of testing for in-situ dryRteference 1, Table 2.5-43 are summarized
Moisture
9.17.88.6
10.115.314.811.08.8
11.1
Saturation
85.4
100.095.9
100.0
DryDensity
(pcf)
131.3135.0128.7122.6111.2127.7129.0138.5107.5
VoidRatio
.243
.367
.311
.213
An average in-place dry density of 126 pcf is obtained,however, actual in-place density may be higher. The fieldsamples were obtained with a 5-inch diameter Shelby Tubesampler. It was noted that some of the samples increasedin volume, showing more material recovered than the samplerpenetrated (Reference 1, page 2.5-84 and 85). Due to thissample disturbance, actual in-place density may be higher.A range of 130 to 135 pcf would not be unreasonable forthis material.
Average specific gravity for this material is 2.60(Reference 1, Figures 2.5-366 through 371.
As part of the direct shear testing program, material wasloosely placed in a specimen box prior to consolidation.It was found that the minimum density which could beobtained was 114 pcf (Reference 1, page 2.5-86). Acorresponding maximum void ratio is computed as:
emax - SP.GR. (w) -1
21'- 2.60 (62.4)
114- 1 - 0.42
0-1-7OPGRT75003/28/89

Data for natural gravels tested by Seed, et. al. (Reference12) is reproduced below:
Material Size Sp.Gr. emax emin
Oroville 2" minus 2.90 0.46 0.18
Livermore 20 minus 2.65 0.46 0.17
It was previously noted that the gradation for Watts Barbasal gravel is almost identical to that of the Livermorenatural gravels. The specific gravity is also similar. Onthis basis, a minimum void ratio of 0.17 is assumed forWatts Bar basal gravel.
For an in-place dry density of 130 pcf,
e - 2.60 (62.4) - 1 - 0.25130
ema x - eDr -
emax - emin
0.42 - 0.25 . 68, say 70%
0.42 - 0.17
For an in-place dry density of 135 pcf,
e - 2.60 (62.4) - 1 - 0.20135
Dr - 0.42 - 0.20 . 88, say 90%0.42 - 0.17
It would not be unreasonable to expect actual in-placerelative density to be in the range of 70 to 90%.
Based on the foregoing .information, it is concluded thatthe average modulus reduction curve obtained by Seed, et.al. (Figure 0-1-6) is appropriate for Watts Bar basalgravel.
0-1.3.0 CURVES OF REDUCTION OF SHEAR MODULUS WITH SHEAR STRAIN FOR ROCK
Purpose: To derive appropriate modulus reduction curves for WattsBar weathered shale using general reference sources and site specificgeotechnical data.
OPGRT750 o-1-804/13/89

0-1.3.1 Discussion
A modulus reduction curve for rock was presented bySchnabel, Seed, and Lysmer in 1971 (Reference 20).curve is shown in Figure 0-1-9.
This
0-1.3.2 Weathered Shale
A zone of weathered shale with a thickness of up to 23 feethas been identified in the main plant area. Very littleinformation is available regarding the degree of weatheringor variation of weathering with depth.
Original subsurface investigations for the Diesel GeneratorBuilding (Reference 1, Figure 2.5-190), showed augerrefusal in the shale bedrock at approximate elevation 705,where standard penetration testing gave an average count of136 blows per foot. A generalized profile is shown below.
IN SITU SOIL5
BASAL GIfAVEL
/ WEATHERED SM ALENave = 56
AUGER REFUSALNc ve= 134
0-1-9
734.5
7Z7. O
714.5
708.5705.0.
OPGRT75003/28/89
111 1.
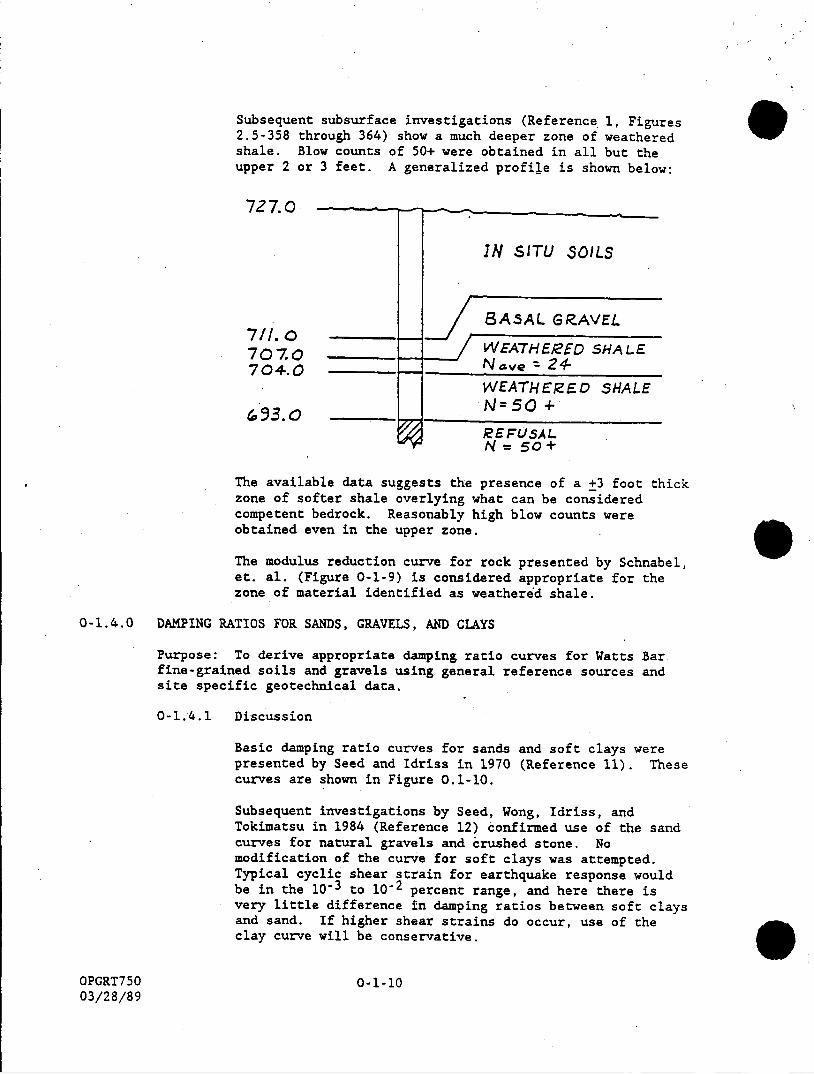
Subsequent subsurface investigations (Reference 1, Figures2.5-358 through 364) show a much deeper zone of weatheredshale. Blow counts of 50+ were obtained in all but theupper 2 or 3 feet. A generalized profile is shown below:
727.0
IN SITU SOILS
8ASAL GRAVEL
707.0 WEATHEZED SHALE704.0 N =
S WEATHERED SHALE
I93.o N=50 +REFUSALN= 50+
The available data suggests the presence of a +3 foot thickzone of softer shale overlying what can be consideredcompetent bedrock. Reasonably high blow counts wereobtained even in the upper zone.
The modulus reduction curve for rock presented by Schnabel,et. al. (Figure 0-1-9) is considered appropriate for thezone of material identified as weathered shale.
0-1.4.0 DAMPING RATIOS FOR SANDS, GRAVELS, AND CLAYS
Purpose: To derive appropriate damping ratio curves for Watts Barfine-grained soils and gravels using general reference sources andsite specific geotechnical data.
0-1.4.1 Discussion
Basic damping ratio curves for sands and soft clays werepresented by Seed and Idriss in 1970 (Reference 11). Thesecurves are shown in Figure 0.1-10.
Subsequent investigations by Seed, Wong, Idriss, andTokimatsu in 1984 (Reference 12) confirmed use of the sandcurves for natural gravels and crushed stone. Nomodification of the curve for soft clays was attempted.Typical cyclic shear strain for earthquake response wouldbe in the 10- 3 to 10-2 percent range, and here there isvery little difference in damping ratios between soft claysand sand. If higher shear strains do occur, use of theclay curve will be conservative.
OPGRT750 0-1-1003/28/89

0-1.4.2 Class A Backfill and Cohesive In-Situ Soils (CL, ML)
Watts Bar Class A backfill and cohesive in-situ soils aredescribed in Sections 0-1.1.2 and 0-1.1.3 of thisAttachment. Resonant column test data for undisturbed andremolded samples of CL material obtained from the Low LevelRadwaste Borrow Area is presented in Reference 7. Valuesof damping ratios from these tests vary somewhat fromsample to sample and with confining pressure, but aregenerally consistent with Figure 0-1-10 within the range ofshear strain tested. The damping ratio curve for clayproposed by Seed and Idriss (Figure 0-1-10) is consideredappropriate for these materials.
0-1.4.3 Non-Plastic In-Situ Soils (SM, ML) and Gravel
Watts Bar non-plastic in-situ soils, crushed stonebackfill, and basal gravel are described in Sections0-1.1.4, 0-1.2.2, and 0-1.2.3 of this Attachment. Resonantcolumn test data for undisturbed and remolded samples ofnon-plastic SM and ML material obtained from the Low LevelRadwaste Borrow Area is presented in Reference 7. Valuesof damping ratios from these tests are limited in number,and provide no apparent basis for deviation from Figure0-1.1-10. The damping ratio curve for sand proposed bySeed and Idriss (Figure 0-1-10) is considered appropriatefor these materials.
0-1.5.0 DAMPING RATIOS FOR ROCK
Purpose: To derive appropriate damping ratio curves for Watts Barweathered shale using general reference sources and site specificgeotechnical data.
0-1.5.1 Discussion
A damping ratio curve for rock was presented by Schnabel,Seed, and Lysmer in 1971 (Reference 20). This curve isshown in Figure 0-1-11.
0-1.5.2 Weathered Shale
Watts Bar weathered shale is described in Section 0-1.3.2of this attachment. The damping ratio curve for rockpresented by Schnabel, et. al. (Figure 0-1-11) isconsidered appropriate for this material.
OPGRT750 0-1-1103/28/89

0-1.6.0 EVALUATION OF RESONANT COLUMN TEST DATA FOR REMOLDED CL
Purpose: To evaluate resonant column test data for remolded CLmaterial for use in prediction of shear modulus for Class A backfill.
Resonant column test data for samples of remolded CL materialobtained from the Low Level Radwaste Borrow Area is presented inReference 7, pages 129 through 133. Test results are given for shearstrain amplitudes ranging between 10-3 and 10-2 percent. Inevaluating the data, the zero intercept was assumed to represent theshear modulus at 1 x 10⁻³ percent strain. In order to obtain Gmaxithese values were extrapolated to a strain of 1 x 10⁴percent usingthe following relationship (see Figure 0-1-4 of this Attachment):
Shear Modulus at Shear Strain 10-3 percent - 0.81Shear Modulus at Shear Strain 10-4 percent
Shear Modulus in ksf at 10-3 percent shear strain, remolded CL(Reference 7, pages 129 through 133).
Report Moisture Confining Pressure,Page Content 1.0 ksf 2.0 ksf 4.0 ksf 8.0 ksf
129 11.6% 5470 7060 9220 10,660130 12.7% 3530 4100 5040 6,050131 13.7% 4030 4540 5400 6,120132 16.2% 3740 4250 4540 4,900133 18.3% 3240 3530 3960 4,750
Convert to 10-4% shear strain:
G at 10-3% 4strain (5470)/0.81-G at 10- % strain - 6753, say 6750
Shear Modulus in ksf at 10-4% shear strain, remolded CL.
Moisture Confining Pressure, C3Content 1.0 ksf 2.0 ksf 4.0 ksf 8.0 ksf
11.6% 6750 8720 11,380 13,16012.7% 4360 5060 6220 7,47013.7% 4980 5600 6670 7,56016.2% 4620 5250 5600' 6,05018.3% 4000 4360 4980 5,860
It is noted that the tested samples were compacted to 95% ofStandard Proctor density.
0-1.7.0 EVALUATION OF STANDARD PENETRATION TEST RESULTS FOR CL BACKFILL
Purpose: To evaluate results of standard penetration testing to
OPGRT750 0-1-1204/13/89
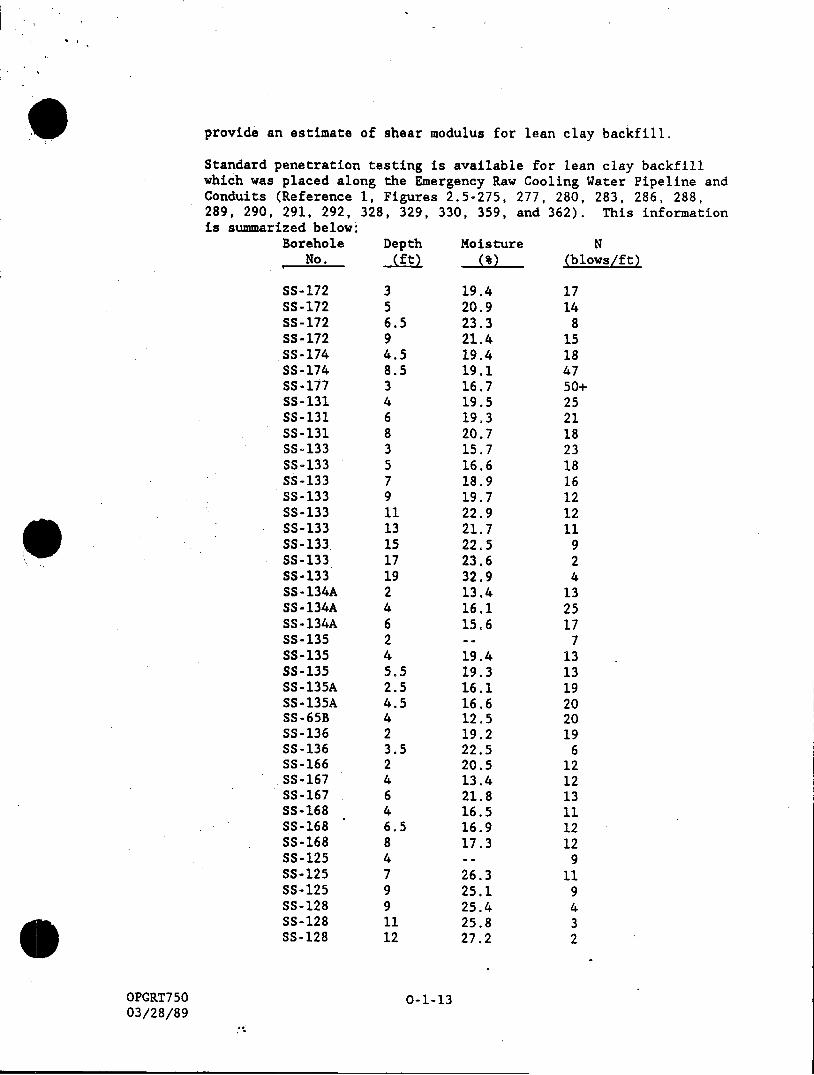
provide an estimate of shear modulus for lean clay backfill.
Standard penetration testing is available for lean clay backfillwhich was placed along the Emergency Raw Cooling Water Pipeline andConduits (Reference 1, Figures 2.5-275, 277, 280, 283, 286, 288,289, 290, 291, 292, 328, 329, 330, 359, and 362). This informationis summarized below:
Borehole Depth Moisture NNo. (ft) ) (blows/ft)
SS-172 3 19.4 17SS-172 5 20.9 14SS-172 6.5 23.3 8SS-172 9 21.4 15SS-174 4.5 19.4 18SS-174 8.5 19.1 47SS-177 3 16.7 50+SS-131 4 19.5 25SS-131 6 19.3 21SS-131 8 20.7 18SS-133 3 15.7 23SS-133 5 16.6 18SS-133 7 18.9 16SS-133 9 19.7 12SS-133 11 22.9 12SS-133 13 21.7 11SS-133 15 22.5 9SS-133 17 23.6 2SS-133 19 32.9 4SS-134A 2 13.4 13SS-134A 4 16.1 25SS-134A 6 15.6 17SS-135 2 -- 7SS-135 4 19.4 13SS-135 5.5 19.3 13SS-135A 2.5 16.1 19SS-135A 4.5 16.6 20SS-65B 4 12.5 20SS-136 2 19.2 19SS-136 3.5 22.5 6SS-166 2 20.5 12SS-167 4 13.4 12SS-167 6 21.8 13SS-168 4 16.5 11SS-168 6.5 16.9 12SS-168 8 17.3 12SS-125 4 -- 9SS-125 7 26.3 11SS-125 9 25.1 9SS-128 9 25.4 4SS-128 11 25.8 3SS-128 12 27.2 2
OPGRT750 0-1-1303/28/89

It is reported that this material was placed at a minimum of 90% ofStandard Proctor density, corresponding to specifications for ClassB backfill. A plot of standard penetration resistance versusmoisture content is shown in Figure 0-1-12.
Blow counts represented by the dashed line in Figure 0-1-12 areconverted to unconfined compressive strength (qu) using Figure0-1-13 (Reference 24), and to undrained shear strength (Su) usingthe relationship Su-- 0.5 qu. In Figure 0-1-13, the Terzaghi andPeck solid line plot is most widely used, and is adopted here asbeing representative of the range of possible values.
Moisture N qu Su -qu/2(%) (blows/ft) (ksf) (ksf)
12 17 4.5 2.218 17 4.5 2.219 16 4.2 2.120 15 4.0 2.021 14 3.7 1.8
Relationships between small strain shear modulus and undrained shearstrength for clays were presented by Egan and Ebeling in 1985(Reference 9). These relationships reflected theoreticalconsiderations and empirical data indicating that the ratio Gmax/Sufor clays is not a constant but rather decreases with increasingundrained shear strength. The data base included normalized soilparameter concepts, and data available from a variety of clay soilsfor in-situ and laboratory test conditions. Figure 0-1-14 showssuggested relationships for clay materials used in the followingcalculation:
Moisture Su Gmax(ksf) Gmax/S2 (ksf)
12 2.2 1290 284018 2.2 1290 284019 2.1 1305 274020 2.0 1325 265021 1.8 1340 2410
0-1.8.0 EVALUATION OF GEOPHYSICAL SURVEY DATA FOR IN-SITU SOILS
Purpose: To evaluate Watts Bar geophysical survey data for in-situsoils to establish representative values for shear wave velocity.
OPGRT750 0-1-1403/28/89
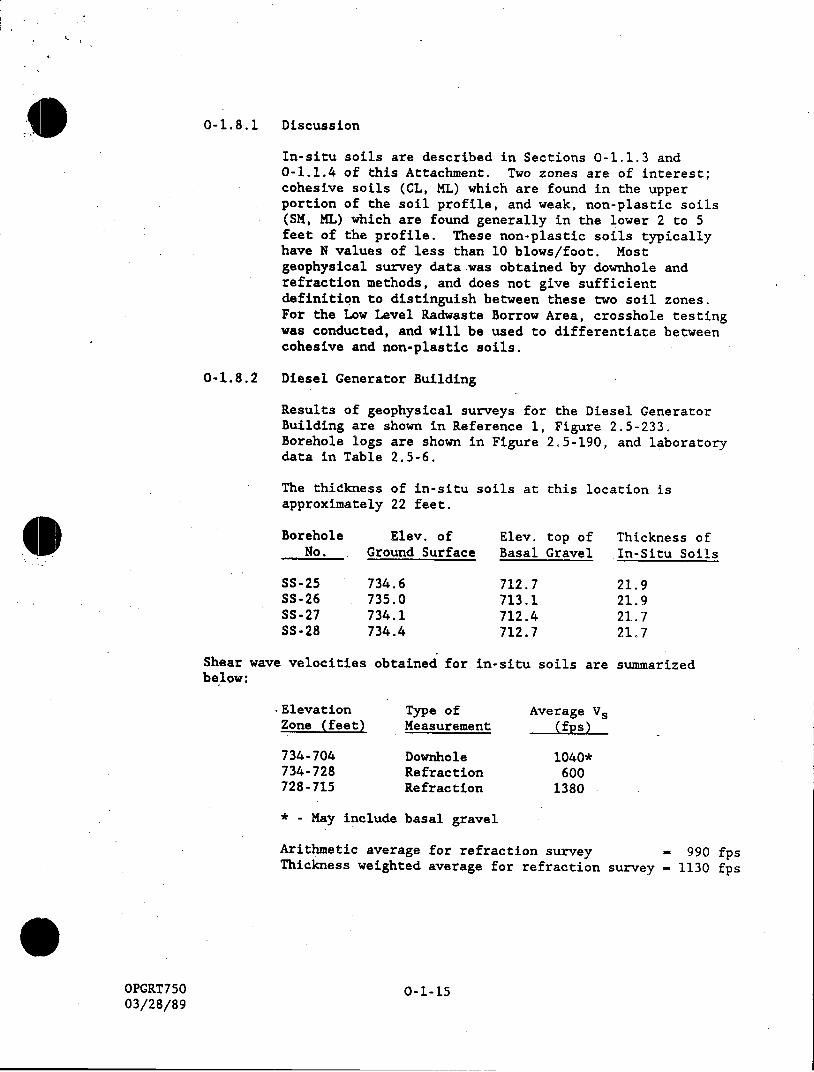
k
0-1.8.1 Discussion
In-situ soils are described in Sections 0-1.1.3 and0-1.1.4 of this Attachment. Two zones are of interest;cohesive soils (CL, ML) which are found in the upperportion of the soil profile, and weak, non-plastic soils(SM, ML) which are found generally in the lower 2 to 5feet of the profile. These non-plastic soils typicallyhave N values of less than 10 blows/foot. Mostgeophysical survey data was obtained by downhole andrefraction methods, and does not give sufficientdefinition to distinguish between these two soil zones.For the Low Level Radwaste Borrow Area, crosshole testingwas conducted, and will be used to differentiate betweencohesive and non-plastic soils.
0-1.8.2 Diesel Generator Building
Results of geophysical surveys for the Diesel GeneratorBuilding are shown in Reference 1, Figure 2.5-233.Borehole logs are shown in Figure 2.5-190, and laboratorydata in Table 2.5-6.
The thidkness of in-situ soils at this location isapproximately 22 feet.
Borehole Elev. of Elev. top of Thickness ofNo. Ground Surface Basal Gravel In-Situ Soils
SS-25 734.6 712.7 21.9SS-26 735.0 713.1 21.9SS-27 734.1 712.4 21.7SS-28 734.4 712.7 21.7
Shear wave velocities obtained for in-situ soils are summarizedbelow:
-Elevation Type of Average VsZone (feet) Measurement (fps)
734-704 Downhole 1040*734-728 Refraction 600728-715 Refraction 1380
• - May include basal gravel
Arithmetic average for refraction survey - 990 fpsThickness weighted average for refraction survey - 1130 fps
OPGRT750 0-1-1503/28/89
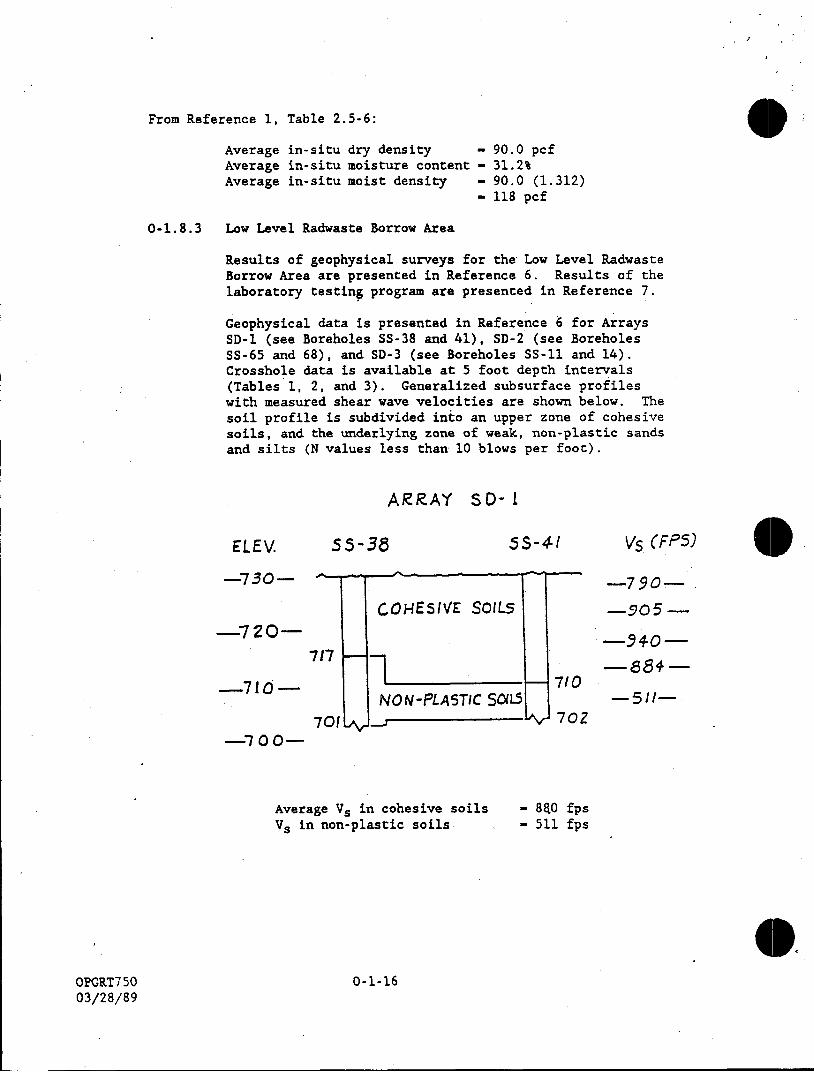
From Reference 1, Table 2.5-6:
Average in-situ dry densityAverage in-situ moisture contentAverage in-situ moist density
- 90.0 pcf- 31.2%- 90.0 (1.312)- 118 pcf
0-1.8.3 Low Level Radwaste Borrow Area
Results of geophysical surveys for the Low Level RadwasteBorrow Area are presented in Reference 6. Results of thelaboratory testing program are presented in Reference 7.
Geophysical data is presented in Reference 6 for ArraysSD-l (see Boreholes SS-38 and 41), SD-2 (see BoreholesSS-65 and 68), and SD-3 (see Boreholes SS-1l and 14).Crosshole data is available at 5 foot depth intervals(Tables 1, 2, and 3). Generalized subsurface profileswith measured shear wave velocities are shown below. Thesoil profile is subdivided into an upper zone of cohesivesoils, and the underlying zone of weak, non-plastic sandsand silts (N values less than 10 blows per foot).
ARRAY SD-I
ELEV.
-730-
-720-
-710-
55-38
717
701
-1
5S-41
COHESIVE SOILS
-710NON-PLASTIC 5OL1
Vs (FPS)
-790-
-5940-
-511-702
Average Vs in cohesive soilsV. in non-plastic soils
0-1-16
- 8M0 fps- 511 fps
OPGRT75003/28/89

ARRAY SD-2
ELEV
-730-
-7Z0-
-7/0-70&5
__70O.704.5
55-65 55-68
Average Vs in cohesive soils - 917 fpsAverage Vs in non-plastic soils - 614 fps
ARRAY S0-3
Vs (FPS)
-833-
-774--454-
5S-1I SS-14-
Average Vs in cohesive soilsVs in non-plastic soils
70e704
- 765 fps- 715 fps
Vs (FPS)
-740--77(
-780-
-74 --715-
Overall average Vs in cohesive soils - 854 fpsOverall average Vs in non-plastic soils - 613 fps
For cohesive soils (Reference 7, Table 2):
Average in-situ dry densityAverage in-situ moisture contentAverage in-situ moist density
- 96.8 pcf- 25.1%
96.8 (1.251)- 121 pcf
0-1-17
ELEV.
-730-
--720--
--710 --
OPGRT75003/28/89
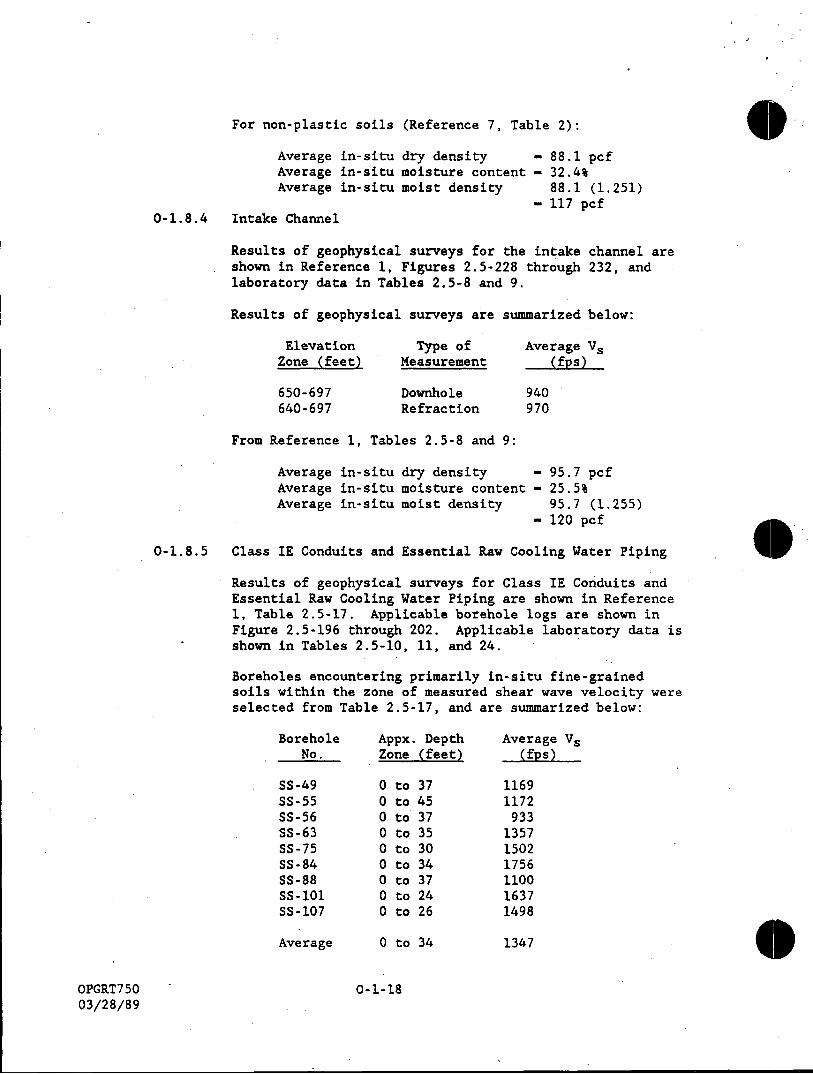
For non-plastic soils (Reference 7, Table 2):
Average in-situ dry densityAverage in-situ moisture contentAverage in-situ moist density
0-1.8.4 Intake Channel
- 88.1 pcf- 32.4%
88.1 (1.251)- 117 pcf
Results of geophysical surveys for the intake channel areshown in Reference 1, Figures 2.5-228 through 232, andlaboratory data in Tables 2.5-8 and 9.
Results of geophysical surveys are summarized below:
ElevationZone (feet)
650- 697640- 697
Type ofMeasurement
DownholeRefraction
Average Vs
From Reference 1, Tables 2.5-8 and 9:
dry densitymoisture contentmoist density
- 95.7 pcf- 25.5%
95.7 (1.255)- 120 pcf
0-1.8.5 Class IE Conduits and Essential Raw Cooling Water Piping
Results of geophysical surveys for Class IE Conduits andEssential Raw Cooling Water Piping are shown in Reference1, Table 2.5-17. Applicable borehole logs are shown inFigure 2.5-196 through 202. Applicable laboratory data isshown in Tables 2.5-10, 11, and 24.
Boreholes encountering primarily in-situ fine-grainedsoils within the zone of measured shear wave velocity wereselected from Table 2.5-17, and are summarized below:
Appx. DepthZone (feet)
0 to 34
Average V5(fps)
11691172
933135715021756110016371498
1347
0-1-18
AverageAverageAverage
in-situin-situin-situ
BoreholeNo.
SS-49SS-55SS -56SS -63SS-75SS-84SS-88SS-101SS-107
Average
OPGRT7 5003/28/89

From Reference 1, Tables 2.5-10, 11, and 24 forfine-grained soils:
-Average in-situ dry density - 100.9 pcfAverage in-situ moisture content - 22.4%Average in-situ moist density 100.9 (1.224)
- 124 pcf
It should be noted that in this area, as compared withother areas where geophysical surveys were conducted, blowcounts from standard penetration were higher, moistdensity was slightly higher, and occasional zones ofgravel were present in the profile. These factors accountfor the higher average shear wave velocity.
0-1.9.0 EVALUATION OF RESONANT COLUMN TEST DATA FOR COHESIVE IN-SITU SOILS
Purpose: To evaluate resonant column test data for undisturbedsamples of cohesive in-situ soils for use in prediction of shearmodulus.
Resonant column test data for undisturbed samples of CL materialobtained from the Low Level Radwaste Borrow Area is presented inReference 7, pages 96 and 97. Test results are given for shearstrain amplitudes ranging between 10-3 and 10-2 percent. Inevaluating the data, the zero intercept was assumed to represent theshear modulus at 10-3 percent strain. In order to obtain Gmax,these values were extrapolated to a strain of 1 x 10- 4 percent,using the following relationship for an assumed undrained shearstrength of 1.2 ksf (see Figure 0-1-5 of this Attachment):
Shear Modulus at Shear Strain 10- 3 percent - 0.78Shear Modulus at Shear Strain 10-4 percent
Shear Modulus in ksf at 10-3% shear strain, undisturbed CL(Reference 7, pages 96 and 97).
Report Moisture Confining Pressure, c 3Page Content 1.0 ksf 2.0 ksf 4.0 ksf 8.0 ksf
96 10.8% 910 1610 3080 6,83097 29.3% 620 1040 1610 2,880
Convert to 10-4% shear strain:
G at 10-3% strain (910)/0.78- G at 10-4% strain - 1167, say 1170
OPGRT750 0-1-1903/28/89

Shear Modulus in ksf at 10-4% shear strain, undisturbed CL.
.Moisture Confining Pressure,dr 3
Content 1.0 ksf 2.0 ksf 4.0 ksf 8.0 ksf
10.8% 1170 2060 3950 876029.3% 790 1330 2060 3690
0-1.10.0 SECTION OF (K2)max VALUE FOR CRUSHED STONE BACKFILL
Purpose: To select a value of (K2)max for Watts Bar crushed stonebackfill using general reference sources and site specificgeotechnical data.
Values of (K2)max for gravels were presented by Seed, Wong, Idriss,and Tokimatsu in 1984 (Reference 12). This data was based on acomprehensive series of laboratory tests performed on 12-inchdiameter samples of natural gravels and crushed stone. The Pyramidmaterial tested by Seed, et. al is selected for comparison on thebasis of similarities in gradation and relative density (see Section0-1.2.2 of this Attachment), and because both materials wereproduced by crushing. Values of K2 obtained for the Pyramidmaterial are shown in Figure 0-1-15.
(K2)max for Dr 95% '- 129(K2)max for Dr 80% 2'92
(K2)max for Dr 2' 81%
- 92 + (129-92/15) - 94, say 100
For use in the equation G - 1000 k2 (6)1/2
0-1.11.0 SELECTION OF (K2)MAX VALUE FOR NON-PLASTIC IN-SITU SOILS (SM, ML)
Purpose: To select a value of (k2)max for Watts Bar in-situnon-plastic soils using general reference sources and site specificgeotechnical data.
Values of (k2)max for sands were presented by Seed and Idriss in1970 (Reference 11). These values were based primarily on dataobtained from laboratory testing, supplemented by field shear wavevelocity measurements at low strain levels.
An average shear wave velocity of 613 fps was obtained for the zoneof weak, non-plastic soils present at Watts Bar (see Sections0-1.8.1 and 0-1.8.3 of this Attachment). Using a typical profilefor the'Low Level Radwaste Borrow Area and a moist density of 120pcf:
OPGRT750 0-1-2003/28/89
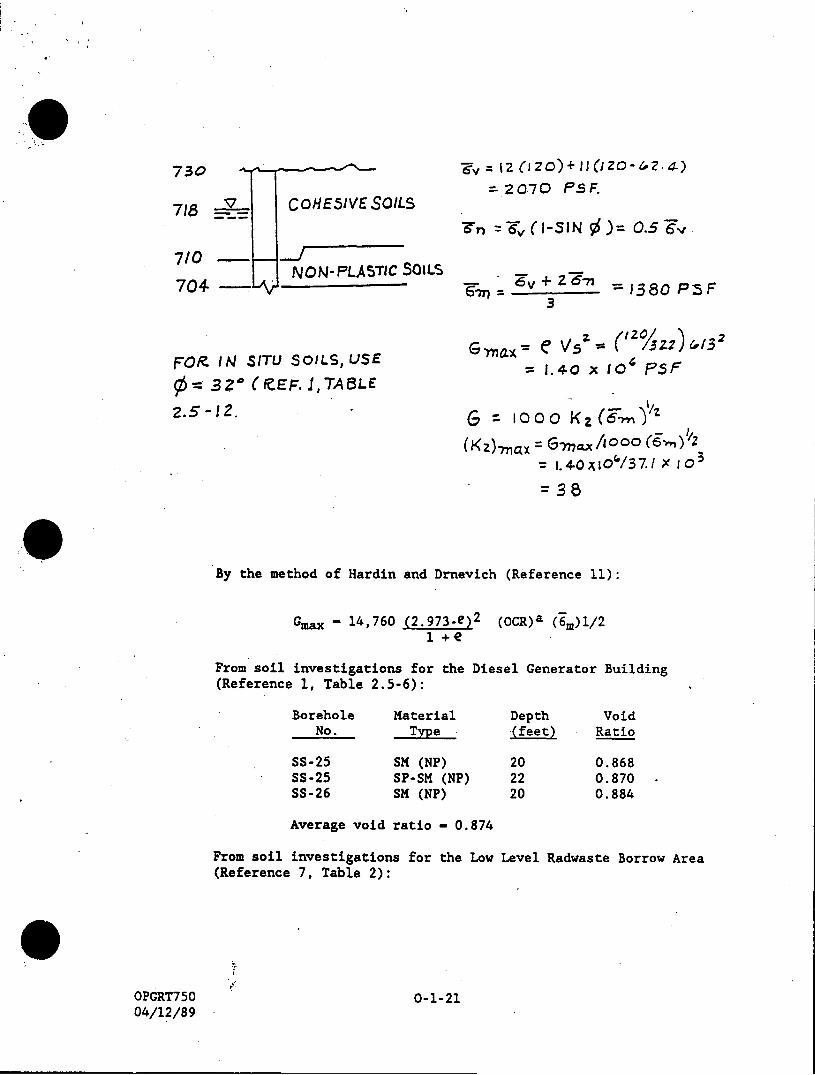
, COHE5IVESOILS
NON- PLASTIC SOILS
F-Oi IN SITU SOILS, USE
-3 3Z (Z EF. 1, TABLE
2.5-12.
6-v = 12 (120)+I10zo-z.14)
=.2070 PSF.
Tv =6 (I-SIN • =0.5 T-V
97= v + z -&-n= 50;'F______ 1380 P5F3
1.40 x t0o F5F
G z iooo K ("-.,'/(Kz)Gax = 0G-m00 /1°°° 3
= i.4.Oi0/37. X 10
=38
By the method of Hardin and Drnevich (Reference 11):
Gmax - 14,760 (2.973-e) 2
1 +e(OCR)a (ý.)1/2
From soil investigations for the Diesel Generator Building(Reference 1, Table 2.5-6):
MaterialType
SM (NP)SP-SM (NP)SM (NP)
Depth Void(feet) Ratio
0.8680.8700.884
Average void ratio - 0.874
From soil investigations for the Low Level Radwaste Borrow Area(Reference 7, Table 2):
0-1-21
730
718
710
704
BoreholeNo.
SS-25SS-25SS-26
OPGRT75004/12/89
mm

Borehole Material Depth VoidNo. Type (feet) Ratio
SS-5 SM (NP) 21 0.757SS-12 SM (NP) 23 1.162SS-13 SM (NP) 22 0.741SS-13A SM (NP) 20 0.802SS-20 ML (NP) 20 0.943SS-20 SM (NP) 23 1.004SS-29 SP-SM (NP) 26 0.999SS-34A SM (NP) 21 1.154SS-39A SM (NP) 26 0.983SS-39A SM (NP) 31 0.794SS-44A SM (NP) 26 0.942SS-44A SM (NP) 26 0.931SS-55 SM (NP) 24 0.833SS-62 SP-SM (NP) 24 0.628SS-71A SM (NP) 21 0.913
Average void ratio - 0.906
Use: e - 0.9066m - 1380 psfOCR - 1.0 (normally consolidated)
Gmax - 14,760 (2.973 - .906)2 (1) (1380)1/21 + .906
- 1.22 x 10⁶ psf versus 1.40 x 10⁶ psf fromshear wave velocity - 614 fps
The close agreement between Gmax by the two methods supports the use
of (K2)max - 38.
0-1.12.0 SELECTION OF (K2)MAX VALUE FOR BASAL GRAVEL
Purpose: To select a value of (k2)max for Watts Bar basal gravelusing general reference sources and site specific geotechnical data.
Geophysical refraction surveys for the Diesel Generator Building(Reference I, Figure 2.5-233) gave an average shear wave velocity of1660 fps in an approximate depth zone of 19 to 39 feet. Saturatedunit weight of basal gravel is taken as 143 pcf (Reference 1, Table2.5-44).
OPGRT750 0-1-2204/13/89
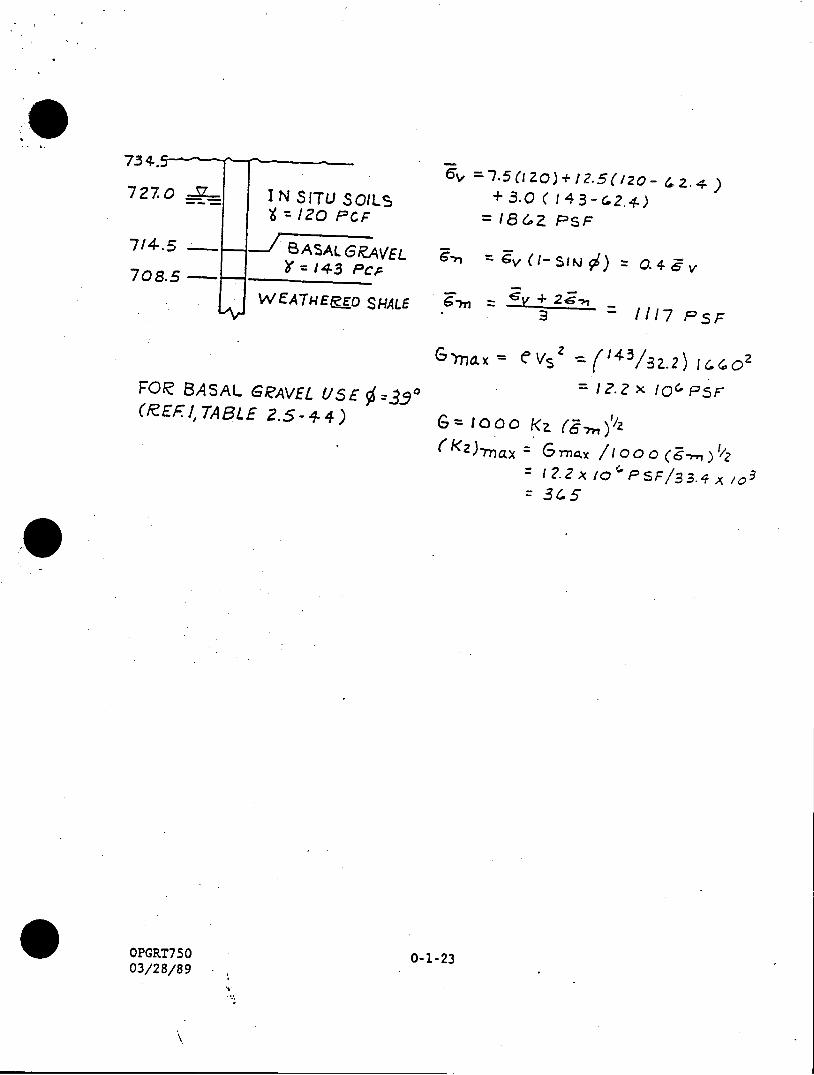
73 4-.5---
727.0 --.-_
714-.5
708.5.
IN SITU SOILS120 PCF
/B ASAL G AVEL•'= 143 PCF-
WEATH4EfEO SHALE
6V =7.5(0zo)+/2.5(1zo_. Z.4)+ 3.0 (143- (2..4)
= 18e-Z PSF
lg'v = -(I- SIN ) = o. 43:v
=
GM , = evs' -- 3 1' 3 2.2) 1a o117Z x 10P15F
G= 0o Kz -,,)/(KzMax :G,• /i ooo og)•'
1 2.2 10'o• PSF133., A 1o3
3655
FGR BASAL GRAVEL USE =3_9(REFI,TABLE 2.5-44)
OPGRT75003/28/89
0-1-23
1117 P5F
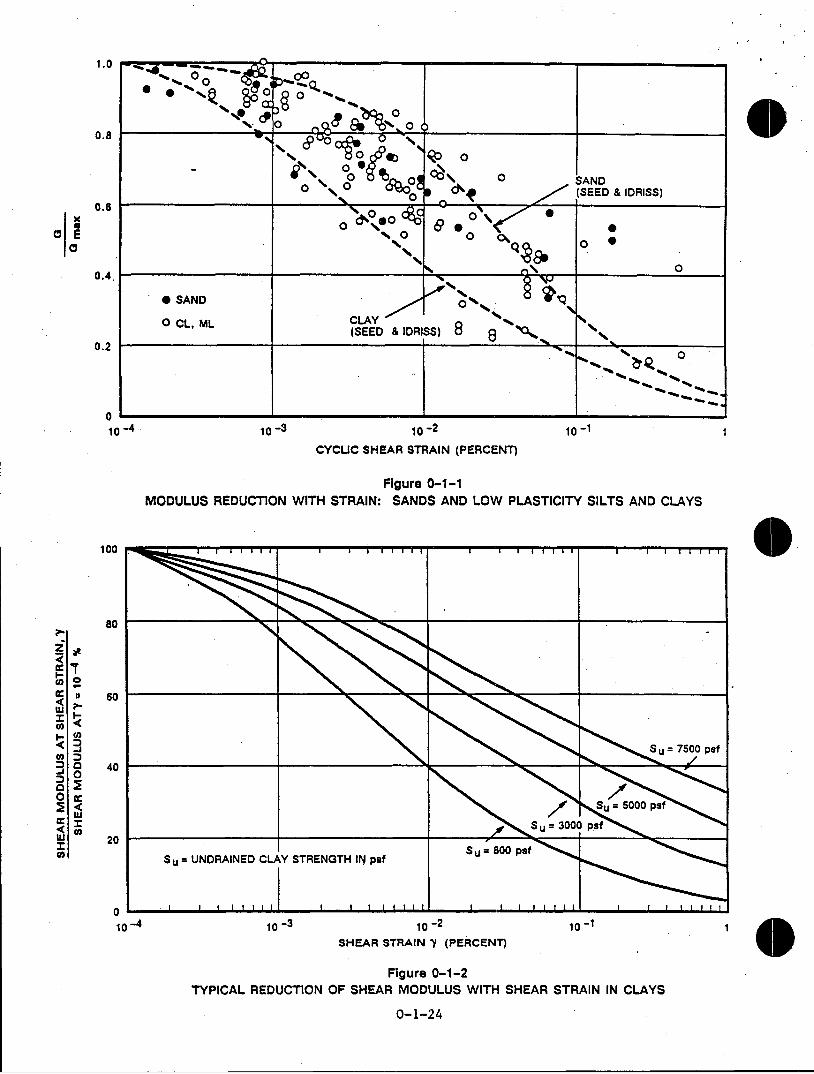
10-3 10-2 10-1
CYCUC SHEAR STRAIN (PERCENT)
Figure 0-1-1MODULUS REDUCTION WITH STRAIN: SANDS AND LOW PLASTICITY SILTS AND CLAYS
10-3 10- 2 10-1SHEAR STRAIN ýy (PERCENT)
Figure 0-1-2TYPICAL REDUCTION OF SHEAR MODULUS WITH SHEAR STRAIN IN CLAYS
0-1-24
10-4
010-4

0.8
0.6
0.4
0.2
0-10- 3 10- 2
CYCLIC SHEAR STRAIN (PERCENT)
Figure 0-1-3MODULUS REDUCTION WITH STRAIN
10-2 10-1SHEAR STRAIN -y (PERCENT)
Figure 0-1-4TYPICAL REDUCTION OF SHEAR MODULUS WITH SHEAR
0-1-25STRAIN IN CLAYS
0 L-10- 4
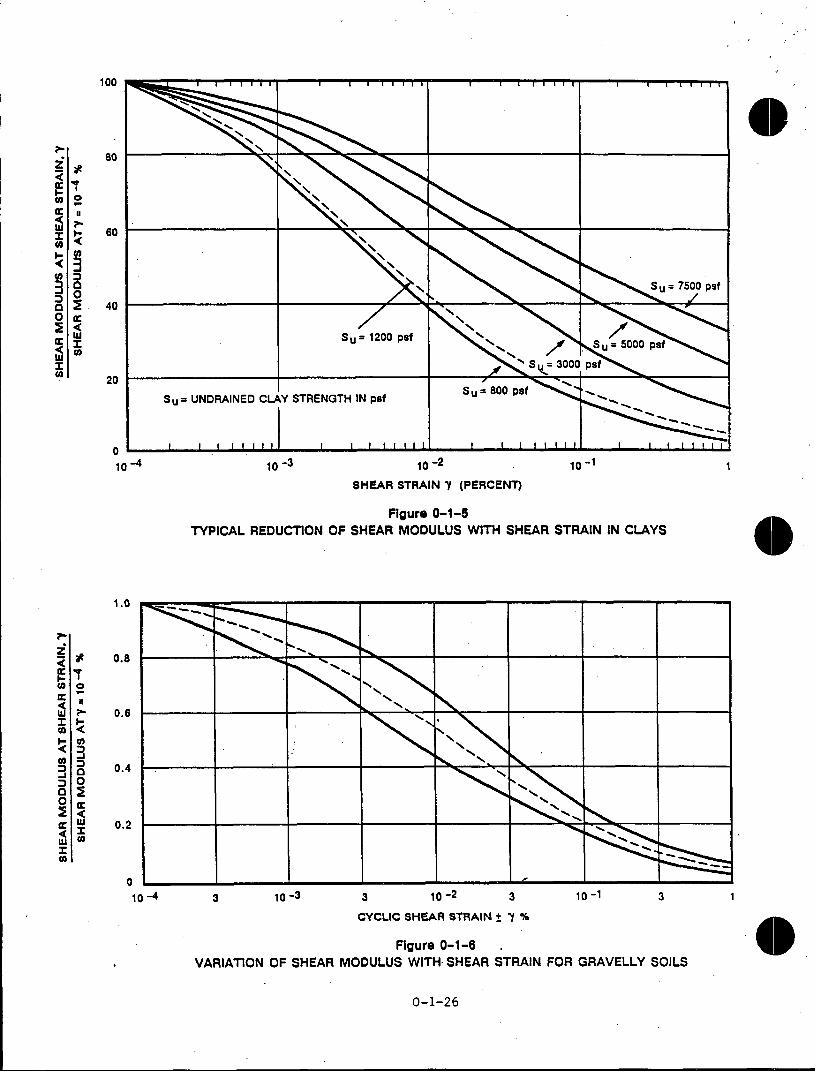
10 -4 10-3 10- 2 10-1 1
SHEAR STRAIN / (PERCENT)
Figure 0-1-5TYPICAL REDUCTION OF SHEAR MODULUS WITH SHEAR STRAIN IN CLAYS
0.8
0.6
0.4
0.2
0
VARIATION OF SHEAR
3 10-2 3
CYCLIC SHEAR STRAIN t -1 %
Figure 0-1-6MODULUS WITH- SHEAR STRAIN
10-1
FOR GRAVELLY SOILS
0-1-26
10 -4

U.S. STANDARD SIEVE SIZES3/4" 3/8" 4 8 16 30 50 100 200
30 10 3 1.0 0.3 0.1 0.03 0.01 0.003
6S 3" 1-1,2* 3,4" 3/8" 4 8 18 30 50 100 200100 ' " r
GRADATION (c) LIVERMORE NATURAL GRAVEL
80
WNGRANULAR MATERAL.
60 ~
GRADATION40 -\-
20 --
0
10 3 1.0 0.3 0.1 0.03 0.01 0.003 0.001PARTICLE SIZE - INCHES
Figure 0-1-7GRAIN SIZE DISTRIBUTION CURVES FOR FIELD AND MODELED GRADATIONS
0-1-27

U.S. STANDARD SIEVE SIZES
6" 3" 1-1/2" 3/4" 3/8" 4 8 16 30 50 100 200100
80
60
40
20
0
100
80
z 60I-
zo 40
'U
20
0
100
80
60
40
20
0
24" 12" 6" 3" 1-1/2" 3/4' 3/8" 4 8 16 30 50 100 200
(b) PYRAMID MATERIAL
S WBN BASAL GRAVEL
MODELED.,
GRADATION
FIELD~~
30 10 3 1.0 0.3 0.1 0.03 0.01 0.003
6" 3" 1-1/2" 3/4" 3/8" 4 8 16 30 50 100 200
10 3 1.0 0.3 0.1 0.03
PARTICLE SIZE - INCHES
0.01 0.003 0.001
Figure 0-1-8GRAIN SIZE DISTRIBUTION CURVES FOR FIELD AND MODELED GRADATIONS
0-1-28
10 3 1.0 0.3 0.1 0.03 0.01 0.003 0.001
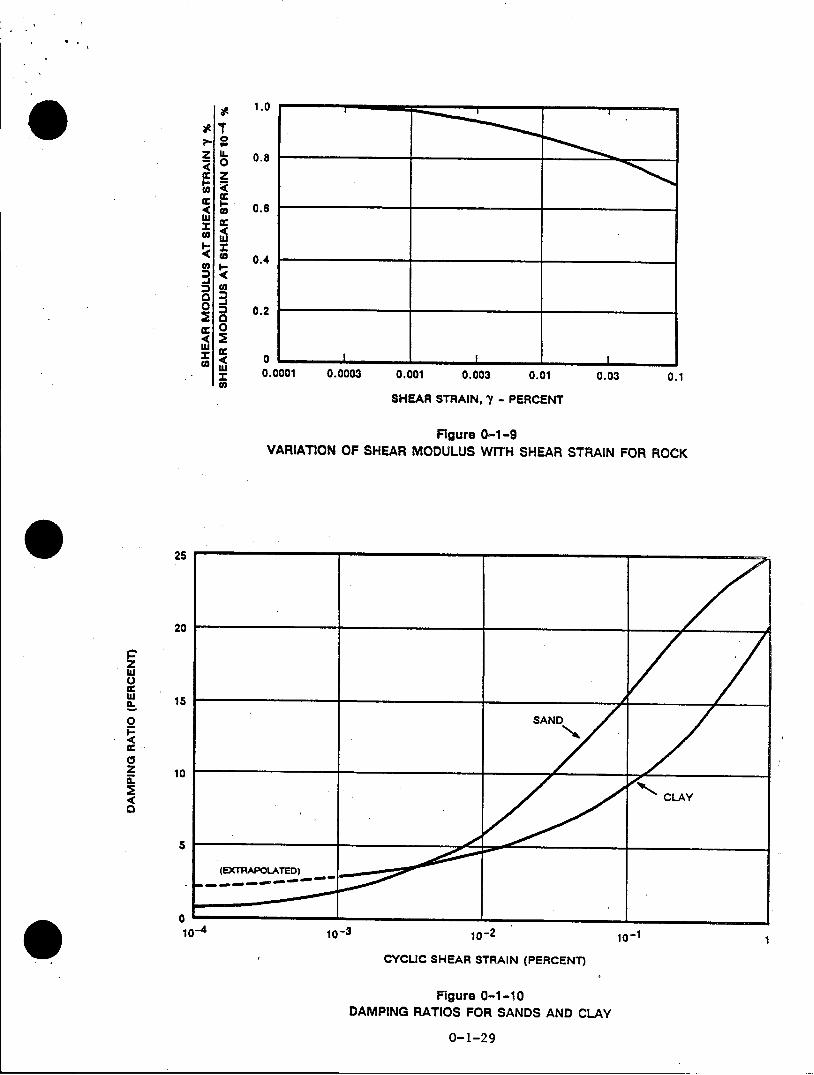
0.0001 0.0003 0.001 0.003 0.01 0.03 0.1
SHEAR STRAIN, -Y - PERCENT
Figure 0-1-9VARIATION OF SHEAR MODULUS WITH SHEAR STRAIN FOR ROCK
10-3 10)-2 10-1
CYCLIC SHEAR STRAIN (PERCENT)
Figure 0-1-10DAMPING RATIOS FOR SANDS AND CLAY
0-1-29
1.0
0.8
0.8
0.4
0.2
0 I I
0 L-10-4

0.0c 01 0.0003 0.001 0.003 0.01 0.03
SHEAR STRAIN, 7 - PERCENT
Figure 0-1-11DAMPING RATIOS FOR ROCK
15 20 25 30MOISTURE CONTENT, PERCENT
Figure 0-1-12STANDARD PENETRATION RESISTANCE vs
MOISTURE CONTENT IN LEAN CLAY BACKFILL
0 0.5 1.0 1.5 2.0 2.5 3.0
UNCONFINED COMPRESSIVE STRENGTH qu, TSF
3.5 4.0
Figure 0-1-13CORRELATION OF STANDARD PENETRATION RESISTANCE
0-1-30
40
I-.0
3rn 20-Im0II
z
0
001010.00 0.030.0003 0.001 0.003 0.01
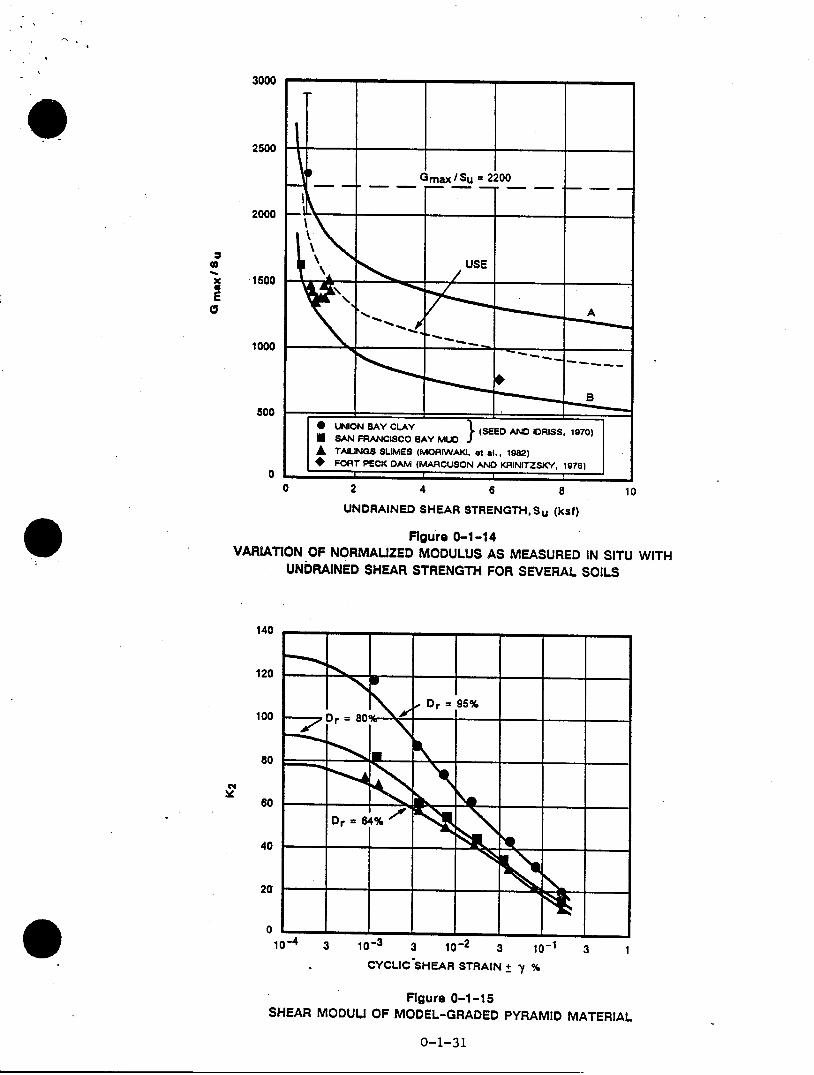
3000
2500
2000
.1500
1000
500
0
UNDRAINED SHEAR STRENGTHSu (kst)
Figure 0-1-14VARIATION OF NORMALIZED MODULUS AS MEASURED IN SITU WITH
UNDRAINED SHEAR STRENGTH FOR SEVERAL SOILS
CYCLIC SHEAR STRAIN t -f %
Figure 0-1-15SHEAR MODULI OF MODEL-GRADED PYRAMID MATERIAL
0-1-31
* UNION BAY CLAY I (SEED AND IDRISS, 1970)* SAN FRANCISCO BAY MUDA TALUNGW SUMES (MORIWAKI, at al., 1982)* FORT PECK DAM (MARCUSON AND KRINITZSKY, 1976)I I
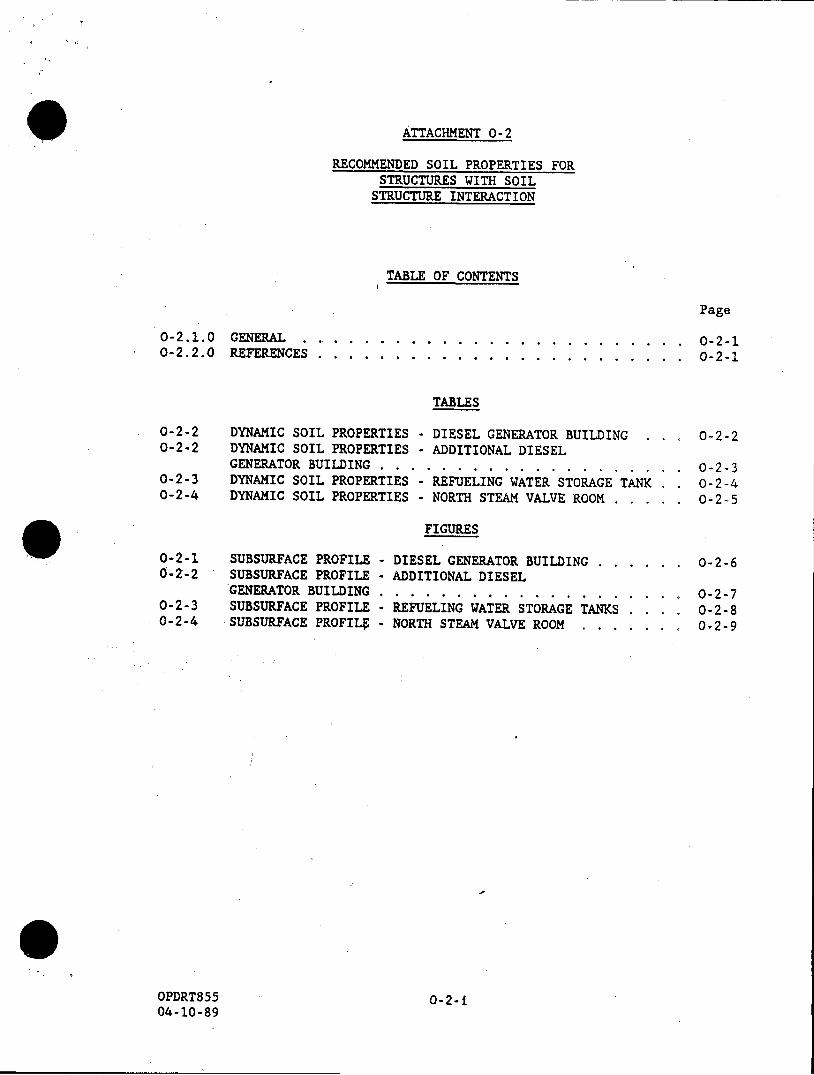
ATTACHMENT 0-2
RECOMMENDED SOIL PROPERTIES FORSTRUCTURES WITH SOIL
STRUCTURE INTERACTION
TABLE OF CONTENTS
Page
0-2.1.0 GENERAL ..0-2.2.0 REFERENCES . . . . . . . . . . . . . . . . . . . . . . . .
0-2-10-2-1
TABLES
0-2-2 DYNAMIC SOIL PROPERTIES - DIESEL GENERATOR BUILDING ...0-2-2 DYNAMIC SOIL PROPERTIES - ADDITIONAL DIESEL
GENERATOR BUILDING........ . .. .. .. .. ...........0-2-3 DYNAMIC SOIL PROPERTIES - REFUELING WATER STORAGE TANK
DYNAMIC SOIL PROPERTIES - NORTH STEAM VALVE ROOM
0-2-2
0-2-30-2-4
.0-2-5
FIGURES
0-2-1 SUBSURFACE PROFILE0-2-2 SUBSURFACE PROFILE
GENERATOR BUILDING0-2-3 SUBSURFACE PROFILE0-2-4 SUBSURFACE PROFILF
OPDRT85504-10-89
- DIESEL GENERATOR BUILDING ...- ADDITIONAL DIESEL
REFUELING WATER STORAGENORTH STEAM VALVE ROOM
TANKS
0-2-1
0-2-4
0-2-6
0-2-70-2-80-2-9
ATTACHMENT 0-2
RECOMMENDED SOIL PROPERTIES FORSTRUCTURES WITH SOIL
STRUCTURE INTERACTION
0-2.1.0 GENERAL
The following safety related WBN structures are to be analyzedconsidering Soil Structure Interaction.
o Diesel Generator Building
o Additional Diesel Generator Building
o Refueling Water Storage Tanks
0 North Steam Valve Room
This Attachment describes the soil media profiles for thesestructures and provides recommendations on the appropriate soil-properties to be used in their analysis.
0-2.2.0 REFERENCES
1. SAP Appendix 0 and Attachment 0-1.
2. TVA, Division of Construction, Construction Services Branch,Report No. 9-2014, Watts Bar Nuclear Plant SiteInvestigation and Laboratory Testing.
3. Watts Bar Nuclear Plant, FSAR Figure 2.5-233.
4. Watts Bar Nuclear Plant, TVA Drawing 10W335.
5. W~atts Bar Nuclear Plant, TVA Drawing 10W336.
6. Memo from Frank Van Meter to R. M. Pierce,September 13, 1979, Watts Bar Nuclear Plant, ERCW SystemSoils Investigation, En Des Soil Schedule No. 31.3A, RIMS
CSB 790914003.
7. Memo from Frank Van Meter to R. M. Pierce,September 27, 1979, Watts Bar Nuclear Plant, Category I SoilSupported Structures, Additional Soils Investigations, RIMSCSB 790927002.
OPDRT855 0-2-104-10-89
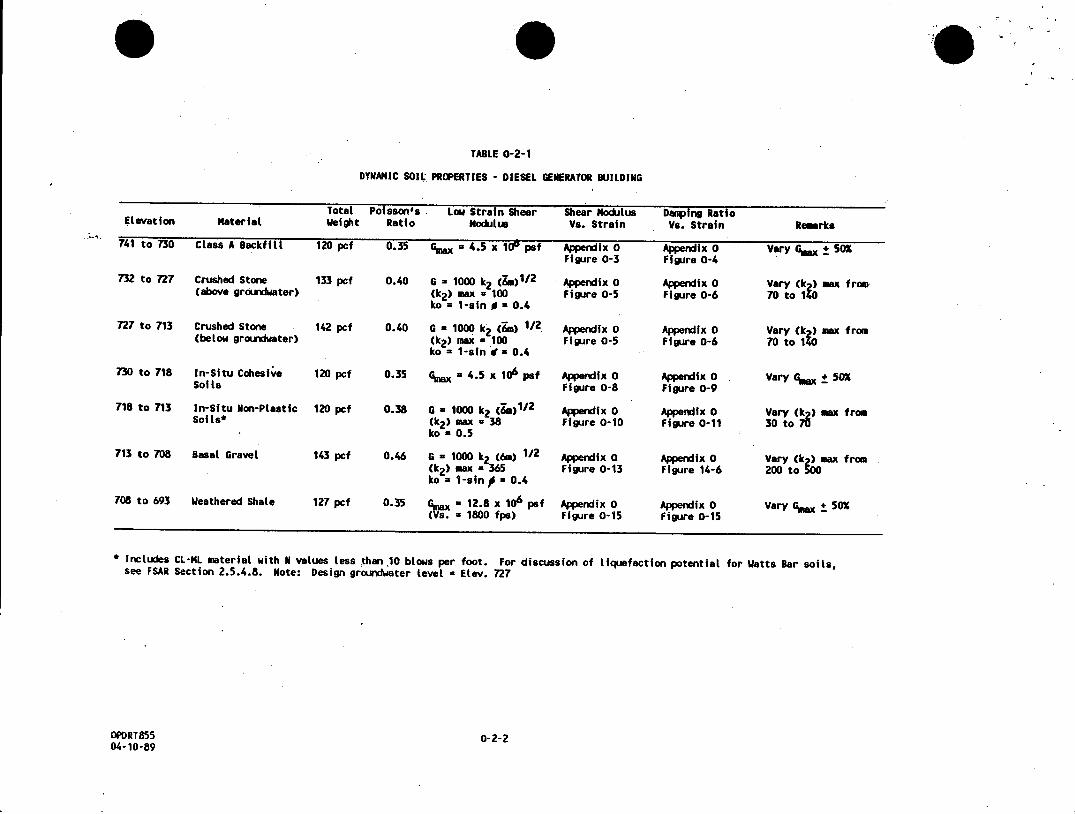
Elevation Material
741 to 730 Class A Backfill
732 to 727 Crushed Stone(above groundwater)
727 to 713 Crushed Stone(below groundwater)
730 to 718 In-Situ CohesiveSofis
718 to 713 In-Situ Non-PlasticSol 1s*
713 to 708 Basal Gravel
708 to 693 Weathered Shale
TABLE 0-2-1
DYNAMIC SOIL PROPERTIES - DIESEL GENERATOR BUILDING
Total Poisson's . Low Strain Shear Shear ModulusWeight Ratio Modulus Vs. Strain
120 pcf 0.35 GCax = 4.5 x 10 psf Appendix 0Figure 0-3
133 pcf 0.40 G - 1000 k2 (Z1)112 Appendix 0(k2 ) max - 100 Figure 0-5ko = 1-sin j a 0.4
142 pcf 0.40 G 1000 k2 (&g) 1/2 Appendix 0(k2) max = 100 Figure 0-5ko a 1-sin 4(= 0.4
120 pcf 0.35 G.ax a 4.5 x 10⁶ pef Appendix 0Figure 0-8
120 pcf 0.38 G - 1000 k2 (&n)1 / 2 Appendix 0(k2) max -38 Figure 0-10ko - 0.5
143 pcf 0.46 G = 1000 k2 (6.) 1/2 Appendix 00k2 ) max a 365 Figure 0-13ko a 1-sin P = 0.4
127 pcf 0.35 6 a 12.8 x 10⁶ pef Appendix 0(Vs.- 1800 fps) Figure 0-15
Danping RatioVs. Strain
Appendix 0Figure 0-4
Appendix 0Figure 0-6
Appendix 0Figure 0-6
Appendix 0Figure 0-9
Appendix 0Figure 0-11
Appendix 0Figure 14-6
Appendix 0Figure 0-15
Remarks
Vary Gmx ± SOX
Vary (k ) max froms70 to 140
Vary (k ) max from70 to 14
vary %.ax ± 5
Vary (k 2 ) max from30 to 70
Vary (k 2 ) max from200 to 500
Vary Gna ± 50%
* Includes CL-ML material with N values less than 10 blows per foot. For discussion of liquefaction potential forsee FSAR Section 2.5.4.8. Note: Design groundwater level = Etev. 727
OPDRT855 0-2-204-10-89
Watts Bar soils,
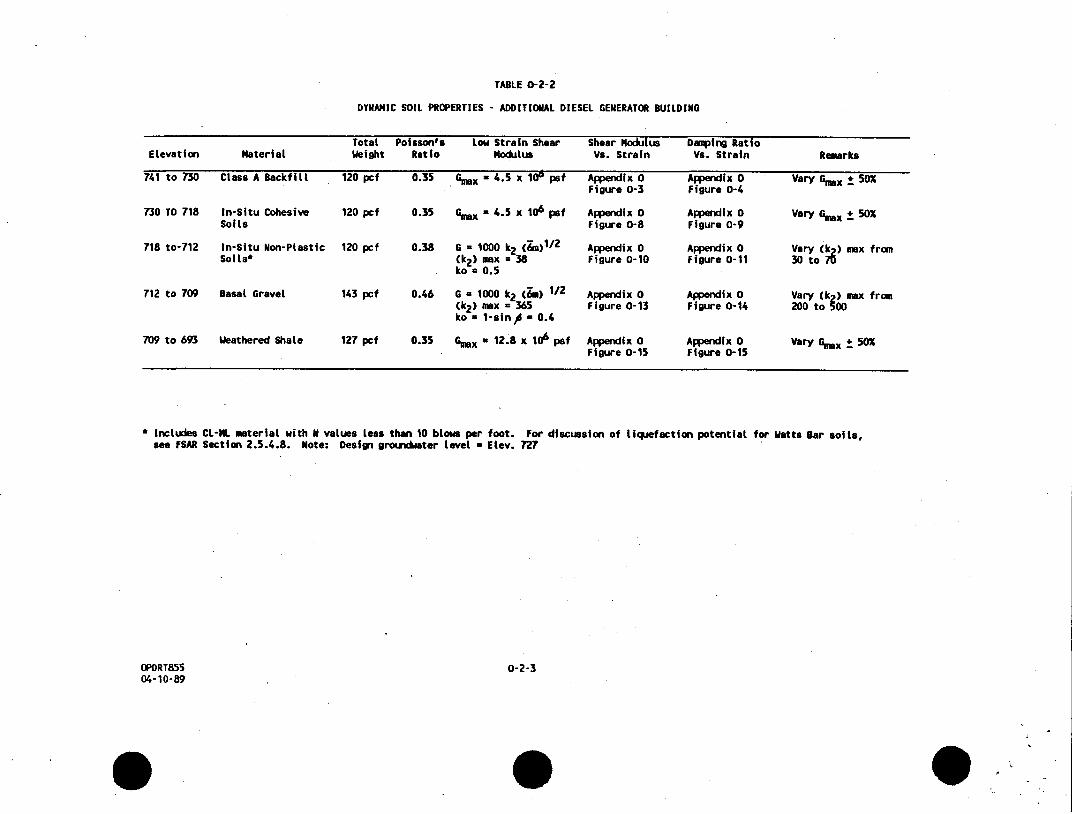
Elevation
741 to 730
730 TO 718
718 to-712
Material
Class A Backfill
In-Situ CohesiveSolis
In-Situ Non-PlasticSoils*
712 to 709 Basal Gravel
709 to 693 Weathered Shale
TABLE 0-2-2
DYNAMIC SOIL PROPERTIES - ADDITIONAL DIESEL GENERATOR BUILDING
Total Poisson's Low Strain Shear Shear Modulus DamWeight Ratio Modulus Vs. Strain V9
120 pcf 0.35 Gmax - 4.5 x 10⁶ psf Appendix 0 AppFigure 0-3 FiE
120 pcf 0.35 Gmx = 4.5 x 10⁶ psf Appendix 0 AIpFigure 0-8 Fig
120 pcf 0.38 G = 1000 k2 (&n0)1 / 2 Appendix 0 App0k2 ) max 38 Figure 0-10 Figko a 0.5
143 pcf 0.46 G - 1000 k2 (6..) 1/2 Appendix 0 Api(k2 ) max a 365 Figure 0-13 Figko a1-sin d a 0.4
127 pcf 0.35 G6,x - 12.8 x 10⁶ psf Appendix 0 AppFigure 0-15 FIg
mping Ratios. Strain
endlix 0lure 0-4
)endix 0iure 0-9
)endix 0iure 0-11
)endix 0pure 0-14
endix 0pure 0-15
Remarks
Vary ,mx ± 50%
Vary Gmx ± so5
Vary (k ) mx fran30 to 70
Vary (k 2 ) max from200 to 500
Vary Gmx ± 50%
Includes CL-NL material with N values less than 10 blow& per foot. For discussion of liquefaction potential for Watts Bar soils,see FSAR Section 2.5.4.8. Note: Design groundwater level * Elev. 727
OPDRT855 0-2-304-10-89
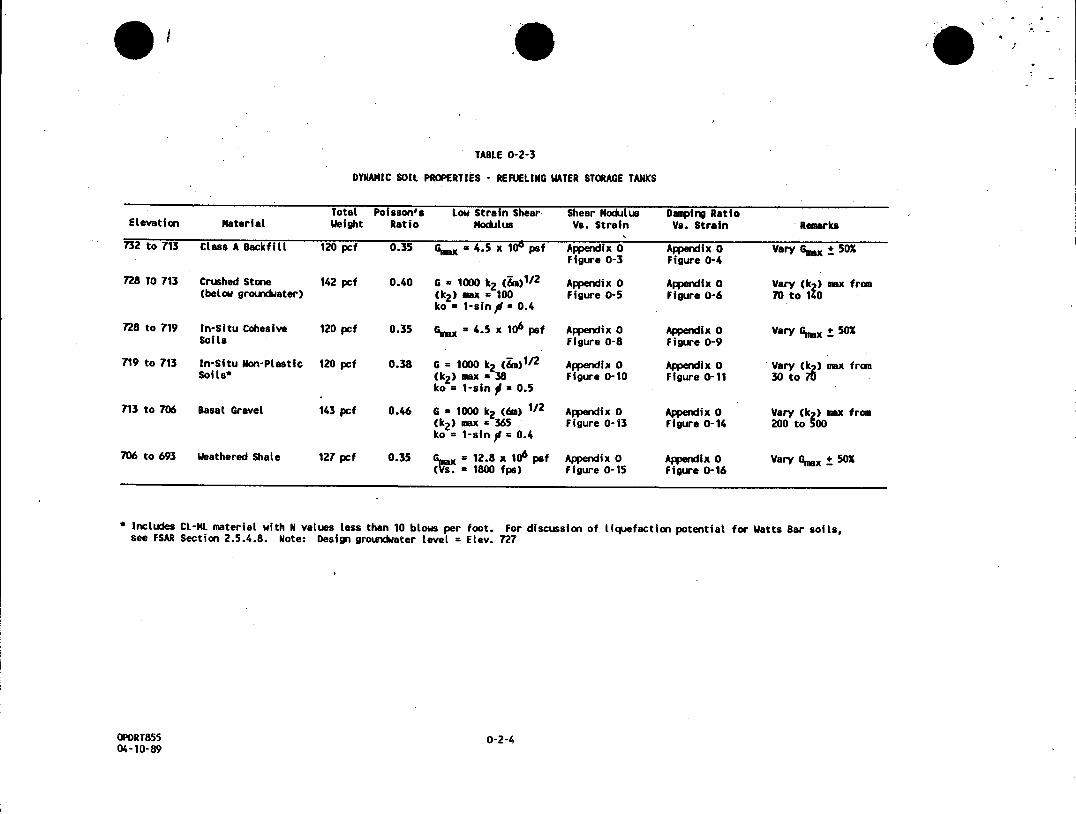
TABLE 0-2-3
DYNAMIC SOIL PROPERTIES - REFUELING WATER STORAGE TANKS
Total Poisson's Low Strain Shear Shear Modulus Damping RatioElevation Material Weight Ratio Modulus Vs. Strain Vs. Strain Remarks
732 to 713 Class A BackfItt 120 pcf 0.35 Gax a 4.5 x 10⁶ psf Appendix 0 Appendix 0 Vary Gmx ± 501Figure 0-3 Figure 0-4
728 TO 713 Crushed Stone 142 pcf 0.40 G - 1000 k2 (&))1/ 2 Appendix 0 Appendix 0 Vary (k2 ) max from(below groundwater) 0k2 ) mx z 100 Figure 0-5 Figure 0-6 70 to 140
ko = 1-sfn# a 0.4
728 to 719 In-Situ Cohesive 120 pcf 0.35 Gx - 4.5 x 10⁶ pef Appendix 0 Appendix 0 Vary Gmx ± 50%Soils Figure 0-8 Figure 0-9
719 to 713 In-Situ Non-Plastic 120 pcf 0.38 6 = 1000 k2 (Fm)1/2 Appendix 0 Appendix 0 Vary (k2 ) max fromSoits* (k2) max - 38 Figure 0-10 Figure 0-11 30 to i)
ko= 1-sin 0.5
713 to 706 Basal Gravel 143 pcf 0.46 G a 1000 k2 (6m) 1/2 Appendix 0 Appendix 0 Vary (k 2 ) max from0k2 ) max = 365 Figure 0-13 Figure 0-14 200 to 500ko a 1-sin # a 0.4
706 to 693 Weathered Shale 127 pcf 0.35 %s x = 12.8 x 10⁶ pef Appendix 0 Appendix 0 Vary Gmax ± 502(s. 1800 fps) Figure 0-15 Figure 0-16
Includes CL-HL material with N values tess than 10 blows per foot. For discussion of liquefaction potential forsee FSAR Section 2.5.4.8. Note: Design groundwater level = Elev. 727
OPDRTS5504-10-89
Watts Bar soils,
0-2-4
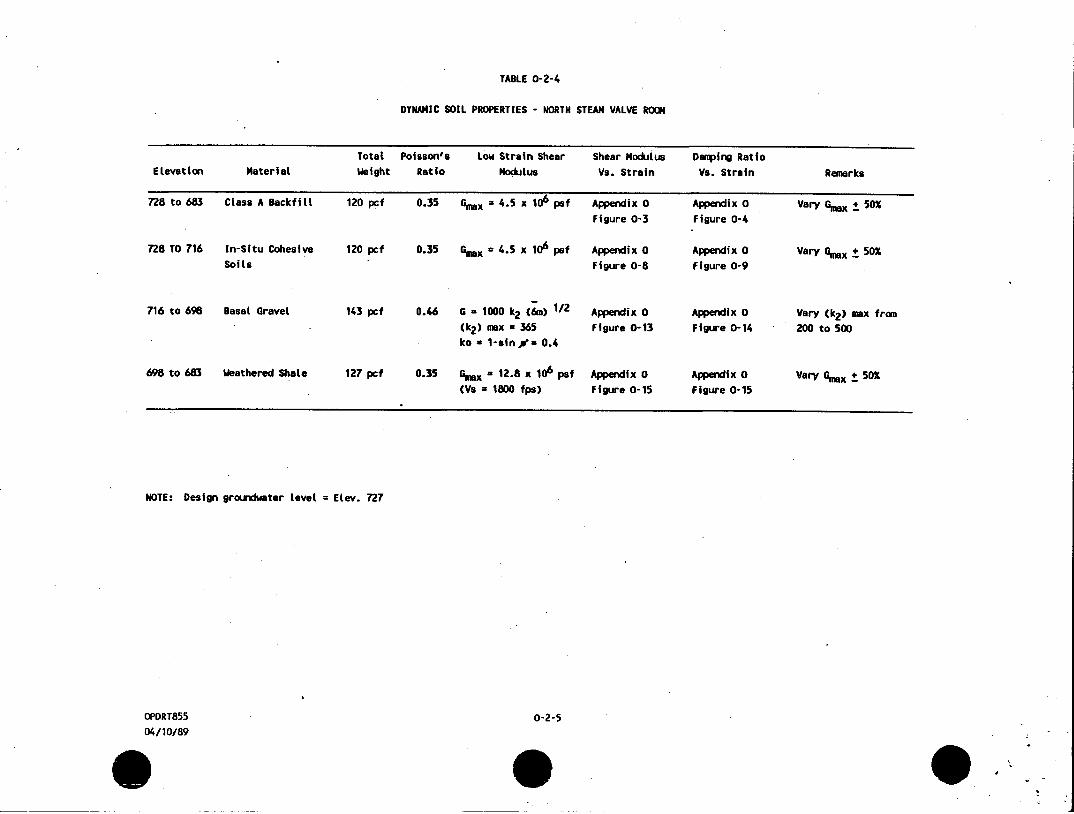
TABLE 0-2-4
DYNAMIC SOIL PROPERTIES - NORTH STEAM VALVE ROOM
Total Poisson's Low Strain Shear Shear Modulus Damping RatioElevation Material Weight Ratio Modulus Vs. Strain Vs. Strain Remarks
728 to 683 Class A BackfiLL 120 pcf 0.35 Gma x = 4.5 x 10⁶ psf Appendix 0 Appendix 0 Vary Gm x 1 50X
Figure 0-3 Figure 0-4
728 TO 716 In-Situ Cohesive 120 pcf 0.35 Gmqx a 4.5 x 10⁶ psi Appendix 0 Appendix 0 Vary Gmax +± 50%Soils Figure 0-8 Figure 0-9
716 to 698 Basal Gravel 143 pcf 0.46 G a 1000 k2 (6m) 1/2 Appendix 0 Appendix 0 Vary (k2 ) max from
0k2 ) max a 365 Figure 0-13 Figure 0-14 200 to 500
ko - 1-sin a- 0.4
698 to 683 Weathered Shale 127 pcf 0.35 G x 12.8 x 106 psi Appendix 0 Appendix 0 Vary Gmx + 50X(Vs 1800 fps) Figure 0-15 Figure 0-15
NOTE: Design grourxiwater level = Elev. 727
OPDRT855
04/10/890-2-5

CLASS ABACKFILL
ASSUMED 1:1
/
DGB
ELEV. 732
ELEV. 741
CLASS ABACKFILL
•~ ELEV. 730
/ASSUMED 1 :1 //
.Ja
IN-SITU 7 IN-SITUCOHESIVE SOILS CRUSHED STONE / COHESIVE SOILS/NO- S SO - - M M ELEV. 718---IN-SITU \X 4' MIN. 14',MIN. / IN-SITU
NON-PLASTIC SOILS * ----j // NON-PLASTIC SOILS------------------------------ -------------------- ----- ELEV. 713
BASAL GRAVEL
- ELEV. 708
WEATHERED SHALE
ELEV. 693BEDROCK (Vs = 5900 fps)
- INCLUDES CL-ML MATERIAL WITH N VALUES LESS THAN 10 BLOWS PER FOOT
NOTE: DESIGN GROUNDWATER LEVEL = ELEV. 727NOTE: GROUND SURFACE SLOPES AWAY AT 3:1 ON SOUTH SIDE OF BUILDING TO ELEV. 728
Figure 0-2-1SUBSURFACE PROFILE - DIESEL GENERATOR BUILDING
(REFERENCES: 1, 2; 3, 5, AND 7)
0-2-6
4 A -
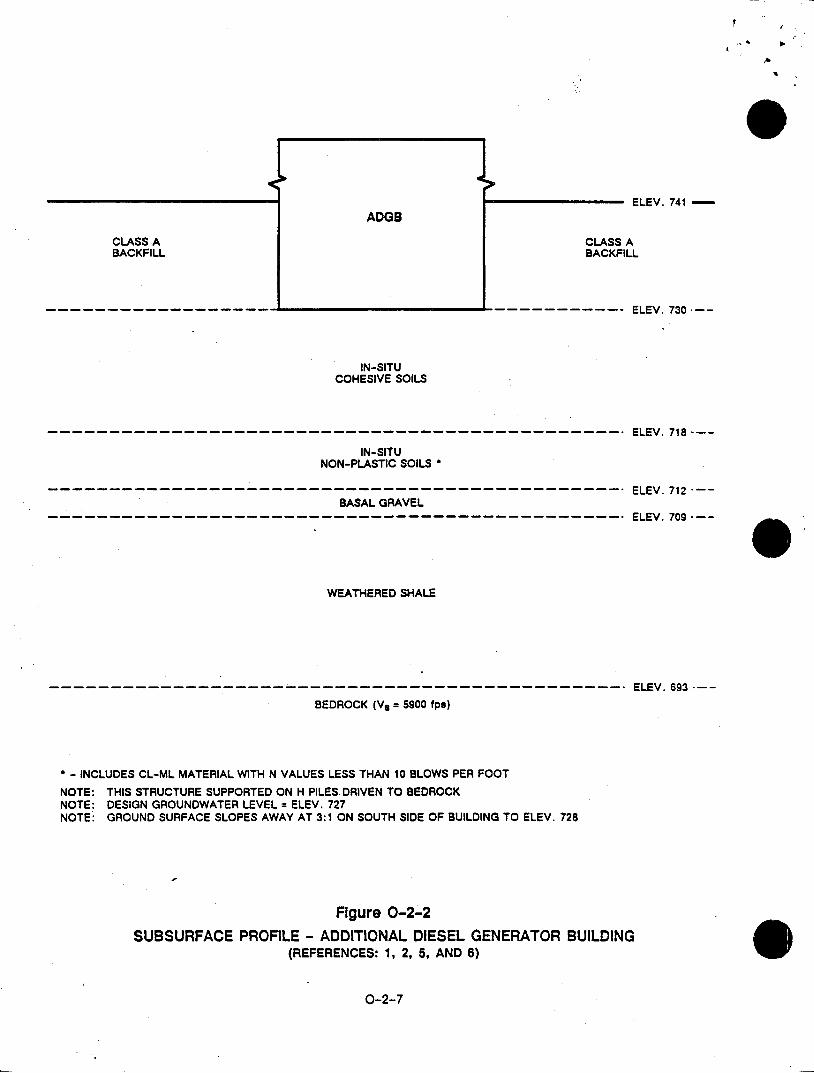
~.
A
S
CLASS ABACKFILL
ADGBELEV. 741-
CLASS ABACKFILL
- - -- -- ----- ELEV. 730
IN-SITUCOHESIVE SOILS
---- -- -- -- -------- ---------------------- ------------------------ --------------- ELEV. 718
IN-SITUNON-PLASTIC SOILS
---- -- -- -- ---------- -------------------- ------------------------ --------------- ELEV. 712BASAL GRAVEL
---- -- -- -- ---------- -------------------- ------------------------ --------------- ELEV. 709--
WEATHERED SHALE
-- -- -- ------------ ---------------------- ------------------------ ------------- ELEV. 693.-BEDROCK NVo = 5900 fps)
-INCLUDES CL-ML MATERIAL WITH N VALUES LESS THAN 10 BLOWS PER FOOT
NOTE: THIS STRUCTURE SUPPORTED ON H PILES DRIVEN TO BEDROCKNOTE: DESIGN GROUNDWATER LEVEL = ELEV. 727NOTE: GROUND SURFACE SLOPES AWAY AT 3:1 ON SOUTH SIDE OF BUILDING TO ELEV. 728
Figure 0-2-2SUBSURFACE PROFILE - ADDITIONAL DIESEL GENERATOR BUILDING
(REFERENCES: 1, 2, 5, AND 6)
0-2-7
------------------
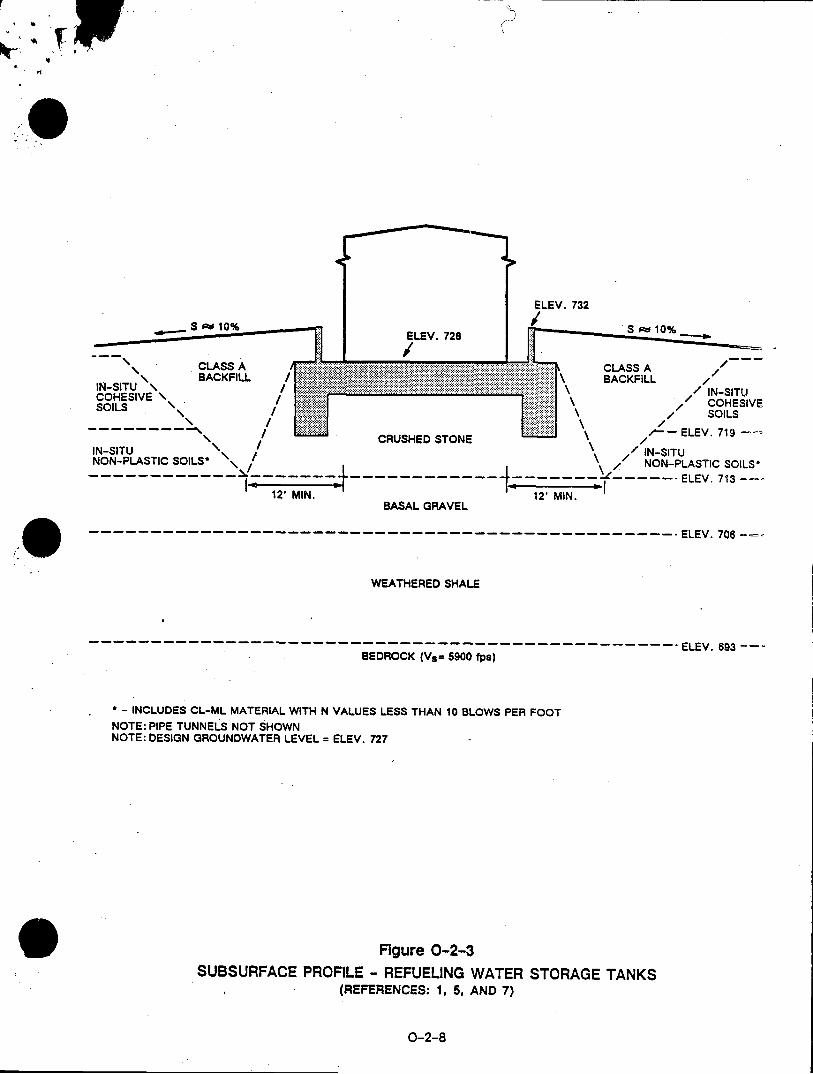
S 10% IELEV. 728/
BALCFI ̂ L
BACKFILL
ELEV. 732
S SR10%
BACKFILL /// IN-,/CC SITU
;)HESIVE[ \SOILS
-- - - \I .: • /-\-- ELEV. 719 -- =
IN-SITU CRUSHED STONE o\ / IN-SITU
NON-PLASTIC SOILS* \\ / NON-PLASTIC SOILS*--------II --- ---I- a-- -- - - ELEV. 713 --
12' MIN. 12' MIN.BASAL GRAVEL
- -------------------------------------------------------------------------------------------- ELEV. 706 -
WEATHERED SHALE
----------------------------------------------------- ELEV. 693BEDROCK (Vs= 5900 fps)
- INCLUDES CL-ML MATERIAL WITH N VALUES LESS THAN 10 BLOWS PER FOOTNOTE: PIPE TUNNELS NOT SHOWNNOTE: DESIGN GROUNDWATER LEVEL = ELEV. 727
Figure 0-2-3SUBSURFACE PROFILE - REFUELING WATER STORAGE TANKS
(REFERENCES: 1, 5, AND 7)
0-2-8
* ~
IN-SITU \COHESIVE \
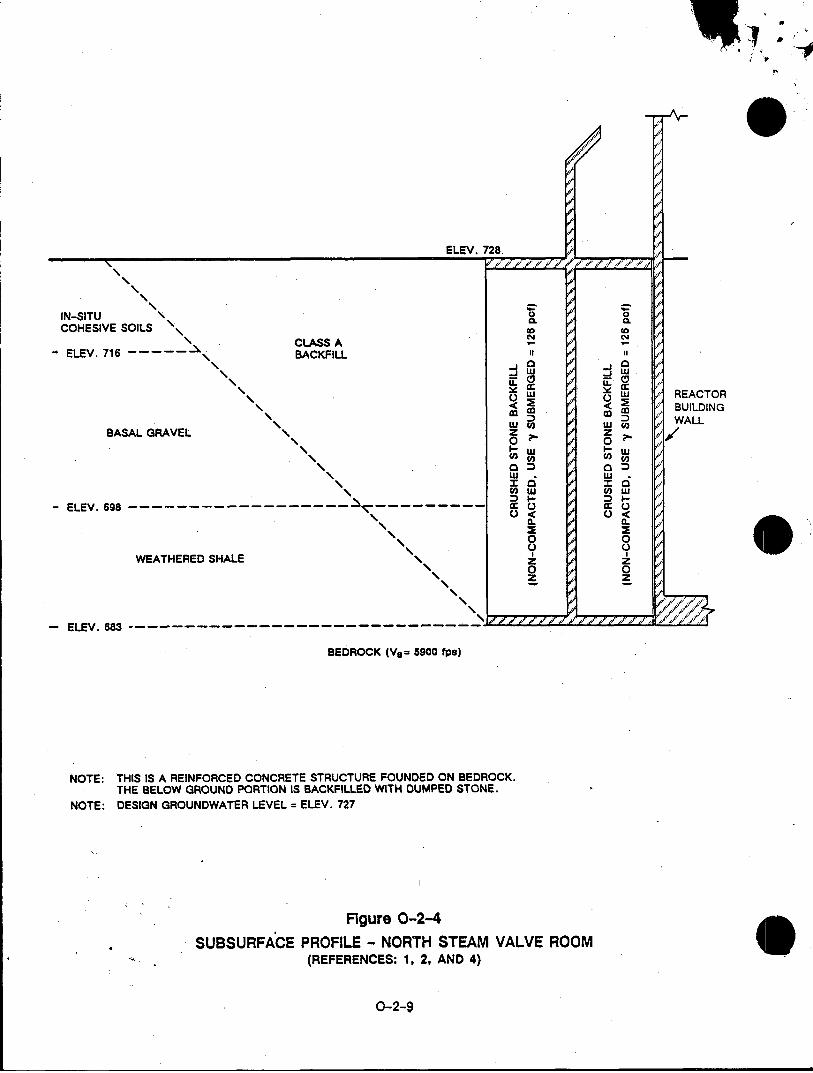
NNN
N
ELEV. 7
IN-SITUCOHESIVE SOILS
ELEV. 716
BASAL GRAVEL
- ELEV. 698
WEATHERED SHALE
- ELEV. 683
CLASS ABACKFILL
28
II I00
CL CL
O - I -
o. oJ 0 0'
! "
0 0
zw Q0< 0<
o ol
I d
o D
z z0 0
.I *'P S~' .'.1 d C
REACTORBUILDINGWALL
IV.
.A."
BEDROCK (Vs= 5900 fps)
NOTE: THIS IS A REINFORCED CONCRETE STRUCTURE FOUNDED ON BEDROCK.THE BELOW GROUND PORTION IS BACKFILLED WITH DUMPED STONE.
NOTE: DESIGN GROUNDWATER LEVEL = ELEV. 727
Figure 0-2-4
SUBSURFACE PROFILE - NORTH STEAM VALVE ROOM(REFERENCES: 1, 2, AND 4)
0-2-9
- ------------------------
-----------------------------
ENCLOSURE I
CORRECTIVE ACTION PROGRAM PLAN
MATRICES