Embed Size (px)
Citation preview
Canadian Science Advisory Secretariat
Maritimes Region Science Response 2013/005
March 2013
MARITIMES RESEARCH VESSEL SURVEY TRENDS ON GEORGES BANK
Figure 1. Northwest Atlantic Fisheries Organization (NAFO) Unit Areas for Georges Bank.
Context
DFO has conducted winter research vessel (RV) surveys in the Maritimes Region, Northwest Atlantic Fisheries Organization (NAFO) Area 5Z (Georges Bank; Figure 1) using a standardized protocol since 1987. Results of these surveys provide information on trends in abundance for groundfish species in the Maritimes Region. While these data reflect trends in biomass and abundance and are a critical part of science-based stock assessments, a full assessment, including other sources of data, would be required to evaluate the impacts of management measures on population status. Fisheries and Aquaculture Management (FAM) requested a review of the DFO winter survey information on the following species in 5Z1-5Z4: cod, haddock, pollock, sea raven, ocean pout, yellowtail flounder, Atlantic wolffish, monkfish, smooth skate, thorny skate, barndoor skate, winter skate, little skate, and longhorn sculpin. The survey information will be used by FAM as background for discussions with various industry stakeholders on recommendations for management measures, and to determine which stocks should be reviewed in more detail in 2013/14.
This Science Response Report results from the Science Special Response Process of October 24, 2012, on the Review of Maritimes Research Vessel Survey Trends. Additional publications from this process will be posted as they become available on the Fisheries and Oceans Canada Science Advisory Schedule at www.dfo-mpo.gc.ca/csas-sccs/index-eng.htm.
70° 69° 68° 67° 66° 65°
40°
41°
42°
CAN
US
5Zj
5Zm5Zh
5Zn
5Zg
5Zo
Maritimes Region Science Response: Maritimes Research
Vessel Survey Trends – Georges Bank
2
Background
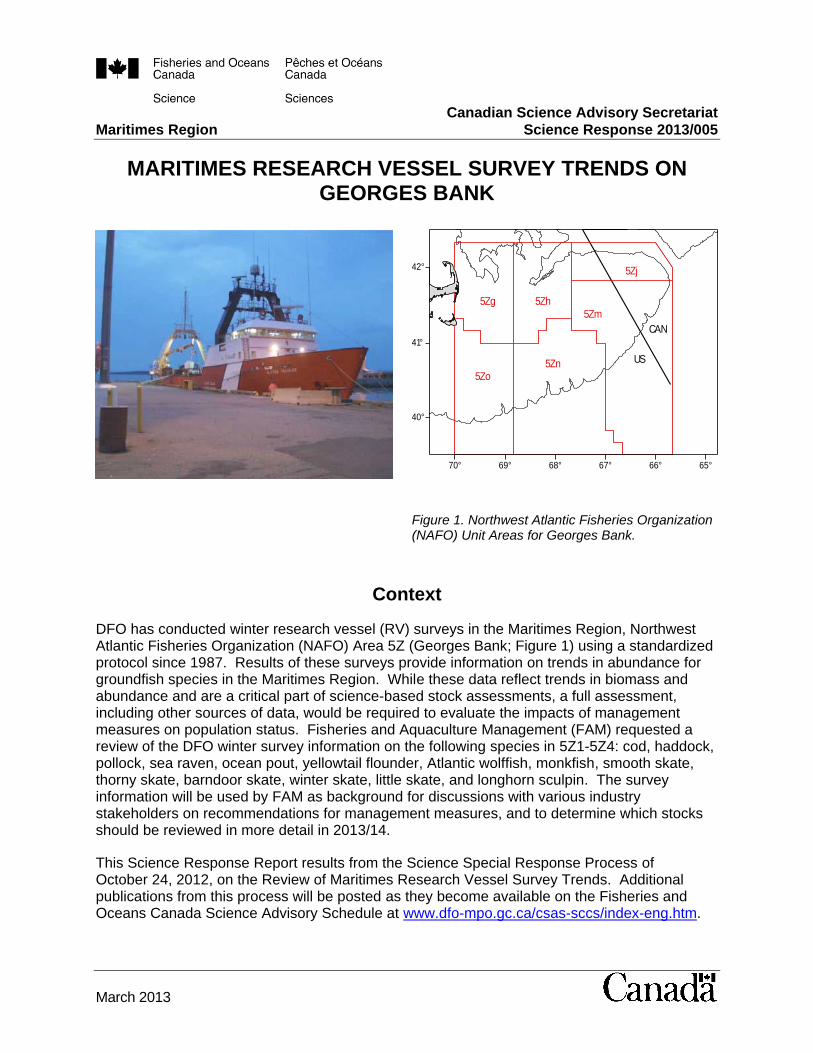
The Georges Bank (5Z) winter research vessel (RV) survey has been conducted annually using a standard stratification since 1987. The survey follows a stratified random sampling design, and includes sampling of fish and invertebrates using a bottom otter trawl. These surveys are the primary data source for monitoring trends in species distribution, abundance, and biological condition on Georges Bank (for details see Stone and Gross, 2012).
The bottom trawl surveys were designed to provide abundance trends for fish and invertebrates between depths of about 30 m and 200 m. Survey indices are expected to be proportional to abundance for most species. The distribution of some species, such as Atlantic wolffish and monkfish, are not fully covered by the survey. Abundance trends for these species may only provide an indication of the direction of change over time.
Survey strata boundaries are shown in Figure 2 for the 5Z area. Sampling was conducted in strata 5Z1-5Z4, 5Z8 and 5Z9 in 2012. Catch distribution plots for the area sampled are provided for the suite of species requested. Biomass index trends are shown for 5Z1-5Z4. Comparisons of 2011 and 2012 length frequencies from the survey catch to the long-term mean (1987-2010) are also included for selected stocks.
Figure 2. Georges Bank (5Z) winter Research Vessel survey strata.
Analysis
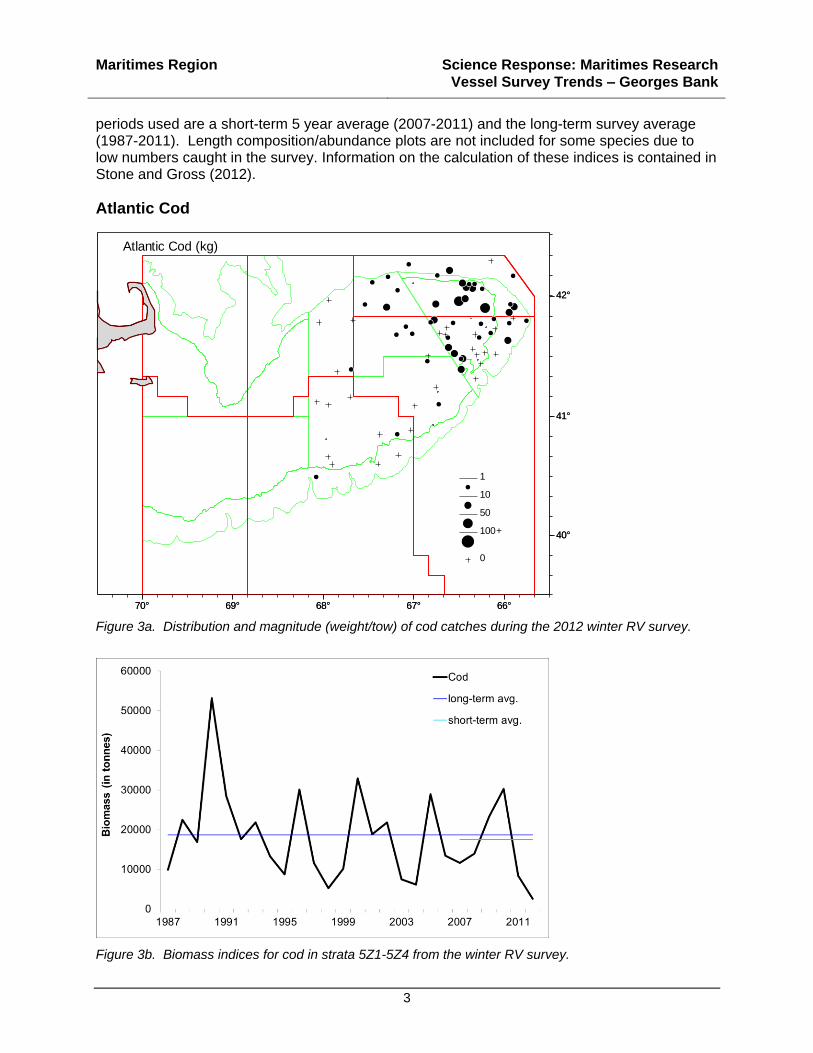
The time-series of survey biomass indices (not total population biomass) are compared to averages for a series of time periods to provide historical context for biomass levels. The time
Maritimes Region Science Response: Maritimes Research
Vessel Survey Trends – Georges Bank
3
periods used are a short-term 5 year average (2007-2011) and the long-term survey average (1987-2011). Length composition/abundance plots are not included for some species due to low numbers caught in the survey. Information on the calculation of these indices is contained in Stone and Gross (2012).
Atlantic Cod
70° 69° 68° 67° 66°
40°
41°
42°
70° 69° 68° 67° 66°
40°
41°
42°
1
10
50
100+
0
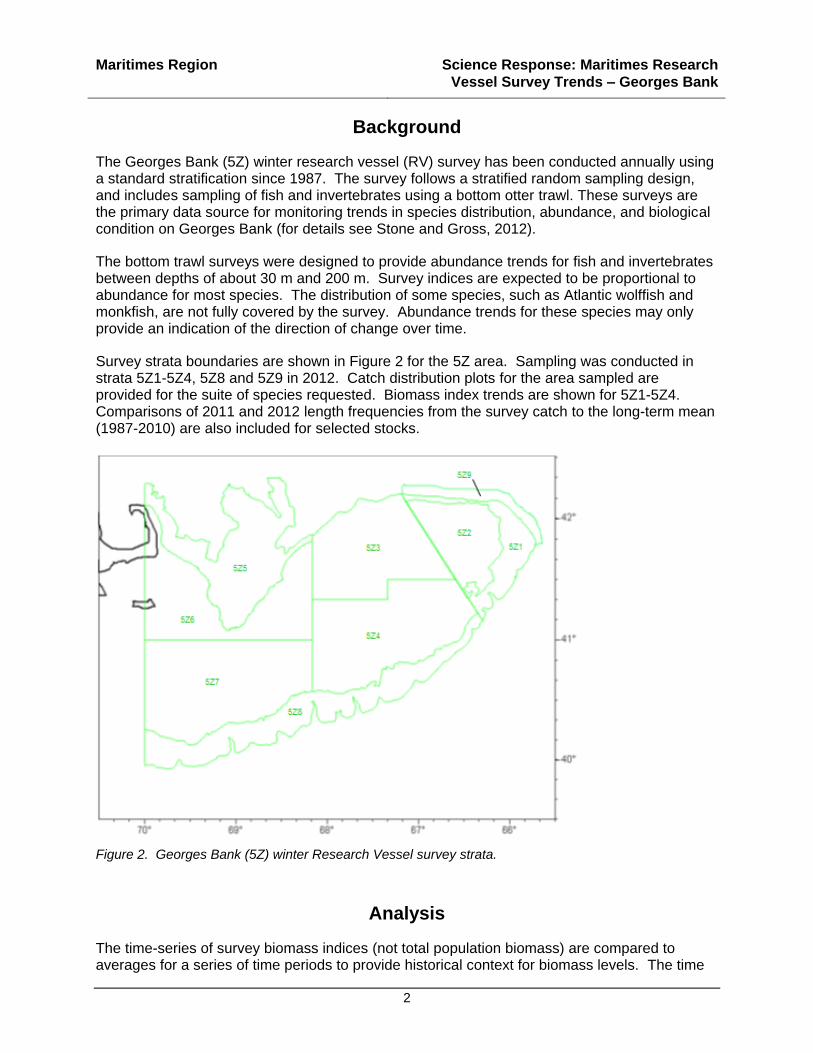
Atlantic Cod (kg)
Figure 3a. Distribution and magnitude (weight/tow) of cod catches during the 2012 winter RV survey.
Figure 3b. Biomass indices for cod in strata 5Z1-5Z4 from the winter RV survey.
Maritimes Region Science Response: Maritimes Research
Vessel Survey Trends – Georges Bank
4
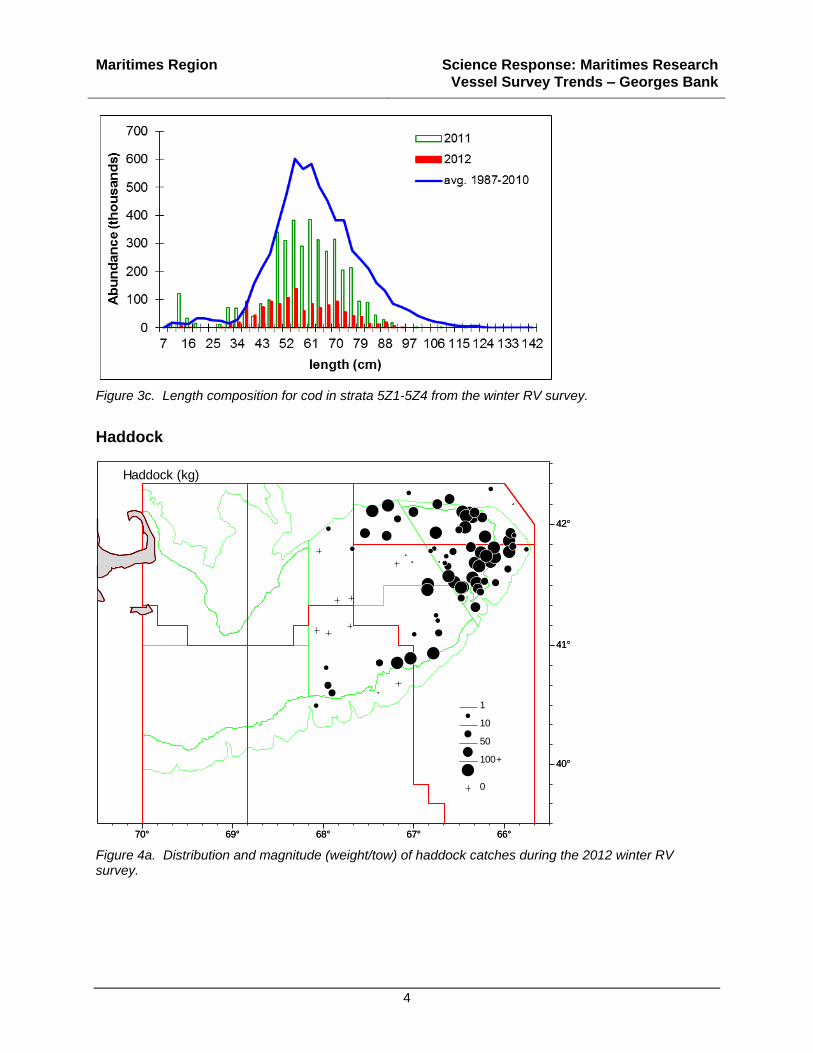
Figure 3c. Length composition for cod in strata 5Z1-5Z4 from the winter RV survey.
Haddock
70° 69° 68° 67° 66°
40°
41°
42°
70° 69° 68° 67° 66°
40°
41°
42°
1
10
50
100+
0
Haddock (kg)
Figure 4a. Distribution and magnitude (weight/tow) of haddock catches during the 2012 winter RV survey.
Maritimes Region Science Response: Maritimes Research
Vessel Survey Trends – Georges Bank
5
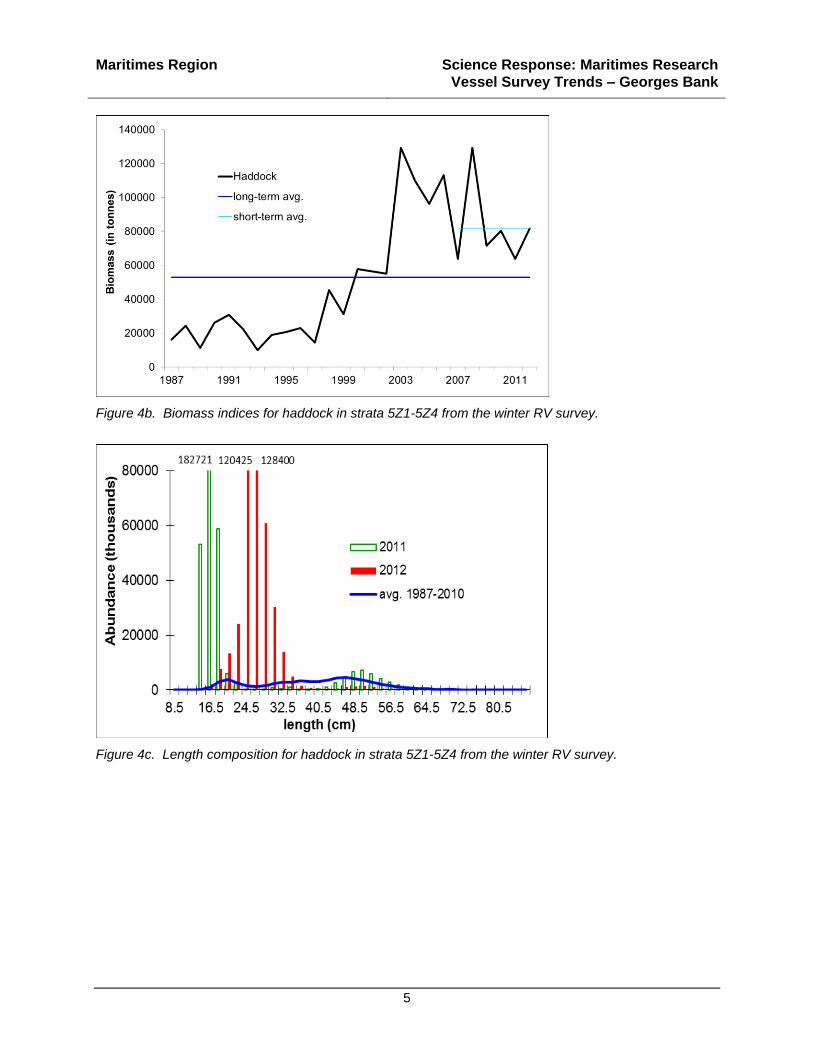
Figure 4b. Biomass indices for haddock in strata 5Z1-5Z4 from the winter RV survey.
Figure 4c. Length composition for haddock in strata 5Z1-5Z4 from the winter RV survey.
Maritimes Region Science Response: Maritimes Research
Vessel Survey Trends – Georges Bank
6
Pollock
70° 69° 68° 67° 66°
40°
41°
42°
70° 69° 68° 67° 66°
40°
41°
42°
1
10
50
100+
0
Pollock (kg)
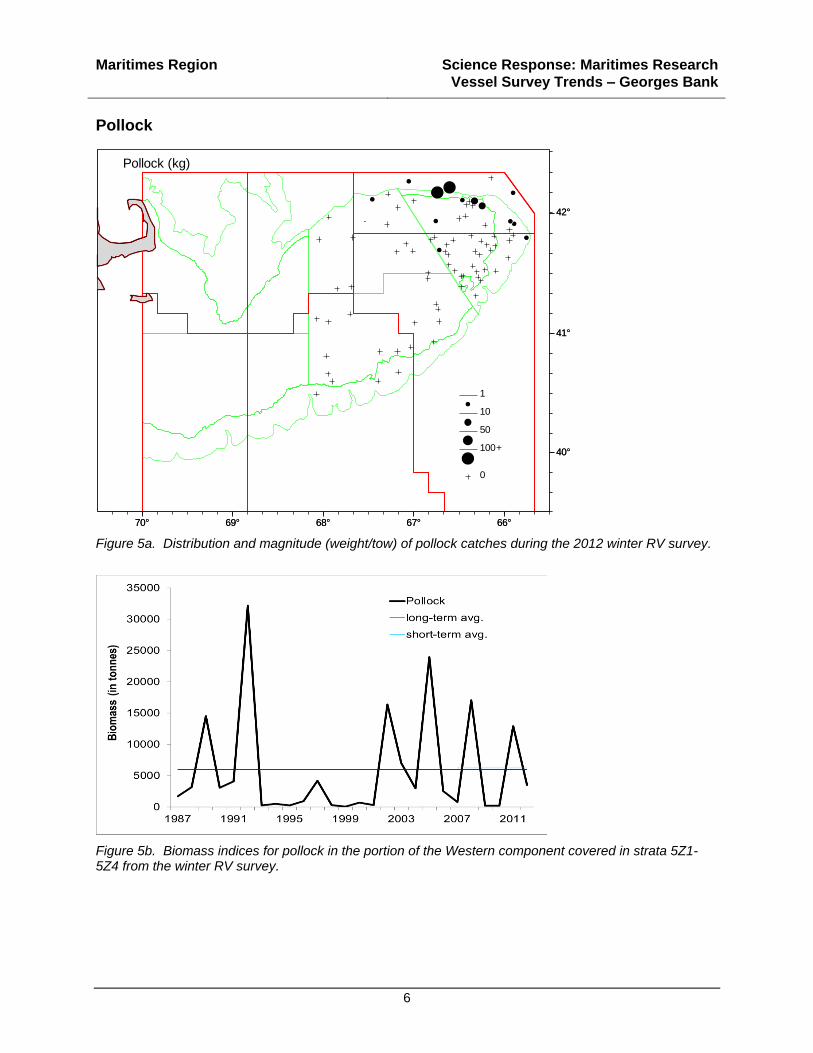
Figure 5a. Distribution and magnitude (weight/tow) of pollock catches during the 2012 winter RV survey.
Figure 5b. Biomass indices for pollock in the portion of the Western component covered in strata 5Z1-5Z4 from the winter RV survey.
Maritimes Region Science Response: Maritimes Research
Vessel Survey Trends – Georges Bank
7
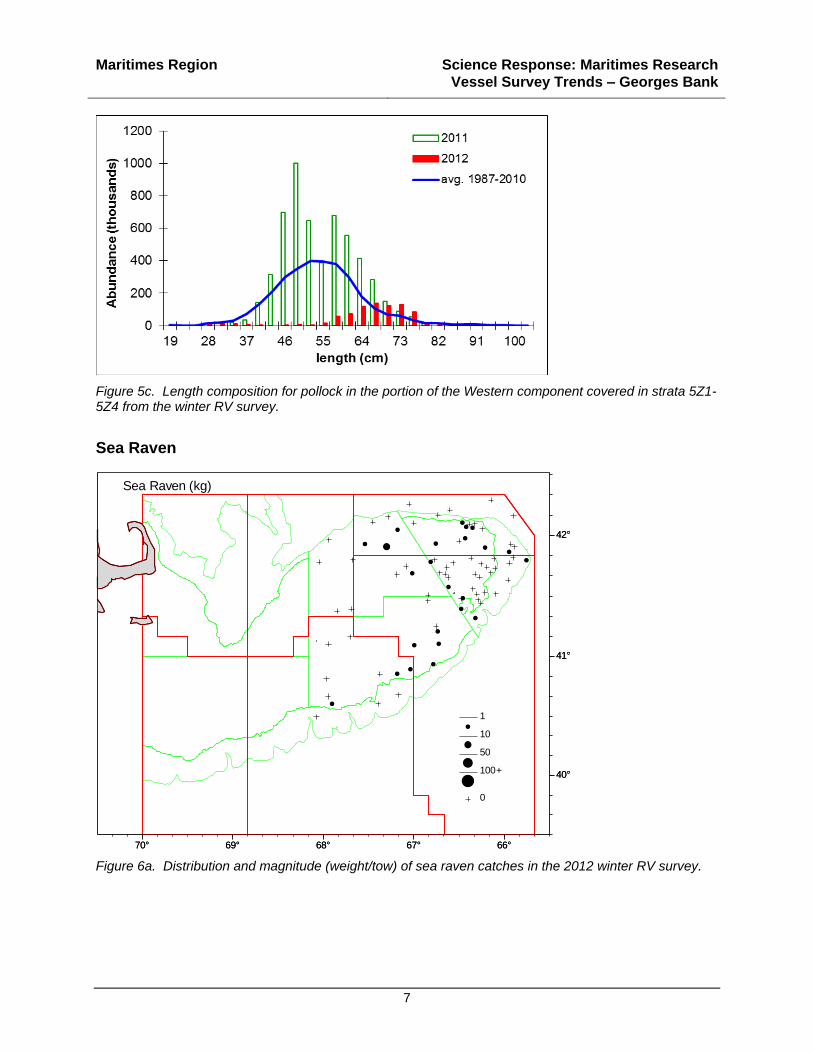
Figure 5c. Length composition for pollock in the portion of the Western component covered in strata 5Z1-5Z4 from the winter RV survey.
Sea Raven
70° 69° 68° 67° 66°
40°
41°
42°
70° 69° 68° 67° 66°
40°
41°
42°
1
10
50
100+
0
Sea Raven (kg)
Figure 6a. Distribution and magnitude (weight/tow) of sea raven catches in the 2012 winter RV survey.
Maritimes Region Science Response: Maritimes Research
Vessel Survey Trends – Georges Bank
8
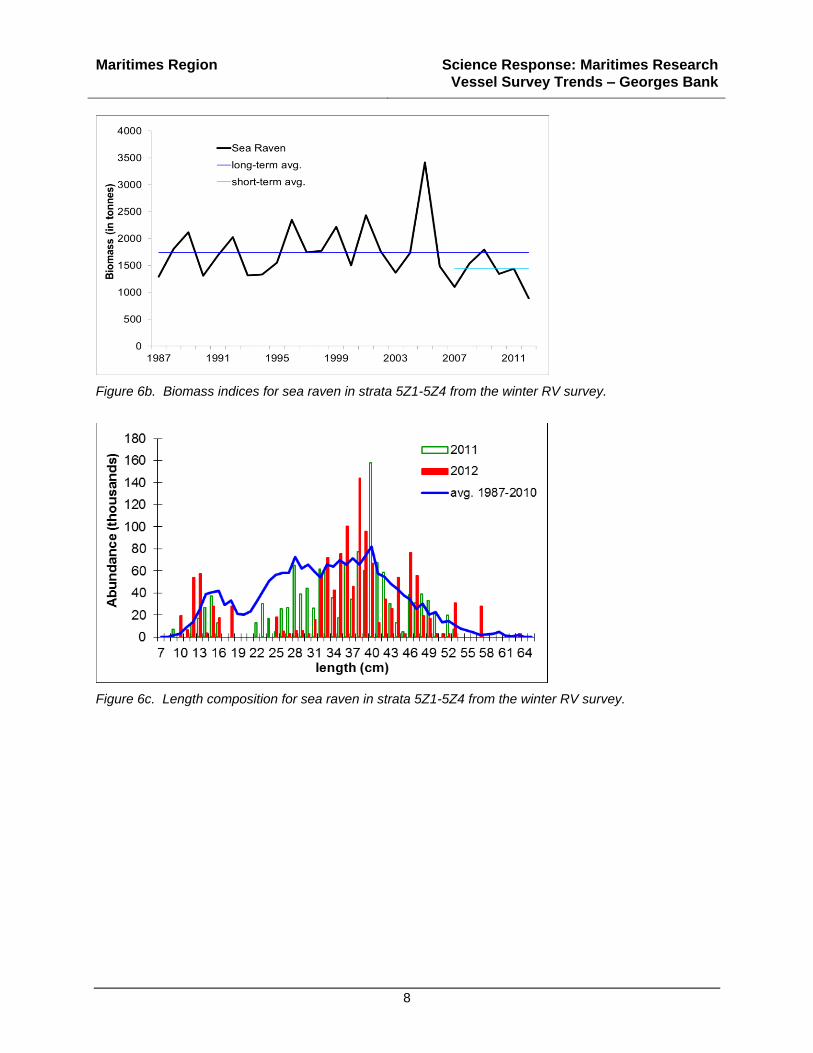
Figure 6b. Biomass indices for sea raven in strata 5Z1-5Z4 from the winter RV survey.
Figure 6c. Length composition for sea raven in strata 5Z1-5Z4 from the winter RV survey.

Maritimes Region Science Response: Maritimes Research
Vessel Survey Trends – Georges Bank
9
Ocean pout
70° 69° 68° 67° 66°
40°
41°
42°
70° 69° 68° 67° 66°
40°
41°
42°
1
10
50
100+
0
Ocean Pout (kg)
Figure 7a. Distribution and magnitude (weight/tow) of ocean pout catches during the 2012 winter RV survey.
Figure 7b. Biomass indices for ocean pout in strata 5Z1-5Z4 from the winter RV survey.
Maritimes Region Science Response: Maritimes Research
Vessel Survey Trends – Georges Bank
10
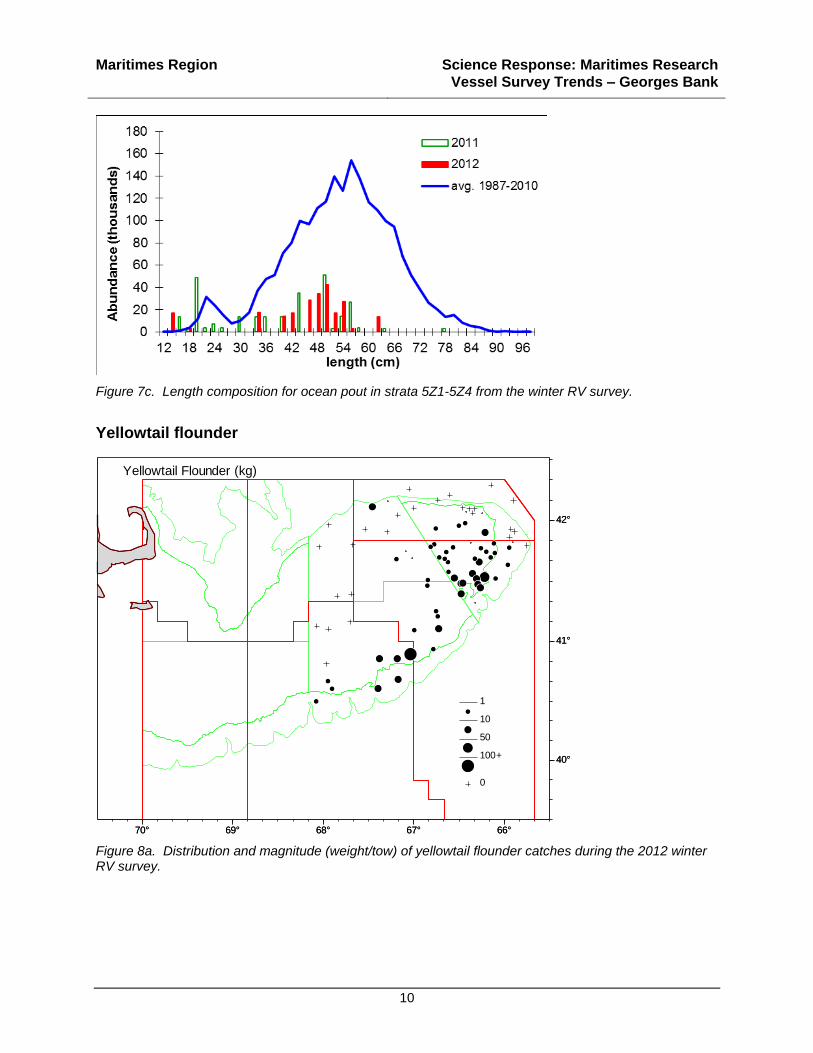
Figure 7c. Length composition for ocean pout in strata 5Z1-5Z4 from the winter RV survey.
Yellowtail flounder
70° 69° 68° 67° 66°
40°
41°
42°
70° 69° 68° 67° 66°
40°
41°
42°
1
10
50
100+
0
Yellowtail Flounder (kg)
Figure 8a. Distribution and magnitude (weight/tow) of yellowtail flounder catches during the 2012 winter RV survey.

Maritimes Region Science Response: Maritimes Research
Vessel Survey Trends – Georges Bank
11
Figure 8b. Biomass indices for yellowtail flounder in strata 5Z1-5Z4 from the winter RV survey.
Figure 8c. Length composition for yellowtail flounder in strata 5Z1-5Z4 from the winter RV survey.
Maritimes Region Science Response: Maritimes Research
Vessel Survey Trends – Georges Bank
12
Atlantic wolffish
70° 69° 68° 67° 66°
40°
41°
42°
70° 69° 68° 67° 66°
40°
41°
42°
1
10
50
100+
0
Atlantic Wolffish (kg)
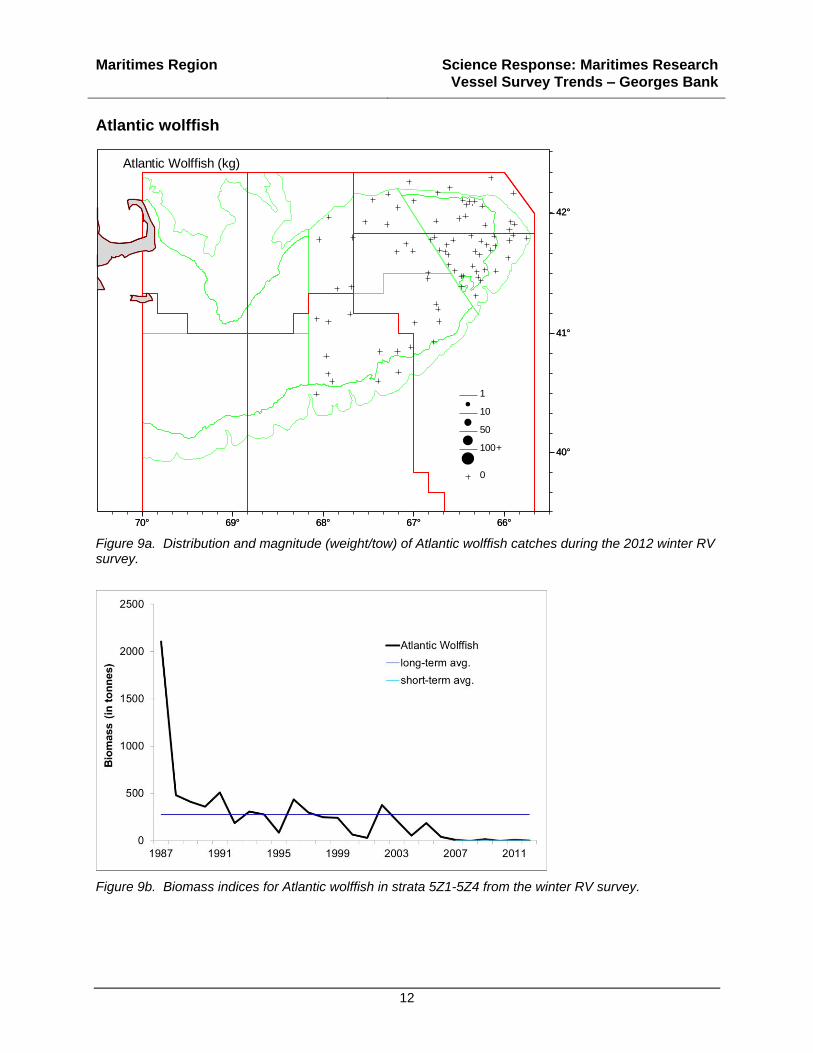
Figure 9a. Distribution and magnitude (weight/tow) of Atlantic wolffish catches during the 2012 winter RV survey.
Figure 9b. Biomass indices for Atlantic wolffish in strata 5Z1-5Z4 from the winter RV survey.

Maritimes Region Science Response: Maritimes Research
Vessel Survey Trends – Georges Bank
13
Monkfish
70° 69° 68° 67° 66°
40°
41°
42°
70° 69° 68° 67° 66°
40°
41°
42°
1
10
50
100+
0
Monkfish (kg)
Figure 10a. Distribution and magnitude (weight/tow) of monkfish catches during the 2012 winter RV survey.
Figure 10b. Biomass indices for monkfish in strata 5Z1-5Z4 from the winter RV survey.
Maritimes Region Science Response: Maritimes Research
Vessel Survey Trends – Georges Bank
14
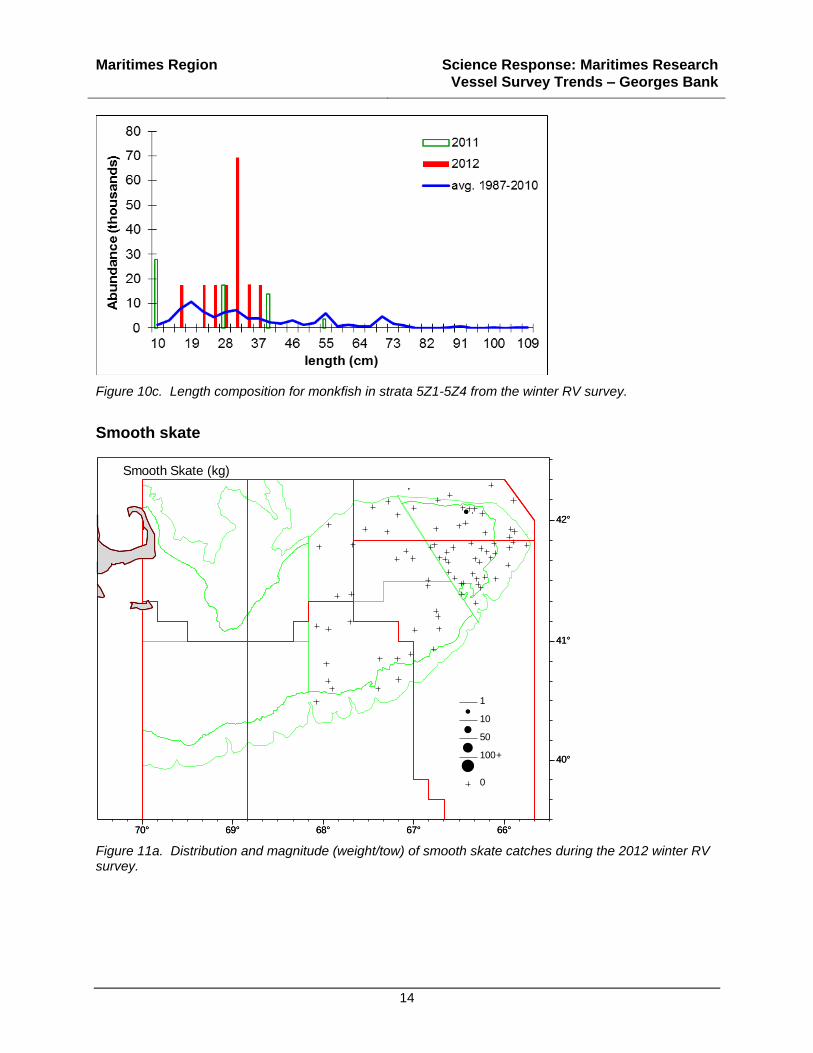
Figure 10c. Length composition for monkfish in strata 5Z1-5Z4 from the winter RV survey.
Smooth skate
70° 69° 68° 67° 66°
40°
41°
42°
70° 69° 68° 67° 66°
40°
41°
42°
1
10
50
100+
0
Smooth Skate (kg)
Figure 11a. Distribution and magnitude (weight/tow) of smooth skate catches during the 2012 winter RV survey.
Maritimes Region Science Response: Maritimes Research
Vessel Survey Trends – Georges Bank
15
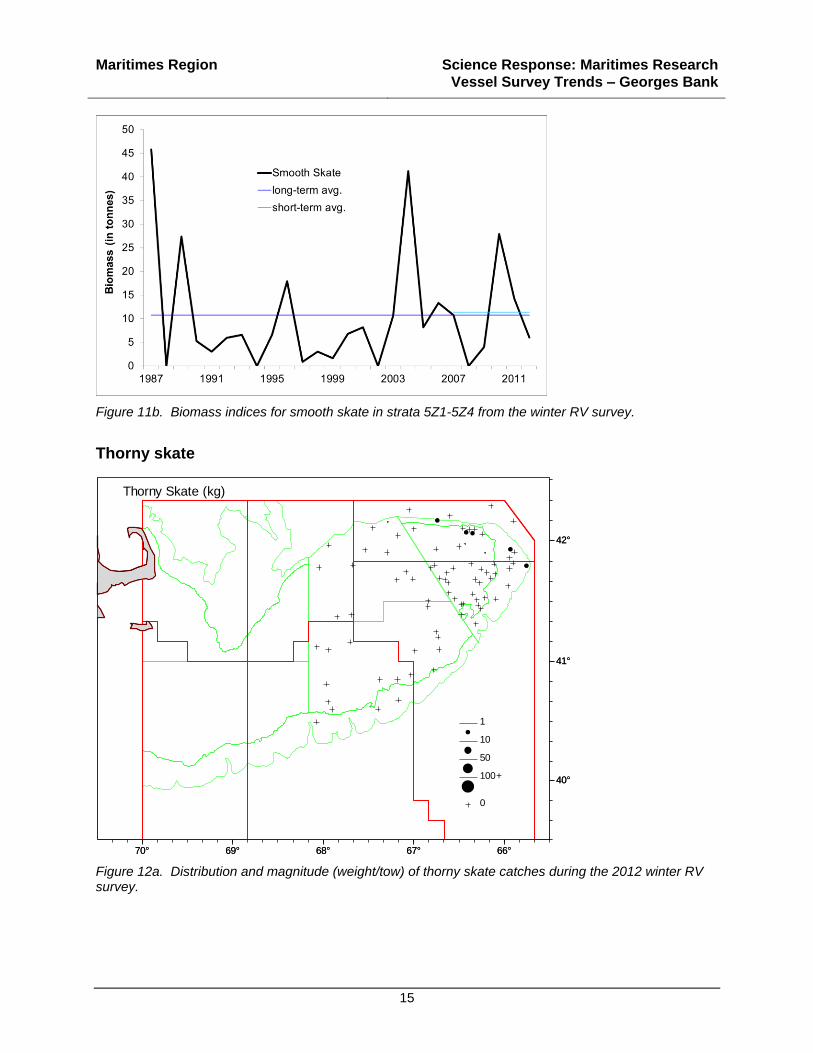
Figure 11b. Biomass indices for smooth skate in strata 5Z1-5Z4 from the winter RV survey.
Thorny skate
70° 69° 68° 67° 66°
40°
41°
42°
70° 69° 68° 67° 66°
40°
41°
42°
1
10
50
100+
0
Thorny Skate (kg)
Figure 12a. Distribution and magnitude (weight/tow) of thorny skate catches during the 2012 winter RV survey.

Maritimes Region Science Response: Maritimes Research
Vessel Survey Trends – Georges Bank
16
Figure 12b. Biomass indices for thorny skate in strata 5Z1-5Z4 from the winter RV survey.
Figure 12c. Length composition for thorny skate in strata 5Z1-5Z4 from the winter RV survey.
Maritimes Region Science Response: Maritimes Research
Vessel Survey Trends – Georges Bank
17
Barndoor skate
70° 69° 68° 67° 66°
40°
41°
42°
70° 69° 68° 67° 66°
40°
41°
42°
1
10
50
100+
0
Barndoor Skate (kg)
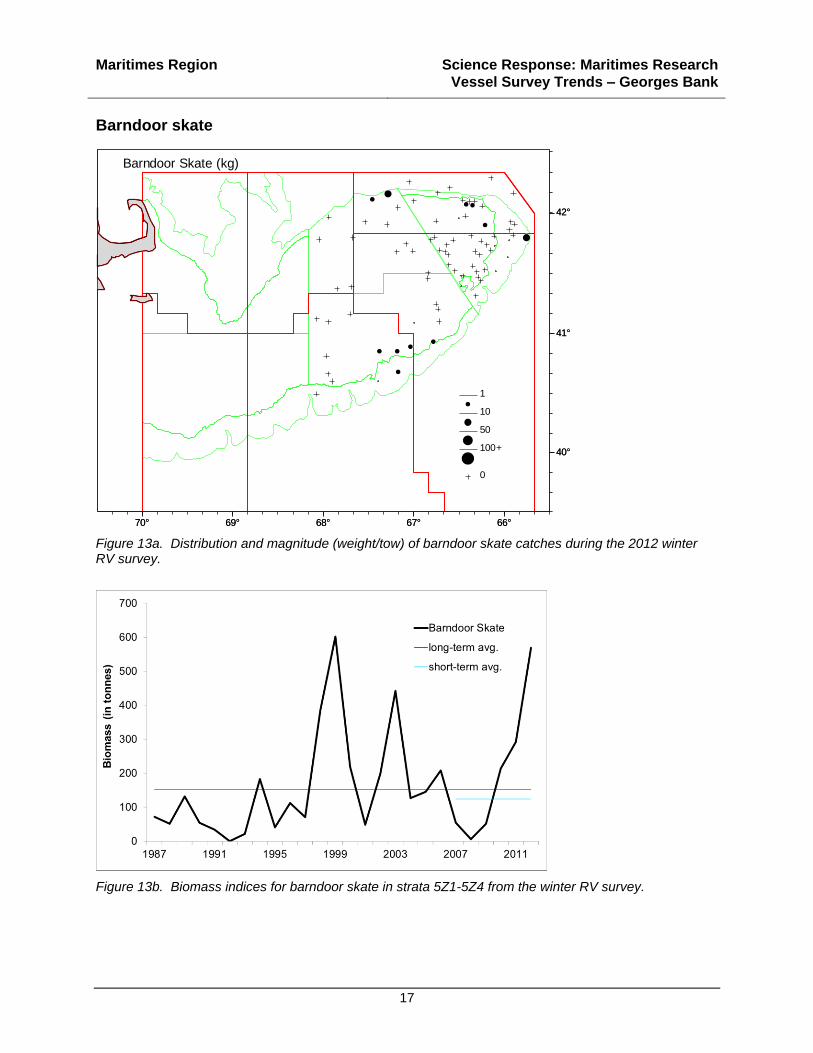
Figure 13a. Distribution and magnitude (weight/tow) of barndoor skate catches during the 2012 winter RV survey.
Figure 13b. Biomass indices for barndoor skate in strata 5Z1-5Z4 from the winter RV survey.
Maritimes Region Science Response: Maritimes Research
Vessel Survey Trends – Georges Bank
18
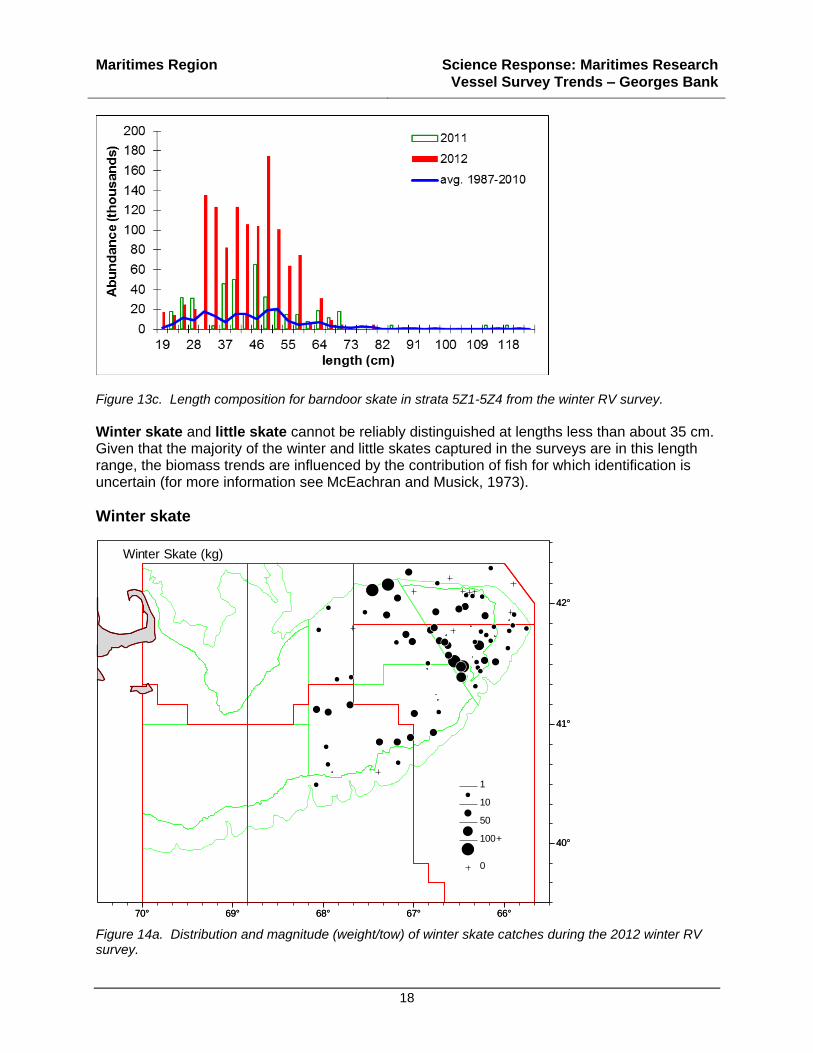
Figure 13c. Length composition for barndoor skate in strata 5Z1-5Z4 from the winter RV survey.
Winter skate and little skate cannot be reliably distinguished at lengths less than about 35 cm. Given that the majority of the winter and little skates captured in the surveys are in this length range, the biomass trends are influenced by the contribution of fish for which identification is uncertain (for more information see McEachran and Musick, 1973).
Winter skate
70° 69° 68° 67° 66°
40°
41°
42°
70° 69° 68° 67° 66°
40°
41°
42°
1
10
50
100+
0
Winter Skate (kg)
Figure 14a. Distribution and magnitude (weight/tow) of winter skate catches during the 2012 winter RV survey.
Maritimes Region Science Response: Maritimes Research
Vessel Survey Trends – Georges Bank
19
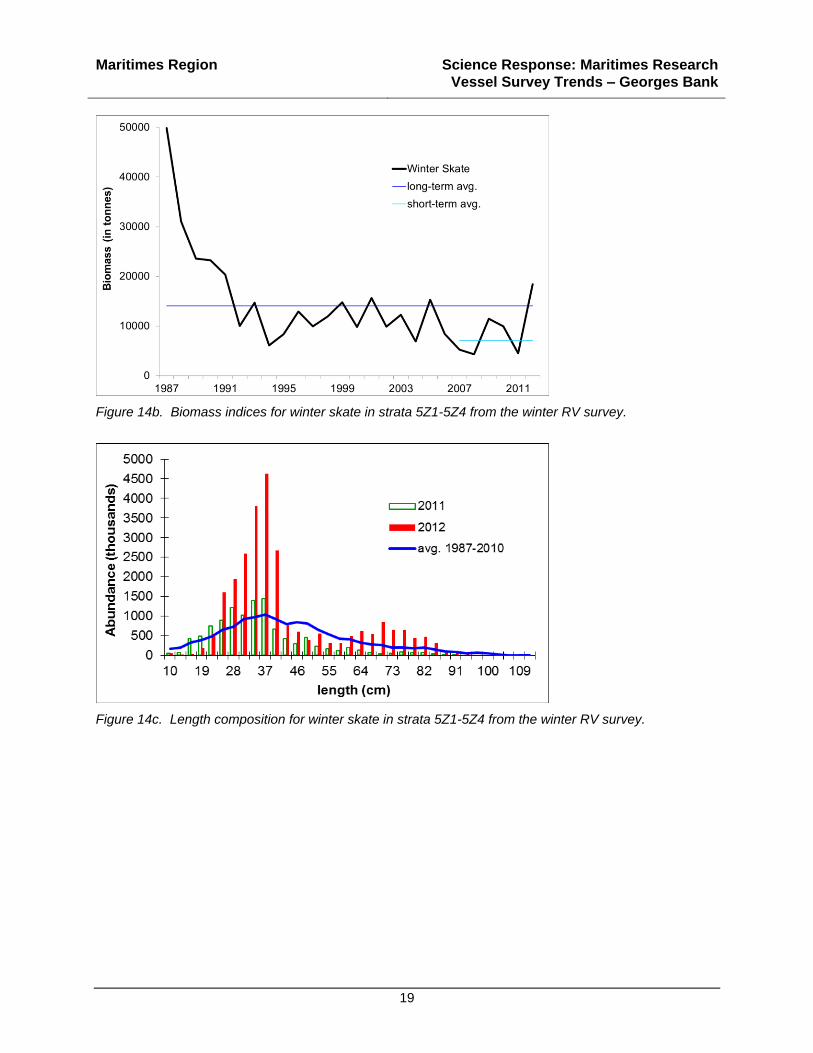
Figure 14b. Biomass indices for winter skate in strata 5Z1-5Z4 from the winter RV survey.
Figure 14c. Length composition for winter skate in strata 5Z1-5Z4 from the winter RV survey.

Maritimes Region Science Response: Maritimes Research
Vessel Survey Trends – Georges Bank
20
Little skate
70° 69° 68° 67° 66°
40°
41°
42°
70° 69° 68° 67° 66°
40°
41°
42°
1
10
50
100+
0
Little Skate (kg)
Figure 15a. Distribution and magnitude (weight/tow) of little skate catches during the 2012 winter RV survey.
Figure 15b. Biomass indices for little skate in strata 5Z1-5Z4 from the winter RV survey.
Maritimes Region Science Response: Maritimes Research
Vessel Survey Trends – Georges Bank
21
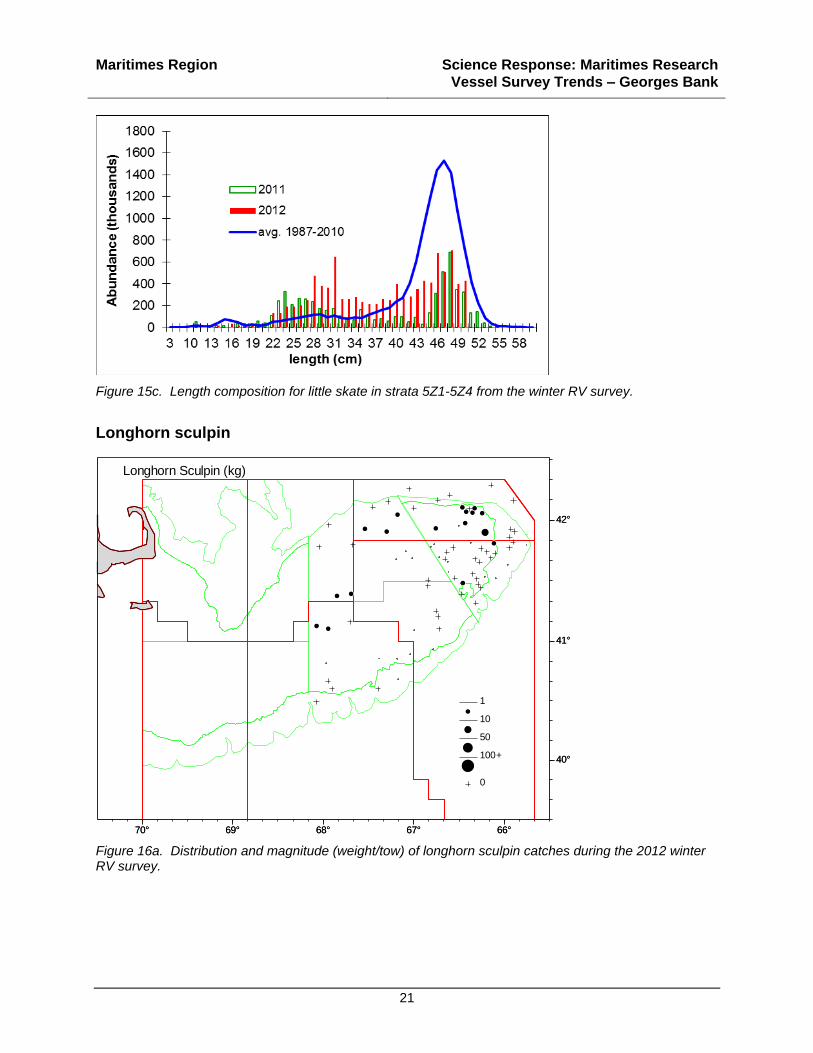
Figure 15c. Length composition for little skate in strata 5Z1-5Z4 from the winter RV survey.
Longhorn sculpin
70° 69° 68° 67° 66°
40°
41°
42°
70° 69° 68° 67° 66°
40°
41°
42°
1
10
50
100+
0
Longhorn Sculpin (kg)
Figure 16a. Distribution and magnitude (weight/tow) of longhorn sculpin catches during the 2012 winter RV survey.
Maritimes Region Science Response: Maritimes Research
Vessel Survey Trends – Georges Bank
22
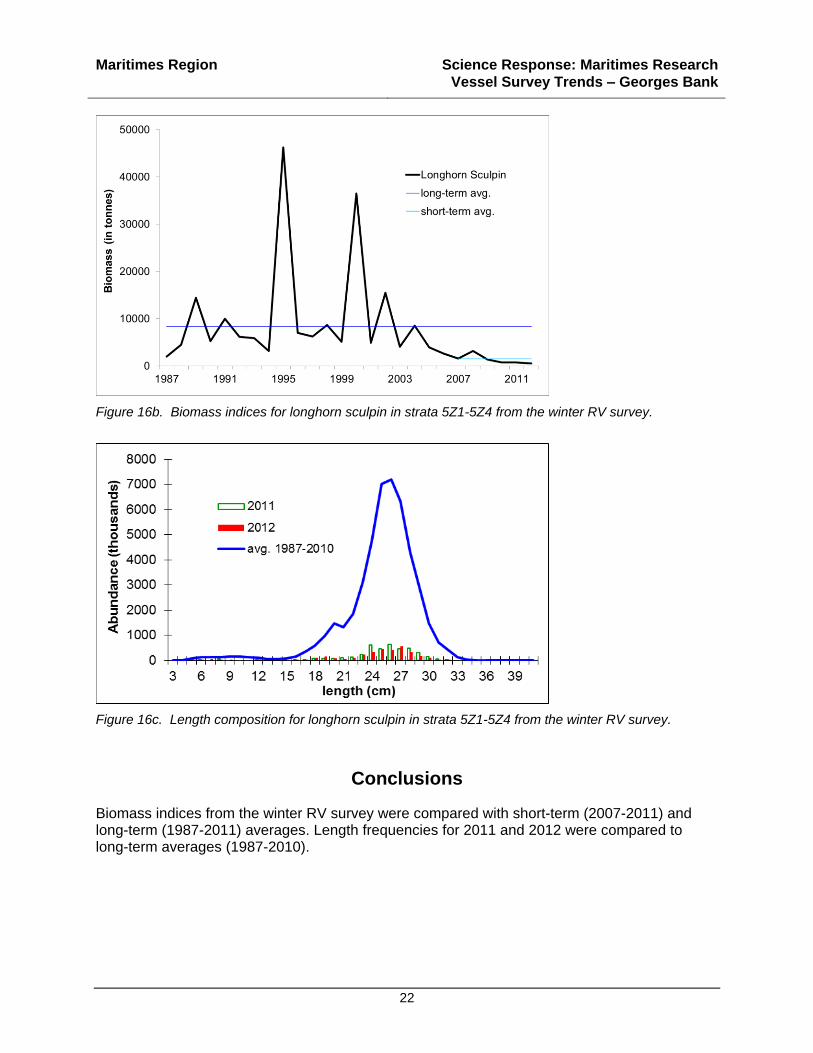
Figure 16b. Biomass indices for longhorn sculpin in strata 5Z1-5Z4 from the winter RV survey.
Figure 16c. Length composition for longhorn sculpin in strata 5Z1-5Z4 from the winter RV survey.
Conclusions
Biomass indices from the winter RV survey were compared with short-term (2007-2011) and long-term (1987-2011) averages. Length frequencies for 2011 and 2012 were compared to long-term averages (1987-2010).

Maritimes Region Science Response: Maritimes Research
Vessel Survey Trends – Georges Bank
23
Contributors
Donald Clark DFO Maritimes Science, St. Andrews Biological Station
Peter Comeau DFO Maritimes Science, Bedford Institute of Oceanography
Adam Cook DFO Maritimes Science, Bedford Institute of Oceanography
Verna Docherty DFO Maritimes Resource Management, Marine House
Jamie Emberley DFO Maritimes Science, St. Andrews Biological Station
Mark Fowler DFO Maritimes Science, Bedford Institute of Oceanography
Peter Hurley DFO Maritimes Science, Bedford Institute of Oceanography
Jim Simon DFO Maritimes Science, Bedford Institute of Oceanography
Heath Stone DFO Maritimes Science, St. Andrews Biological Station
Daphne Themelis DFO Maritimes Science, Bedford Institute of Oceanography
Jerry Young DFO Maritimes Science, Bedford Institute of Oceanography
Tana Worcester DFO Maritimes Science, Bedford Institute of Oceanography
Approved by
Alain Vézina Regional Director of Science, DFO Maritimes Region Dartmouth, Nova Scotia
Ph. 902-426-3490 Date: December 18, 2012
Sources of Information
This Science Response Report results from the Science Special Response Process of October 24, 2012, on the Review of Maritimes Research Vessel Survey Trends. Additional publications from this process will be posted as they become available on the Fisheries and Oceans Canada Science Advisory Schedule at www.dfo-mpo.gc.ca/csas-sccs/index-eng.htm.
McEachran, J.D. and J.A. Musick. 1973. Characters for distinguishing between immature specimens of the sibling species, Raja erinacea and Raja ocellata (Pisces: Rajidae). Copeia 1973: 238-250.
Stone, H.H. and Gross, W.E. 2012. Review of the Georges Bank Research Vessel Survey Program, 1987-2011. Can. Manuscr. Rep. Fish. Aquat. Sci. 2988: xiii + 95p.

Maritimes Region Science Response: Maritimes Research
Vessel Survey Trends – Georges Bank
24
This Report is Available from the:
Center for Science Advice (CSA) Maritimes Region
Fisheries and Oceans Canada PO Box 1006, Station B203
Dartmouth, Nova Scotia Canada B2Y 4A2
Telephone: 902-426-7070 E-Mail: [email protected]
Internet address: www.dfo-mpo.gc.ca/csas-sccs/
ISSN 1919-3769 © Her Majesty the Queen in Right of Canada, 2013
Correct Citation for this Publication:
DFO. 2013. Maritimes research vessel survey trends on Georges Bank. DFO Can. Sci. Advis. Sec. Sci. Resp. 2013/005.
Aussi disponible en français :
MPO. 2013. Tendances dans les relevés par navire scientifique sur le banc Georges dans la région des Maritimes. Secr. can. de consult. sci. de MPO. Rép. des Sci. 2013/005.