Embed Size (px)
Citation preview

Segregated FundsAudited Financial StatementsDecember 31, 2009
L I F E I n s u r a n c E


3
Manulife Certificate
The Manufacturers Life Insurance Company, referred to in this document as Manulife Financial, certifies that the Audited Financial Statements provide brief and plain disclosure of all material facts relating to the financial statements of: the Manulife Short-Term Securities Fund, the Manulife Bond Fund, the Manulife Diversified Investment Fund, the Manulife Equity Fund, the Equity Growth Fund, the Monarch Growth Fund, the Maritime Life FLAC Equity Fund, the Maritime Life Separate Investment Fund, and the Maritime Life Champion Growth Fund (collectively referred to as the “Funds”) and the variable nature of the life insurance contracts that contain these funds.
The Funds that are available to you depend on the contract you own. The underlying investments of the Funds may be units of mutual funds, pooled funds or other selected investments.
Subject to any applicable death and maturity guarantee, any part of the premium or other amount that is allocated to a segregated fund is invested at the risk of the policy owner and may increase or decrease in value according to the fluctuations in the market value of the assets of the segregated fund.

4
MANUL IFE F INANC IAL SEGREGATED FUNDS
Table of Contents
5 General Provisions (unaudited)
Funds
6 Manulife Short-Term Securities Fund10 Manulife Bond Fund14 Manulife Diversified Investment Fund16 Manulife Equity Fund18 Equity Growth Fund20 Monarch Growth Fund22 Maritime Life FLAC Equity Fund 26 Maritime Life Separate Investment Fund30 Maritime Life Champion Growth Fund
35 notes to the Financial statements35 1. The Funds35 2. Summary of Significant Accounting Policies37 3. Management Fees And Expenses 38 4. Financial Instrument Risk39 5. Management of Financial Risks 39 6. Significant Ownership In Underlying Funds39 7. Related Party Transactions40 8. Securities Lending Transactions40 9. Capital Management40 10. Comparative Figures
41 auditors’ report

5
General Provisions (unaudited)Investment Policy and restrictionsThe Funds have been established to provide benefits which will vary in amount depending on the market value of the assets of each of the Funds. The investment policies and restrictions may change from time to time and, if required by your life insurance contract, you will be notified in writing of any material changes.
The Funds are managed in compliance with the individual variable insurance contract guidelines established by the Canadian Life and Health Insurance Association (“CLHIA”) relating to segregated funds.
Mortgages and real EstateMortgages or real estate are not eligible investments for any of the Funds.
reinvestment of EarningsThe realized asset earnings in the Funds are reinvested in the Funds and increase the value of the units. The owner of the contract acquires no direct claim on the Fund assets but only on the contract benefits.

6
MANUL IFE F INANC IAL SEGREGATED FUNDS
Manulife Short-Term Securities Fund
No. of Units/Shares Investment
Average Cost ($)
Fair Value ($)
199,017 Manulife Canadian Money Market Fund 1,990,167 1,990,168
Total Investment 99.6% 1,990,167 1,990,168
Other Assets/(Liabilities) 0.4% 7,061 7,061
Total Net Assets 1,997,228 1,997,229
Statement of Investment Portfolio (audited)As at December 31, 2009
Top 25 Holdings of Underlying Fund (unaudited)
No. of Units/Shares Investment
Average Cost ($)
Fair Value ($)
Manulife Canadian Money Market Fund
64,375,000 Government of Canada T-Bill, 0.53%, Nov-25-2010 64,043,866 64,052,123
59,620,000 Government of Canada T-Bill, 0.59%, Sep-30-2010 59,279,172 59,307,247
39,800,000 Province of Manitoba, 0.83%, Mar-02-2010 39,800,000 39,827,151
39,750,000 Manulife Bank of Canada, 1.44%, Mar-15-2010 39,750,000 39,776,607
39,770,000 Government of Canada T-Bill, 0.54%, Oct-28-2010 39,565,185 39,594,444
39,710,000 Government of Canada T-Bill, 0.64%, Aug-05-2010 39,467,769 39,560,509
33,955,000 Government of Canada T-Bill, 0.57%, Jun-10-2010 33,770,285 33,870,559
29,800,000 International Bank of Recon. & Dev., 1.12%, Jan-31-2010 29,800,000 29,854,865
29,800,000 Province of Ontario, FRN, 1.43%, Apr-02-2013 29,790,558 29,790,556
24,815,000 Royal Bank of Canada, 1.08%, Feb-11-2010 24,815,000 24,851,810
24,850,000 Canadian Imperial Bank of Commerce, 0.45%, Mar-22-2010 24,795,579 24,825,541
24,790,000 Government of Canada T-Bill, 0.56%, Jul-08-2010 24,657,621 24,718,894
23,900,000 Corporation Receivables Trust, 0.40%, Feb-22-2010 23,883,748 23,886,369
19,500,000 Prime Trust, 0.40%, Feb-22-2010 19,486,740 19,488,879
17,850,000 GE Capital Canada Funding, 0.50%, Mar-17-2010 17,806,982 17,831,668
14,900,000 Bank of Nova Scotia, 1.23%, Jan-04-2010 14,900,000 14,945,692
13,900,000 Honda Canada Finance Inc., 0.50%, Jan-13-2010 13,877,204 13,897,720
13,900,000 CRISP Trust, 0.45%, Feb-08-2010 13,884,432 13,893,499
13,550,000 Prime Trust, 0.43%, Feb-17-2010 13,535,637 13,542,499
11,700,000 Canada Master Trust, 0.43%, Feb-17-2010 11,687,364 11,693,545
10,790,000 Province of Ontario, 0.60%, Sep-15-2010 10,734,432 10,744,663
10,579,000 Province of Ontario, 0.55%, Aug-25-2010 10,532,347 10,541,550
10,000,000 Suncor Energy Inc., 0.40%, Jan-20-2010 9,996,700 9,995,490
9,400,000 Toyota Credit Canada Inc., 0.36%, Feb-08-2010 9,387,310 9,396,480
9,100,000 Suncor Energy Inc., 0.42%, Mar-22-2010 9,090,627 9,091,668

7
Financial Instrument RiskBecause the Fund invests exclusively in the units of a single unit trust, the financial risks associated with the Fund are determined by the investment characteristics of the underlying unit trust. The disclosure below is based on analysis of the securities of the underlying unit trust.
The Fund is classified as a Canadian Money Market Fund investing in corporate paper, bank paper and money market securities, issued or guaranteed by the government of Canada, provinces or municipalities to achieve the objective of providing interest income while preserving capital and maintaining liquidity. The Fund’s activities expose it to a variety of financial risks. Please refer to note 4 in the accompanying Notes to the Financial Statements for an explanation of the various risks.
Risk management is an integral part of the investment manager’s philosophy. All holdings have at least a minimum of upper medium grades set by recognized rating agencies. There is an allowed maximum of 10% per issuer (corporate and bank names) and credit quality is monitored based on research provided by credit analysts. The investment manager for the Fund has the final decision-making authority on investment decisions.
Currency RiskPlease refer to note 4 for a definition of currency risk. As at December 31, 2009 and December 31, 2008, the Fund’s assets did not have a significant exposure to currency risk.
Discussion of Financial Risk Management (audited)
Manulife Short-Term Securities Fund
Interest Rate RiskPlease refer to note 4 for a definition of interest rate risk. The portfolio manager diversifies between corporate, bank and government securities maintaining corporate and bank issuers to shorter maturities. The portfolio manager monitors interest rates and uses this information to position this money market portfolio accordingly. The Fund has investment restrictions that prohibit it from investing more than 10% of its assets in any single issuer.
The table below includes the Fund’s assets and trading liabilities at fair values, categorized by the earlier of contractual re-pricing or maturity dates.
December 31, 2009
$000’s Less than 1 year 1-3 years 3-5 years > 5 years Non-Interest Bearing Total
Investments - - 85 - - 85
Cash and cash equivalents 1,906 - - - - 1,906
Other assets - - - - - -
Liabilities - - - - 1 1
December 31, 2008
$000’s Less than 1 year 1-3 years 3-5 years > 5 years Non-Interest Bearing Total
Investments - - - - - -
Cash and cash equivalents 2,075 - - - - 2,075
Other assets - - - - 13 13
Liabilities - - - - 12 12
Management’s best estimate of the effect on net assets due to an increase or decrease by 0.25% in prevailing interest rates, with all other variables held constant, is a decrease or increase in the Fund’s net assets, respectively by approximately $1,891 ($1,611 - 2008). In practice, the actual results may differ and the difference could be material.
8
MANUL IFE F INANC IAL SEGREGATED FUNDS
Discussion of Financial Risk Management (audited) (continued) Fair Value Measurement (audited)
Manulife Short-Term Securities Fund
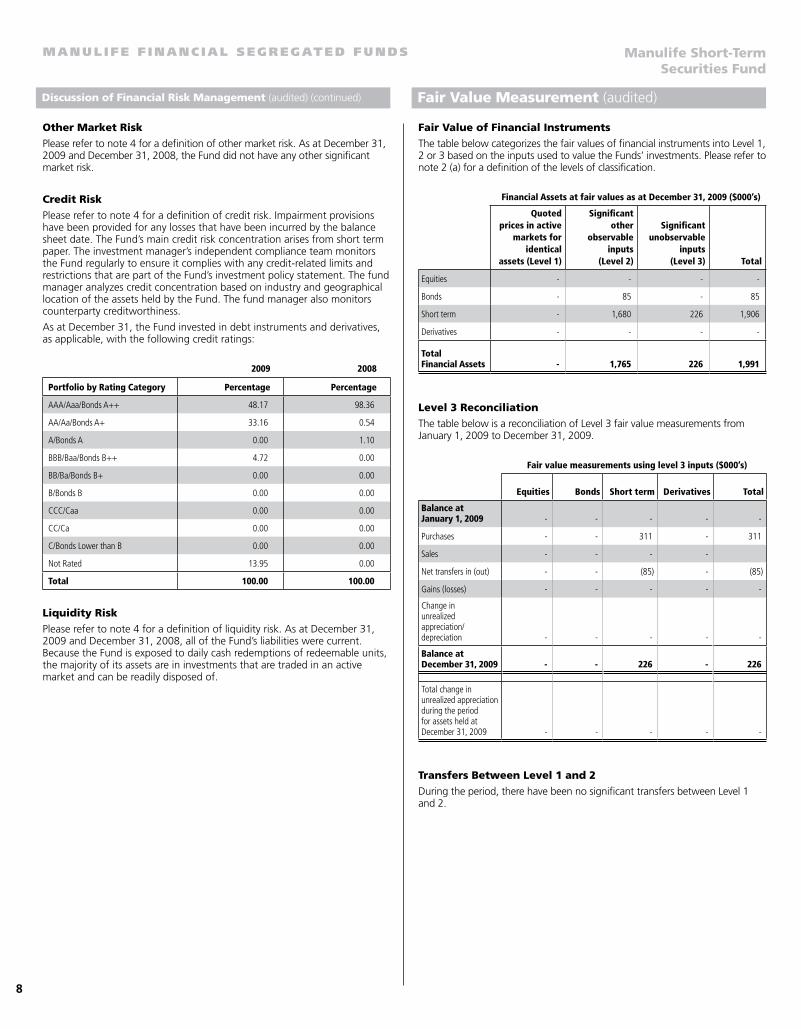
Other Market RiskPlease refer to note 4 for a definition of other market risk. As at December 31, 2009 and December 31, 2008, the Fund did not have any other significant market risk.
Credit RiskPlease refer to note 4 for a definition of credit risk. Impairment provisions have been provided for any losses that have been incurred by the balance sheet date. The Fund’s main credit risk concentration arises from short term paper. The investment manager’s independent compliance team monitors the Fund regularly to ensure it complies with any credit-related limits and restrictions that are part of the Fund’s investment policy statement. The fund manager analyzes credit concentration based on industry and geographical location of the assets held by the Fund. The fund manager also monitors counterparty creditworthiness.
As at December 31, the Fund invested in debt instruments and derivatives, as applicable, with the following credit ratings:
2009 2008
Portfolio by Rating Category Percentage Percentage
AAA/Aaa/Bonds A++ 48.17 98.36
AA/Aa/Bonds A+ 33.16 0.54
A/Bonds A 0.00 1.10
BBB/Baa/Bonds B++ 4.72 0.00
BB/Ba/Bonds B+ 0.00 0.00
B/Bonds B 0.00 0.00
CCC/Caa 0.00 0.00
CC/Ca 0.00 0.00
C/Bonds Lower than B 0.00 0.00
Not Rated 13.95 0.00
Total 100.00 100.00
Liquidity RiskPlease refer to note 4 for a definition of liquidity risk. As at December 31, 2009 and December 31, 2008, all of the Fund’s liabilities were current. Because the Fund is exposed to daily cash redemptions of redeemable units, the majority of its assets are in investments that are traded in an active market and can be readily disposed of.
Fair Value of Financial InstrumentsThe table below categorizes the fair values of financial instruments into Level 1, 2 or 3 based on the inputs used to value the Funds’ investments. Please refer to note 2 (a) for a definition of the levels of classification.
Financial Assets at fair values as at December 31, 2009 ($000’s)
Quoted prices in active
markets for identical
assets (Level 1)
Significant other
observable inputs
(Level 2)
Significant unobservable
inputs (Level 3) Total
Equities - - - -
Bonds - 85 - 85
Short term - 1,680 226 1,906
Derivatives - - - -
Total Financial Assets - 1,765 226 1,991
Level 3 Reconciliation
The table below is a reconciliation of Level 3 fair value measurements from January 1, 2009 to December 31, 2009.
Fair value measurements using level 3 inputs ($000’s)
Equities Bonds Short term Derivatives Total
Balance at January 1, 2009 - - - - -
Purchases - - 311 - 311
Sales - - - -
Net transfers in (out) - - (85) - (85)
Gains (losses) - - - - -
Change in unrealized appreciation/ depreciation - - - - -
Balance at December 31, 2009 - - 226 - 226
Total change in unrealized appreciation during the period for assets held at December 31, 2009 - - - - -
Transfers Between Level 1 and 2During the period, there have been no significant transfers between Level 1 and 2.

9
Manulife Short-Term Securities Fund
2009 ($000’s)
2008($000’s)
Assets
Investments, at fair value 1,990 2,076
Cash and short-term investments - -
Distribution receivable 1 5
Receivable from investment units sold - -
Management fee distribution receivable {Note 2(c)(iii)} - -
Other assets 6 1
1,997 2,082
Liabilities
Bank overdraft - -
Payable for investment units purchased - -
Payable for management fees (Inc. all GST) - -
Other liabilities - -
- -
Net assets 1,997 2,082
Statements of Net Assets (audited)As at December 31
2009 ($000’s)
2008($000’s)
Income
Distribution from underlying fund 27 81
Interest - -
Management fee distribution received - -
27 81
Expenses
Management fees 7 7
Fund administration expenses 15 16
22 23
Net investment income (loss) 5 58
Realized and unrealized gain (loss) - -
Net increase (decrease) in net assets
resulting from operations 5 58
Statements of Operations (audited)For the years ended December 31
2009 ($000’s)
2008($000’s)
Net assets, beginning of year 2,082 2,133
Net increase (decrease) in net assets
resulting from operations 5 58
Transactions with unitholders
Unitholders' contributions 67 70
Unitholders' withdrawals (269) (295)
Transfers (to) from other funds 112 116
Net increase (decrease) from
unitholders' transactions (90) (109)
Net assets, end of year 1,997 2,082
Statements of Changes in Net Assets (audited)For the years ended December 31
Financial Statements - Supplementary Schedules (audited)For the years ended December 31
Net asset value per unit ($)
(refer to Note 2d)Units issued and
outstanding
Management expense ratio (%)
(refer to Note 3b)
Product 2009 2008 2009 2008 2009 2008 2007 2006 2005
Individual Investor 234 3.32 3.31 150,669 145,763 1.09 1.05 1.06 1.07 1.07
Individual Investor 235 3.32 3.31 407,159 422,067 1.09 1.05 1.06 1.07 1.07
Individual Accumulator 209 4.18 4.16 33,877 48,533 0.82 0.79 0.79 0.80 0.80
See accompanying Notes to the Financial Statements.

10
MANUL IFE F INANC IAL SEGREGATED FUNDS
Manulife Bond Fund
No. of Units/Shares Investment
Average Cost ($)
Fair Value ($)
780,673 Manulife Canadian Bond Fund 7,628,504 8,424,243
Total Investment 95.5% 7,628,504 8,424,243
Other Assets/(Liabilities) 4.5% 398,833 398,833
Total Net Assets 8,027,337 8,823,076
Statement of Investment Portfolio (audited)As at December 31, 2009
Top 25 Holdings of Underlying Fund (unaudited)
No. of Units/Shares Investment
Average Cost ($)
Fair Value ($)
Manulife Canadian Bond Fund
21,275,000 Canada Housing Trust, 2.75%, Dec-15-2014 21,235,641 21,029,160
16,907,000 Government of Canada, 3.50%, Jun-01-2013 17,680,407 17,583,132
13,514,000 Province of British Columbia, 4.25%, Jun-18-2014 14,368,849 14,262,127
13,778,000 Province of Quebec, 4.50%, Dec-01-2018 13,674,491 14,086,731
12,975,000 Canada Housing Trust, 4.55%, Dec-15-2012 13,865,474 13,833,630
11,726,482 Royal Office Finance, 5.21%, Nov-12-2032 11,726,365 11,566,354
11,000,000 Government of Canada, 2.00%, Sep-01-2012 11,119,900 11,021,742
10,621,000 Province of Quebec, 4.50%, Dec-01-2019 10,793,439 10,731,694
8,916,000 PSP Capital Inc., 4.57%, Dec-09-2013 9,003,704 9,476,295
9,213,000 Government of Canada, 3.00%, Jun-01-2014 9,391,138 9,351,356
8,914,000 African Development Bank, 4.00%, Jun-18-2013 8,905,532 9,237,416
8,023,000 Canadian Imperial Bank of Commerce, 3.05%, Jun-13-2013 8,018,748 8,090,733
7,992,000 Province of British Columbia, 4.10%, Dec-18-2019 7,991,076 7,879,583
6,124,000 Government of Canada, 5.75%, Jun-01-2029 7,617,841 7,390,735
6,988,000 Citigroup Finance Canada Inc., 4.90%, Nov-13-2012 7,102,782 7,133,207
7,163,000 Canada Housing Trust, 3.75%, Mar-15-2020 7,134,200 6,993,911
6,900,000 Government of Canada T-Bill, 0.22%, Apr-01-2010 6,895,170 6,896,187
6,647,000 GE Capital Canada Funding, 5.53%, Aug-17-2017 6,688,748 6,892,664
5,773,000 Province of British Columbia, 4.95%, Jun-18-2040 6,068,578 5,997,828
5,619,000 Government of Canada, 3.75%, Sep-01-2011 5,904,805 5,843,269
5,481,000 Province of Saskatchewan, 4.65%, Sep-05-2017 5,456,281 5,784,360
5,451,000 Province of Ontario, 4.30%, Mar-08-2017 5,753,214 5,645,137
5,408,000 American Express Canada Credit Corp., 4.85%, Oct-03-2014 5,427,397 5,570,481
5,168,000 African Development Bank, 4.85%, Jul-24-2012 5,161,178 5,502,233
5,528,327 Ontario School Boards Financing Corporation, 5.38%, Jun-25-2032 5,528,327 5,449,662
11
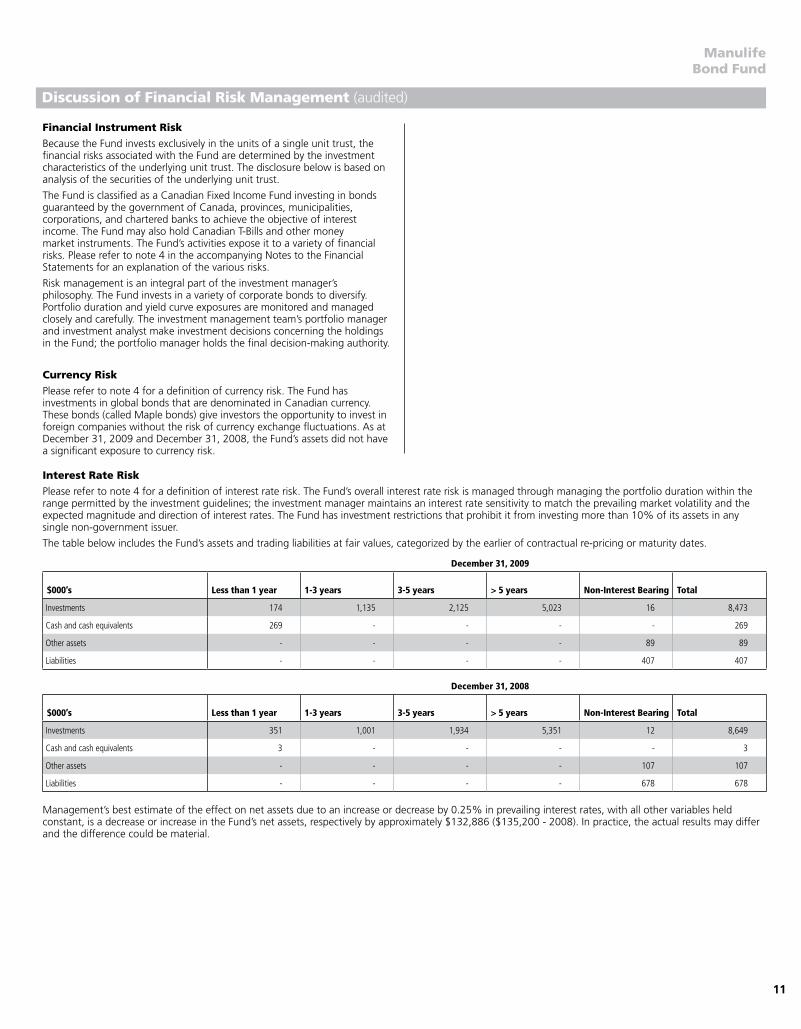
Financial Instrument RiskBecause the Fund invests exclusively in the units of a single unit trust, the financial risks associated with the Fund are determined by the investment characteristics of the underlying unit trust. The disclosure below is based on analysis of the securities of the underlying unit trust.
The Fund is classified as a Canadian Fixed Income Fund investing in bonds guaranteed by the government of Canada, provinces, municipalities, corporations, and chartered banks to achieve the objective of interest income. The Fund may also hold Canadian T-Bills and other money market instruments. The Fund’s activities expose it to a variety of financial risks. Please refer to note 4 in the accompanying Notes to the Financial Statements for an explanation of the various risks.
Risk management is an integral part of the investment manager’s philosophy. The Fund invests in a variety of corporate bonds to diversify. Portfolio duration and yield curve exposures are monitored and managed closely and carefully. The investment management team’s portfolio manager and investment analyst make investment decisions concerning the holdings in the Fund; the portfolio manager holds the final decision-making authority.
Currency RiskPlease refer to note 4 for a definition of currency risk. The Fund has investments in global bonds that are denominated in Canadian currency. These bonds (called Maple bonds) give investors the opportunity to invest in foreign companies without the risk of currency exchange fluctuations. As at December 31, 2009 and December 31, 2008, the Fund’s assets did not have a significant exposure to currency risk.
Discussion of Financial Risk Management (audited)
Manulife Bond Fund
Interest Rate RiskPlease refer to note 4 for a definition of interest rate risk. The Fund’s overall interest rate risk is managed through managing the portfolio duration within the range permitted by the investment guidelines; the investment manager maintains an interest rate sensitivity to match the prevailing market volatility and the expected magnitude and direction of interest rates. The Fund has investment restrictions that prohibit it from investing more than 10% of its assets in any single non-government issuer.
The table below includes the Fund’s assets and trading liabilities at fair values, categorized by the earlier of contractual re-pricing or maturity dates.
December 31, 2009
$000’s Less than 1 year 1-3 years 3-5 years > 5 years Non-Interest Bearing Total
Investments 174 1,135 2,125 5,023 16 8,473
Cash and cash equivalents 269 - - - - 269
Other assets - - - - 89 89
Liabilities - - - - 407 407
December 31, 2008
$000’s Less than 1 year 1-3 years 3-5 years > 5 years Non-Interest Bearing Total
Investments 351 1,001 1,934 5,351 12 8,649
Cash and cash equivalents 3 - - - - 3
Other assets - - - - 107 107
Liabilities - - - - 678 678
Management’s best estimate of the effect on net assets due to an increase or decrease by 0.25% in prevailing interest rates, with all other variables held constant, is a decrease or increase in the Fund’s net assets, respectively by approximately $132,886 ($135,200 - 2008). In practice, the actual results may differ and the difference could be material.

12
MANUL IFE F INANC IAL SEGREGATED FUNDS
Discussion of Financial Risk Management (audited) (continued) Fair Value Measurement (audited)
Manulife Bond Fund
Other Market RiskPlease refer to note 4 for a definition of other market risk. As at December 31, 2009 and December 31, 2008, the Fund did not have any other significant market risk.
Credit RiskPlease refer to note 4 for a definition of credit risk. The Fund’s main credit risk concentration arises from debt securities. The investment manager’s independent compliance team monitors the Fund regularly to ensure the Fund’s investments match the policy statement. The Fund has investment restrictions that prohibit it from investing more than 10% with any single non-government issuer. The investment manager analyzes credit concentration based on industry and geographical location of the assets that the Fund holds. All transactions in listed securities are settled or paid for upon delivery using approved brokers. The delivery of securities sold is made only when the broker has received payment. The payment for purchases is made only when the securities have been received by the broker. If either party fails to meet its obligations, the trade in question will not take place.
As at December 31, the Fund invested in debt instruments and derivatives, as applicable, with the following credit ratings:
2009 2008
Portfolio by Rating Category Percentage Percentage
AAA/Aaa/Bonds A++ 35.90 30.07
AA/Aa/Bonds A+ 16.43 26.29
A/Bonds A 37.31 37.07
BBB/Baa/Bonds B++ 10.36 6.51
BB/Ba/Bonds B+ 0.00 0.06
B/Bonds B 0.00 0.00
CCC/Caa 0.00 0.00
CC/Ca 0.00 0.00
C/Bonds Lower than B 0.00 0.00
Not Rated 0.00 0.00
Total 100.00 100.00
Liquidity RiskPlease refer to note 4 for a definition of liquidity risk. As at December 31, 2009 and December 31, 2008, all of the Fund’s liabilities were current. Because the Fund is exposed to daily cash redemptions of redeemable units, the majority of its assets are in investments that are traded in an active market and can be readily disposed of.
Fair Value of Financial InstrumentsThe table below categorizes the fair values of financial instruments into Level 1, 2 or 3 based on the inputs used to value the Funds’ investments. Please refer to note 2 (a) for a definition of the levels of classification.
Financial Assets at fair values as at December 31, 2009 ($000’s)
Quoted prices in active
markets for identical
assets (Level 1)
Significant other
observable inputs
(Level 2)
Significant unobservable
inputs (Level 3) Total
Equities - - - -
Bonds - 8,473 - 8,473
Short term - 137 - 137
Derivatives - - - -
Total Financial Assets - 8,610 - 8,610
Level 3 Reconciliation
As there have been no Level 3 holdings in the Fund during the period, a reconciliation has not been provided.
Transfers Between Level 1 and 2During the period, there have been no significant transfers between Level 1 and 2.

13
Manulife Bond Fund
2009 ($000’s)
2008($000’s)
Assets
Investments, at fair value 8,424 8,081
Cash and short-term investments - -
Distribution receivable 392 481
Receivable from investment units sold 5 34
Management fee distribution receivable {Note 2(c)(iii)} - -
Other assets 2 -
8,823 8,596
Liabilities
Bank overdraft - -
Payable for investment units purchased - -
Payable for management fees (Inc. all GST) - -
Other liabilities - 26
- 26
Net assets 8,823 8,570
Statements of Net Assets (audited)As at December 31
2009 ($000’s)
2008($000’s)
Income
Distribution from underlying fund 392 481
Interest - -
Management fee distribution received - -
392 481
Expenses
Management fees 52 53
Fund administration expenses 128 131
180 184
Net investment income (loss) 212 297
Realized and unrealized gain (loss) 320 (47)
Net increase (decrease) in net assets
resulting from operations 532 250
Statements of Operations (audited)For the years ended December 31
2009 ($000’s)
2008($000’s)
Net assets, beginning of year 8,570 8,975
Net increase (decrease) in net assets
resulting from operations 532 250
Transactions with unitholders
Unitholders' contributions 265 302
Unitholders' withdrawals (561) (954)
Transfers (to) from other funds 17 (3)
Net increase (decrease) from
unitholders' transactions (279) (655)
Net assets, end of year 8,823 8,570
Statements of Changes in Net Assets (audited)For the years ended December 31
Financial Statements - Supplementary Schedules (audited)For the years ended December 31
Net asset value per unit ($)
(refer to Note 2d)Units issued and
outstanding
Management expense ratio (%)
(refer to Note 3b)
Product 2009 2008 2009 2008 2009 2008 2007 2006 2005
Individual Investor 234 5.61 5.30 328,572 331,778 2.07 2.00 2.01 2.02 2.03
Individual Investor 235 5.61 5.30 1,231,031 1,278,890 2.07 2.00 2.01 2.02 2.03
Individual Accumulator 203 7.61 7.10 9,071 9,038 0.82 0.79 0.80 0.80 0.80
See accompanying Notes to the Financial Statements.

14
MANUL IFE F INANC IAL SEGREGATED FUNDS
Manulife Diversified Investment Fund
No. of Units/Shares Investment
Average Cost ($)
Fair Value ($)
3,070,480 SEAMARK Pooled Balanced Fund 39,316,263 42,473,953
Total Investment 99.4% 39,316,263 42,473,953
Other Assets/(Liabilities) 0.6% 256,633 256,633
Total Net Assets 39,572,896 42,730,586
Statement of Investment Portfolio (audited)As at December 31, 2009
Top 25 Holdings of Underlying Fund (unaudited)
No. of Units/Shares Investment
Average Cost ($)
Fair Value ($)
SEAMARK Pooled Balanced Fund
23,800,000 Canada Housing Trust, 4.80%, Jun-15-2012 24,342,814 25,424,826
18,300,000 Canada Housing Trust, 3.15%, Jun-15-2014 18,506,685 18,544,122
18,000,000 Province of Ontario, 4.70%, Jun-02-2037 17,149,500 17,766,000
188,480 Royal Bank of Canada 4,762,556 10,630,272
8,215,000 Toronto-Dominion Bank, 5.14%, Nov-19-2012 8,268,468 8,837,451
128,295 Toronto-Dominion Bank 4,555,182 8,462,338
294,765 Fortis Inc. 8,288,986 8,453,860
7,000,000 Province of Ontario, 6.50%, Mar-08-2029 8,539,730 8,431,500
5,560,000 Province of Quebec, 9.38%, Jan-16-2023 7,983,604 8,053,660
7,520,000 Bank of Nova Scotia, 4.94%, Apr-15-2019 7,704,240 7,967,816
187,950 Suncor Energy Inc. 3,099,270 6,993,620
213,200 Tim Hortons Inc. 6,782,511 6,850,116
304,950 Shaw Communications Inc., Class B 3,407,509 6,608,267
6,417,000 GE Capital Canada Funding, 5.68%, Sep-10-2019 6,417,328 6,556,570
210,125 Sun Life Financial Inc. 5,886,413 6,356,281
144,600 MacDonald Dettwiler & Associates Ltd. 6,401,037 6,159,960
86,600 Research in Motion Limited 7,558,996 6,151,198
87,900 Canadian Imperial Bank of Commerce 6,026,073 5,990,385
496,700 Yamana Gold Inc. 6,028,440 5,960,400
299,600 Manulife Financial Corporation 6,288,546 5,791,268
226,550 Nexen Inc. 7,146,476 5,713,591
97,744 Canadian National Railway Company 2,249,938 5,604,641
162,900 TELUS Corporation 8,528,829 5,556,519
215,150 Gildan Activewear Inc. 2,092,846 5,529,355
530,400 ING Groep NV 5,139,091 5,445,694

15
Financial Instrument RiskManulife Diversified Investment Fund is a ‘fund of fund’ which invests fully in the units of the underlying SEAMARK Pooled Balanced Fund. Please refer to note 4 in the accompanying Notes to the Financial Statements for an explanation of the various risks. The underlying SEAMARK Pooled Balanced Fund seeks to preserve investment capital while generating superior long-term returns through capital gains augmented by current income. The management team uses a bottom-up approach to select an asset mix of individual investments at reasonable valuations.
Financial Instrument Risk of the Underlying FundThe table below indicates the financial instrument risks that may apply to the underlying fund which will also affect the segregated fund. Please refer to note 5b for an explanation of the management of financial risks for fund of funds.
Risk Applicable
Currency Risk √
Interest Rate Risk √
Other Market Risk √
Credit Risk √
Liquidity Risk
Discussion of Financial Risk Management (audited)
Manulife Diversified Investment Fund
2009 ($000’s)
2008($000’s)
Assets
Investments, at fair value 42,474 39,437
Cash and short-term investments - -
Distribution receivable 305 1,351
Receivable from investment units sold - -
Management fee distribution receivable {Note 2(c)(iii)} - -
Other assets - -
42,779 40,788
Liabilities
Bank overdraft - -
Payable for investment units purchased - -
Payable for management fees (Inc. all GST) - -
Other liabilities 48 57
48 57
Net assets 42,731 40,731
Statements of Net Assets (audited)As at December 31
2009 ($000’s)
2008($000’s)
Net assets, beginning of year 40,731 52,468
Net Increase (decrease) in net assets
resulting from operations 4,972 (6,854)
Transactions with unitholders
Unitholders' contributions 1,034 1,157
Unitholders' withdrawals (3,987) (5,994)
Transfers (to) from other funds (19) (46)
Net increase (decrease) from
unitholders' transactions (2,972) (4,883)
Net assets, end of year 42,731 40,731
Statements of Changes in Net Assets (audited)For the years ended December 31
2009 ($000’s)
2008($000’s)
Income
Distribution from underlying fund 1,342 2,601
Interest - 63
Management fee distribution received - -
1,342 2,664
Expenses
Management fees 315 378
Fund administration expenses 616 726
931 1,104
Net investment income (loss) 411 1,560
Realized and unrealized gain (loss) 4,561 (8,414)
Net increase (decrease) in net assets
resulting from operations 4,972 (6,854)
Statements of Operations (audited)For the years ended December 31
Financial Statements - Supplementary Schedules (audited)For the years ended December 31
Net asset value per unit ($)
(refer to Note 2d)Units issued and
outstanding
Management expense ratio (%)
(refer to Note 3b)
Product 2009 2008 2009 2008 2009 2008 2007 2006 2005
Individual Investor 234 49.54 44.01 188,193 199,739 2.62 2.52 2.54 2.56 2.57
Individual Investor 235 49.54 44.01 471,583 500,526 2.62 2.52 2.54 2.56 2.57
Individual Accumulator 209 208.65 182.83 25,162 30,162 1.26 1.21 1.22 1.23 1.23
Individual Accumulator 203 208.65 182.83 23,128 24,315 1.26 1.21 1.22 1.23 1.23
See accompanying Notes to the Financial Statements.
16
MANUL IFE F INANC IAL SEGREGATED FUNDS
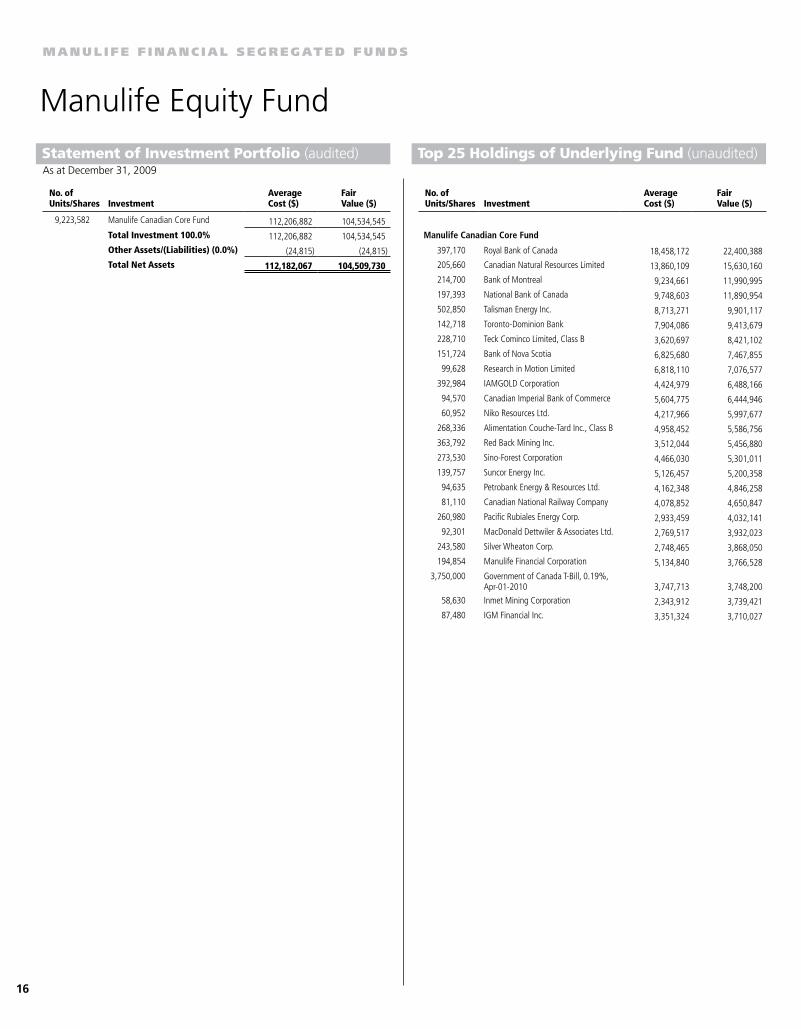
Manulife Equity Fund
No. of Units/Shares Investment
Average Cost ($)
Fair Value ($)
9,223,582 Manulife Canadian Core Fund 112,206,882 104,534,545
Total Investment 100.0% 112,206,882 104,534,545
Other Assets/(Liabilities) (0.0%) (24,815) (24,815)
Total Net Assets 112,182,067 104,509,730
Statement of Investment Portfolio (audited)As at December 31, 2009
Top 25 Holdings of Underlying Fund (unaudited)
No. of Units/Shares Investment
Average Cost ($)
Fair Value ($)
Manulife Canadian Core Fund
397,170 Royal Bank of Canada 18,458,172 22,400,388
205,660 Canadian Natural Resources Limited 13,860,109 15,630,160
214,700 Bank of Montreal 9,234,661 11,990,995
197,393 National Bank of Canada 9,748,603 11,890,954
502,850 Talisman Energy Inc. 8,713,271 9,901,117
142,718 Toronto-Dominion Bank 7,904,086 9,413,679
228,710 Teck Cominco Limited, Class B 3,620,697 8,421,102
151,724 Bank of Nova Scotia 6,825,680 7,467,855
99,628 Research in Motion Limited 6,818,110 7,076,577
392,984 IAMGOLD Corporation 4,424,979 6,488,166
94,570 Canadian Imperial Bank of Commerce 5,604,775 6,444,946
60,952 Niko Resources Ltd. 4,217,966 5,997,677
268,336 Alimentation Couche-Tard Inc., Class B 4,958,452 5,586,756
363,792 Red Back Mining Inc. 3,512,044 5,456,880
273,530 Sino-Forest Corporation 4,466,030 5,301,011
139,757 Suncor Energy Inc. 5,126,457 5,200,358
94,635 Petrobank Energy & Resources Ltd. 4,162,348 4,846,258
81,110 Canadian National Railway Company 4,078,852 4,650,847
260,980 Pacific Rubiales Energy Corp. 2,933,459 4,032,141
92,301 MacDonald Dettwiler & Associates Ltd. 2,769,517 3,932,023
243,580 Silver Wheaton Corp. 2,748,465 3,868,050
194,854 Manulife Financial Corporation 5,134,840 3,766,528
3,750,000 Government of Canada T-Bill, 0.19%, Apr-01-2010 3,747,713 3,748,200
58,630 Inmet Mining Corporation 2,343,912 3,739,421
87,480 IGM Financial Inc. 3,351,324 3,710,027

17
Financial Instrument RiskManulife Equity Fund is a ‘fund of fund’ which invests fully in the units of the underlying Manulife Canadian Core Fund. Please refer to note 4 in the accompanying Notes to the Financial Statements for an explanation of the various risks. The underlying Manulife Canadian Core Fund seeks long-term capital growth by investing primarily in equity securities of large-cap Canadian companies.
Financial Instrument Risk of the Underlying FundThe table below indicates the financial instrument risks that may apply to the underlying fund which will also affect the segregated fund. Please refer to note 5b for an explanation of the management of financial risks for fund of funds.
Risk Applicable
Currency Risk
Interest Rate Risk
Other Market Risk √
Credit Risk
Liquidity Risk
Discussion of Financial Risk Management (audited)
Manulife Equity Fund
2009 ($000’s)
2008($000’s)
Assets
Investments, at fair value 104,535 88,104
Cash and short-term investments - -
Distribution receivable - -
Receivable from investment units sold 263 184
Management fee distribution receivable {Note 2(c)(iii)} - -
Other assets - -
104,798 88,288
Liabilities
Bank overdraft - -
Payable for investment units purchased - -
Payable for management fees (Inc. all GST) - -
Other liabilities 288 66
288 66
Net assets 104,510 88,222
Statements of Net Assets (audited)As at December 31
2009 ($000’s)
2008($000’s)
Net assets, beginning of year 88,222 161,356
Net Increase (decrease) in net assets
resulting from operations 20,676 (64,231)
Transactions with unitholders
Unitholders' contributions 3,016 3,339
Unitholders' withdrawals (7,294) (12,175)
Transfers (to) from other funds (110) (67)
Net increase (decrease) from
unitholders' transactions (4,388) (8,903)
Net assets, end of year 104,510 88,222
Statements of Changes in Net Assets (audited)For the years ended December 31
2009 ($000’s)
2008($000’s)
Income
Distribution from underlying fund 1,305 1,323
Interest 97 55
Management fee distribution received - -
1,402 1,378
Expenses
Management fees 768 1,173
Fund administration expenses 1,668 2,535
2,436 3,708
Net investment income (loss) (1,034) (2,330)
Realized and unrealized gain (loss) 21,710 (61,901)
Net increase (decrease) in net assets
resulting from operations 20,676 (64,231)
Statements of Operations (audited)For the years ended December 31
Financial Statements - Supplementary Schedules (audited)For the years ended December 31
Net asset value per unit ($)
(refer to Note 2d)Units issued and
outstanding
Management expense ratio (%)
(refer to Note 3b)
Product 2009 2008 2009 2008 2009 2008 2007 2006 2005
Individual Investor 234 4.02 3.24 7,904,728 8,257,548 2.84 2.73 2.76 2.77 2.78
Individual Investor 235 4.02 3.24 14,684,934 15,137,717 2.84 2.73 2.76 2.77 2.78
Individual Accumulator 203 24.12 19.21 488,762 532,181 1.47 1.42 1.43 1.44 1.45
Variable Payout Annuity 7.91 6.25 744 1,515 0.82 0.79 0.79 0.80 0.80
Equity 65 25.55 20.15 11,019 21,077 0.54 0.52 0.53 0.53 0.54
Sun Alliance (Acadia Equity Linked) 7.11 5.87 265,119 299,482 0.65 0.60 0.64 0.64 0.62
See accompanying Notes to the Financial Statements.

18
MANUL IFE F INANC IAL SEGREGATED FUNDS
Equity Growth Fund
No. of Units/Shares Investment
Average Cost ($)
Fair Value ($)
104,879 Manulife Canadian Core Fund 1,269,276 1,188,638
Total Investment 100.0% 1,269,276 1,188,638
Other Assets/(Liabilities) 0.0% 488 488
Total Net Assets 1,269,764 1,189,126
Statement of Investment Portfolio (audited)As at December 31, 2009
Top 25 Holdings of Underlying Fund (unaudited)
No. of Units/Shares Investment
Average Cost ($)
Fair Value ($)
Manulife Canadian Core Fund
397,170 Royal Bank of Canada 18,458,172 22,400,388
205,660 Canadian Natural Resources Limited 13,860,109 15,630,160
214,700 Bank of Montreal 9,234,661 11,990,995
197,393 National Bank of Canada 9,748,603 11,890,954
502,850 Talisman Energy Inc. 8,713,271 9,901,117
142,718 Toronto-Dominion Bank 7,904,086 9,413,679
228,710 Teck Cominco Limited, Class B 3,620,697 8,421,102
151,724 Bank of Nova Scotia 6,825,680 7,467,855
99,628 Research in Motion Limited 6,818,110 7,076,577
392,984 IAMGOLD Corporation 4,424,979 6,488,166
94,570 Canadian Imperial Bank of Commerce 5,604,775 6,444,946
60,952 Niko Resources Ltd. 4,217,966 5,997,677
268,336 Alimentation Couche-Tard Inc., Class B 4,958,452 5,586,756
363,792 Red Back Mining Inc. 3,512,044 5,456,880
273,530 Sino-Forest Corporation 4,466,030 5,301,011
139,757 Suncor Energy Inc. 5,126,457 5,200,358
94,635 Petrobank Energy & Resources Ltd. 4,162,348 4,846,258
81,110 Canadian National Railway Company 4,078,852 4,650,847
260,980 Pacific Rubiales Energy Corp. 2,933,459 4,032,141
92,301 MacDonald Dettwiler & Associates Ltd. 2,769,517 3,932,023
243,580 Silver Wheaton Corp. 2,748,465 3,868,050
194,854 Manulife Financial Corporation 5,134,840 3,766,528
3,750,000 Government of Canada T-Bill, 0.19%, Apr-01-2010 3,747,713 3,748,200
58,630 Inmet Mining Corporation 2,343,912 3,739,421
87,480 IGM Financial Inc. 3,351,324 3,710,027

19
Financial Instrument RiskEquity Growth Fund is a ‘fund of fund’ which invests fully in the units of the underlying Manulife Canadian Core Fund. Please refer to note 4 in the accompanying Notes to the Financial Statements for an explanation of the various risks. The underlying Manulife Canadian Core Fund seeks long-term capital growth by investing primarily in equity securities of large-cap Canadian companies.
Financial Instrument Risk of the Underlying FundThe table below indicates the financial instrument risks that may apply to the underlying fund which will also affect the segregated fund. Please refer to note 5b for an explanation of the management of financial risks for fund of funds.
Risk Applicable
Currency Risk
Interest Rate Risk
Other Market Risk √
Credit Risk
Liquidity Risk
Discussion of Financial Risk Management (audited)
Equity Growth Fund
2009 ($000’s)
2008($000’s)
Assets
Investments, at fair value 1,189 955
Cash and short-term investments - -
Distribution receivable - -
Receivable from investment units sold - -
Management fee distribution receivable {Note 2(c)(iii)} - -
Other assets - 1
1,189 956
Liabilities
Bank overdraft - -
Payable for investment units purchased - -
Payable for management fees (Inc. all GST) - -
Other liabilities - -
- -
Net assets 1,189 956
Statements of Net Assets (audited)As at December 31
2009 ($000’s)
2008($000’s)
Net assets, beginning of year 956 1,653
Net Increase (decrease) in net assets
resulting from operations 289 (651)
Transactions with unitholders
Unitholders' contributions 13 16
Unitholders' withdrawals (69) (62)
Transfers (to) from other funds - -
Net increase (decrease) from
unitholders' transactions (56) (46)
Net assets, end of year 1,189 956
Statements of Changes in Net Assets (audited)For the years ended December 31
2009 ($000’s)
2008($000’s)
Income
Distribution from underlying fund 15 14
Interest 49 16
Management fee distribution received - -
64 30
Expenses
Management fees 13 19
Fund administration expenses - -
13 19
Net investment income (loss) 51 11
Realized and unrealized gain (loss) 238 (662)
Net increase (decrease) in net assets
resulting from operations 289 (651)
Statements of Operations (audited)For the years ended December 31
Financial Statements - Supplementary Schedules (audited)For the years ended December 31
Net asset value per unit ($)
(refer to Note 2d)Units issued and
outstanding
Management expense ratio (%)
(refer to Note 3b)
Product 2009 2008 2009 2008 2009 2008 2007 2006 2005
Nalaco Growth "R" 256.45 194.65 4,635 4,908 1.31 1.26 1.27 1.33 1.36
See accompanying Notes to the Financial Statements.

20
MANUL IFE F INANC IAL SEGREGATED FUNDS
Monarch Growth Fund
No. of Units/Shares Investment
Average Cost ($)
Fair Value ($)
1,100,602 Manulife Canadian Core Fund 13,309,512 12,473,559
Total Investment 100.3% 13,309,512 12,473,559
Other Assets/(Liabilities) (0.3%) (31,952) (31,952)
Total Net Assets 13,277,560 12,441,607
Statement of Investment Portfolio (audited)As at December 31, 2009
Top 25 Holdings of Underlying Fund (unaudited)
No. of Units/Shares Investment
Average Cost ($)
Fair Value ($)
Manulife Canadian Core Fund
397,170 Royal Bank of Canada 18,458,172 22,400,388
205,660 Canadian Natural Resources Limited 13,860,109 15,630,160
214,700 Bank of Montreal 9,234,661 11,990,995
197,393 National Bank of Canada 9,748,603 11,890,954
502,850 Talisman Energy Inc. 8,713,271 9,901,117
142,718 Toronto-Dominion Bank 7,904,086 9,413,679
228,710 Teck Cominco Limited, Class B 3,620,697 8,421,102
151,724 Bank of Nova Scotia 6,825,680 7,467,855
99,628 Research in Motion Limited 6,818,110 7,076,577
392,984 IAMGOLD Corporation 4,424,979 6,488,166
94,570 Canadian Imperial Bank of Commerce 5,604,775 6,444,946
60,952 Niko Resources Ltd. 4,217,966 5,997,677
268,336 Alimentation Couche-Tard Inc., Class B 4,958,452 5,586,756
363,792 Red Back Mining Inc. 3,512,044 5,456,880
273,530 Sino-Forest Corporation 4,466,030 5,301,011
139,757 Suncor Energy Inc. 5,126,457 5,200,358
94,635 Petrobank Energy & Resources Ltd. 4,162,348 4,846,258
81,110 Canadian National Railway Company 4,078,852 4,650,847
260,980 Pacific Rubiales Energy Corp. 2,933,459 4,032,141
92,301 MacDonald Dettwiler & Associates Ltd. 2,769,517 3,932,023
243,580 Silver Wheaton Corp. 2,748,465 3,868,050
194,854 Manulife Financial Corporation 5,134,840 3,766,528
3,750,000 Government of Canada T-Bill, 0.19%, Apr-01-2010 3,747,713 3,748,200
58,630 Inmet Mining Corporation 2,343,912 3,739,421
87,480 IGM Financial Inc. 3,351,324 3,710,027

21
Financial Instrument RiskMonarch Growth Fund is a ‘fund of fund’ which invests fully in the units of the underlying Manulife Canadian Core Fund. Please refer to note 4 in the accompanying Notes to the Financial Statements for an explanation of the various risks. The underlying Manulife Canadian Core Fund seeks long-term capital growth by investing primarily in equity securities of large-cap Canadian companies.
Financial Instrument Risk of the Underlying FundThe table below indicates the financial instrument risks that may apply to the underlying fund which will also affect the segregated fund. Please refer to note 5b for an explanation of the management of financial risks for fund of funds.
Risk Applicable
Currency Risk
Interest Rate Risk
Other Market Risk √
Credit Risk
Liquidity Risk
Discussion of Financial Risk Management (audited)
Monarch Growth Fund
2009 ($000’s)
2008($000’s)
Assets
Investments, at fair value 12,474 10,192
Cash and short-term investments - -
Distribution receivable - -
Receivable from investment units sold 48 1
Management fee distribution receivable {Note 2(c)(iii)} - -
Other assets - -
12,522 10,193
Liabilities
Bank overdraft - -
Payable for investment units purchased - -
Payable for management fees (Inc. all GST) - -
Other liabilities 80 23
80 23
Net assets 12,442 10,170
Statements of Net Assets (audited)As at December 31
2009 ($000’s)
2008($000’s)
Net assets, beginning of year 10,170 17,753
Net Increase (decrease) in net assets
resulting from operations 2,637 (7,007)
Transactions with unitholders
Unitholders' contributions 347 386
Unitholders' withdrawals (712) (962)
Transfers (to) from other funds - -
Net increase (decrease) from
unitholders' transactions (365) (576)
Net assets, end of year 12,442 10,170
Statements of Changes in Net Assets (audited)For the years ended December 31
2009 ($000’s)
2008($000’s)
Income
Distribution from underlying fund 156 152
Interest - 6
Management fee distribution received - -
156 158
Expenses
Management fees 62 91
Fund administration expenses - -
62 91
Net investment income (loss) 94 67
Realized and unrealized gain (loss) 2,543 (7,074)
Net increase (decrease) in net assets
resulting from operations 2,637 (7,007)
Statements of Operations (audited)For the years ended December 31
Financial Statements - Supplementary Schedules (audited)For the years ended December 31
Net asset value per unit ($)
(refer to Note 2d)Units issued and
outstanding
Management expense ratio (%)
(refer to Note 3b)
Class of units 2009 2008 2009 2008 2009 2008 2007 2006 2005
Class A units 61.85 48.72 202,420 209,234 0.57 0.55 0.56 0.58 0.58
See accompanying Notes to the Financial Statements.

22
MANUL IFE F INANC IAL SEGREGATED FUNDS
Maritime Life FLAC Equity Fund
No. of Shares Securities
Average Cost ($)
Fair Value ($)
No. of Shares Securities
Average Cost ($)
Fair Value ($)
20 Potash Corporation of Saskatchewan Inc. 2,510 2,282
368 Quadra Mining Ltd. 5,131 5,336
223 Silver Wheaton Corp. 2,311 3,521
150 Teck Cominco Limited, Class B 2,573 5,505
1,413 Yamana Gold Inc. 20,178 16,899
118,316 124,890
Merchandising 2.43%
418 Alimentation Couche-Tard Inc., Class B 7,915 8,674
53 Canadian Tire Corporation Limited 2,755 3,040
201 Rona Inc. 2,527 3,101
13,197 14,815
Oil & Gas 18.86%
319 Canadian Natural Resources Limited 23,485 24,139
711 Enbridge Inc. 29,938 34,519
430 EnCana Corp. 13,890 14,642
799 Nexen Inc. 20,344 20,087
40 Niko Resources Ltd. 2,578 3,929
58 Petrobank Energy & Resources Ltd. 2,279 2,960
235 Suncor Energy Inc. 8,439 8,721
157 Talisman Energy Inc. 3,192 3,069
80 TransCanada Corporation 2,818 2,892
106,963 114,958
Telecommunication Services 4.32%
610 BCE Inc. 19,008 17,660
111 Quebecor Inc., Class B 3,068 3,009
90 Rogers Communications Inc., Class B 3,024 2,930
80 TELUS Corporation 2,649 2,723
27,749 26,322
Transportation Services 3.10%
281 Canadian National Railway Company 14,256 16,059
50 Canadian Pacific Railways 2,580 2,835
16,836 18,894
Total Canadian Common Stock 97.37% 551,931 593,545
Transaction Costs (Note 2) (313)
Total Common Stock 97.37% 551,618 593,545
Cash & Other Investments 2.46% 14,995 14,994
Other Assets/(Liabilities) 0.17% 1,064 1,064
Total Net Assets 567,677 609,603
Statement of Investment Portfolio (audited)As at December 31, 2009
CANADIAN COMMON STOCK
Consumer Discretionary 7.74%
80 Dorel Industries 2,703 2,575
900 Emera Inc. 20,973 22,563
1,142 Sino-Forest Corporation 16,616 22,063
40,292 47,201
Energy 2.83%
430 Cenovus Energy Inc. 12,638 11,382
193 Pacific Rubiales Energy Corp. 2,490 2,972
193 Red Back Mining Inc. 1,485 2,872
16,613 17,226
Financial Services 26.27%
115 Bank of Montreal 5,516 6,416
186 Bank of Nova Scotia 8,425 9,149
43 Canadian Imperial Bank of Commerce 2,806 2,922
150 CI Financial Inc. 2,872 3,281
80 Home Capital Group Inc. 2,561 3,335
70 IGM Financial Inc. 2,649 2,956
50 Industrial Alliance Insurance and Financial Services Inc. 1,467 1,606
383 National Bank of Canada 18,606 23,041
1,000 Power Financial Corporation 29,117 30,990
1,006 Royal Bank of Canada 51,593 56,698
300 Toronto-Dominion Bank 18,131 19,782
143,743 160,176
Industrial Products 5.76%
590 Bombardier Inc., Class B 2,407 2,826
541 Magna International Inc., Class A SV 28,475 28,770
65 SNC-Lavalin Group Inc. 2,448 3,505
33,330 35,101
Information Technology 5.57%
320 Celestica Inc. 2,443 3,165
75 MacDonald Dettwiler & Associates Ltd. 2,134 3,194
389 Research in Motion Limited 30,315 27,603
34,892 33,962
Materials 20.49%
49 Agrium Inc. 2,994 3,171
245 Barrick Gold Corporation 7,936 10,143
356 Cameco Corporation 9,780 12,036
454 Cascades Inc. 3,310 4,059
203 Eldorado Gold Corporation 2,434 3,019
37 First Quantum Minerals Ltd. 1,573 2,969
375 FNX Mining Company Inc. 3,640 4,316
234 Gammon Gold Inc. 2,795 2,700
63 Goldcorp Inc. 2,469 2,603
193 Hudbay Minerals Inc. 2,783 2,609
1,438 IAMGold Corporation 25,716 23,713
43 Inmet Mining Corporation 1,489 2,733
244 Jaguar Mining Inc. 2,743 2,862
3,083 Lundin Mining Corp. 14,530 13,164
50 Pan American Silver Corporation 1,421 1,250

23
Concentration of Risk (audited)
Discussion of Financial Risk Management (audited)
Financial Instrument RiskThe Fund is classified as a Canadian Equity Fund investing in Canadian large-cap equities but may also hold Canadian T-Bills and other financial instruments to achieve the objective of capital growth. The Fund’s activities expose it to a variety of financial risks. Please refer to note 4 in the accompanying Notes to the Financial Statements for an explanation of the various risks.
Risk management is an integral part of the investment manager’s philosophy. Portfolios are diversified not only across sectors and specific securities, but also according to market and macroeconomic risk factors. The investment manager monitors specific risks and tests for portfolio sensitivity in different economic scenarios.
The investment manager uses quantitative research and techniques designed to enhance portfolio performance and operate within risk thresholds. As part of a formal risk review process, the chief investment officer and portfolio managers meet monthly to monitor risk factors.
Currency RiskPlease refer to note 4 for a definition of currency risk. As at December 31, 2009 and December 31, 2008, the Fund’s assets did not have a significant exposure to currency risk.
Interest Rate RiskPlease refer to note 4 for a definition of interest rate risk. Because the majority of the Fund’s financial assets and liabilities are non-interest bearing, the Fund is not subject to significant risk due to fluctuations in market interest rates.
Other Market RiskPlease refer to note 4 for a definition of other market risk. A dedicated risk management team monitors each security and the overall portfolio. The investment manager’s compliance department monitors the Fund for adherence to investment guidelines and restrictions. The Fund has investment restrictions that prohibit it from investing more than 10% of its assets in any one company.
Management’s best estimate of the effect on net assets due to an increase or decrease by 5% in Canadian equity prices, with all other variables held constant, is an increase or decrease in the Fund’s net assets, respectively by approximately $29,677 ($22,950 - 2008). In practice, the actual results may differ and the difference could be material.
Credit RiskPlease refer to note 4 for a definition of credit risk. As at December 31, 2009 and December 31, 2008, the Fund had no significant investments in debt instruments and/or derivatives.
Liquidity RiskPlease refer to note 4 for a definition of liquidity risk. As at December 31, 2009 and December 31, 2008, all of the Fund’s liabilities were current. Because the Fund is exposed to daily cash redemptions of redeemable units, the majority of its assets are in investments that are traded in an active market and can be readily disposed of.
Maritime Life FLAC Equity Fund
As at December 31, 2009 As at December 31, 2008
Securities Average Cost ($) Fair Value ($)Percentage
Ownership (%) Average Cost ($) Fair Value ($)Percentage
Ownership (%)
Total Canadian Common Stock 551,931 593,545 97.37 590,233 458,998 93.78
Total U.S. Common Stock - - - - - -
Total Global Equities - - - - - -
Transaction Costs (313) (206)
Total Short Term - - - - - -
Cash & Other Investments 14,995 14,994 2.46 29,319 29,319 5.99
Other Assets/(Liabilities) 1,064 1,064 0.17 1,111 1,111 0.23
Total Net Assets 567,677 609,603 100.00 620,457 489,428 100.00

24
MANUL IFE F INANC IAL SEGREGATED FUNDS
Fair Value Measurement (audited)
Fair Value of Financial InstrumentsThe table below categorizes the fair values of financial instruments into Level 1, 2 or 3 based on the inputs used to value the Funds’ investments. Please refer to note 2 (a) for a definition of the levels of classification.
Financial Assets at fair values as at December 31, 2009 ($000’s)
Quoted prices in active
markets for identical
assets (Level 1)
Significant other
observable inputs
(Level 2)
Significant unobservable
inputs (Level 3) Total
Equities 594 - - 594
Bonds - - - -
Short term - - - -
Derivatives - - - -
Total Financial Assets 594 - - 594
Level 3 ReconciliationAs there have been no Level 3 holdings in the Fund during the period, a reconciliation has not been provided.
Transfers Between Level 1 and 2During the period, there have been no significant transfers between Level 1 and 2.
Maritime Life FLAC Equity Fund
2009 ($000’s)
2008($000’s)
Assets
Investments, at fair value 594 459
Cash and short-term investments 15 29
Dividend receivable 1 1
Receivable from investment units sold - -
Management fee distribution receivable {Note 2(c)(iii)} - -
Other assets - -
610 489
Liabilities
Bank overdraft - -
Payable for investment units purchased - -
Payable for management fees (Inc. all GST) - -
Other liabilities - -
- -
Net assets 610 489
Statements of Net Assets (audited)As at December 31
2009 ($000’s)
2008($000’s)
Income
Dividends 13 13
Interest - 1
Revenue from securities lending {Note 2(f)} - -
Management fee distribution received - -
13 14
Expenses
Management fees - -
Fund administration expenses 3 4
Transaction costs (Note 2) 2 3
5 7
Net investment income (loss) 8 7
Realized and unrealized gain (loss) 118 (328)
Net increase (decrease) in net assets
resulting from operations 126 (321)
Statements of Operations (audited)For the years ended December 31
2009 ($000’s)
2008($000’s)
Net assets, beginning of year 489 896
Net Increase (decrease) in net assets
resulting from operations 126 (321)
Transactions with unitholders
Unitholders' contributions 4 4
Unitholders' withdrawals (9) (90)
Transfers (to) from other funds - -
Net increase (decrease) from
unitholders' transactions (5) (86)
Net assets, end of year 610 489
Statements of Changes in Net Assets (audited)For the years ended December 31

25
Maritime Life FLAC Equity Fund
Financial Statements - Supplementary Schedules (audited)For the years ended December 31Net asset value per unit, and management expense ratio are all presented in this table on a Trading Valuation Basis (refer to note 2(b))
Net asset value per unit ($)
(refer to Note 2d)Units issued and
outstanding
Management expense ratio (%)
(refer to Note 3b)
Fund Name 2009 2008 2009 2008 2009 2008 2007 2006 2005
Maritime Life FLAC Equity Fund 257.92 204.41 2,369 2,403 0.49 0.59 0.50 0.63 0.69
Reconciliation of Trading Net Asset Value and Trading Net Asset Value Per Units to GAAP Valuation Basis (audited)
December 31, 2009 December 31, 2008
Trading Valuation Basis ($)
Valuation Impacts ($)
GAAP Valuation Basis ($)
Trading Valuation Basis ($)
Valuation Impacts ($)
GAAP Valuation Basis ($)
Fund NameNet Asset
ValueNet Asset
ValueNet Asset
ValueNet Asset
Value Per UnitNet Asset
ValueNet Asset
ValueNet Asset
ValueNet Asset
Value Per Unit
Maritime Life FLAC Equity Fund 610,967 (1,364) 609,603 257.34 491,098 (1,670) 489,428 203.71
See accompanying Notes to the Financial Statements.
CICA Handbook Section 3855 requires that bid prices be used to value investments held rather than the closing trade prices currently used for the purposes of determining Trading NAV. All investments funds are required to provide a reconciliation between the Trading NAV that is used to value client transactions, and the GAAP NAV that is required for financial reporting purposes (refer to note 2(b) for details).

26
MANUL IFE F INANC IAL SEGREGATED FUNDS
Maritime Life Separate Investment Fund
No. of Shares Securities
Average Cost ($)
Fair Value ($)
No. of Shares Securities
Average Cost ($)
Fair Value ($)
Telecommunication Services 8.73%
800 Astral Media Inc., Class A NV 31,859 26,528
1,245 BCE Inc. 39,804 36,043
1,000 Quebecor Inc., Class B 17,855 27,110
1,400 Rogers Communications Inc., Class B 54,357 45,584
1,100 TELUS Corporation 60,130 37,444
3,800 Yellow Pages Income Fund 20,450 20,368
224,455 193,077
Transportation Services 3.14%
820 Canadian National Railway Company 27,551 46,863
400 Canadian Pacific Railways 18,645 22,680
46,196 69,543
Utilities 2.23%
900 Fortis Inc. 21,871 25,812
962 Keyera Facilities Income Fund 15,605 23,420
37,476 49,232
Total Canadian Common Stock 96.71% 1,646,536 2,138,732
GLOBAL EQUITIES
Great Britain 1.24%
3,900 Trinidad Drilling Ltd. 20,202 27,339
Total Global Equities 1.24% 20,202 27,339
Transaction Costs (Note 2) (2,151)
Total Common Stock 97.95% 1,664,587 2,166,071
Cash & Other Investments 1.92% 42,418 42,414
Other Assets/(Liabilities) 0.13% 2,968 2,968
Total Net Assets 1,709,973 2,211,453
Statement of Investment Portfolio (audited)As at December 31, 2009
CANADIAN COMMON STOCK
Consumer Discretionary 3.31%
700 Metro Inc., Class A 25,030 27,440
1,350 Thomson Reuters Corporation 55,967 45,765
80,997 73,205
Energy 4.53%
1,625 Cenovus Energy Inc. 25,562 43,014
600 Crescent Point Energy Corp. 14,223 23,670
2,332 Just Energy Income Fund 17,997 33,581
57,782 100,265
Financial Services 31.85%
600 Bank of Montreal 18,979 33,474
1,875 Bank of Nova Scotia 46,148 92,231
997 Canadian Imperial Bank of Commerce 43,608 67,732
1,500 DundeeWealth Inc. 14,740 20,625
1,100 Great-West Lifeco Inc. 22,825 29,502
1,400 Industrial Alliance Insurance and Financial Services Inc. 29,101 44,968
600 Intact Financial Corporation 16,857 22,128
3,578 Manulife Financial Corporation 78,056 69,055
1,150 Power Financial Corporation 20,032 35,639
2,478 Royal Bank of Canada 73,043 139,647
900 Sun Life Financial Inc. 29,778 27,153
1,850 Toronto-Dominion Bank 77,944 121,989
471,111 704,143
Industrial Products 1.25%
1,000 Toromont Industries Ltd. 25,372 27,740
25,372 27,740
Materials 14.26%
1,200 Agrium Inc. 63,296 77,652
2,275 Barrick Gold Corporation 78,011 94,185
1,800 Goldcorp Inc. 60,217 74,358
750 Inmet Mining Corporation 32,337 47,670
1,800 Yamana Gold Inc. 13,059 21,528
246,920 315,393
Merchandising 4.33%
1,800 Alimentation Couche-Tard Inc., Class B 22,165 37,350
1,600 Reitmans Ltd. 31,790 26,656
700 Shoppers Drug Mart Corporation 34,453 31,773
88,408 95,779
Oil & Gas 23.08%
1,200 Altagas Income Trust 20,894 22,524
1,005 ARC Energy Trust 21,156 20,047
1,000 Canadian Natural Resources Limited 47,950 75,670
900 Enbridge Inc. 36,493 43,695
1,625 EnCana Corp. 28,094 55,331
1,200 Husky Energy Inc. 37,488 36,024
2,000 Nexen Inc. 61,771 50,280
3,466 Suncor Energy Inc. 67,673 128,623
2,175 Talisman Energy Inc. 21,017 42,521
1,100 Vermilion Energy 25,283 35,640
367,819 510,355

27
Concentration of Risk (audited)
Discussion of Financial Risk Management (audited)
Financial Instrument RiskThe Fund is classified as a Canadian Equity Fund investing in Canadian equities to achieve the objective of providing investors with capital growth and dividend income with an acceptable level of volatility. The Fund’s activities expose it to a variety of financial risks. Please refer to note 4 in the accompanying Notes to the Financial Statements for an explanation of the various risks.
Risk management begins with portfolio construction. The investment manager’s main concern is the absolute portfolio risk, seeking diversification by automatically reducing any investment that reaches 10% of the portfolio. Portfolios are monitored by the investment manager’s compliance team to ensure that investment policies are respected.
Currency RiskPlease refer to note 4 for a definition of currency risk. As at December 31, 2009 and December 31, 2008, the Fund’s assets did not have a significant exposure to currency risk.
Interest Rate RiskPlease refer to note 4 for a definition of interest rate risk. Because the majority of the Fund’s financial assets and liabilities are non-interest bearing, the Fund is not subject to significant risk due to fluctuations in market interest rates.
Other Market RiskPlease refer to note 4 for a definition of other market risk.
Management’s best estimate of the effect on net assets due to an increase or decrease by 5% in Canadian equity prices, with all other variables held constant, is an increase or decrease in the Fund’s net assets, respectively by approximately $106,937 ($83,435 - 2008). In practice, the actual results may differ and the difference could be material.
Credit RiskPlease refer to note 4 for a definition of credit risk. As at December 31, 2009 and December 31, 2008, the Fund had no significant investments in debt instruments and/or derivatives.
Liquidity RiskPlease refer to note 4 for a definition of liquidity risk. As at December 31, 2009 and December 31, 2008, all of the Fund’s liabilities were current. Because the Fund is exposed to daily cash redemptions of redeemable units, the majority of its assets are in investments that are traded in an active market and can be readily disposed of.
Maritime Life Separate Investment Fund
As at December 31, 2009 As at December 31, 2008
Securities Average Cost ($) Fair Value ($)Percentage
Ownership (%) Average Cost ($) Fair Value ($)Percentage
Ownership (%)
Total Canadian Common Stock 1,646,536 2,138,732 96.71 1,644,178 1,668,705 97.64
Total U.S. Common Stock - - - - - -
Total Global Equities 20,202 27,339 1.24 - - -
Transaction Costs (2,151) (2,074)
Total Short Term - - - - - -
Cash & Other Investments 42,418 42,414 1.92 24,142 24,142 1.41
Other Assets/(Liabilities) 2,968 2,968 0.13 16,334 16,334 0.95
Total Net Assets 1,709,973 2,211,453 100.00 1,682,580 1,709,181 100.00
Fair Value Measurement (audited)
Fair Value of Financial InstrumentsThe table below categorizes the fair values of financial instruments into Level 1, 2 or 3 based on the inputs used to value the Funds’ investments. Please refer to note 2 (a) for a definition of the levels of classification.
Financial Assets at fair values as at December 31, 2009 ($000’s)
Quoted prices in active
markets for identical
assets (Level 1)
Significant other
observable inputs
(Level 2)
Significant unobservable
inputs (Level 3) Total
Equities 2,166 - - 2,166
Bonds - - - -
Short term - - - -
Derivatives - - - -
Total Financial Assets 2,166 - - 2,166
Level 3 ReconciliationAs there have been no Level 3 holdings in the Fund during the period, a reconciliation has not been provided.
Transfers Between Level 1 and 2During the period, there have been no significant transfers between Level 1 and 2.

28
MANUL IFE F INANC IAL SEGREGATED FUNDS Maritime Life Separate Investment Fund
2009 ($000’s)
2008($000’s)
Assets
Investments, at fair value 2,166 1,669
Cash and short-term investments 42 24
Dividend receivable 6 5
Receivable from investment units sold - 18
Management fee distribution receivable {Note 2(c)(iii)} - -
Other assets - -
2,214 1,716
Liabilities
Bank overdraft - -
Payable for investment units purchased - 4
Payable for management fees (Inc. all GST) 3 3
Other liabilities - -
3 7
Net assets 2,211 1,709
Statements of Net Assets (audited)As at December 31
2009 ($000’s)
2008($000’s)
Income
Dividends 68 60
Interest - 1
Revenue from securities lending {Note 2(f)} - -
Management fee distribution received - -
68 61
Expenses
Management fees 36 46
Fund administration expenses - -
Transaction costs (Note 2) 2 4
38 50
Net investment income (loss) 30 11
Realized and unrealized gain (loss) 519 (973)
Net increase (decrease) in net assets
resulting from operations 549 (962)
Statements of Operations (audited)For the years ended December 31
2009 ($000’s)
2008($000’s)
Net assets, beginning of year 1,709 2,860
Net Increase (decrease) in net assets
resulting from operations 549 (962)
Transactions with unitholders
Unitholders' contributions 54 65
Unitholders' withdrawals (101) (254)
Transfers (to) from other funds - -
Net increase (decrease) from
unitholders' transactions (47) (189)
Net assets, end of year 2,211 1,709
Statements of Changes in Net Assets (audited)For the years ended December 31

29
Maritime Life Separate Investment Fund
Financial Statements - Supplementary Schedules (audited)For the years ended December 31Net asset value per unit, and management expense ratio are all presented in this table on a Trading Valuation Basis (refer to note 2(b))
Net asset value per unit ($)
(refer to Note 2d)Units issued and
outstanding
Management expense ratio (%)
(refer to Note 3b)
Class of units 2009 2008 2009 2008 2009 2008 2007 2006 2005
SEIO 145.12 109.46 14,434 14,750 1.89 1.89 1.91 - 1.91
SIVA 145.85 109.83 838 905 1.89 1.89 1.91 - 1.91
Reconciliation of Trading Net Asset Value and Trading Net Asset Value Per Units to GAAP Valuation Basis (audited)
December 31, 2009 December 31, 2008
Trading Valuation Basis ($)
Valuation Impacts ($)
GAAP Valuation Basis ($)
Trading Valuation Basis ($)
Valuation Impacts ($)
GAAP Valuation Basis ($)
Class of units
Net AssetValue
Net AssetValue
Net AssetValue
Net AssetValue Per Unit
Net AssetValue
Net AssetValue
Net AssetValue
Net AssetValue Per Unit
SEIO 2,094,722 (5,234) 2,089,488 144.76 1,614,616 (4,602) 1,610,014 109.15
SIVA 122,275 (310) 121,965 145.48 99,450 (283) 99,167 109.52
See accompanying Notes to the Financial Statements.
CICA Handbook Section 3855 requires that bid prices be used to value investments held rather than the closing trade prices currently used for the purposes of determining Trading NAV. All investments funds are required to provide a reconciliation between the Trading NAV that is used to value client transactions, and the GAAP NAV that is required for financial reporting purposes (refer to note 2(b) for details).

30
MANUL IFE F INANC IAL SEGREGATED FUNDS
Maritime Life Champion Growth Fund
No. of Shares Securities Coupon % Maturity
Average Cost ($)
Fair Value ($)
No. of Shares Securities Coupon % Maturity
Average Cost ($)
Fair Value ($)
7,019 Talisman Energy Inc. 106,657 137,221
2,855 TransCanada Corporation 94,372 103,208
984,102 1,152,855
Telecommunication Services 3.42%
2,889 BCE Inc. 92,337 83,637
2,738 Rogers Communications Inc., Class B 76,698 89,149
1,488 Shaw Communications Inc. 32,830 32,141
201,865 204,927
Transportation Services 3.70%
2,788 Canadian National Railway Company 116,666 159,334
1,105 Canadian Pacific Railways 50,670 62,654
167,336 221,988
Utilities 0.82%
742 Fortis Inc. 19,166 21,281
1,197 Transalta Corp. 26,941 28,070
46,107 49,351
Total Canadian Common Stock 70.76% 3,647,749 4,241,273
U.S. COMMON STOCK
316 3M Company 21,524 27,315
200 American Express Company 7,530 8,475
430 AmerisourceBergen Corporation 11,336 11,719
163 Apple Computers 26,491 35,948
1,050 Applied Materials Inc. 14,654 15,308
1,066 AT&T Inc. 30,867 31,273
1,400 Chesapeake Energy Corp. 37,393 37,891
648 Chevron Corporation 50,756 52,194
1,261 Cisco Systems 31,436 31,595
261 Colgate-Palmolive Company 18,653 22,435
256 Computer Science Corp. 12,963 15,414
700 ConocoPhillips 39,320 37,386
323 Constellation Energy Group Inc. 11,001 11,869
197 CVS Corporation 7,659 6,639
240 DeVry Inc. 13,651 14,252
419 Du Pont & Co. 14,955 14,761
1,000 Ford Motor Company 7,742 10,456
245 Freeport-McMoRan 13,428 20,588
504 GameStop Corp., Class A 14,270 11,573
1,757 General Electric Company 25,008 27,822
147 Goldman Sachs Group Inc. 23,165 25,936
57 Google Inc. 28,581 36,986
466 Hewlett-Packard Company 22,155 25,103
521 Honeywell International Inc. 19,497 21,364
400 Illinois Tool Works Inc. 21,100 20,086
953 Intel Corporation 18,215 20,337
250 International Business Machines Corp. 31,131 34,232
410 Johnson & Johnson 26,537 27,605
858 JPMorgan Chase & Co. 33,566 37,419
299 Kellogg Company 14,902 16,648
500 Masco Corporation 7,599 7,227
Statement of Investment Portfolio (audited)As at December 31, 2009
CANADIAN COMMON STOCK
Consumer Discretionary 2.27%
2,568 Saputo Inc. 54,347 78,966
1,684 Thomson Reuters Corporation 67,356 57,088
121,703 136,054
Energy 1.01%
2,276 Cenovus Energy Inc. 53,030 60,246
53,030 60,246
Financial Services 19.09%
2,943 Bank of Montreal 150,299 164,190
3,188 Brookfield Asset Management Inc., Class A 78,425 74,408
1,810 Canadian Imperial Bank of Commerce 118,977 122,990
1,269 Intact Financial Corporation 37,531 46,801
450 National Bank of Canada 26,024 27,072
4,021 Power Corporation of Canada 117,261 117,092
5,481 Royal Bank of Canada 233,669 308,909
4,289 Toronto-Dominion Bank 238,116 282,817
1,000,302 1,144,279
Industrial Products 2.72%
8,017 Bombardier Inc., Class B 37,036 38,401
900 Magna International Inc., Class A SV 41,458 47,862
1,424 SNC-Lavalin Group Inc. 53,531 76,782
132,025 163,045
Information Technology 2.62%
2,210 Research in Motion Limited 137,912 156,822
137,912 156,822
Materials 14.41%
1,626 Agnico-Eagle Mines Ltd. 92,835 92,341
865 Agrium Inc. 45,006 55,974
4,662 Barrick Gold Corporation 164,353 193,007
1,797 Cameco Corporation 50,541 60,757
2,708 Goldcorp Inc. 94,319 111,867
463 Inmet Mining Corporation 23,921 29,428
1,396 Potash Corporation of Saskatchewan Inc. 120,927 159,298
4,385 Teck Cominco Limited, Class B 127,877 160,930
719,779 863,602
Merchandising 1.47%
410 Canadian Tire Corporation Limited 22,114 23,514
1,423 Shoppers Drug Mart Corporation 61,474 64,590
83,588 88,104
Oil & Gas 19.23%
1,478 Bonavista Energy Trust 28,332 32,915
2,149 Canadian Natural Resources Limited 115,497 162,615
2,975 Canadian Oil Sands Trust 91,141 88,625
1,558 Enbridge Inc. 57,703 75,641
3,616 EnCana Corp. 93,166 123,125
1,778 Husky Energy Inc. 51,786 53,376
511 Imperial Oil Limited 19,153 20,752
1,896 Nexen Inc. 54,646 47,665
1,306 Petrobank Energy & Resources Ltd. 57,376 66,645
6,496 Suncor Energy Inc. 214,273 241,067

31
No. of Shares Securities Coupon % Maturity
Average Cost ($)
Fair Value ($)
Statement of Investment Portfolio (audited) (continued)
As at December 31, 2009
349 McDonald's Corp. 22,014 22,793
170 McKesson Corporation 10,898 11,120
520 Medtronic Inc. 23,720 23,925
798 Merck & Co. 28,918 30,484
1,321 Microsoft Corporation 35,508 42,141
264 Northrop Grumman Corporation 15,239 15,418
527 Occidental Petroleum Corporation 43,541 44,825
995 Oracle Corp. 23,913 25,555
2,026 Pfizer Inc. 36,390 38,570
290 PNC Financial Services Group Inc. 15,550 16,023
59 priceline.com Incorporated 7,639 13,467
496 Procter & Gamble Company 30,287 31,458
285 Prudential Financial Inc. 15,460 14,843
170 Schlumberger Limited 10,737 11,581
307 Sempra Energy 15,531 17,987
234 Simon Property Group Inc. 18,098 19,543
526 Standard & Poor's Depository Receipts 58,828 61,349
255 Terdata Corporation 6,357 8,378
214 The Chubb Corp. 11,437 11,015
514 The Coca-Cola Company 28,674 30,647
513 The DIRECTV Group Inc., Class A 14,962 17,901
522 The Hartford Financial Services Group 15,115 12,708
380 The TJX Companies Inc. 14,938 14,536
368 The Travelers Companies Inc. 18,864 19,200
494 Time Warner Inc. 14,184 15,051
460 United Technologies Corporation 31,242 33,383
520 UnitedHealth Group Inc. 16,471 16,583
518 Verizon Communications 17,322 17,961
548 Walgreen Company 19,108 21,037
402 Wal-Mart Stores Inc. 22,174 22,480
640 Walt Disney Co. 18,655 21,602
530 WellPoint Inc. 32,000 32,295
1,059 Wells Fargo & Company 27,166 29,859
830 Xcel Energy Inc. 18,843 18,433
Total U.S. Common Stock 25.06% 1,396,868 1,502,007
Transaction Costs (Note 2) (3,895)
Total Common Stock 95.82% 5,040,722 5,743,280
SHORT TERM
Treasury Bills 3.75%
70,000 Canada 0.21% Feb-2010 69,963 69,986
105,000 Canada 0.20% Feb-2010 104,948 104,971
50,000 Canada 0.19% Mar-2010 49,978 49,984
Total Short Term 3.75% 224,889 224,941
Cash & Other Investments 0.50% 30,189 30,182
Other Assets/(Liabilities) (0.07%) (4,021) (4,021)
Total Net Assets 5,291,779 5,994,382
Maritime Life Champion Growth Fund

32
MANUL IFE F INANC IAL SEGREGATED FUNDS
Concentration of Risk (audited)
Discussion of Financial Risk Management (audited)
Financial Instrument RiskThe Fund is classified as a combination of Canadian Equity Fund and U.S. Equity Fund investing in Canadian equities, U.S. equities and Canadian T-Bills to achieve the objective of capital growth. The Fund’s activities expose it to a variety of financial risks. Please refer to note 4 in the accompanying Notes to the Financial Statements for an explanation of the various risks.
Risk management is an integral part of the investment manager’s philosophy. The investment team meets regularly to review strategies and assess factors affecting the portfolio. The investment manager constantly reviews markets and the performance of individual sectors and holdings. Investment recommendations are reviewed by the investment manager’s investment committee before investment decisions are implemented.
Currency RiskPlease refer to note 4 for a definition of currency risk.
The table below indicates the currencies to which the Fund had significant exposure as at December 31, 2009 and December 31, 2008. Amounts shown are based on the fair value of monetary and non-monetary assets (including derivatives and the underlying principal (notional) amount of forward currency contracts, if any). The financial instruments may be denominated in a currency other than its country of residence as listed in the Statement of Investment Portfolio.
December 31, 2009 December 31, 2008
CurrencyTotal
Exposure ($)Percentage of Net Assets (%)
Total Exposure ($)
Percentage of Net Assets (%)
USD 1,505,303 25.11 1,469,424 28.68
Management’s best estimate of the effect on net assets due to an increase or decrease by 5% in the value of the Canadian dollar, with all other variables held constant, is a decrease or increase in the Fund’s net assets, respectively by approximately $75,265 ($73,471 - 2008). In practice, the actual results may differ and the difference could be material.
Interest Rate RiskPlease refer to note 4 for a definition of interest rate risk. Because the majority of the Fund’s financial assets and liabilities are non-interest bearing, the Fund is not subject to significant risk due to fluctuations in market interest rates.
Other Market RiskPlease refer to note 4 for a definition of other market risk. In order to manage market price risk, a risk factor is developed and applied to each security, based on qualitative and quantitative assessments. These risk factors include, but are not limited to earnings variability, earnings dispersion, management risk, financial risk, industry/business risk, valuation risk and growth risk. From these
Maritime Life Champion Growth Fund
As at December 31, 2009 As at December 31, 2008
Securities Average Cost ($) Fair Value ($)Percentage
Ownership (%) Average Cost ($) Fair Value ($)Percentage
Ownership (%)
Total Canadian Common Stock 3,647,749 4,241,273 70.76 3,696,349 3,315,478 64.71
Total U.S. Common Stock 1,396,868 1,502,007 25.06 1,574,049 1,465,644 28.61
Total Global Equities - - - - - -
Transaction Costs (3,895) (3,675)
Total Short Term 224,889 224,941 3.75 318,785 319,387 6.23
Cash & Other Investments 30,189 30,182 0.50 23,584 23,584 0.46
Other Assets/(Liabilities) (4,021) (4,021) (0.07) (675) (675) (0.01)
Total Net Assets 5,291,779 5,994,382 100.00 5,608,417 5,123,418 100.00
inputs, each company is ranked in terms of risk. The investment manager’s portfolio manager, institutional service team and compliance team all have a responsibility to ensure that market positions adhere to the investment goals of the client. The Fund has investment restrictions that prohibit it from investing more than 10% of its assets in any one company.
Management’s best estimate of the effect on net assets due to an increase or decrease by 5% in Canadian equity prices, with all other variables held constant, is an increase or decrease in the Fund’s net assets, respectively by approximately $212,064 ($165,774 - 2008). In practice, the actual results may differ and the difference could be material.
Management’s best estimate of the effect on net assets due to an increase or decrease by 5% in U.S. equity prices, with all other variables held constant, is an increase or decrease in the Fund’s net assets, respectively by approximately $75,100 ($73,282 - 2008). In practice, the actual results may differ and the difference could be material.
Credit RiskPlease refer to note 4 for a definition of credit risk. As at December 31, 2009 and December 31, 2008, the Fund had no significant investments in debt instruments and/or derivatives.
Liquidity RiskPlease refer to note 4 for a definition of liquidity risk. As at December 31, 2009 and December 31, 2008, all of the Fund’s liabilities were current. Because the Fund is exposed to daily cash redemptions of redeemable units, the majority of its assets are in investments that are traded in an active market and can be readily disposed of.

33
Maritime Life Champion Growth Fund
2009 ($000’s)
2008($000’s)
Assets
Investments, at fair value 5,743 4,781
Cash and short-term investments 255 343
Dividend/Interest receivable 9 11
Receivable from investment units sold - -
Management fee distribution receivable {Note 2(c)(iii)} - -
Other assets - -
6,007 5,135
Liabilities
Bank overdraft - -
Payable for investment units purchased - -
Payable for management fees (Inc. all GST) 13 12
Other liabilities - -
13 12
Net assets 5,994 5,123
Statements of Net Assets (audited)As at December 31
2009 ($000’s)
2008($000’s)
Income
Dividends 125 140
Interest 2 13
Revenue from securities lending {Note 2(f)} - -
Management fee distribution received - -
127 153
Expenses
Management fees 143 173
Fund administration expenses - -
Transaction costs (Note 2) 18 10
161 183
Net investment income (loss) (34) (30)
Realized and unrealized gain (loss) 907 (2,043)
Net increase (decrease) in net assets
resulting from operations 873 (2,073)
Statements of Operations (audited)For the years ended December 31
2009 ($000’s)
2008($000’s)
Net assets, beginning of year 5,123 7,278
Net Increase (decrease) in net assets
resulting from operations 873 (2,073)
Transactions with unitholders
Unitholders' contributions 851 889
Unitholders' withdrawals (853) (971)
Transfers (to) from other funds - -
Net increase (decrease) from
unitholders' transactions (2) (82)
Net assets, end of year 5,994 5,123
Statements of Changes in Net Assets (audited)For the years ended December 31
Fair Value Measurement (audited)
Fair Value of Financial InstrumentsThe table below categorizes the fair values of financial instruments into Level 1, 2 or 3 based on the inputs used to value the Funds’ investments. Please refer to note 2 (a) for a definition of the levels of classification.
Financial Assets at fair values as at December 31, 2009 ($000’s)
Quoted prices in active
markets for identical
assets (Level 1)
Significant other
observable inputs
(Level 2)
Significant unobservable
inputs (Level 3) Total
Equities 5,743 - - 5,743
Bonds - - - -
Short term - 225 - 225
Derivatives - - - -
Total Financial Assets 5,743 225 - 5,968
Level 3 ReconciliationAs there have been no Level 3 holdings in the Fund during the period, a reconciliation has not been provided.
Transfers Between Level 1 and 2During the period, there have been no significant transfers between Level 1 and 2.

34
MANUL IFE F INANC IAL SEGREGATED FUNDS Maritime Life Champion Growth Fund
Financial Statements - Supplementary Schedules (audited)For the years ended December 31Net asset value per unit, and management expense ratio are all presented in this table on a Trading Valuation Basis (refer to note 2(b))
Net asset value per unit ($)
(refer to Note 2d)Units issued and
outstanding
Management expense ratio (%)
(refer to Note 3b)
Product 2009 2008 2009 2008 2009 2008 2007 2006 2005
Champion 26.79 22.90 224,146 224,106 2.63 2.63 2.71 - 2.68
Reconciliation of Trading Net Asset Value and Trading Net Asset Value Per Units to GAAP Valuation Basis (audited)
December 31, 2009 December 31, 2008
Trading Valuation Basis ($)
Valuation Impacts ($)
GAAP Valuation Basis ($)
Trading Valuation Basis ($)
Valuation Impacts ($)
GAAP Valuation Basis ($)
ProductNet Asset
ValueNet Asset
ValueNet Asset
ValueNet Asset
Value Per UnitNet Asset
ValueNet Asset
ValueNet Asset
ValueNet Asset
Value Per Unit
Champion 6,004,929 (10,547) 5,994,382 26.74 5,131,454 (8,036) 5,123,418 22.86
See accompanying Notes to the Financial Statements.
CICA Handbook Section 3855 requires that bid prices be used to value investments held rather than the closing trade prices currently used for the purposes of determining Trading NAV. All investments funds are required to provide a reconciliation between the Trading NAV that is used to value client transactions, and the GAAP NAV that is required for financial reporting purposes (refer to note 2(b) for details).

35
Notes to the Financial Statements1. THE FUNDS
Funds managed by Manulife Financial (the “Funds”) were established under the authority of and are governed by the Insurance Companies Act (Canada). The Funds are maintained in connection with certain life insurance contracts (the “Policies”). Each of the Funds represent money from policy owners that is invested solely in underlying mutual funds, unit trusts, pooled funds or other selected investments and are segregated from other assets of Manulife Financial (the “Company”). The benefits payable under the Policies related to the Funds vary depending on the market value of the assets in the Funds.
2. SUMMARy OF SIGNIFICANT ACCOUNTING POLICIES
These financial statements have been prepared in accordance with Canadian generally accepted accounting principles (“CGAAP”).
The preparation of financial statements in accordance with CGAAP requires management to make estimates and assumptions that affect the reported amounts of assets and liabilities as at the date of the financial statements and the amounts of income and expense during the reporting periods. Actual results could differ from those estimates.
a) adoption of accounting Policy changes
cIca Handbook sections 3862 and 3863
Effective January 1, 2008, the Company adopted CICA Section 3862, “Financial Instruments – Disclosures” and CICA Section 3863, “Financial Instruments – Presentation” for its financial reporting of the Funds. The new Sections 3862 and 3863 replace Section 3861 “Financial Instruments – Disclosure and Presentation”. Disclosure requirements are revised and enhanced, while presentation requirements remain essentially unchanged. The new disclosure requirements expand discussion around the significance of financial instruments for the Fund’s financial position and performance, the nature and extent of risks arising from financial instruments to which the Fund is exposed to and how the Fund manages those risks.
Manulife does not actively manage its fund of mutual funds and therefore the full quantitative and qualitative risk disclosures contemplated under Section 3862 have not been presented for the underlying funds. For these types of funds Manulife provides a global commentary that describes Manulife’s manager of managers program that helps ensure proper selection and monitoring of the underlying fund managers [note 5(a)].
During 2009, the Accounting Standards Board (“ACSB”) issued amendments to CICA Section 3862 to incorporate changes to improve disclosures about fair value and liquidity risk. The amendments introduce a “fair value hierarchy” for disclosures to provide information about the relative reliability of inputs used in making the fair value measurements.
Section 3862.27A requires that an entity classify each financial instrument into one of three fair value levels as follows:
Level 1 – for unadjusted quoted prices in active markets for identical assets or liabilities.
Level 2 – for inputs, other than quoted prices included in Level 1, that are observable for the asset or liability, either directly (i.e. as prices) or indirectly (i.e. derived from prices) and,
Level 3 – for inputs that are based on unobservable market data.
Section 3862.27A was adopted by the Company during 2009 and is disclosed in the “Fair Value Measurement” section of actively managed portfolio funds. Prior year comparative data is not required to be presented for the first year of adoption. This amendment will result in additional disclosures. However there is no impact on actual fair value measurement or net asset value.
EIc-173 credit risk and the Fair Value of Financial assets and Financial Liabilities
Effective January 20, 2009, the Company adopted EIC-173 “Credit Risk and the Fair Value of Financial Assets and Financial Liabilities”. EIC-173 requires that an entity’s own credit risk and the credit risk of the counterparty be taken into account in determining the fair value of financial assets and financial liabilities, including derivative instruments.
The Company has assessed its own credit risk and the credit risk of the counterparty when determining the fair values of the Funds’ financial assets and financial liabilities and has found the impact to the Funds to be immaterial.
For the periods ended December 31, 2009 and 2008
36
MANUL IFE F INANC IAL SEGREGATED FUNDS
b) Valuation of investments
(i) underlying Funds
The Funds’ assets are carried at the quoted market value, established by the net asset value per unit of the underlying funds held. The Fair value classification required under Section 3862.27A for underlying Fund units will generally be Level 1, unless otherwise noted in the Fund’s statement of investment portfolio.
(ii) Investments in Portfolio Funds
Investments are deemed to be categorized as held for trading in accordance with CICA Section 3855, “Financial Instruments – Recognition and Measurement”, and therefore, are recorded at fair value. Investments in securities are valued at their closing bid price based on major securities exchange listings. The current value of securities not traded on major exchanges may be estimated using valuation techniques based on assumptions that are not supported by observable market prices or rates. Assumptions used in these techniques may include the cost paid for the security, recent news reports about the issuer and general market indicators. Their fair value is determined using a valuation model that has been tested against the prices of actual market transactions and using the manager’s best estimate of the most appropriate model inputs. These are adjusted to reflect a spread for bid and ask prices to reflect costs to close out positions, counterparty credit spread and limitations in the models.
Prior to the adoption of CICA Section 3855, segregated funds accounted for investments at fair value using the closing or last trade price. However, under Section 3855, segregated funds are required to account for investments using closing bid prices, where available. CLHIA guidelines require the use of CGAAP for financial reporting, but the CLHIA has provided an exemption to use the closing price for the issuance and redemption of units (Trading NAV) as long as a reconciliation between Trading NAV and GAAP NAV is disclosed in the financial statements. The Company is providing a reconciliation of the Trading NAV and the GAAP NAV in each of the relevant Fund financial statements.
Short-term investments are valued at their bid quotations received from recognized investment dealers for financial reporting purposes.
Bonds are valued at their fair value based on the bid price from available public quotations from recognized dealers.
Derivative instruments are valued at fair value. Futures and forward contracts are valued at the gain/loss that would be realized if the position were to be closed at the reporting date. When the forward contracts are closed out or expire, realized gains or losses on forward contracts are recognized and are included in the Statements of Operations.
c) Investment transactions and income
Purchase and sale of investments
Transactions relating to the purchase and sale of an investment are accounted for on the trade date for direct investments and the day following the date the order to buy or sell is executed for underlying funds. Realized gains and losses from the sale of investments and unrealized appreciation or depreciation of investments are calculated on an average cost basis.
Investment income is recorded as follows:
(i) Distributions – Dividends, interest and capital gains from underlying funds are recorded on the distribution date.
(ii) Interest/Dividends – Interest/dividends from direct investments are recorded on an accrual basis.
(iii) Management fee distribution received – Management fee distributions are amounts received from the Company and the underlying fund manager for rebates to offset the management expense ratio embedded in the cost of units purchased in the underlying fund. Management fee distributions are calculated and accrued on a daily basis. There is no increase in the net management expense ratios charged to the unitholder as a result of the management fee distribution received.
(iv) Realized and unrealized gain (loss) – The market value of units of the underlying funds owned by the Funds will fluctuate during the period based on the performance of the assets of the underlying funds. Realized gains (losses) on investments are calculated using the average cost of the related investments. The unrealized gain (loss) of the units held in the underlying funds is recorded as the difference between the opening and closing market value of the units taking into account the change in the number of units owned throughout the period as a result of unitholder transactions.
37
(v) Foreign exchange – The reporting currency of all Funds are expressed in Canadian dollars. Foreign currency amounts are expressed in Canadian dollars as follows:
1) Market value of investments, other assets and liabilities at the rate of exchange existing at the end of the period.
2) Purchases and sales of investments, income and expenses at the rate of exchange existing on the respective dates of such transactions.
3) Realized and unrealized gains and losses from the translation of foreign currencies are considered to be investment transactions.
(vi) Transaction costs – Commissions paid to agents, advisors, brokers and dealers relating to the acquisition, issue or disposal of a direct investment are included in transaction costs, reported on the Statements of Operations.
d) calculation of unit values
Unit values are calculated daily before taking into consideration unitholders’ transactions and payments made on that day. These unitholders’ transactions are then reflected using that day’s new unit value. Separate unit values are calculated on a daily basis for each class of units of each Fund. The net asset value of each class will be the sum of that class’ proportionate share of the Fund’s investment portfolio market value on a trade basis. A class’ proportionate share of the Fund’s investment portfolio market value will generally be determined by comparing that class’ net asset value to the aggregate net asset value of the Fund as of close of business on the previous day. That amount will be adjusted further for the day’s applicable unitholder transactions.
e) Income taxes
The Funds are deemed to be inter-vivos trusts under the provisions of the Income Tax Act (Canada) and, accordingly, are not subject to tax on their net income, including net realized capital gains and losses for the calendar year, which are allocated to the beneficiary as at the end of the calendar year.
f) securities Lending
Certain Funds lend portfolio securities from time to time in order to earn additional revenue. These transactions involve the temporary exchange of securities for collateral with a commitment to deliver the same securities on a future date. The loaned assets of any Fund do not exceed 50% of the market value of the assets of that Fund, with a minimum collateral of 105% maintained on the loaned securities. The market value of the loaned securities is determined on the close of any valuation date. The securities on loan continue to be displayed in the Statements of Investment Portfolios and reported in the Statements of Net Assets. The income earned from securities lending was recorded as “Revenue from securities lending” on the Statements of Operations.
g) Other assets and liabilities
Other financial assets and financial liabilities are recorded at their fair value.
3. MANAGEMENT FEES AND ExPENSES
Each Fund is responsible for the payment of fees and expenses relating to its operations. Such fees and expenses include management fees and other recoverable Fund operating expenses paid by the Fund, including interest expenses on overdraft incurred within the Funds. Collectively, all the fees and expenses paid or payable by the Fund, including management fees and other recoverable Fund operating expenses (including Goods and Services Taxes, (“GST”)) divided by the Fund’s average assets on a trade basis, is known as the Management Expense Ratio (“MER”).
a) Management Fees
Management fees are calculated and accrued on a daily basis and are reimbursed monthly to the Company at a rate of 1/12th of an annual percentage of the net asset value of the Funds during the month. The management fees vary from Fund to Fund.
b) Management Expense ratio
The MER of the Funds represents the aggregate management fees and other expenses for the period expressed as an annual percentage of the average daily net assets of each Fund during the period.

38
MANUL IFE F INANC IAL SEGREGATED FUNDS
c) Waived Expenses
The MER is calculated as a fixed percentage of the average daily net assets of each Fund as calculated on a trade basis. Manulife has undertaken to waive/absorb all expenditures related to each Fund in the ordinary course of business, in excess of the contracted MER. For the current year, no expenses for Funds have been waived or absorbed by Manulife.
4. FINANCIAL INSTRUMENT RISK
risks
The Funds may be exposed to a variety of financial risks. Each of the Fund’s exposures to financial risks are concentrated in its investment holdings, including derivative instruments. The Statement of Investment Portfolio groups securities by asset type, geographic region and/or market segment. Each of the Fund’s risk management practice includes the monitoring of compliance to investment guidelines. The Manager manages the potential effects of these financial risks on the Fund’s performance by employing and overseeing professional and experienced portfolio advisors that regularly monitor the Fund’s positions, market events and diversify investment portfolios within the constraints of the investment guidelines.
currency risk
Currency risk is also called exchange rate risk. It is the risk that the value of a financial instrument, including cash and cash equivalents, that is denominated in a currency other than Canadian dollars, will fluctuate due to changes in the foreign exchange rate. If a Fund invests in any financial instruments that are denominated in a currency other than Canadian dollars, the Fund may be exposed to currency risk.
Interest rate risk
Interest rate risk arises when a Fund invests in interest-bearing financial instruments such as a bond. The Fund is exposed to the risk that the value of such financial instruments will fluctuate due to changes in the prevailing levels of market interest rates. In general, as interest rates rise, the price of a fixed rate bond will fall, and vice versa.
Other market risk
Other market risk is the risk that the value of a financial instrument will fluctuate as a result of changes in market prices (other than those arising from interest rate risk or currency risk), whether caused by factors specific to an individual investment, its issuer, or other factors affecting all instruments traded in a market or market segment. All securities may present a risk of loss of capital.
credit risk
Credit risk is the uncertainty in a counterparty’s ability to meet its obligations or commitment, or the risk that the issuer will default. All fixed income securities are subject to credit risk. Credit risk is considered as part of the investment decision making process. The Funds only buy and sell investments through brokers which are considered to be approved counterparties, thus minimizing the risk of default during settlement.
For each Fund that is exposed to credit risk, a Portfolio by Credit Rating Category table is constructed as follows: The table relies on a hierarchy program to select the credit ratings from the preferred agencies depending on availability. Using bonds as an example, the program will first look at Standard and Poor’s (“S&P”) reports to identify a rating. If a rating is present, the program will take the S&P rating and insert it into the appropriate category. If the bond is not rated (“NR”) by S&P, the program will move on to Moody’s Investor Service, then Dominion Bond Rating Service, and lastly Canadian Bond Rating Service. If all four agencies provide a NR, this particular bond will be placed under the NR category.
Liquidity risk
Liquidity risk is the potential that an institution will be unable to meet its obligations as they come due because of an inability to liquidate assets. The Fund’s assets are comprised mainly of actively traded securities which can be readily sold. Each Fund may, from time to time, invest in securities that are not actively traded, and may be illiquid. If such non-actively traded securities are material in the Fund, they will be separately identified and disclosed in the Fund’s Statement of Investment Portfolio.

39
5. MANAGEMENT OF FINANCIAL RISKS
a) Investment Fund selection and Monitoring Process
A fund manager search is initiated when a new product is launched, an opportunity for product enhancement arises, or when there is a need to replace an existing manager. Manulife Financial has formalized the fund manager selection process for its investment portfolios. The first step in the process is to screen all potential fund managers, and select only those who meet Manulife Financial’s criteria for inclusion in the Company’s portfolio of Funds. Screening can and often does extend beyond Canadian firms. The screening criteria include qualitative as well as quantitative measures of performance. The selection team uses a weighting of 2/3 for qualitative factors and 1/3 for quantitative factors to recommend the best fund manager for the mandate under consideration.
Ongoing monthly and quarterly monitoring throughout the year includes monitoring any organizational or Fund changes announced by fund managers or news items that may affect organizational stability or Fund performance as well as analysis on the Fund’s rate of return to verify that it is appropriate compared to the underlying fund or Fund’s benchmark.
Included in the ongoing due diligence process, managers are required to verify that the Fund has adhered to the Company’s Statement of Investment Policies.
In addition to the monitoring described above, Fund portfolios are reviewed on a semi-annual basis to ensure that the existing platform continues to meet the current and future needs of Manulife’s Canadian Division. As a result of this review, product line-ups will typically be refreshed in June and December of each year. The termination of a fund manager relationship is determined on a case-by-case basis and this action will largely depend upon their response to a specific area of concern. The Company’s preference is to work with fund managers to address significant issues, minimize disruption to Manulife’s clients, and give fund managers a reasonable opportunity to make improvements. Manulife Financial is not compensated for this service in any manner by any of Manulife’s fund managers.
b) Management of the fund of funds
Manulife’s fund of funds are not subject to the same process as the asset allocation funds as they are not actively managed. Manulife has delegated the risk management to the underlying fund manager and does not receive a detailed level of risk management information from the underlying fund manager in the ordinary course of business nor would Manulife be able to validate such information. The description in Note 5a) also applies to the management of financial risks for fund of funds. The table in the Financial Instrument Risk of the Underlying Fund section for the Funds has been completed by each underlying fund manager. Each underlying fund manager has their own unique fund and corresponding risk management practices. Underlying fund managers’ views of applicable risks may vary within like fund classifications.
6. SIGNIFICANT OWNERSHIP IN UNDERLyING FUNDS
At December 31, 2009, each Fund listed held a 20% ownership or greater in the underlying funds:
Fund Underlying Fund
Assets of underlying funds ($000’s)
Percentage Ownership in underlying funds
Manulife Equity Fund Manulife Canadian Core Fund 260,100 40.2%
7. RELATED PARTy TRANSACTIONS
Certain Funds invest in underlying Manulife Financial mutual funds managed by Elliott & Page Limited. Elliott & Page Limited is a wholly owned subsidiary of the Company. All investment transactions with the corresponding underlying Elliott & Page managed mutual funds are at quoted market values.
Certain Funds invest in underlying Unit Trusts owned and managed by Manulife Financial. These Funds receive distributions, as disclosed in the Statement of Operations. The distributions represent net income based on the percentage ownership in the underlying Unit Trusts.
During the year, the Funds paid management fees to Manulife as disclosed in the Statements of Operations of each Fund, at an exchange amount as indicated in the annual information forms.

40
MANUL IFE F INANC IAL SEGREGATED FUNDS
8. SECURITIES LENDING TRANSACTIONS
See note 2f) for an explanation of securities lending. The outstanding value of the securities on loan and the collateral received by the Funds as at December 31, 2009 are as follows:
Funds Outstanding Loans Total Collateral
Maritime Life FLAC Equity Fund 104,745 106,843 Maritime Life Champion Growth Fund 337,219 347,052
9. CAPITAL MANAGEMENT
The Funds have no restrictions or specific capital requirements on the subscription and redemption of units. The Statements of Changes in Net Assets identify changes in capital during the period. The capital of the Fund is managed in accordance with the Fund’s investment objectives including managing liquidity in order to be able to meet redemptions as discussed in note 4 – Liquidity Risk.
10. COMPARATIVE FIGURES
The comparative financial statements have been reclassified from the statements previously presented to conform to the presentation of the current year financial statements. Class information has been provided for previous years in accordance with the groupings of class information that were utilized in that year.

Auditors’ ReportTo the Contract holders of Individual Variable Insurance Contracts relating to The Manufacturers Life Insurance company segregated Funds.
We have audited the statements of net assets and statements of investment portfolio as at December 31, 2009 and the statements of operations and changes in net assets for the period then ended for each of the Manufacturers Life Insurance Company Segregated Funds (the “Funds”) listed below:
Manulife Short-Term Securities Fund
Manulife Bond Fund
Manulife Diversified Investment Fund
Manulife Equity Fund
Equity Growth Fund
Monarch Growth Fund
Maritime Life FLAC Equity Fund
Maritime Life Separate Investment Fund
Maritime Life Champion Growth Fund
These financial statements are the responsibility of the Funds’ management. Our responsibility is to express an opinion on these financial statements based on our audits.
We conducted our audits in accordance with Canadian generally accepted auditing standards. Those standards require that we plan and perform an audit to obtain reasonable assurance whether the financial statements are free of material misstatement. An audit includes examining, on a test basis, evidence supporting the amounts and disclosures in the financial statements. An audit also includes assessing the accounting principles used and significant estimates made by management, as well as evaluating the overall financial statement presentation.
In our opinion, these financial statements present fairly, in all material respects, the financial position of each of the Funds as at December 31, 2009 and the results of their operations and the changes in their net assets for the period then ended in accordance with Canadian generally accepted accounting principles.
Kitchener, Canada, March 31, 2010.
Chartered Accountants Licensed Public Accountants


about Manulife Financial
Manulife Financial is a leading Canadian-based financial
services group serving millions of customers in 22 countries
and territories worldwide. Operating as Manulife Financial in
Canada and Asia, and primarily through John Hancock in the
United States, the Company offers clients a diverse range of
financial protection products and wealth management services
through its extensive network of employees, agents and
distribution partners. Funds under management by Manulife
Financial and its subsidiaries were Cdn$440 billion (US$420
billion) as at December 31, 2009.
Manulife Financial Corporation trades as ‘MFC’ on the TSX,
NYSE and PSE, and under ‘945’ on the SEHK. Manulife
Financial can be found on the Internet at www.manulife.com.
December 31, 2009