Embed Size (px)
Citation preview

Segmentation on remote
sensing images by using
Fusion-MRF model*
Tamás Szirányi
*with Maha Shadaydeh
11/24/2015
MTA SZTAKI / DEVA

1984
2000
2005
2007
11/24/2015 SZTAKI EEE 2

Analysis Tasks in RS Image repositories
•Classifying segments and detection of changes
in terrestrial areas are important and time-
consuming efforts for remote-sensing image
repositories.
•Some country areas are scanned frequently (e.g.
year-by-year) to spot relevant changes, and
several repositories contain multi-temporal
image samples for the same area in very
different quality and details.
11/24/2015 SZTAKI EEE 3

Fused segmentation of the different subclasses
11/24/2015 SZTAKI EEE 4

Outlines
Objective and Background
Multi-Layer Fusion MRF model for change
detection in remote sensing images.
Improved local similarity measure estimation
algorithm
Experimental Results on Wetland
Conclusion

Land Cover Monitoring: Detecting regions of changes
in remote sensing images that come from different
sensors or different lighting and weather conditions.
Development of Post Classification Comparison (PCC)
approach for Change Detection.
Multi-temporal images is first segmented into
various land-cover classes, like urban areas,
wetlands, forests, etc.
Changes are then obtained as regions with
different class labels in the different time layers.
Objective and Background

N Multimodal
Images (N>=2)
Fused layer
ClusteringFusion MRF
MRF segmentation on
each image separately
(color, texture, …)
Change Detection
(Post Classification
Comparison)
MRF segmentation
on Fused layers
Luminance
Local
Similarity
Luminance
Local
Similarity
Luminance
Local
Similarity
Class parameters
(mean, variance)
for initial training
Multi-Layer Fusion MRF Model1
1 Sziranyi & Shadaydeh, IEEE GSRS Letters, 2014
Proposed method:
•Color and texture features
•Cross-image featuring
•Multi-Layer Markovian adaptive fusion
•Single layer segmentation based on fusion
clusters
•Segmentation and detection of changes
Detecting details in rarely scanned remote sensing areas,
where trajectory analysis or direct comparison is not
applicable.
11/24/2015 SZTAKI EEE 8

Proposed steps:
•unsupervised or partly supervised clustering in
fusion mode,
•cross-image featuring,
•multilayer MRF fusion segmentation in the
mixed dimensionality;
•clusters of the single layers are trained by
clusters of the mixed results.
11/24/2015 SZTAKI EEE 9

Fused segmentation of the different subclasses
11/24/2015 SZTAKI EEE 10
More images
More information
More complex details
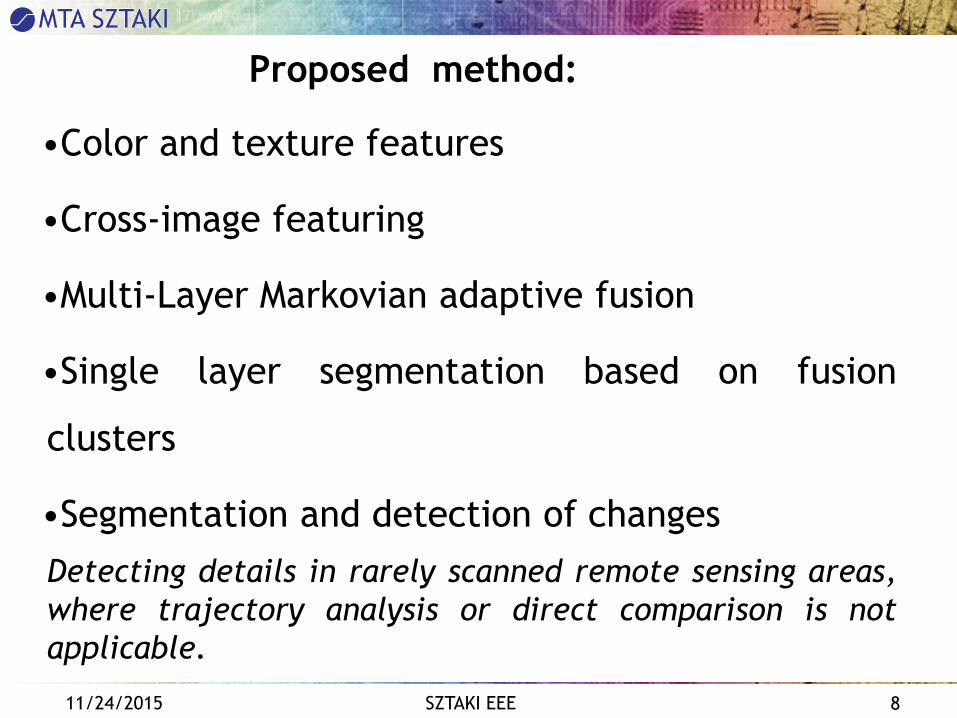
MRF models and segmentation levels:
- Single layer
single year – some supervision is needed
- Multiple layers (stack of years’ layers):
the source of supervision for single layer step
11/24/2015 SZTAKI EEE 11

Similarity Measures: cross-layer feature
•Change detection methods based on radiometry
measurement alone are not useful when dealing
with image time series data that comes from
different sensors such as optical and synthetic
aperture radar.
•In such case, similarity measures provide useful
tool for change detection and image time series
analysis.

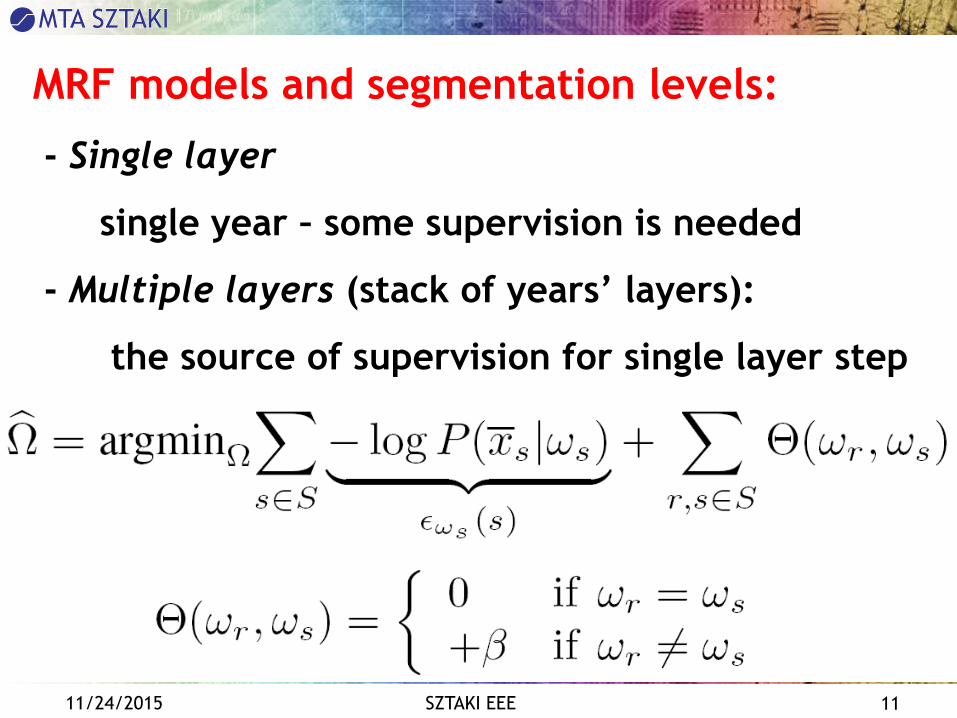
Cluster Reward Algorithm (CRA)
The denominator is a normalization term and the
numerator contains terms that are similar to other
similarity measures as distance to independence or mutual
information. The main advantage of the CRA is that the
joint histogram estimation noise has weak influence on the
CRA values, thus smaller estimation window can be used.
For two images I and J the CRA is defined as:

CRA Calculation
Marginal and joint histograms can be estimated from subsets
of the images. The window size can be varied according to
the required scale of change detection.
J
I
I(i,j)
DxD histogram
estimation window.
J(i,j)
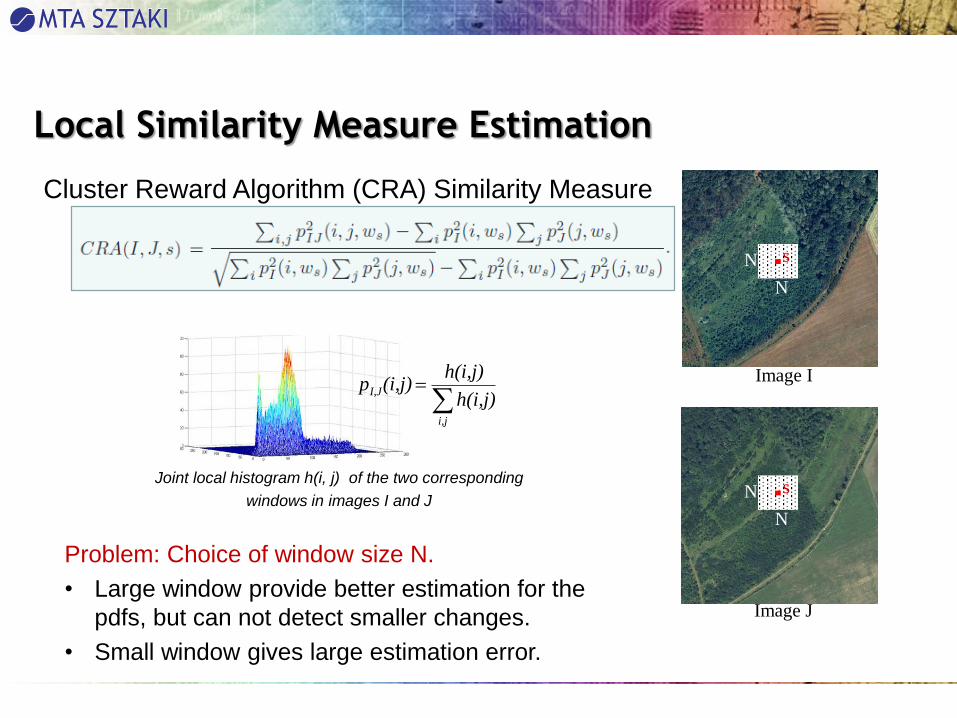
Local Similarity Measure Estimation
Image J
Image I
Problem: Choice of window size N.
• Large window provide better estimation for the
pdfs, but can not detect smaller changes.
• Small window gives large estimation error.
Cluster Reward Algorithm (CRA) Similarity Measure
Joint local histogram h(i, j) of the two corresponding
windows in images I and J
i,j
I,Jh(i,j)
h(i,j)(i,j)p
N
N
s
N
N
s

Cross-layer similarity measuresThe main idea in the proposed algorithm is to apply the multilayer fusion
MRF on CRA images calculated for each pair in a series of remote sensing
images.
I(t)
CRA t-1, t
I(t+1)
I(t-1)
CRA t, t+1
CRA t+1,t+2

Proposed Algorithm
1. Selecting and registering the image layers.
2. For each pair of the three consecutive images I(t -1); I(t);
I(t + 1), the CRA image is calculated using NxN estimation
window around each pixel; then normalized to have
values in the range [0; 1].
3. In the color space Luv, let xt(s) denotes the L color value
of pixel s in image I(t). Construct a combined feature
vector for pixels s in the three images I(t -1); I(t); and I(t
+ 1):
α is an adaptive positive weight.

4. Defining training areas. Evaluating the ( 𝑥𝑡(𝑠)) vectors
on the training areas, the statistical data (mean and
covariance) for the fusion based clusters are given;
Note that this step can be replaced with K-means
clustering for unsupervised segmentation.
5. Running MRF segmentation on the fused layer data
( 𝑥𝑡(𝑠))resulting in a multilayer labeling Ωt-1;t;t+1;
6. Single-layer training: the multilayer labeling Ωt-1;t;t+1 is
used as a preliminary training map for each image.
7. For each single layer a MRF segmentation is processed,
resulting in a labeling Ωt; In this step, the feature
vector of each pixel consists of its three Luv color
values only.
Proposed Algorithm (cont.)

Forest / Meadow changes: 2000 – 2005 - 2007
11/24/2015 SZTAKI EEE 19

Unsupervised segmentation and change detection
by using texture and color info
11/24/2015 SZTAKI EEE 20

Unsupervised segmentation and change detection
by using CRA cross-layer measure and color info
11/24/2015 SZTAKI EEE 21

Experiment results
We compare the performance of four methods:
1) single layer MRF optimization on Luv color values on
the separate layers (SL-MRF)
2) single layer MRF optimization on Luv color values on
the separate layers and CRA similarity measure values
among the layers (SL-MRF-CRA)
3) The proposed multilayer fusion MRF on Luv color values
only (ML-MRF)
4) The proposed multilayer fusion MRF on color values and
the CRA similarity measure values among layers (ML-
MRF-CRA).

Training areas used in the segmentation process
Meadow (M), Forest (F), Sand (S), and River (R) in
the Tiszadob area (by FÖMI)
11/24/2015 SZTAKI EEE 23

(2000) (2005) (2007)
Row (1): aerial photos around the Tiszadob oxbow area (Hungary, photos by FO¨MI) from the years
2000, 2005 and 2007. Training areas used in the segmentation process are shown in the upper
right image, Meadow (M), Forest (F), Sand (S), and River (R).
Ground-Truth result by a one
layer fusion with infrared image.
Method Misclassified
pixels’ rate
SL-MRF 19%
SL-MRF-CRA 20%
ML-MRF 21%
ML-MRF-CRA 10%
see oxbow section
on the right

Ground-Truth result by a one layer fusion with infrared image to find a
subclass (different water covers): Infrared image from the year 2007
(Left) and the segmentation results for 2007 (Right) using single layer
MRF on Luv color values - see the oxbow on the right
Experiment 1: Segmentation Results (cont.)
SL-MRF-CRA ML-MRF-CRAML-MRF
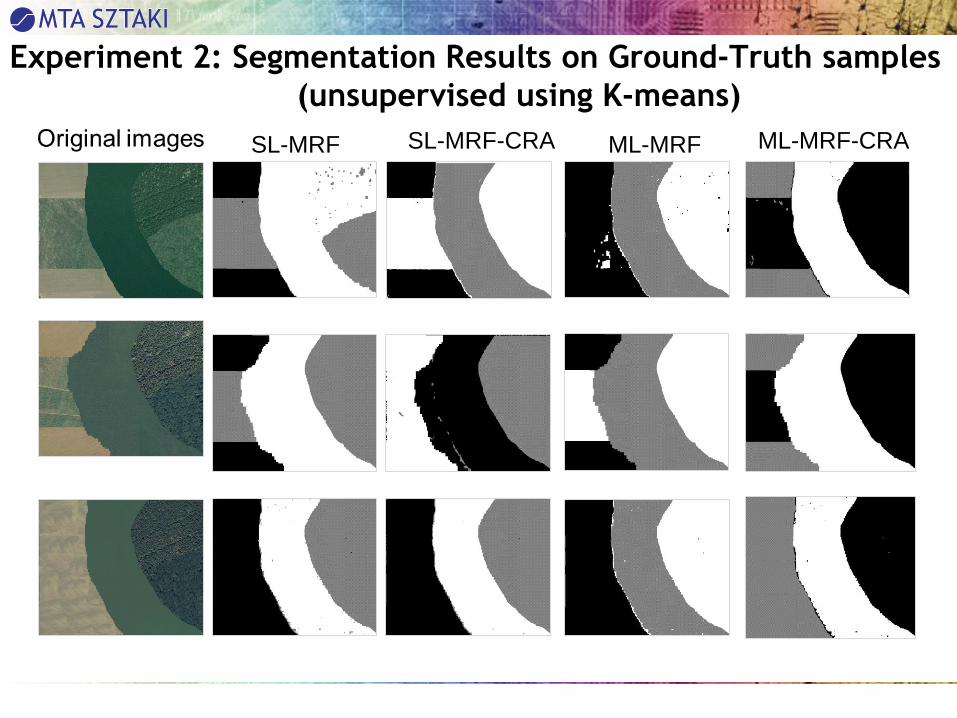
Experiment 2: Segmentation Results on Ground-Truth samples
(unsupervised using K-means)
SL-MRF

Ground Truth
Experiment 2: Change Detection Results on Ground-Truth
(unsupervised using K-means)
SL-MRF-CRA ML-MRF-CRAML-MRFSL-MRF
Circled areas denote misclassified regions.

Misclassified Pixels
11/24/2015 SZTAKI EEE 28

Measuring the correlation term more
effectively:
Registration process and Fusion term
SPIE 2015, Toulouse and Wetland WS in Seville, 2015
An Improved Mutual Information Similarity Measure forRegistration of Multi-Modal Remote Sensing Images

Image Registration
Key points based techniques: Minimize the distance between the corresponding features in the two images.
Area-based techniques: Quantify similarity measure.Intra-modal Images: Minimize the distance between the images intensity values using similarity measures such as mean square error or normalized cross-correlation.
Inter-modal Images: Minimize the distance between the images' intensity probability distributions.
o Normalized Mutual Information (NMI).
o Kullback-Leibler Distance.

Image Registration using MI
MI measures statistical dependency between two data-sets X and Y using their joint and marginal entropies
MI is maximum when the data-sets are geometrically aligned.
x,y
YXYX
y
YY
x
XX
(x,y)P(x,y)PH(X,Y)
(y)P(y)PH(Y)
(x)P(x)PH(X)
H(X,Y)H(Y)H(X)MI(X,Y)
,, log
log
log

The joint histogram h(x, y) of two images X and Y equals the number of times the intensity pair (x, y) occurs.
yx
yxyxh
yxhYXP
,
,),(
),(),(
y
YXx yxPXP ),()( , x
YXx yxPYP ),()( ,

• MI surface is highly non-convex (many local max.)
• Spatial information is lost in the global MI.
• Sensitivity to number of bins used in histogram estimation
• Sensitivity to overlap region.
Normalized Mutual Information (NMI)
Image Registration Using MI: Drawbacks
),(
)()(),(
YXH
YHXHYXNMI

The weight given to each pixel s in the reference image is
k positive constant.
g(s) normalized gradient image: use LoG filter
d(s) distance image: Euclidean distance from the closest key-point.
)k.d(s)/g(seω(s)
ω(s)
weight map, key-points marked in redReference Image
x
x
x
Weighted Joint Histogram

Registration by WJH-MI: Experimental Results-1
Szada, Hungary in 2007.1.5m/pixel.
Szada, Hungary in 1984, 1.5m/pixel.
Normalized gradient image calculated using LoG filter [s=1, N=7].
x
x
x
True transformation parameters: horizontal translation Th = 63 ; vertical translation Tv= 39;
rotation angle a = -4◦.
Search space: Th = 20 : 1 : 70 (pixels),
Tv= = 20 : 1 : 70 (pixels), a = -7 : 1 :-1 (degree).
Weight map

Vertical translation estimation error Horizontal translation estimation error

Rotation angle estimation error

Optimization using Gaussian pyramid (coarse to fine resolution).
Szada area, 2000.Szada area, 2007 Weight map
Registration by WJH-MI: Weight map

Registration by WJH-MI: Experimental Results
registered images
using WJH-NMI
registered images
using NMI

Registration by WJH-MI: Convergence surface
Contour plots of similarity measure convergence surface
using WJH-NMI.using NMI
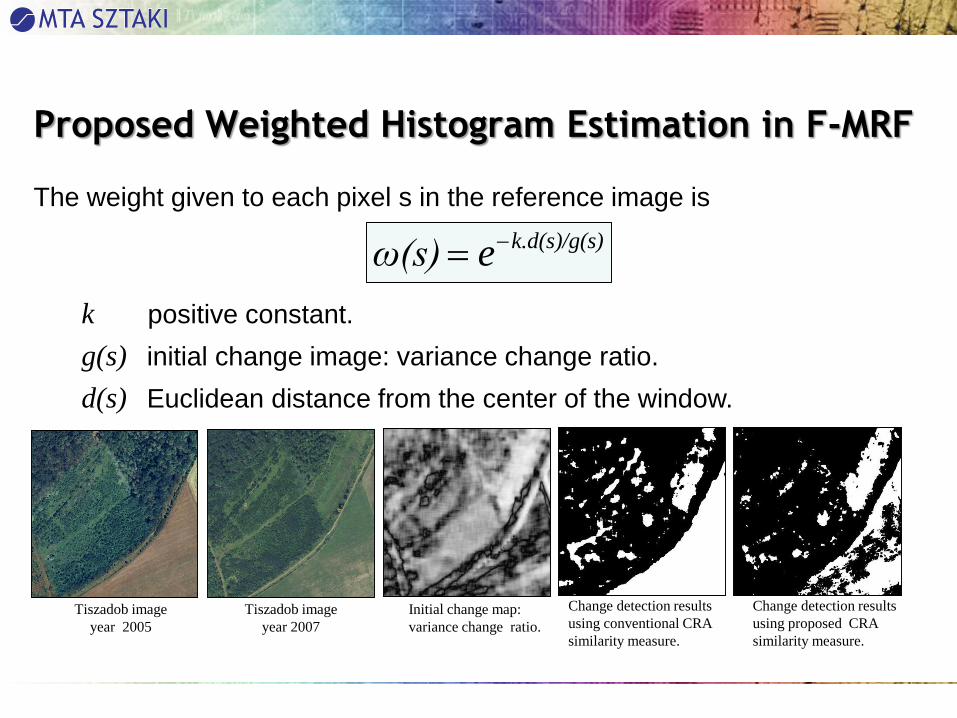
Proposed Weighted Histogram Estimation in F-MRF
The weight given to each pixel s in the reference image is
)k.d(s)/g(seω(s)
k positive constant.
g(s) initial change image: variance change ratio.
d(s) Euclidean distance from the center of the window.
Tiszadob image
year 2005
Tiszadob image
year 2007
Initial change map:
variance change ratio.
Change detection results
using proposed CRA
similarity measure.
Change detection results
using conventional CRA
similarity measure.

Exp. 2 – Monitoring Reed in Wetlands
Data set
Two Multi-Spectral (RGB and NIR)
Pleiades images of Keszthely area,
Hungary
Years: 2012, 2015.
Spatial resolution: 2 m/pixel
Method
• Unsupervised K-means clustering
• Classification using two layers fusion MRF on
NDVI values + NIR channel + Luminance component.
• Single Layer MRF on each single layer.
• Post Classification Comparison for Change Detection
Experimental Results for Wetlands

Keszthely (Aug. 2012)
Keszthely (June 2015)
Segmentation results (2012).
Misclassified pixels’ rate=7%
(compared to 2010 ground truth)
Segmentation results (2015)
Reed Ground Truth (2010)
(Courtesy of A. Zlinszky)
Deteriorated Reed
New Reed
Change detection results between
years 2012 and 2015.
Reed
Reed

Data set
Three Landsat RGB images of Parana river in Paraguay
Years: 1985, 1999, and 2010.
Dam construction starts in 1983.
Method
We apply the proposed multilayer fusion MRF on RGB values.
• Unsupervised K-means clustering
• Multi-layer FMRF on RGB values
• Single layer MRF segmentation for each layer on RGB values
• Post Classification Comparison for Change Detection
Exp. 3 – Monitor dam construction effect on river Parana
Experimental Results

original images segmented images Change maps
1985
1999
2010
1985-1999
1999-2010

• A multi-temporal fusion MRF model is introduced and used for
classification and change detection of wetlands in remote sensing
image series.
− MRF segmentation on the fused layer data resulting in a multi-layer
labeling.
− The multi-layer labeling is used as a training map for MRF
segmentation of each single layer.
− The consecutive image layers labeling are compared for change
detection.
• Different spectral, spatial, and statistical features can be used in the ML-
FMRF based on application. The use of cross-layer similarity for
example helps to better identify some classes where radiometric values
are dubious in Exp. 1., while the fusion of two layers NDVI index results
in considerable improvement in reed classification.
• Since the outcome classes of the multi-layer segmentation is later used
in the training of each single layer, similar classes are automatically
given similar labels in all layers. This helps to define type as well as
location of changes.
Conclusions

What is the change?
Returning to the basic question
Multilayer Markov Random Field models for change detection in
optical remote sensing images
by
Csaba Benedek, Maha Shadaydeh, Zoltan Kato, Tamás Szirányi,
Josiane Zerubia; in ISPRS JPRS, 2015
11/24/2015 SZTAKI EEE 47

11/24/2015 SZTAKI EEE 48
Structure of the CXM model and overview of the segmentation process.
Benedek&Sziranyi, IEEE TGRS, 2009

11/24/2015 SZTAKI EEE 49
Structure of the FMRF model and workflow of the implemented
Post-Classification Comparison process.


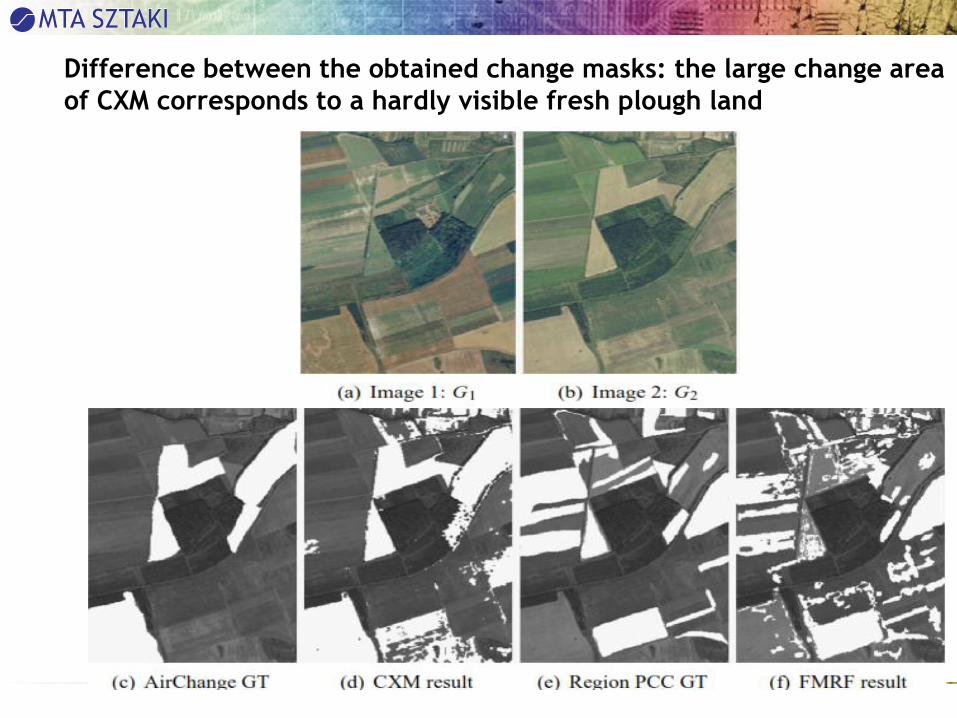
Difference between the obtained change masks: the large change area
of CXM corresponds to a hardly visible fresh plough land

11/24/2015 SZTAKI EEE 53

Orientation selective models
for aerial image segmentation
A. Manno-Kovacs and T. Sziranyi, "Orientation-selective building detection in aerial images", ISPRS Journal of Photogrammetry and Remote Sensing, vol. 108, pp. 94-112,2015.

Orientation sensitive building detection
•Extracting MHEC feature point set
•Contribution: Main orientation(s) of urban area:
• Histogram of φi values (main orientation for ith feature
point):
, where
• Correlating ϑ(φ) to bimodal Gaussian function(s) (peaks: θ,
θ+90)

Orientation sensitive building detection
•Feature points are classified with K-means
•Pixels are clustered with k-NN clustering (k=7)
•Enhance edges only in the given direction: MFC (Zingman, 2014)
•Fusion of feature points; connectivity information (color + edges)
and shadow blobs are merged for region based contour detection

Orientation sensitive building detection -
Results
Image data set:
• 230 buildings;
• VHR optical
satellite;
• 0.61 m/pixel.Vaihingen data set:
• 306 buildings;
•Aerial photos;
•0.09 m/pixel.
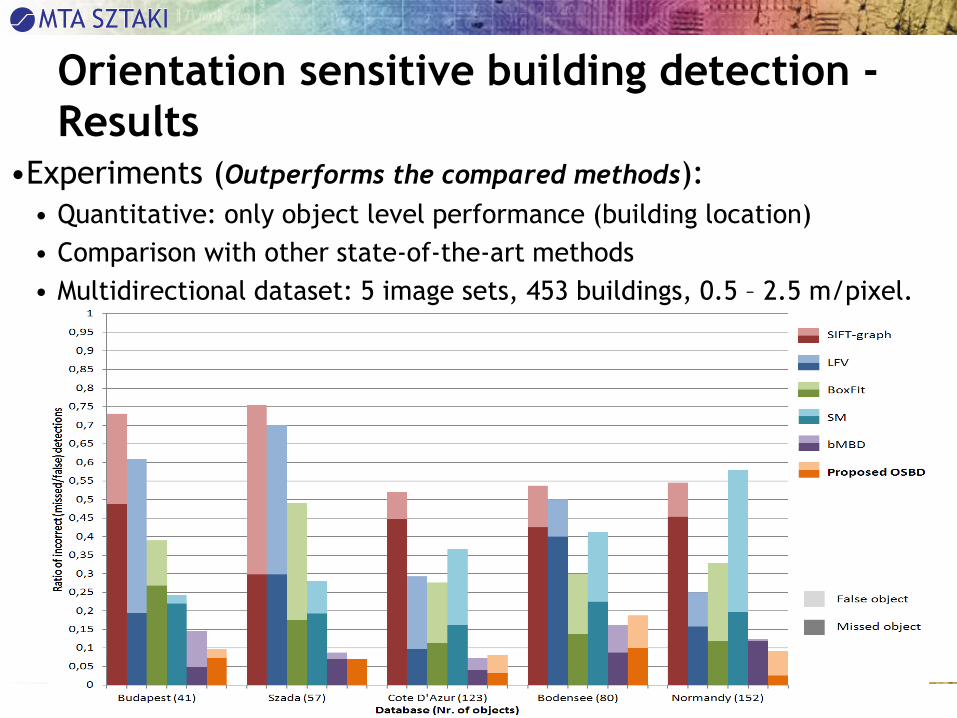
Orientation sensitive building detection -
Results•Experiments (Outperforms the compared methods):
• Quantitative: only object level performance (building location)
• Comparison with other state-of-the-art methods
• Multidirectional dataset: 5 image sets, 453 buildings, 0.5 – 2.5 m/pixel.

Thank You for your Attention!
11/24/2015 SZTAKI EEE 59

Remote sensing
Scene analysis, change
detection and 3D
reconstruction
people tracking,
biometric
identification, activity
recognition
4D visualization
Airborne and terrestrial
multi target tracking and
target identification
Security systems
Applications areas
Large scale surveillance
Distributed Events Analysis Research Lab

2D and 3D image sources
Aerial image Satellite image Radar (TerraSAR) Lidar point cloud
x
y
, ,L L EL EL
E
1 1 1 1, ,
E EE
2 2 2 2, ,
E EE
Passive radar

Main topics
•Pattern recognition, clustering
•3D geometry
•Remote sensing
•Lidar measurements
•Mobil and robot vision and sensing devices
•Biometrical identification and featuring
•UAV imaging
11/24/2015 SZTAKI EEE 62

Current projects• Pro-Active (EU FP7 Security, 2012-15)
• PRedictive reasOning and multi-source fusion empowering
AntiCipation of attacks and Terrorist actions In Urban EnVironmEnts
• DUSIREF (European Space Agency, 2013-16)• Remote sensing, 2D and 3D data fusion and modelling - aerial and
satellite image classification with change detection
• MAPIS (EDA, 2015-17)
• radar image processing and recognition, aerial remote sensing, change
and event detection
11/24/2015 MTA SZTAKI / DEVA 63/14