Embed Size (px)
Citation preview
Segmental and prosodic improvements to speech generation
Citation for published version (APA):Klabbers, E. A. M. (2000). Segmental and prosodic improvements to speech generation. Technische UniversiteitEindhoven. https://doi.org/10.6100/IR535299
DOI:10.6100/IR535299
Document status and date:Published: 01/01/2000
Document Version:Publisher’s PDF, also known as Version of Record (includes final page, issue and volume numbers)
Please check the document version of this publication:
• A submitted manuscript is the version of the article upon submission and before peer-review. There can beimportant differences between the submitted version and the official published version of record. Peopleinterested in the research are advised to contact the author for the final version of the publication, or visit theDOI to the publisher's website.• The final author version and the galley proof are versions of the publication after peer review.• The final published version features the final layout of the paper including the volume, issue and pagenumbers.Link to publication
General rightsCopyright and moral rights for the publications made accessible in the public portal are retained by the authors and/or other copyright ownersand it is a condition of accessing publications that users recognise and abide by the legal requirements associated with these rights.
• Users may download and print one copy of any publication from the public portal for the purpose of private study or research. • You may not further distribute the material or use it for any profit-making activity or commercial gain • You may freely distribute the URL identifying the publication in the public portal.
If the publication is distributed under the terms of Article 25fa of the Dutch Copyright Act, indicated by the “Taverne” license above, pleasefollow below link for the End User Agreement:www.tue.nl/taverne
Take down policyIf you believe that this document breaches copyright please contact us at:[email protected] details and we will investigate your claim.
Download date: 22. Feb. 2022

Segmental and prosodicimprovements to speech
generation
E.A.M. Klabbers
The work described in this thesis has been carried out atIPO, Center for User-System Interaction,Eindhoven, the Netherlands.
c�
E.A.M. Klabbers, 2000.
CIP-DATA LIBRARY TECHNISCHE UNIVERSITEIT EINDHOVEN
Klabbers, Esther A.M.
Segmental and prosodic improvements to speech generation /by Esther Anna Maria Klabbers. -Eindhoven: Technische Universiteit Eindhoven, 2000. -ISBN 90-386-0563-3NUGI 832Keywords: Speech synthesis
Segmental and prosodic improvements tospeech generation
PROEFSCHRIFT
ter verkrijging van de graad van doctor aan deTechnische Universiteit Eindhoven, op gezag van de
Rector Magnificus, prof.dr. M. Rem, voor eencommissie aangewezen door het College voor
Promoties in het openbaar te verdedigenop woensdag 7 juni 2000 om 16.00 uur
door
Esther Anna Maria Klabbers
geboren te Nijmegen

Dit proefschrift is goedgekeurd door de promotoren:
prof.dr. R.P.G. Collierenprof.dr. L.W.J. Boves
Copromotor:
dr.ir. R.N.J. Veldhuis
ACKNOWLEDGMENTS
Many people have helped and supported me while I was working on thisthesis. I would like to take this opportunity to thank a few of them:
Rene Collier, my thesis supervisor, for giving me all the support I needed.Our weekly meetings were truly inspirational. Raymond Veldhuis, myco-promotor, for the cooperation on audible discontinuities and for beingso patient with me in explaining the technical details of signal processing.Jan van Santen, for making my time at Bell Labs so worthwhile and pleas-ant. Jan-Roelof de Pijper and Leo Vogten, for supervising me especiallyat the outset of this project. Alice Dijkstra, Jan Landsbergen and JacquesTerken for coordinating the NWO-TST Programme. Mariet, my roommateat IPO, for putting up with me day after day. Loe Boves and Louis Pols asmembers of my thesis committee for providing me with useful commentsand suggestions.
Everybody of the Spoken Language Interface group, the IPO choir, andeveryone else at IPO for making it such a nice place to work. Kim Koppen,Ineke Burema and all the participants in my experiments for contributingto this thesis.
My parents Martien and Truce Klabbers and my brothers Ruben and Lu-cas, for supporting and loving me in everything that I do.
v

vi

Contents
1 General introduction 1
1.1 Introduction . . . . . . . . . . . . . . . . . . . . . . . . . . . . 1
1.2 The OVIS Spoken Dialogue System . . . . . . . . . . . . . . . 1
1.3 Goal of this thesis . . . . . . . . . . . . . . . . . . . . . . . . . 4
2 Generating high-quality speech 7
2.1 Introduction . . . . . . . . . . . . . . . . . . . . . . . . . . . . 7
2.2 Diphone synthesis . . . . . . . . . . . . . . . . . . . . . . . . . 10
2.2.1 Introduction . . . . . . . . . . . . . . . . . . . . . . . . 10
2.2.2 Synthesis routines . . . . . . . . . . . . . . . . . . . . 10
2.2.3 Speech output quality . . . . . . . . . . . . . . . . . . 12
2.3 IPO’s phrase concatenation . . . . . . . . . . . . . . . . . . . 14
2.3.1 Introduction . . . . . . . . . . . . . . . . . . . . . . . . 14
2.3.2 Database definition . . . . . . . . . . . . . . . . . . . . 14
2.3.3 Recording . . . . . . . . . . . . . . . . . . . . . . . . . 16
2.3.4 Generating speech . . . . . . . . . . . . . . . . . . . . 17
2.4 Evaluation . . . . . . . . . . . . . . . . . . . . . . . . . . . . . 19
2.4.1 Procedure . . . . . . . . . . . . . . . . . . . . . . . . . 20
vii

Contents
2.4.2 Subjects . . . . . . . . . . . . . . . . . . . . . . . . . . 22
2.4.3 Results . . . . . . . . . . . . . . . . . . . . . . . . . . . 22
2.4.4 Conclusion . . . . . . . . . . . . . . . . . . . . . . . . 23
2.5 Discussion . . . . . . . . . . . . . . . . . . . . . . . . . . . . . 25
3 Reducing audible spectral discontinuities 27
3.1 Introduction . . . . . . . . . . . . . . . . . . . . . . . . . . . . 27
3.2 Analysis of the problem . . . . . . . . . . . . . . . . . . . . . 29
3.2.1 Perceptual experiment . . . . . . . . . . . . . . . . . . 29
3.2.2 Spectral distance measures . . . . . . . . . . . . . . . 32
3.2.3 Correlating the results . . . . . . . . . . . . . . . . . . 39
3.2.4 Results . . . . . . . . . . . . . . . . . . . . . . . . . . . 40
3.3 A solution to the problem . . . . . . . . . . . . . . . . . . . . 44
3.3.1 Clustering procedure . . . . . . . . . . . . . . . . . . . 44
3.3.2 Second perceptual experiment . . . . . . . . . . . . . 48
3.4 Discussion . . . . . . . . . . . . . . . . . . . . . . . . . . . . . 51
3.5 Conclusion . . . . . . . . . . . . . . . . . . . . . . . . . . . . . 52
4 Modelling segmental duration 55
4.1 Introduction . . . . . . . . . . . . . . . . . . . . . . . . . . . . 55
4.2 Possible approaches . . . . . . . . . . . . . . . . . . . . . . . . 56
4.2.1 Knowledge-based systems . . . . . . . . . . . . . . . 56
4.2.2 Data-based systems . . . . . . . . . . . . . . . . . . . 58
4.2.3 Knowledge-based data systems . . . . . . . . . . . . . 60
4.3 The sums-of-products approach . . . . . . . . . . . . . . . . . 61
4.3.1 Corpus . . . . . . . . . . . . . . . . . . . . . . . . . . . 61
4.3.2 Feature vectors . . . . . . . . . . . . . . . . . . . . . . 62
4.3.3 Selecting a subset . . . . . . . . . . . . . . . . . . . . . 64
viii
Contents
4.3.4 Recording and segmenting . . . . . . . . . . . . . . . 64
4.3.5 Constructing the category tree . . . . . . . . . . . . . 65
4.3.6 Training the sums-of-products models . . . . . . . . . 68
4.4 A duration model for Dutch . . . . . . . . . . . . . . . . . . . 69
4.4.1 Fitted duration . . . . . . . . . . . . . . . . . . . . . . 69
4.4.2 Vowels . . . . . . . . . . . . . . . . . . . . . . . . . . . 72
4.4.3 Consonants . . . . . . . . . . . . . . . . . . . . . . . . 79
4.4.4 Conclusion . . . . . . . . . . . . . . . . . . . . . . . . 86
4.5 Evaluation . . . . . . . . . . . . . . . . . . . . . . . . . . . . . 87
4.5.1 Subjective evaluation . . . . . . . . . . . . . . . . . . . 87
4.5.2 Quantitative comparison between observed andpredicted durations . . . . . . . . . . . . . . . . . . . . 90
4.6 Discussion . . . . . . . . . . . . . . . . . . . . . . . . . . . . . 92
4.6.1 Explanation of findings . . . . . . . . . . . . . . . . . 92
4.6.2 Finding a meaningful predictor for perceived quality 93
5 Summary and conclusion 95
5.1 Summary of findings . . . . . . . . . . . . . . . . . . . . . . . 95
5.2 Conclusion and future research . . . . . . . . . . . . . . . . . 98
Bibliography 101
A Listing of the phoneme inventory 109
B Duration factors 111
C Audio examples 125
C.1 IPO’s diphone synthesis and phrase concatenation . . . . . . 126
C.2 Audible discontinuities . . . . . . . . . . . . . . . . . . . . . . 129
C.3 Duration evaluation . . . . . . . . . . . . . . . . . . . . . . . 130
ix

Contents
Summary 133
Samenvatting 137
Biography 141
x
Chapter 1General introduction
1.1 Introduction
The research presented in this thesis was carried out in the frameworkof the ‘Language and Speech Technology’ Priority Programme of NWO(the Netherlands Organisation for Scientific Research). In the context ofthis programme, a spoken dialogue system was developed, called OVIS, aDutch acronym for Openbaar Vervoer Informatie Systeem (Public Transporta-tion Information System), which provides information on train timetablesin the Netherlands. The scientific goal of the programme was to improveeach of the components involved in the development of such a systemfor Dutch, and to integrate them seamlessly. The research described inthis thesis is only concerned with the speech generation component of thissystem. In Section 1.2, all the components of the OVIS spoken dialoguesystem will be briefly explained. Section 1.3 explains the goal of this thesisand gives a brief outline of the body of this thesis.
1.2 The OVIS Spoken Dialogue System
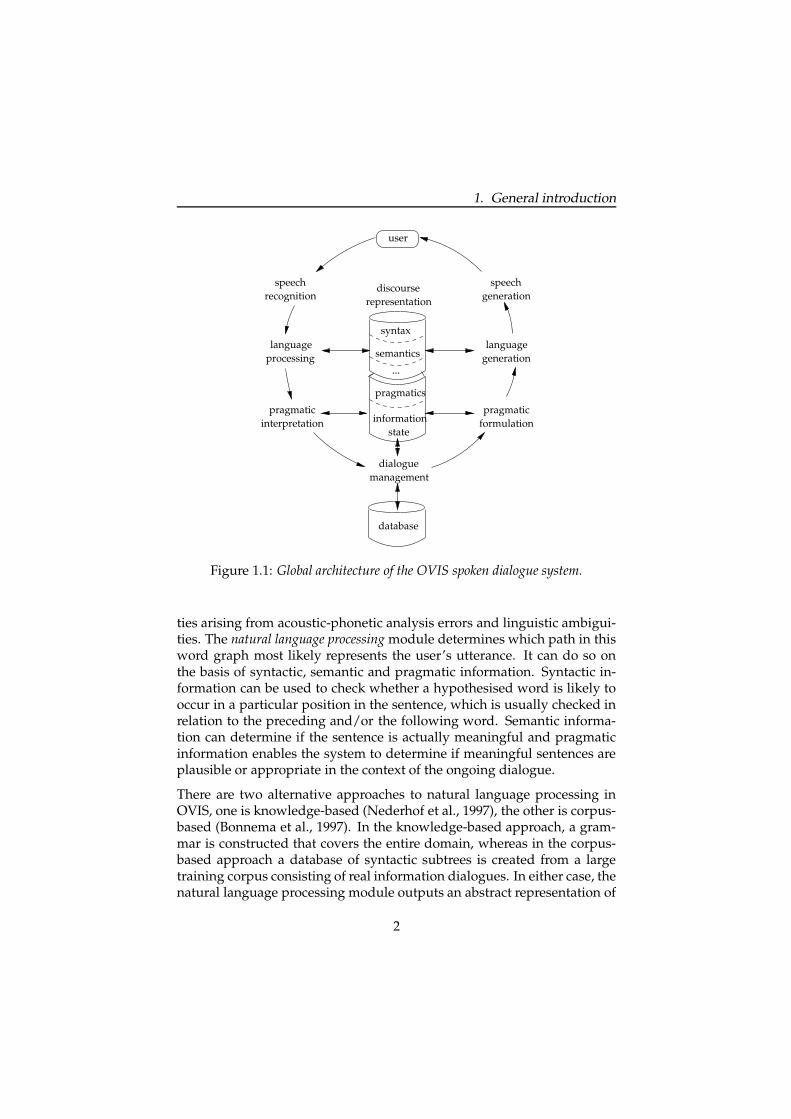
Figure 1.1 shows the components that make up the OVIS spoken dialoguesystem. The process starts at the top with the user issuing a request. Thisspeech signal is input to the automatic speech recognition module (Strik et al.,1996), based on Hidden Markov Modelling (HMM). It outputs a wordgraph containing a network of word hypotheses, as a result of uncertain-
1
1. General introduction
interpretationpragmatic
languageprocessing
speechrecognition
speechgeneration
languagegeneration
pragmaticformulation
dialoguemanagement
database
informationstate
discourserepresentation
user
...
semantics
pragmatics
syntax
Figure 1.1: Global architecture of the OVIS spoken dialogue system.
ties arising from acoustic-phonetic analysis errors and linguistic ambigui-ties. The natural language processing module determines which path in thisword graph most likely represents the user’s utterance. It can do so onthe basis of syntactic, semantic and pragmatic information. Syntactic in-formation can be used to check whether a hypothesised word is likely tooccur in a particular position in the sentence, which is usually checked inrelation to the preceding and/or the following word. Semantic informa-tion can determine if the sentence is actually meaningful and pragmaticinformation enables the system to determine if meaningful sentences areplausible or appropriate in the context of the ongoing dialogue.
There are two alternative approaches to natural language processing inOVIS, one is knowledge-based (Nederhof et al., 1997), the other is corpus-based (Bonnema et al., 1997). In the knowledge-based approach, a gram-mar is constructed that covers the entire domain, whereas in the corpus-based approach a database of syntactic subtrees is created from a largetraining corpus consisting of real information dialogues. In either case, thenatural language processing module outputs an abstract representation of
2
1.2. The OVIS Spoken Dialogue System
the sentence to the dialogue management module, which interprets thisrepresentation in the context of the dialogue carried out so far.
The dialogue management module (Veldhuijzen van Zanten, 1998) deter-mines what an appropriate system reaction could be on the basis ofchanges in the information state. The dialogue management module sendsa command to the natural language generation module, signalling that itneeds additional information, that it needs to verify recently obtained in-formation, or that it is ready to output the requested information found inthe database. An important aspect of dialogue management is the amountof control that resides with the system. The control can lie with the sys-tem in a menu-based application, where the structure of the dialogue isfixed and the system guides the user through the questions the answersof which provide the relevant information to the system. This approachconstrains the user to a large extent and, if not properly implemented, canbe perceived as very unpleasant. Alternatively, the control can lie with theuser. This can be undesirable when the user doesn’t have a clear pictureof the system’s capabilities. The key is to design a mixed-initiative systemthat guides the user when necessary, but gives the experienced user theopportunity to take control whenever possible.
The natural language generation module (Theune, 2000) converts a message(dialogue act) from the dialogue management module into an enrichedtext representation, i.e., with accent and phrase boundary markers added,which it passes onto the speech generation module. The natural languagegeneration module uses syntactic templates, consisting of fixed phraseswith slots in which other templates can be inserted. With informationabout syntax, semantics and pragmatics being readily available, accentand phrase boundary locations can be computed with much greater ac-curacy than when a text-to-speech synthesis system computes them fromunknown text.
The speech generation module converts the enriched text representation intospeech. Since the speech output is the part of the system that is mostprominently perceived by the user, good quality is imperative. Usersshould at least be able to easily understand the system’s utterances andpreferably they should find it pleasant to listen to.
3
1. General introduction
1.3 Goal of this thesis
The goal of this thesis is to improve the quality of IPO’s speech gener-ation algorithms. Speech generation at the level closest to the signal isachieved in three steps: duration computation, intonation (F0) computa-tion and sound generation. In the restricted domain of concatenative syn-thesis, sound generation involves concatenating pre-recorded units andimposing computed duration and F0 values onto the speech signal. Thequality of the output speech can be decomposed into two components:the segmental quality and the prosodic quality. These crucially dependon the size of the concatenative units. This has led to our first researchquestion.
1. What is the optimal size of the concatenation unit?
In concatenative speech generation, there is a trade-off between outputquality and flexibility, which is directly related to the size of the concate-native units. We did not explore the full range of possibilities, but ratherrestricted ourselves to two techniques that represent the top and bottomend of the spectrum, phrase concatenation and diphone synthesis, respec-tively. Diphones (Dixon and Maxey, 1968) are recorded speech segmentsthat represent transitions between any two sounds in a language. Thesesegments are stored in a coded form so that their timing and pitch canbe modified after concatenation. The advantage of diphone synthesis isthat it is extremely flexible in that only a limited number of diphones arerequired (approximately 2000 for Dutch) to synthesise unlimited text. Di-phone synthesis can be adopted for a wide range of applications withoutmuch adaptation. The drawback is, however, that the output quality of-ten leaves a great deal to be desired. A number of factors influence thesegmental quality. First, the context in which the diphones have beenrecorded is important. It makes a difference whether the diphones are ex-cised from nonsense words or from real sentences and whether they occurin accented words versus unaccented words or in stressed syllables ver-sus unstressed syllables. Second, in order for the duration and intonationvalues to be imposed on the signal, it has to be coded. Dependent on thespeaker’s voice characteristics, modifications of the signal can deterioratethe segmental quality considerably. Ultimately, the prosodic quality de-pends on the adequacy of the rules determining the duration and intona-tion values, assuming that the positions of accents and phrase boundariesare accurately determined by the NLG module.
4

1.3. Goal of this thesis
Phrase concatenation involves the concatenation of pre-recorded wordsand phrases. It is often used in commercial applications for a limited do-main, e.g., weather reports. The segmental quality depends for a largepart on the context in which the words and phrases have been recorded. Ifthey have been recorded in isolation, there is a risk of a mismatch in pitch,loudness and tempo that will make the speech sound disfluent. Often nomodification of the speech signal takes place, so in that respect the seg-mental quality is very high. The prosodic quality depends on the abilityto deal with the prosodic variation introduced by the NLG module. Thisis achieved by recording units in the proper context, providing multipleinstances of otherwise identical words and phrases, which differ only intheir duration and intonation.
The implementation of these two techniques is discussed in Chapter 2,Generating high-quality speech. It will be shown that for applications likeOVIS, in which the domain is restricted and has a fairly stable vocabu-lary, speech can be generated using pre-recorded words and phrases witha quality close to that of natural speech, provided that a couple of condi-tions are met. For instance, it is essential that the prosodic realisations cancomply with the instructions provided by the natural language generationmodule. This requirement is by no means trivial to implement.
However, whenever unrestricted text-to-speech is required, i.e., in appli-cations such as e-mail reading, phrase concatenation is no longer feasi-ble. Therefore, the remaining chapters are devoted to answering two ad-ditional questions:
2. How can we improve the segmental quality of diphone synthesis?
3. How can we improve the prosodic quality of diphone synthesis?
In Chapter 3, Reducing audible spectral discontinuities, a common problemin diphone synthesis is discussed, viz., the occurrence of audible discon-tinuities at diphone boundaries. Informal observations show that spectralmismatch is most likely the cause of this phenomenon. The problem ismost obvious in vowels and semi-vowels. Chapter 3 first sets out to findan objective spectral measure for discontinuity. To this end, several spec-tral distance measures are compared to the results of a listening experi-ment. Then, a solution is proposed to reduce the occurrence of audiblediscontinuities by extending the diphone database with context-sensitivediphones. The number of additional diphones is limited by clustering con-sonant contexts that have a similar effect on the surrounding vowels on the
5

1. General introduction
basis of the best performing distance measure.
As mentioned earlier, the prosodic quality is determined by the dura-tion and intonation characteristics of the speech. We assume here thatthe assignment of accent and phrase boundary positions is accurately per-formed by the NLG module, so that only the realisation of duration andpitch affect the prosodic quality. IPO has a long history of intonation re-search, which resulted in the Grammar of Dutch Intonation (GDI, Collierand ’t Hart (1981);’t Hart, Collier, and Cohen (1990)). We therefore concen-trate on another aspect of prosody, namely duration.
Chapter 4, Modelling segmental duration, discusses the development of anew duration model using the sums-of-products approach of Van Santen(1992a), because the rule-based model in Calipso is not deemed satisfac-tory. The main drawback of the old model is that some important higher-level factors, such as position of the syllable in the word and of the wordin the phrase, are not taken into account and that interactions among fac-tors are not sufficiently modelled. Moreover, this system is not specificallymodelled after the speaker of the diphones.
The new duration module is specifically designed to approximate the tem-poral behaviour of one female speaker, the same as was used for the di-phone recordings. Phonemes that are affected similarly by the various fac-tors are grouped into subclasses. The decisions concerning this groupingare based on exploratory data analysis and phonetic/phonological litera-ture. For each subclass of phonemes, a separate sums-of-products modelis trained. Exploratory data analysis is also required to appropriately de-cide which factors are important and how many levels on a factor shouldbe distinguished. For each subclass, this can lead to different results. Thus,a great deal of phonetic and phonological knowledge can be incorporatedin the model. This approach has already resulted in well performing du-ration modules for a number of languages, including American English,French and German.
This study ends with Chapter 5, Summary and conclusion. Some of the ex-amples that are presented in this thesis are made available as sound fileson the web site listed below. The content of these sound files is describedin Appendix C.
http://www.ipo.tue.nl/homepages/eklabber/audio.html
6
Chapter 2Generating high-quality speech
2.1 Introduction
This chapter describes research work done on the speech generation mod-ule in OVIS. Because the speech output is the part of the spoken dialoguesystem that is most prominently perceived by the user, good quality isimperative. Users should be able to easily understand the system’s utter-ances (prompts) and preferably they should find the voice of the systempleasant to listen to. This means that both the intelligibility and naturalnessmust be high.
In concatenative speech generation, there is a trade-off between outputquality and flexibility, which is directly related to the size of the concate-native units. The maximum amount of flexibility is obtained by usingdiphones (Dixon and Maxey, 1968) as the basic concatenative unit. Di-phones are recorded speech segments that represent transitions betweenany two sounds in a language. These segments are stored in a coded formso that their timing and pitch can be modified after concatenation. With alimited number of diphones, unlimited text can be synthesised. Diphonesynthesis can be adopted for a wide range of applications without muchadaptation. Unfortunately, there is a price to be paid: the quality of thespeech generated by such systems still leaves a great deal to be desired.Current speech synthesis systems are capable of generating speech whichhas a high degree of intelligibility, but, in general, the speech still soundsquite unnatural. The diphone synthesis system developed at IPO will bediscussed in more detail in Section 2.2.
7
2. Generating high-quality speech
At the other end of the spectrum, the best quality can be achieved by play-ing back digitally stored natural speech. The quality of the speech outputis then limited only by the medium, e.g., a standard telephone channel,through which it is transmitted. However, this approach is only practicalin the simplest of applications. The key is to find a balance in the trade-off between naturalness and flexibility. In that respect, concatenating pre-recorded units like words and phrases appears to be a good alternative.With this approach, a large number of utterances can be produced on thebasis of a limited set of pre-recorded phrases, saving memory space andincreasing flexibility. This technique is practical only if the application do-main is limited and remains rather stable, as is the case with train timeta-bles.
The use of concatenated words and phrases in limited-domain applica-tions such as OVIS is quite common. It is used in many commercial appli-cations such as the talking clock, telephone banking systems, market re-search teleservices and travel information services. But often the methodis so straightforward that it is not even mentioned. In the German traintimetable system (Aust, Oerder, Seide, and Steinbiss, 1995) and in the firstversion of OVIS which is based on this German system, speech outputwas obtained by simply recording the necessary words and phrases andplaying back the concatenated sentences when required.
This approach (which will be referred to as conventional phrase concate-nation) has two major problems:
� First, recordings are often not carefully controlled. The concatena-tive units are usually recorded in isolation, which causes mismatchin loudness, tempo and pitch between concatenated units, leadingto disfluent speech. Phrases seem to overlap in time and create theimpression that several speakers are talking at the same time, fromdifferent locations in the room. In order to disguise these prosodicimperfections, pauses are often inserted, which are very conspicu-ous and make the speech sound even less fluent. This causes thesegmental quality of the speech output to be suboptimal.
� Second, in natural speech, the prosody of words in an utterancevaries depending on several factors such as their position in the ut-terance, the syntactic structure of the utterance, and the discoursecontext. For instance, words expressing information that has beenpreviously mentioned tend to be deaccented. By recording all wordsand phrases in one prosodically neutral version, such contextual
8

2.1. Introduction
variation is not taken into account. This causes the prosodic qualityof the speech output to be suboptimal.
One simple application that does take some prosodic properties into ac-count is the telephone number announcement system described in Water-worth (1983). In order to increase the naturalness of the telephone numberstrings that are output by the system, digits are recorded in three versionswith different intonation contours. There is a neutral form, a continuant,with a generally rising pitch, and a terminator, with a falling pitch contour.Most digits in a telephone number, e.g., 010 - 583 15 67, are pronounced us-ing the neutral form. However, the numbers occurring before a space, viz.0, 3 and 5, are pronounced using the continuant form to signal a bound-ary and to indicate that the utterance has not yet finished. The final 7 ispronounced with a terminator to signal the end of the string. Experimentsshowed that people preferred this method over the simple concatenationmethod.
Another application, a computer-assisted language learning programcalled Appeal, uses a more sophisticated form of word concatenation todeal with prosodic variations (De Pijper, 1996). When making the record-ings, the words were embedded in carrier sentences to do justice to the factthat words are shorter and often more reduced when spoken in context.Only one version of each word was recorded, but when during generationthe words are concatenated to form a text, the duration and pitch of thewords are adapted to the context using the Pitch-Synchronous Overlap-and-Add technique (PSOLA, Charpentier and Moulines (1989)). This en-sures a natural prosody, but the coding scheme may deteriorate the qualityof the output speech to some extent.
Our approach to phrase concatenation can be seen as an extension tothe simple concatenation approach. It is discussed in more detail in Sec-tion 2.3. It is different from conventional concatenation in that a) all con-catenative units have been recorded embedded in carrier sentences, andb) like Waterworth, it takes prosodic variation into account by recordingdifferent prosodic versions for otherwise identical units. No manipulationof the speech signal is required, thus retaining a natural speech quality.The resulting output quality has been evaluated in a listening experiment,reported on in Section 2.4, where it is compared to natural speech, con-ventional phrase concatenation and diphone synthesis. This chapter endswith a discussion in Section 2.5.
9

2. Generating high-quality speech
2.2 Diphone synthesis
2.2.1 Introduction
Using full-fledged speech synthesis provides maximum flexibility. In spo-ken dialogue systems like OVIS the linguistic analysis part can be skipped,as the NLG module can determine the prosodic annotations for accentsand phrase boundaries with much more accuracy using syntactic, seman-tic and pragmatic information (Theune, Klabbers, Odijk, and De Pijper,1997). The phonetic transcription can be obtained via a lookup table.
The following section will discuss the synthesis routines in IPO’s di-phone synthesis system Calipso (previously known as SPENGI (Collierand Houtsma, 1995; Terken, 1996)). For excellent introductions on concate-native speech synthesis in general, the reader is referred to Dutoit (1997)and Sproat (1998). In the course of the NWO-TST Programme, interest hasincreased in new variants of concatenative synthesis using units of vari-able length (Campbell and Black, 1997; Black and Taylor, 1997; Balestriet al., 1999). This novel approach will be briefly dealt with in the discus-sion in Chapter 5.
2.2.2 Synthesis routines
The synthesis routines can be split up into three steps: a) Duration assign-ment, i.e., computing temporal structure, b) Intonation assignment, i.e.,computing melodic structure, and c) Sound generation, i.e., concatenatingthe diphones and overlaying the durational and intonational values.
Duration assignment: Duration prediction in Calipso is done via a rule-based duration model. The rules in the model have either been takenfrom the literature or are derived from small-scale experiments. First, thephonemes receive a base duration value which is then altered by applyinga series of rules. For rules relating to vowels, the dissertation of Noote-boom (1972) served as a good source of information. Some additionalrules were borrowed from the dissertation of Van Coile (1989). In general,lengthening or shortening occurs as an effect of the immediately preced-ing or following segment or as an effect of stress and accentuation. Hardlyany higher-level effects are taken into account, and interactions betweendifferent factors cannot be modelled easily in this approach. For severalyears, it has been experienced that this rule set does not yet produce sat-
10
2.2. Diphone synthesis
isfactory results. Therefore, a new duration module was developed usingthe sums-of-products approach of Van Santen (1992a). It is described inChapter 4.
Intonation assignment: The intonation module in Calipso is an imple-mentation of the Grammar of Dutch Intonation as developed over theyears at IPO. It is described extensively in Collier and ’t Hart (1981) and’t Hart, Collier, and Cohen (1990). The GDI is characterised by a dis-tinction between involuntary and voluntary pitch variations. The lattercarry linguistic information (e.g., about accented words, phrase bound-aries, speaker attitude). Only the voluntary actions of the speaker are con-sidered to be relevant for perception. This makes it possible to stylise apitch contour, i.e., to reduce it to its perceptual essentials. A pitch con-tour is assumed to be composed of a series of pitch movements alternat-ing between two reference declination lines, a bottom line and a top line.A perceptually relevant pitch movement is characterised by its direction(rise vs. fall), its rate of change (slow vs. fast), its size (full vs. half) andits timing (early vs. late vs. very late in the syllable). These pitch move-ments are grouped into pitch configurations which are then combined intopitch contours at the clause level. The permissible sequences of the pitchmovements are specified in a language-specific grammar. In Calipso, theintonation module reads its input from two files, one specifying the acous-tic definition for the declination line and each of the pitch movements, theother specifying the allowed sequences of pitch movements on all possiblecombinations of accents and phrase boundaries.
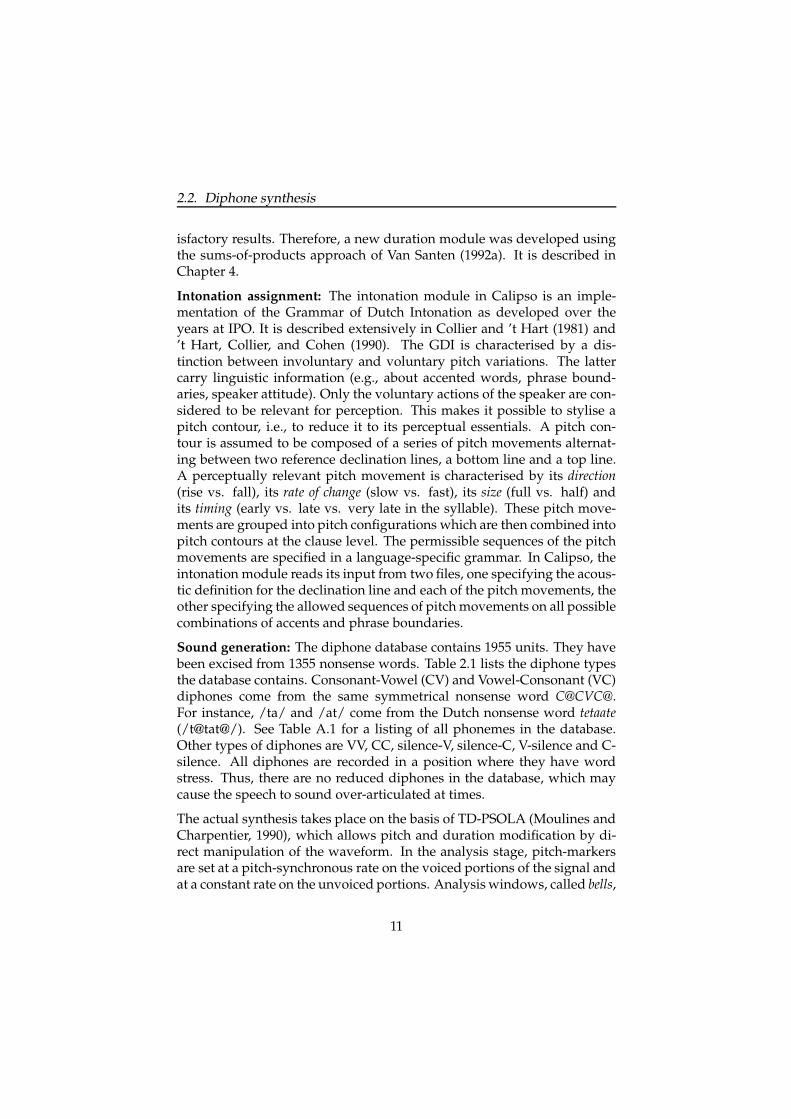
Sound generation: The diphone database contains 1955 units. They havebeen excised from 1355 nonsense words. Table 2.1 lists the diphone typesthe database contains. Consonant-Vowel (CV) and Vowel-Consonant (VC)diphones come from the same symmetrical nonsense word C@[email protected] instance, /ta/ and /at/ come from the Dutch nonsense word tetaate(/t@tat@/). See Table A.1 for a listing of all phonemes in the database.Other types of diphones are VV, CC, silence-V, silence-C, V-silence and C-silence. All diphones are recorded in a position where they have wordstress. Thus, there are no reduced diphones in the database, which maycause the speech to sound over-articulated at times.
The actual synthesis takes place on the basis of TD-PSOLA (Moulines andCharpentier, 1990), which allows pitch and duration modification by di-rect manipulation of the waveform. In the analysis stage, pitch-markersare set at a pitch-synchronous rate on the voiced portions of the signal andat a constant rate on the unvoiced portions. Analysis windows, called bells,
11

2. Generating high-quality speech
Diphone Nonsense words Example Number intype databaseCV C@CVC@ tetaate 595VC C@CVC@ tetaate 595VV tVVt@ teate 287CC C@CCe tetree 324silence-V .Vt@ .aate 23silence-C .C9t@ putte 21V-silence p@pV. pepee 23C-silence C@CaC. pepaap 14Total: 1955
Table 2.1: Description of all diphone types in the database; V = vowel, C = con-sonant, @ = schwa, . = silence.
are centred around these pitch markers. The bells span approximately twoperiods, thus overlapping each other in time. During synthesis, the pitchis changed by altering the time distance between successive bells and thenadding them. The duration is changed by inserting or deleting bells, i.e.,the bell is the smallest unit of durational modification.
Although TD-PSOLA works very well for manipulating natural speech,some problems occur when it is used for modifying diphones. Repeatingidentical bells to lengthen a sound can lead to unnatural sounding speech.Phase mismatches can occur when the windows are not placed at the sameposition within the period. Pitch mismatches can occur if the speaker wasunable to keep the pitch reasonably constant during recording. Spectralenvelope mismatches can also occur. This is one of the major drawbacksof concatenative synthesis. It is mostly due to a failure to account for thepredictable coarticulation effects in speech production. These mismatchescan result in audible discontinuities at diphone boundaries. This problemis described in Chapter 3.
2.2.3 Speech output quality
Ultimately, the aim of speech synthesis systems is to generate speech ofhigh quality from unrestricted text. This is not impossible, but many prob-lems are encountered in text preprocessing, for instance at the level ofgrapheme-to-phoneme conversion, phrasing and stress assignment, andin synthesis, for instance the spectral continuity and duration/intonation
12

2.2. Diphone synthesis
assignment mentioned earlier. All these errors occur at different levels ofanalysis or synthesis and lead to a degradation of the speech output qual-ity. Assessing the performance of a speech synthesis system is not as sim-ple a task as assessing the performance of an automatic speech recognitionsystem, where the performance of the system is captured in one measure:the Word Error Rate (WER).
In speech synthesis, it is possible to quantify the errors made at some lev-els, e.g., segmental intelligibility, using a whole range of diagnostic tests(Steeneken, 1992; Pols, 1994). Some other levels, such as the prosody com-putation level, cannot be evaluated so easily. Moreover, there is little stan-dardisation in terms of which tests to use, and few proper benchmarks arebeing performed (except for a recent initiative by Van Santen, Pols, Abe,Kahn, Keller, and Vonwiller (1998)). The overall quality of the system canbe assessed by a mean opinion score (MOS) test, which is usually carriedout in the context of a specific application. These scores give an indica-tion of the overall quality of a system, but since MOS tests are relative,two or more systems must be evaluated in the same test with the same setof users in order to give comparable results. Gibbon, Moore, and Winski(1997) provide an overview of tests on all levels and give some guidelinesfor their employment.
In a recent evaluation by Rietveld et al. (1997), three Dutch synthesis sys-tems (one of which was Calipso) were compared. Forty-four participantstook part in an intelligibility test and another group of forty-four partic-ipants took part in a subjective evaluation. In both groups, twenty-twoparticipants listened to standard telephone (PSTN) coded materials, andtwenty-two others to GSM-coded materials. In the intelligibility test, theparticipants were asked to transliterate a semantically unpredictable textof 147 words, excluding articles. The percentage of correct transliterationswas lower in the GSM condition (between 52 and 59%) than in the PSTN-condition (between 66 and 72%). In the subjective evaluation, participantshad to rate their preferences for pairs of systems on a scale ranging from -3to +3. They also had to rate 16 questions, such as overall quality, listeningeffort, and voice pleasantness, on a five-point scale. The texts representedthree text types: email messages, stock exchange information and publictransport information. The overall quality of the systems ranged between2.34 and 2.73 on a 5-point scale. This score was the same in the GSM andthe PSTN condition. In general, speech is considered acceptable when theMOS-score is at least 3 on a 5-point scale. Therefore, we can conclude thatthe quality of the speech synthesis systems under investigation is still in-sufficient for use in commercial applications.
13
2. Generating high-quality speech
2.3 IPO’s phrase concatenation
Many of these applications do not require unrestricted text-to-speech syn-thesis. In cases where the domain is limited and remains rather stable,pre-recorded words and phrases can be used. We will now describe thephrase concatenation approach that was developed in the context of theNWO-TST Programme.
2.3.1 Introduction
This section describes the development of an advanced approach to phraseconcatenation which results in high quality speech. The concatenation ofwords and phrases requires no manipulation or coding of the recordings.This phrase concatenation approach fits well with the NLG module, be-cause the syntactic templates that form the core of this module indicatewhich parts are carrier sentences and which are slots. All concatenativeunits are recorded embedded in carrier sentences. This reduces the chanceof mismatch in loudness, tempo and pitch occurring after concatenation,resulting in more fluent speech. A natural intonation is achieved by usingseveral prosodic variants of otherwise identical words and phrases thatserve as slot fillers. In order to determine which units have to be recordedand how many different prosodic realisations are required, a thoroughanalysis of the material to be generated is a necessary phase in the de-velopment of a phrase database.
This technique was first used in an application called GoalGetter (Klab-bers, Odijk, De Pijper, and Theune, 1996), which is a data-to-speech sys-tem generating spoken soccer reports on the basis of tabular informationavailable via Teletext1. (See Appendix C for an example.)
2.3.2 Database definition
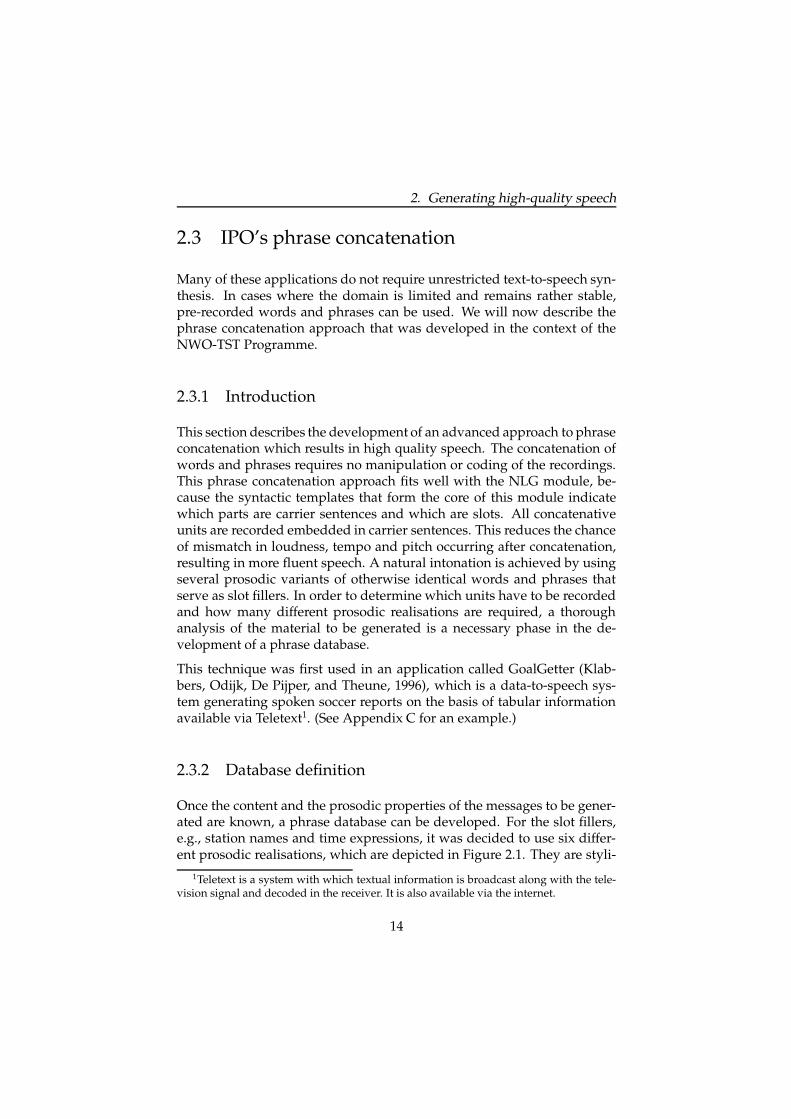
Once the content and the prosodic properties of the messages to be gener-ated are known, a phrase database can be developed. For the slot fillers,e.g., station names and time expressions, it was decided to use six differ-ent prosodic realisations, which are depicted in Figure 2.1. They are styli-
1Teletext is a system with which textual information is broadcast along with the tele-vision signal and decoded in the receiver. It is also available via the internet.
14
2.3. IPO’s phrase concatenation
sations of pitch contours on monosyllabic words (according to the IPOGrammar of Dutch Intonation (’t Hart, Collier, and Cohen, 1990)) of themost common realisations occurring in each of the prosodic contexts indi-cated.
continuation
[500 ms]
(3)
(1)
[500 ms]
(6)
[200 ms]/[300 ms]
Accent
(2)
[200 ms]/[300 ms]
(5)
(4)
Boundary
Minor / Major
None
Finality
NoYes
Figure 2.1: Stylised examples of the different prosodic versions that are needed.Two factors determine their pitch and pausing: the accentuation and the positionrelative to a minor/major/final phrase boundary. The pauses are indicated betweenbrackets.
1. An accented slot filler which does not occur before a phrase bound-ary is produced with the most frequently used pitch configuration,the so-called (pointed) hat pattern, which consists of a rise and fallon the same syllable. This contour corresponds to the prosodicallyneutral version often used in many other phrase concatenation tech-niques.
2. An accented slot filler which occurs before a minor or a major phraseboundary is most often produced with a rise to mark the accentand an additional continuation rise to signal that there is a non-finalboundary. A short pause follows the constituent, which is 200 ms inlength in case of a minor boundary (/) and 300 ms in case of a majorboundary (//).
15

2. Generating high-quality speech
3. An accented slot filler which occurs in final position receives a finalfall. It is followed by a longer pause of 500 ms.
4. Unaccented slot fillers are pronounced on the declination line with-out any pitch movement associated with them.
5. Unaccented slot fillers occurring before a minor or a major phraseboundary only receive a small continuation rise. This prosodic situ-ation does not occur very often. The NLG module usually puts a mi-nor or major phrase boundary immediately after an accented word.Again, a 200-ms or 300-ms pause is inserted.
6. Unaccented slot fillers in a final position are produced with final low-ering, i.e., a declination slope that is steeper than in other parts of theutterance. It is followed by a 500-ms pause.
2.3.3 Recording
When recording the material for the phrase database, the slots in the car-rier sentences were filled with dummy words so that the fixed phrases tobe stored in the database could be excised easily. In this way, the effect ofcoarticulation at the word boundaries was minimised. Fade-in and fade-out was applied to all material in the phrase database to avoid clicks inconcatenation. The slot fillers, such as station names and time and dateexpressions, were embedded in dummy sentences that provide the rightprosodic context. The sentences were constructed in such a way as to makethe speaker produce the right prosodic realisation naturally. She receivedno specific instructions about how to produce the sentences. The intona-tion in the carrier phrases is not so critical, so the speaker could use herown intuitions about how to pronounce them. The recordings were madein a sound-treated room using two high-quality microphones which werepositioned on either side of the speaker, a fixed distance away from themouth. The speech was recorded on a DAT-tape using a 48 kHz samplingfrequency. The speech signal was stored on an SGI workstation in monowith sampling frequency of 16 kHz. The concatenative units were excisedmanually and sentences were generated to check for large differences inloudness to be corrected.
16

2.3. IPO’s phrase concatenation
2.3.4 Generating speech
To concatenate the proper words and phrases, an algorithm has been de-signed that performs a mapping between the enriched text, i.e., text withaccentuation and phrasing markers, as provided by the NLG module, andthe pre-recorded phrases that have to be selected. The different prosodicvariants are chosen on the basis of the prosodic markers. The algorithmrecursively looks for the largest phrases to concatenate into sentences. Itworks from left to right. First, it tries to find the string of N words that con-tains the entire sentence. If it is present, it is retrieved and can be played.If not, the string comprising the first N � 1 words is looked up. This pro-cess continues until a matching phrase is found. Then the remaining partof the sentence undergoes the same procedure, until the entire sentencecan be played. It is perhaps not the most optimal search algorithm, but itprovides the correct phrases to be concatenated.
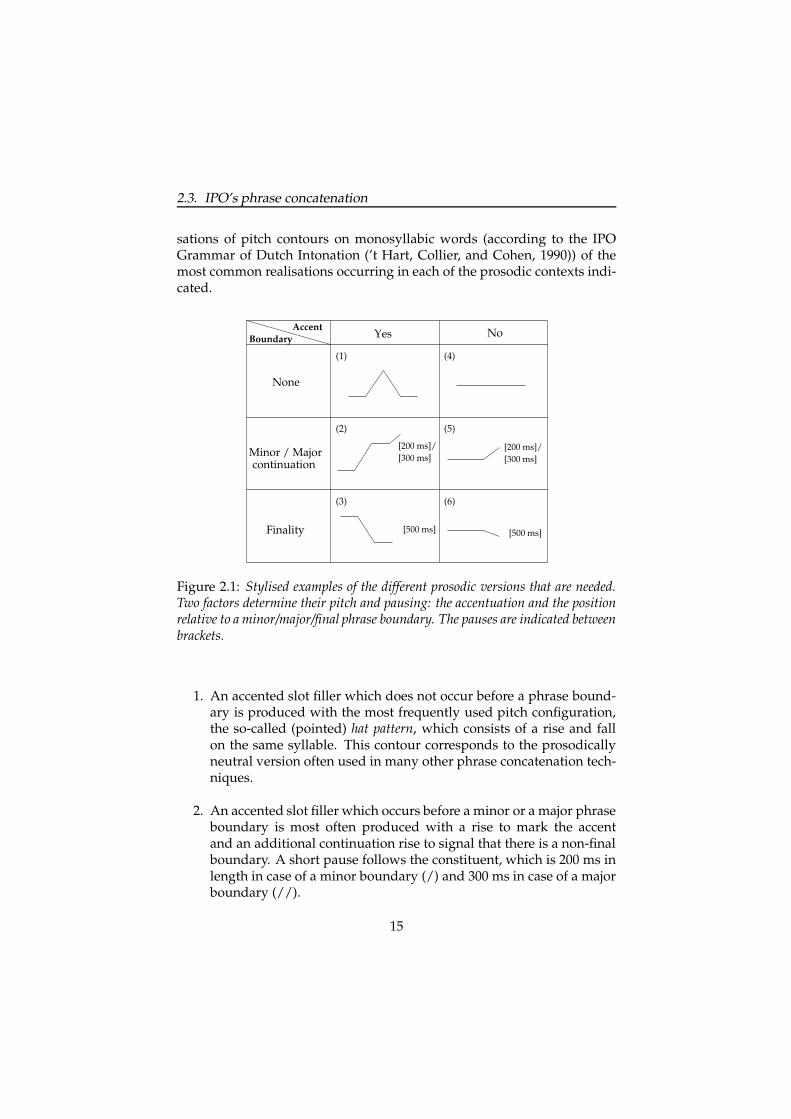
As an example, consider the sentence in Figure 2.2 (English: ‘On whichday would you like to travel from Groningen to Paris?’). The sentenceconsists of 5 pieces of the carrier phrase op welke dag, wilt u, van, naar andreizen?. The two slot-filling station names Groningen and Parijs are bothaccented but Groningen is realised with a continuation rise because of theminor phrase boundary following it.
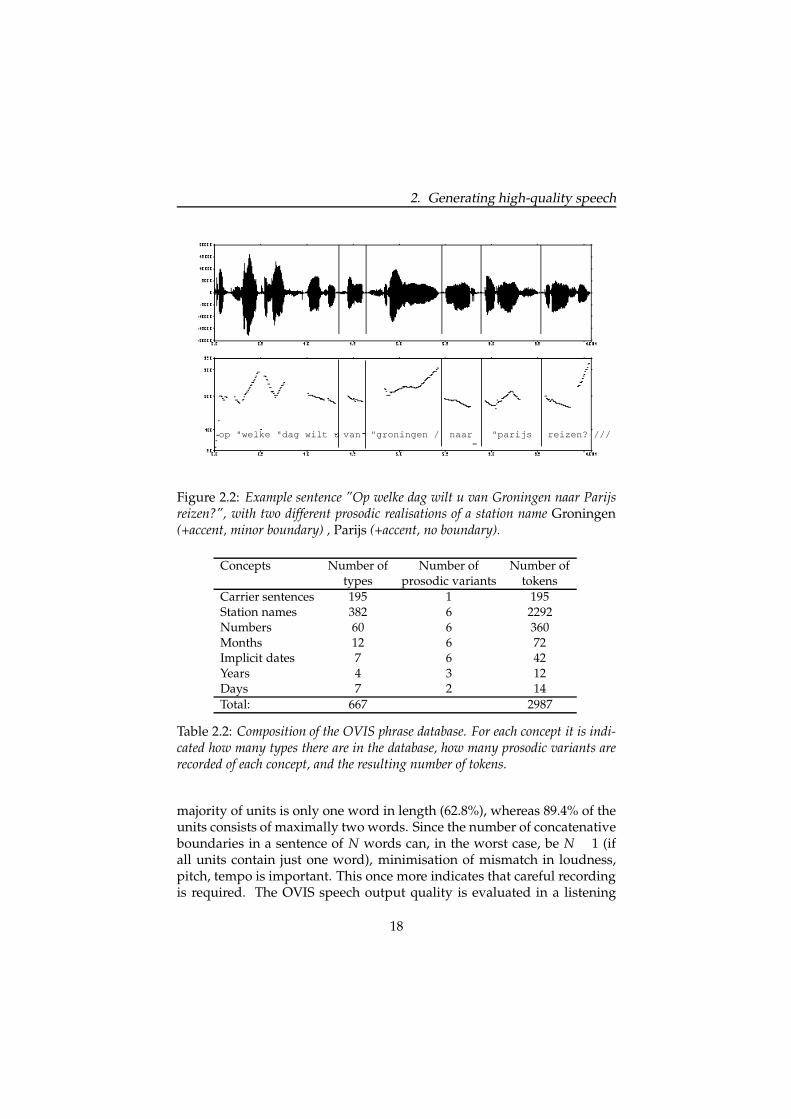
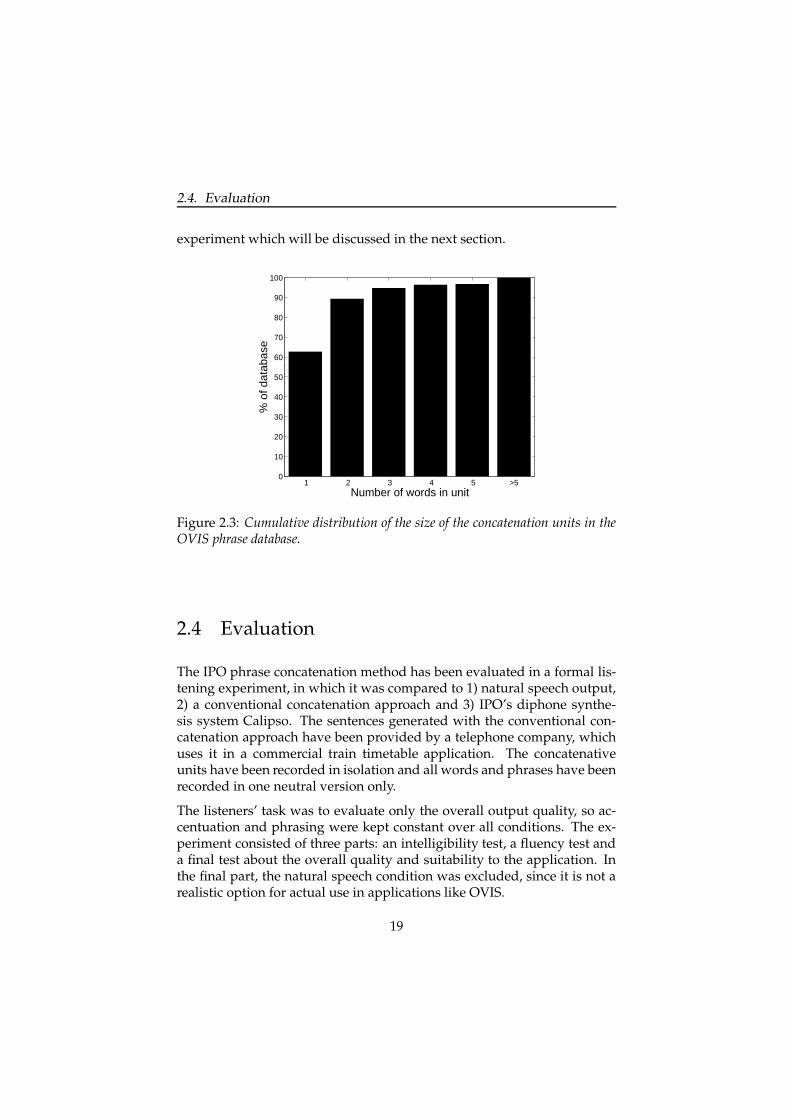
The OVIS speech database takes up approximately 93 MB. There are 2987units in the database that can be divided into different categories as listedin Table 2.2. As can be seen, the station names (382 different names thatcover all Dutch train stations and some foreign stations) form the bulk ofthe data, especially since they have been recorded in six prosodic versions.The days of the week have been recorded in only two prosodic versions.This is because in OVIS the NLG module always generates them followedby a number and a month, e.g., ‘Maandag 24 januari’ (Monday January24th), and no phrase boundary can be inserted immediately after them.Thus, the two versions only distinguish accented from unaccented days ofthe week. The years are only recorded in accented position. There are threeversions corresponding to the position relative to a phrase boundary, i.e.,before no boundary, before a minor/major boundary or at the end of thesentence. In conventional phrase concatenation, the size of the databasewould be 667 units, the total number of types as indicated in Table 2.2.Recording additional prosodic variants increases the size of the databasewith a factor 4.5 to 2987, the total number of tokens in the table. Figure 2.3shows the unequal distribution of the unit length in the database. The vast
17
2. Generating high-quality speech
op "welke "dag wilt u van "groningen / naar "parijs reizen? ///
Figure 2.2: Example sentence ”Op welke dag wilt u van Groningen naar Parijsreizen?”, with two different prosodic realisations of a station name Groningen(+accent, minor boundary) , Parijs (+accent, no boundary).
Concepts Number of Number of Number oftypes prosodic variants tokens
Carrier sentences 195 1 195Station names 382 6 2292Numbers 60 6 360Months 12 6 72Implicit dates 7 6 42Years 4 3 12Days 7 2 14Total: 667 2987
Table 2.2: Composition of the OVIS phrase database. For each concept it is indi-cated how many types there are in the database, how many prosodic variants arerecorded of each concept, and the resulting number of tokens.
majority of units is only one word in length (62.8%), whereas 89.4% of theunits consists of maximally two words. Since the number of concatenativeboundaries in a sentence of N words can, in the worst case, be N � 1 (ifall units contain just one word), minimisation of mismatch in loudness,pitch, tempo is important. This once more indicates that careful recordingis required. The OVIS speech output quality is evaluated in a listening
18
2.4. Evaluation
experiment which will be discussed in the next section.
1 2 3 4 5 >50
10
20
30
40
50
60
70
80
90
100
Number of words in unit
% o
f dat
abas
e
Figure 2.3: Cumulative distribution of the size of the concatenation units in theOVIS phrase database.
2.4 Evaluation
The IPO phrase concatenation method has been evaluated in a formal lis-tening experiment, in which it was compared to 1) natural speech output,2) a conventional concatenation approach and 3) IPO’s diphone synthe-sis system Calipso. The sentences generated with the conventional con-catenation approach have been provided by a telephone company, whichuses it in a commercial train timetable application. The concatenativeunits have been recorded in isolation and all words and phrases have beenrecorded in one neutral version only.
The listeners’ task was to evaluate only the overall output quality, so ac-centuation and phrasing were kept constant over all conditions. The ex-periment consisted of three parts: an intelligibility test, a fluency test anda final test about the overall quality and suitability to the application. Inthe final part, the natural speech condition was excluded, since it is not arealistic option for actual use in applications like OVIS.
19
2. Generating high-quality speech
2.4.1 Procedure
All stimuli, twenty-three in total, consisted of information about train con-nections that can occur in OVIS. First, the participants were presented withthree example fragments (see the example in (1)), to get a general indica-tion of the different speech output conditions. The natural speech outputcondition was not included in these examples.
(1) ik heb de volgende verbinding gevonden ///met de sneltrein / vertrek vanuit enkhuizen / om elf uur eenen-vijftig / aankomst in oosterbeek / om drieentwintig uur twee ///daar verder met de stoptrein / vertrek om dertien uur zeventien /aankomst in stavoren / om drie uur achtentwintig ///wilt u nog een andere verbinding weten ? ///
Translation:I found the following connection ///with the express train / departing from enkhuizen / at 11:51 / arrival inoosterbeek / at 23:02 ///there continue with the local train / departing at 13:17 / arrival in sta-voren / at 03:28 ///would you like to have a different connection ? ///
The experiment started with the intelligibility test. All participants lis-tened to twenty fragments, five different fragments for each speech con-dition. The task of the listeners was to recognise and write down the twostation names that occurred in each fragment. The fragments were shorterthan the example fragments (see the example in (2)), containing only twostation names, and no stop-over, so as to make sure that it was an intelli-gibility test and not a memory test.
(2) met de sneltrein / vertrek vanuit vierlingsbeek / om negen uurzevenenvijftig / aankomst in koudum molkwerum / om drieen-twintig uur dertig ///
with the express train / departing from vierlingsbeek / at 09:57 / arrivingin koudum molkwerum / at 23:30 ///
20

2.4. Evaluation
The station names were balanced with respect to familiarity (correlatedwith the number of inhabitants of the town or city) and number of syl-lables. Some station names were easily confused (Heiloo vs. Heino andOss vs. Olst). The fragments of conventional phrase concatenation wereobtained from a commercial train timetable information system. Sincethese fragments were only available in telephone bandwidth, the frag-ments representing the other speech output conditions were filtered to abandwidth of 300 Hz to 3400 Hz. The IPO phrase concatenation, diphonesynthesis and natural speech fragments all originated from the same semi-professional female speaker, whereas the conventional phrase concatena-tion made use of a different female speaker.
The order of the speech output conditions was balanced over all partici-pants, so that one speech condition occurred five times in the first block,five times in the second block, etc. This was done to compensate for ordereffects. Each station name occurred equally frequently in each speech con-dition. Each subject listened to 40 different station names. So for instance,the station name ’Heiloo’ was presented in the DS condition for one sub-ject and in the IC condition for another subject. Due to the elaborate formatin which the train connections were presented to the participants, it wasimpossible to ask them to also write down the time information, let alonethe entire sentence. After listening to the five fragments that made up onespeech output condition, participants had to rate on a 7-point scale howthey judged the overall speech intelligibility. Listeners were instructedto take into account whether they had problems recognising individualwords, or whether it took a lot of effort to understand the message.
In the next part of the test, listeners had to rate the fluency of each frag-ment on a 7-point scale. The fragments were the same 20 fragments thatwere used in the intelligibility test, but the speech output conditions werepresented in a different order, and the fragments were again randomlydivided over the conditions. We did not ask to evaluate ”naturalness”, asthis attribute is a composite measure for many aspects of the speech signal,including segmental quality and prosody, each in turn having multiple di-mensions (such as speech melody, accentuation, phrasing). Instead, weasked listeners to evaluate the fluency of the fragments, which we con-sider a better criterion with fewer dimensions, that relates directly to aninherent flaw of concatenative synthesis. The participants were told theycould take into account whether the speech had a faltering speaking style,or contained audible jumps in pitch.
21
2. Generating high-quality speech
In the final part of the experiment, the participants were again presentedwith the longer example messages that were introduced at the start of theexperiment. Per message they had to rate two questions on a 7-point scale:one concerning the overall quality of the speech and the other concerningits suitability for the given application. Here, participants had to imagineactually calling such an information service. How would they evaluatethe speech output quality of the system in that case?
2.4.2 Subjects
Twenty participants took part in the experiment. They were studentsfrom the Eindhoven University of Technology, with no prior knowledgeof speech technology. They were not paid for their participation.
2.4.3 Results
In the discussion of the results, the speech output techniques will be re-ferred to by codes. N stands for the natural speech condition, IC standsfor IPO’s phrase concatenation, CC for conventional phrase concatenationand DS for diphone synthesis. In the first part of the intelligibility test,where the participants had to transcribe 40 station names, recognition (i.e.,transcription) errors are the dependent variable. Table 2.3 lists the worderror rate, i.e., the percentage of items that were transcribed incorrectly. Astation name was considered to be transcribed incorrectly when at leastone letter was deleted, inserted or changed, such that the name soundeddifferently. The table shows that the intelligibility of the station names isidentical for the N and IC conditions. CC is slightly less intelligible, butsince the station names have been produced as whole words in both theIC and CC condition, this tells us more about the articulatory propertiesof the different speakers than about the method. Diphone synthesis scoresworse than any other speech output technique.
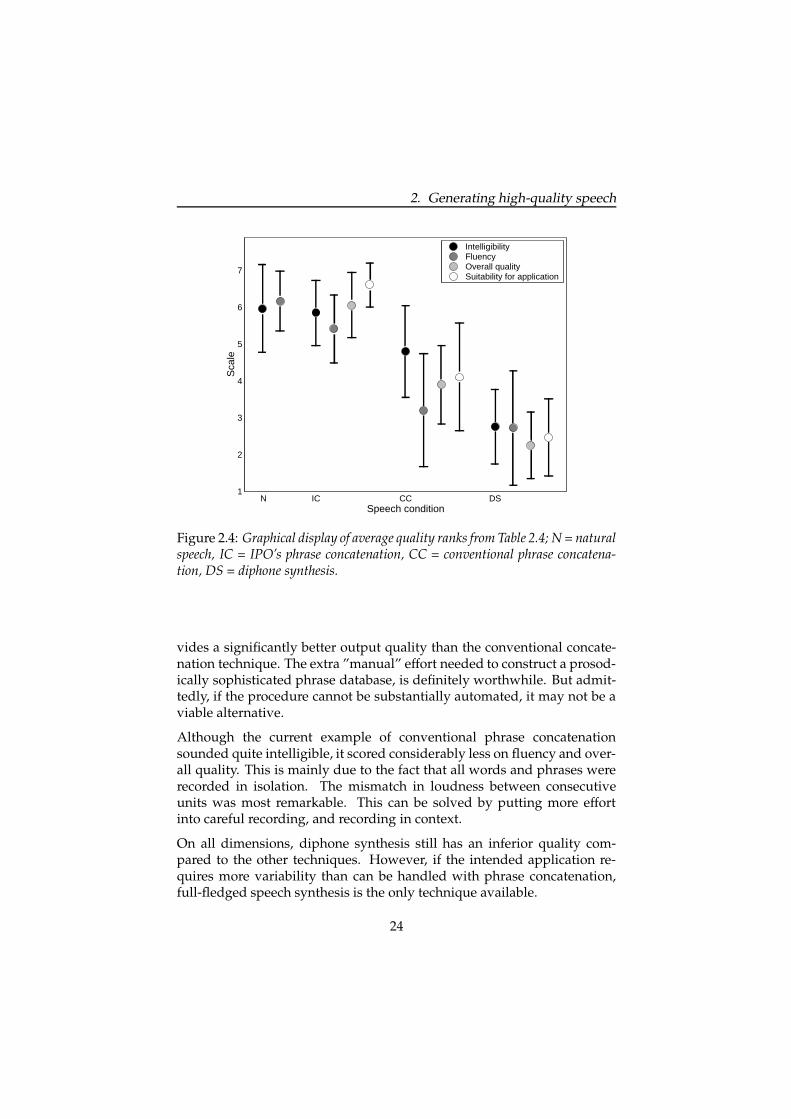
Table 2.4 displays the average values for each of the four subjective qualityratings and each of the four speech output conditions. In Figure 2.4, theseare displayed graphically together with the standard deviations to makethe differences better quantifiable. The ratings for each speech conditionfor intelligibility, overall quality and suitability for the application have 20data points, one for each subject. For fluency, the number of data points is100, as each subject gives a value for 5 fragments in each speech condition.
22

2.4. Evaluation
Speech output techniques Word error rate (%)N 3.5IC 3.5CC 6.0DS 14.5
Table 2.3: Word error rate (percentages of items transcribed incorrectly) in thetranscription of station names. The total number of station names transcribedper speech output condition is 200 (5 fragments x 2 stations x 20 participants);N = natural speech, IC = IPO’s phrase concatenation, CC = conventional phraseconcatenation, DS = diphone synthesis.
Number of N IC CC DSobservations
Intelligibility 20 5.95 5.85 4.80 2.75Fluency 100 6.16 5.41 3.19 2.72Overall quality 20 n/a 6.05 3.90 2.25Suitability for application 20 n/a 6.60 4.10 2.45
Table 2.4: Average quality ranks on a 7-point scale for all speech output condi-tions; 1 = low, 7 = high.
Overall quality and suitability for application were not tested for naturalspeech, but we may safely assume that this form of speech output wouldreceive near maximal scores on these dimensions. IPO’s phrase concate-nation clearly is the best alternative. Diphone synthesis performs worston all dimensions.
T-tests for independent samples were conducted for pairs of speech con-ditions to test whether the difference in means was significant. This wasdone for all four questions. The motivation for choosing this type of testlies in the fact that the fragments in each speech condition are not identical.All but two contrasts were significantly different. The difference betweenN and IC in terms of intelligibility proved to be insignificant (t(38) = 0.303,p � 0.05). Additionally, the difference between CC and DS in terms offluency proved to be insignificant (t(38) = 1.158, p � 0.05).
2.4.4 Conclusion
This experiment has given quantitative evidence that the quality of IPO’sphrase concatenation approximates that of natural speech. It clearly pro-
23
2. Generating high-quality speech
N IC CC DS 1
2
3
4
5
6
7
Speech condition
Sca
le
Intelligibility Fluency Overall quality Suitability for application
Figure 2.4: Graphical display of average quality ranks from Table 2.4; N = naturalspeech, IC = IPO’s phrase concatenation, CC = conventional phrase concatena-tion, DS = diphone synthesis.
vides a significantly better output quality than the conventional concate-nation technique. The extra ”manual” effort needed to construct a prosod-ically sophisticated phrase database, is definitely worthwhile. But admit-tedly, if the procedure cannot be substantially automated, it may not be aviable alternative.
Although the current example of conventional phrase concatenationsounded quite intelligible, it scored considerably less on fluency and over-all quality. This is mainly due to the fact that all words and phrases wererecorded in isolation. The mismatch in loudness between consecutiveunits was most remarkable. This can be solved by putting more effortinto careful recording, and recording in context.
On all dimensions, diphone synthesis still has an inferior quality com-pared to the other techniques. However, if the intended application re-quires more variability than can be handled with phrase concatenation,full-fledged speech synthesis is the only technique available.
24
2.5. Discussion
2.5 Discussion
In this chapter, it was shown that IPO’s advanced technique for concate-nating words and phrases while taking the prosodic context into accountresults in a quality of speech output that is hardly inferior to naturalspeech. Indeed, it appeared significantly superior to a simple concate-nation scheme as used in many commercial information services. For thespeech output in the German train timetable system (Aust, Oerder, Sei-de, and Steinbiss, 1995) an alternative version was implemented usingour phrase concatenation approach. Although no formal evaluation tookplace, the improvement was clear (see Appendix C for examples).
This advanced approach to phrase concatenation that relies on a largenumber of prosodic variants is only feasible for applications in which thevocabulary is medium-sized and relatively stable, so that recordings onlyhave to be made once. The risk with making additional recordings is thatrecording conditions may change, in terms of the voice characteristics ofthe speaker, the recording level, etc. At present, the largest drawback ofour approach is that constructing the recording script and excising all nec-essary words and phrases manually is very time-consuming. In order toautomate the design of the script for recording the necessary units in theappropriate context, an expert system is needed. This system has to makesure that coarticulation at unit boundaries is minimised such that unitscan be easily excised. But more importantly, it should know about rule-based variation in intonation that determines what prosodic variants haveto be recorded and what the best carrier sentences are. Automation of thesegmentation task is possible, but is often inaccurate in its predictions, sothat manual correction has to be performed afterwards.
In the present version of OVIS, phrase concatenation is still a realistic op-tion. But if the domain were extended to include, for instance, all bus sta-tions in the Netherlands, this technique would become impracticable. Themain bottleneck lies in the amount of speech a speaker can utter in a con-stant manner. Some domains, such as cinema or theatre information, havea vocabulary that is constantly changing. In these cases, speech synthesisis the only available alternative. Diphone synthesis, however, is still far re-moved from the quality expected by customers of an information system.Therefore, we concentrate our efforts on improving this technique.
25

2. Generating high-quality speech
26

Chapter 3Reducing audible spectraldiscontinuities1
3.1 Introduction
One well-known problem with concatenative synthesis is the occurrenceof audible discontinuities at concatenation points, which are most promi-nent in vowels and semi-vowels. It is due to variability in the pronunci-ation of these sounds which is caused by the phonetic/prosodic context.
Discontinuities are caused by mismatches in F0, phase or spectral en-velopes across concatenation points (Dutoit, 1997). In Calipso, F0 mis-matches are avoided by monotonising the diphones before storing themin the database. Phase mismatches are avoided by using a method calledphase synthesis for re-synthesis of the nonsense words (Gigi and Vogten,1997). Phase synthesis is based on accurate measurements of the mixtureof periodic and noise information in speech. The input speech is anal-ysed pitch-synchronously like in TD-PSOLA, but the pitch periods are es-timated more precisely by means of ’first-harmonic filtering’. This formsthe basis of a Discrete Fourier Transform (DFT), providing exact amplitudeand phases for all harmonics. It uses overlap-and-add over two pitch pe-riods. The signal is reconstructed by means of an amplitude and a phasevalue for each harmonic. Because the harmonics are added with coherentphases, phase mismatches are avoided.
1Part of this chapter is presented in Klabbers and Veldhuis (1998)
27

3. Reducing audible spectral discontinuities
0.00 0.01 0.02 0.03 0.04 0.05 0.06 0.07 0.08 0.09 0.10 0.11 0.12 0.13Time (s)
010
0020
0030
0040
0050
00
Fre
quen
cy (
Hz)
Figure 3.1: Spectrogram for the vowel /u/ in the synthesised Dutch word doek.A considerable mismatch in F2 between the left and right half of the phonemeis visible. The sudden transition at the concatenation point causes an audiblediscontinuity.
Spectral mismatch is still a major problem, though. As an example, con-sider Figure 3.1, which shows the spectrogram for the vowel /u/ in thesynthesised Dutch word doek (consisting of the diphones /du/ + /uk/).It reveals a considerable mismatch in F2 between the first and second halfof the phoneme. An audible discontinuity was clearly present (see Ap-pendix C). This, along with other informal observations, suggests thatspectral mismatch is the main cause for the occurrence of audible discon-tinuities.
In order to solve the problem of spectral mismatch, several solutions havebeen proposed. One approach is to use larger units such as demi-syllablesor triphones. However, this does not solve the problem, as discontinuitiescontinue to occur albeit less frequently. Moreover, the inventory size in-creases drastically. As Olive et al. (1998) point out, in American Englishassuming a 43-phone alphabet, at least 70,000 of the theoretical maximumof 79,507 triphones actually occur in the language. Even when incorpo-rating all these units, smooth joins are not guaranteed as all triphones canoccur in different contexts with strong coarticulatory effects that can evenspan word boundaries.
Another approach is to vary the location of the cutting point in the non-sense words dependent on the context (Conkie and Isard, 1997). This callsfor a spectral distance measure that correctly represents the amount ofspectral mismatch. Moreover, the short-term spectral envelopes are not
28
3.2. Analysis of the problem
constant over time, resulting for instance in non-flat formant trajectories.Figure 3.1, along with many other observations in our database, showsthat formant trajectories can be fairly flat throughout a vowel when theyare embedded in symmetrical nonsense words.
A third approach is to perform smoothing by means of waveform interpo-lation, spectral-envelope interpolation or formant trajectory smoothing. Itrequires specific signal representations that allow these types of opera-tions. The disadvantage of formants as a representation is that they arevery difficult to estimate reliably. Waveform and spectral envelope inter-polation have the disadvantage that smooth transitions are often achievedat the expense of naturalness (Dutoit, 1997). Examples of signal repre-sentations that allow waveform interpolation are Multi-Band Resynthe-sis Overlap-and-Add (MBROLA, Dutoit (1997)) and Harmonic plus NoiseModeling (HNM, Stylianou, Dutoit, and Schroeter (1997)). Chappell andHansen (1998) present several different techniques for spectral smoothing,none of which they found really satisfactory.
A fourth approach is to include context-sensitive or specialised units inthe database (Olive et al., 1998). This implies that one knows which con-texts can be clustered so as to keep the inventory size within bounds. Ourinvestigation is aimed at gaining insight in this approach. In this chapter,we first present a detailed analysis of the occurrence of audible disconti-nuities in our diphone database (Section 3.2). The aim of the study was tofind an objective spectral distance measure that best predicts when discon-tinuities are audible. Therefore, we correlated the results of a perceptualexperiment with several distance measures. In Section 3.3 we propose asolution to reduce the occurrence of audible discontinuities by extendingthe diphone database with context-sensitive diphones. The number of ad-ditional diphones is limited by clustering similar contexts on the basis ofthe best performing distance measure.
3.2 Analysis of the problem
3.2.1 Perceptual experiment
The first step in our analysis was to find out to what extent audible dis-continuities occur in our diphone database. This was established via a per-ceptual experiment. IPO’s speech-synthesis system Calipso currently uses
29
3. Reducing audible spectral discontinuities
diphones as concatenative units from a professional female speaker. Theyhave been excised from nonsense words. For instance, consonant-vowel(CV) and vowel-consonant (VC) diphones are excised from symmetricalnonsense words of the form C@CVC@. In order to reduce the data setto manageable proportions, this study was restricted to five Dutch vow-els in this database, i.e., the vowels /a/, /i/, /A/, /I/, /u/. The vowels/a/, /i/, and /u/ were chosen because they cover the extremes in thevowel space. The vowels /A/ and /I/ are chosen because they are theshort counterparts for /a/ and /i/. A study by Van den Heuvel, Cra-nen, and Rietveld (1996) has shown that coarticulation is speaker-specific.Therefore, it should be noted here that the results presented in this chap-ter only reflect the coarticulatory behaviour of the speaker of our diphonedatabase.
Material
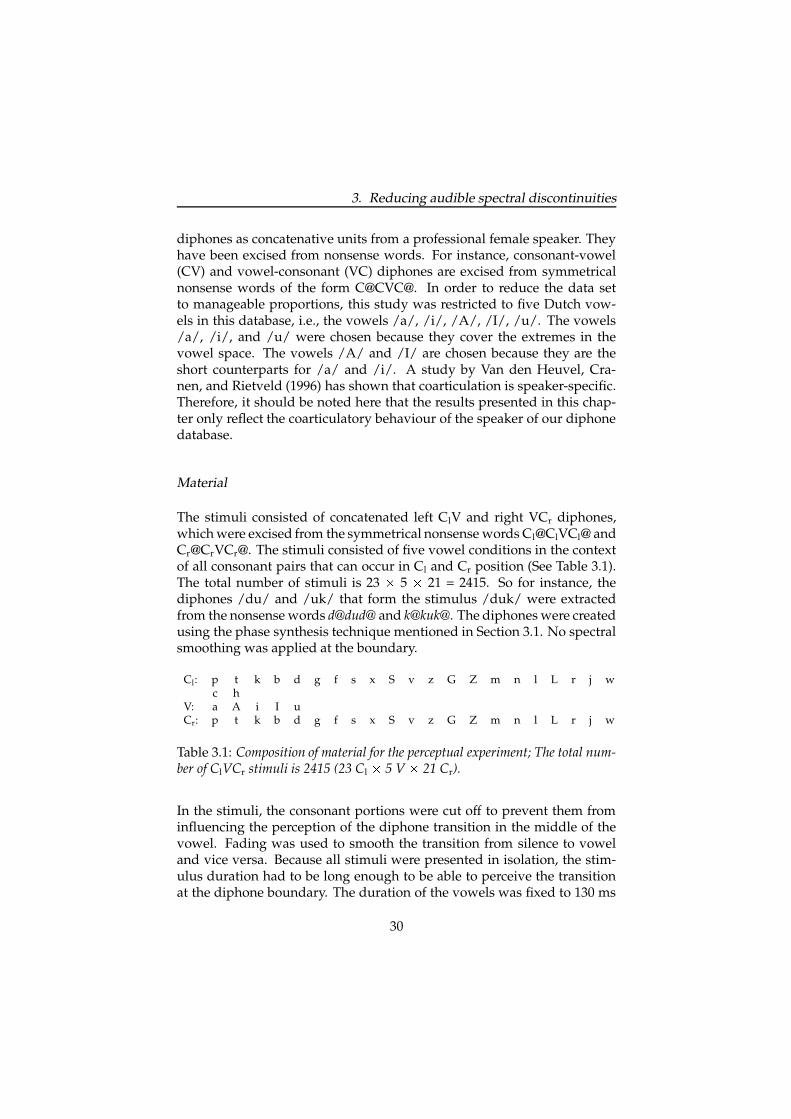
The stimuli consisted of concatenated left ClV and right VCr diphones,which were excised from the symmetrical nonsense words Cl@ClVCl@ andCr@CrVCr@. The stimuli consisted of five vowel conditions in the contextof all consonant pairs that can occur in Cl and Cr position (See Table 3.1).The total number of stimuli is 23 � 5 � 21 = 2415. So for instance, thediphones /du/ and /uk/ that form the stimulus /duk/ were extractedfrom the nonsense words d@dud@ and k@kuk@. The diphones were createdusing the phase synthesis technique mentioned in Section 3.1. No spectralsmoothing was applied at the boundary.
Cl: p t k b d g f s x S v z G Z m n l L r j wc h
V: a A i I uCr: p t k b d g f s x S v z G Z m n l L r j w
Table 3.1: Composition of material for the perceptual experiment; The total num-ber of ClVCr stimuli is 2415 (23 Cl
� 5 V � 21 Cr).
In the stimuli, the consonant portions were cut off to prevent them frominfluencing the perception of the diphone transition in the middle of thevowel. Fading was used to smooth the transition from silence to voweland vice versa. Because all stimuli were presented in isolation, the stim-ulus duration had to be long enough to be able to perceive the transitionat the diphone boundary. The duration of the vowels was fixed to 130 ms
30
3.2. Analysis of the problem
with the diphone boundary located exactly in the middle of the vowel.The signal power of the second diphone was scaled to match that of thefirst diphone. In some cases the influence of the first consonant persistedin a large part of the vowel. It proved impossible to remove it withoutlosing too much of the vowel. These cases were discarded, leaving 2284stimuli to be judged in the perceptual experiment.
Procedure
Five participants with a background in psycho-acoustics or phoneticsparticipated in the perceptual experiment. It was a within-subjects de-sign meaning that each subject received all stimuli in random order. Foreach stimulus, the participants had to judge the transition at the diphoneboundary as either smooth (0) or discontinuous (1). The experiment wasdivided into three hourly sessions which were held on different days, witha short break halfway through each session. The session order was dif-ferent for all participants. The experiment started with a training phasein which two stimuli were presented for each vowel, one being clearlysmooth and the other being clearly discontinuous (see Appendix C).
Results
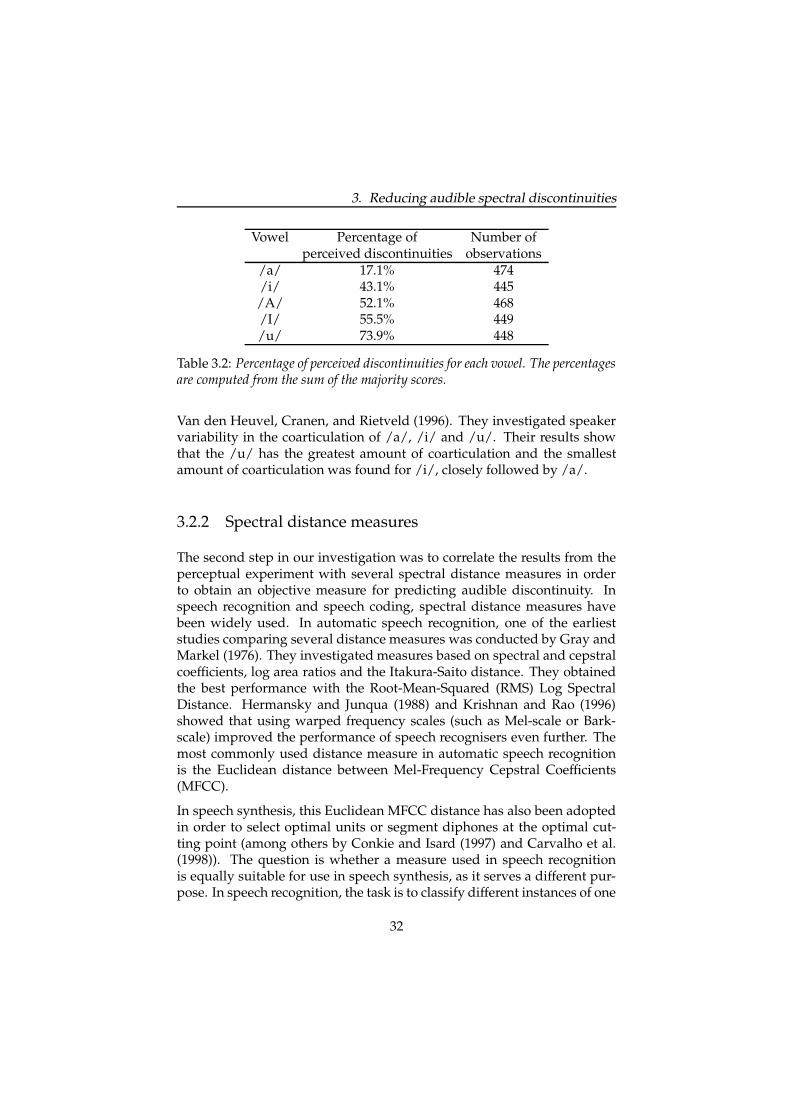
The participants found the task difficult, but felt they had been able tomake consistent decisions after the training phase. As a consistency check,we presented two stimuli, one clearly smooth, the other clearly discontin-uous, ten times at random positions in the total stimulus list. All par-ticipants were 100% consistent in their scoring of these two stimuli. Be-tween participants there was more variability, as some participants ap-plied a stricter threshold than others. In order to reduce the variabilitybetween participants, a majority score was calculated, i.e., a stimulus wasmarked as discontinuous when four out of five listeners perceived it assuch. Summing the majority scores obtained in the experiment for eachof the vowels, we get the percentage of perceived discontinuities as pre-sented in Table 3.2.
The results show that the number of audible discontinuities is particularlyhigh for /u/ and comparatively low for /a/. Our results additionallyreveal a slightly better score for the long vowels /a/ and /i/ than for theshort vowels /A/, /I/ and /u/. This is partly in line with findings by
31
3. Reducing audible spectral discontinuities
Vowel Percentage of Number ofperceived discontinuities observations
/a/ 17.1% 474/i/ 43.1% 445/A/ 52.1% 468/I/ 55.5% 449/u/ 73.9% 448
Table 3.2: Percentage of perceived discontinuities for each vowel. The percentagesare computed from the sum of the majority scores.
Van den Heuvel, Cranen, and Rietveld (1996). They investigated speakervariability in the coarticulation of /a/, /i/ and /u/. Their results showthat the /u/ has the greatest amount of coarticulation and the smallestamount of coarticulation was found for /i/, closely followed by /a/.
3.2.2 Spectral distance measures
The second step in our investigation was to correlate the results from theperceptual experiment with several spectral distance measures in orderto obtain an objective measure for predicting audible discontinuity. Inspeech recognition and speech coding, spectral distance measures havebeen widely used. In automatic speech recognition, one of the earlieststudies comparing several distance measures was conducted by Gray andMarkel (1976). They investigated measures based on spectral and cepstralcoefficients, log area ratios and the Itakura-Saito distance. They obtainedthe best performance with the Root-Mean-Squared (RMS) Log SpectralDistance. Hermansky and Junqua (1988) and Krishnan and Rao (1996)showed that using warped frequency scales (such as Mel-scale or Bark-scale) improved the performance of speech recognisers even further. Themost commonly used distance measure in automatic speech recognitionis the Euclidean distance between Mel-Frequency Cepstral Coefficients(MFCC).
In speech synthesis, this Euclidean MFCC distance has also been adoptedin order to select optimal units or segment diphones at the optimal cut-ting point (among others by Conkie and Isard (1997) and Carvalho et al.(1998)). The question is whether a measure used in speech recognitionis equally suitable for use in speech synthesis, as it serves a different pur-pose. In speech recognition, the task is to classify different instances of one
32
3.2. Analysis of the problem
and the same phoneme as belonging to the same target phoneme, whereasin speech synthesis the task is to distinguish these instances when theirspectra are perceptually different. Therefore, it should be investigatedwhether some distance measures can be found that correspond to humanperception in that they are able to distinguish perceptually relevant differ-ences in spectra (Van Santen, 1997).
An investigation that ran parallel to ours (Wouters and Macon, 1998; Ma-con, Cronk, and Wouters, 1998), also aimed at performing a perceptualevaluation of distance measures in the context of speech synthesis. Intheir study, listeners had to judge the difference between a pair of stim-uli on a scale from zero to five. One stimulus was the reference stimulusproduced by a diphone synthesis system, the other stimulus was alteredin that the first (c.q. second) half of the vowel phoneme was replacedby a different instance of the vowel preceded (c.q. followed) by a conso-nant from the same class as the original. Five feature representations werestudied: FFT-based cepstra, LPC-based cepstra, Line Spectral Frequencies(LSF), Log Area Ratios (LAR) and a symmetrised Itakura distance. All butthe FFT-based cepstra were computed from LPC coefficients. The featurerepresentations were computed in three ways: 1) using the FFT ampli-tude spectrum, 2) using a perceptual spectrum (PLP, Hermansky (1990)),3) using a Mel-warped spectrum. Correlations between the average of thelisteners’ responses and the distance measures were computed and thencombined into a population correlation using Fisher’s z-transform. Corre-lations were not particularly high, reaching from 0.28 for the linear log arearatio to 0.50 for the linear Itakura distance. PLP and Mel-scale improvedthe correlations, but the improvement from PLP to Mel was not signifi-cant. Using a weighted Euclidean distance improved the linear measures,but only slightly for PLP and Mel. Delta features gave only a small in-crease in correlation (0.02). The best correlation was obtained for Mel cep-stra with delta features (0.66), where it did not make a difference whetherthese were computed from FFT or LPC coefficients.
The measures used in this thesis are taken from various fields of research.They were used to determine distances between spectral envelopes acrossdiphone boundaries. The following spectral distance measures were used.They will be explained in more detail below.
1. The Euclidean distance between (F1, F2) pairs, or the Euclidean For-mant Distance (DEFD), which is often used in phonetics.
2. The Kullback-Leibler distance (DKL), which originates from the field
33
3. Reducing audible spectral discontinuities
of statistics.
3. The Partial Loudness DPL, which comes from the area of sound per-ception.
4. The Euclidean distance between Mel-Frequency Cepstral Coeffi-cients (DMFCC), which comes from automatic speech recognition.
5. The Likelihood Ratio (DLR), which is used in speech coding and au-tomatic speech recognition.
6. The Mean-Squared Log-Spectral Distance (DMSLSD), which alsocomes from automatic speech recognition.
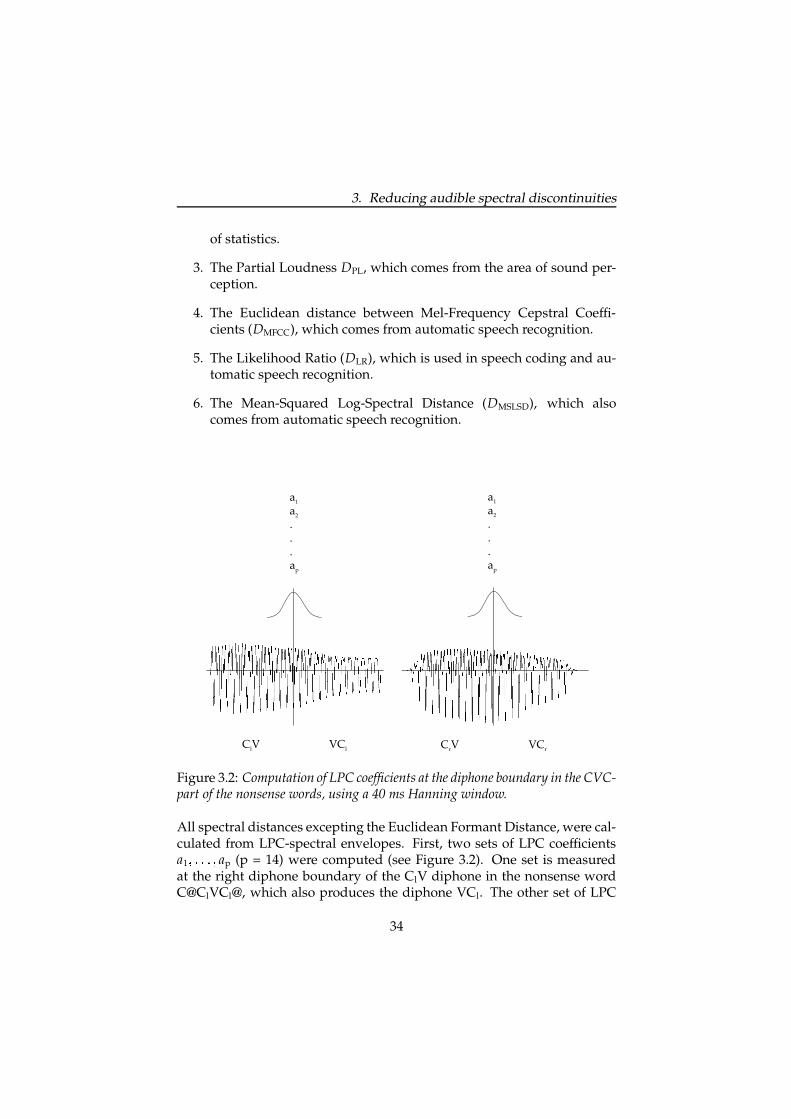
ClV VCl CrV VCr
a1 a2 . . . ap
a1 a2 . . . ap
Figure 3.2: Computation of LPC coefficients at the diphone boundary in the CVC-part of the nonsense words, using a 40 ms Hanning window.
All spectral distances excepting the Euclidean Formant Distance, were cal-culated from LPC-spectral envelopes. First, two sets of LPC coefficientsa1 ��������� ap (p = 14) were computed (see Figure 3.2). One set is measuredat the right diphone boundary of the ClV diphone in the nonsense wordC@ClVCl@, which also produces the diphone VCl. The other set of LPC
34

3.2. Analysis of the problem
coefficients is measured at the left diphone boundary of the VCr diphonein the nonsense word C@CrVCr@, which also produces the diphone CrV.From those LPC coefficients, two power spectra were computed at suffi-ciently many equidistant points (in our case 512), which were arrangedin a vector. These two vectors were normalised by dividing them by thesum of the elements. This gives two power-normalised spectral envelopesP( � ) of ClV and Q( � ) of VCr. Equation 3.1 displays the computation of thepower-normalised spectral envelope P( � ), where K = constant, such that�
P( � )d ��� 1. The distance measures will be discussed in more detail inthe following paragraphs.
P( � ) � K�1 � a1e � j � � a2e � 2 j � ����� ape � p j � � 2 � (3.1)
Euclidean Formant Distance
In phonetics, it is quite common to describe coarticulation in terms ofchanges in the formants F1 and F2 (Van den Heuvel et al., 1996; Olive et al.,1998). In this investigation, the formants were measured automatically atthe diphone boundary in the vowel using Praat (Boersma and Weenink,1996). Close inspection of the stimuli reveals that most formant trajectoriesare fairly stationary throughout the vowel, except when the surroundingconsonants are the alveolars /j/, /J/, /c/, /S/ and /Z/.
Figure 3.3 displays the F1 and F2 values for the five vowels measured inour diphone database at the indicated locations. It shows that the /a/,/i/ and /I/ have small variations, whereas the /A/ and /u/ seem to beaffected to a greater extent by their surrounding consonants. For the /u/,differences in F2 are considerable. They can be as large as 700 Hz. Forthe /A/, differences in F1 are also considerable. The /i/ and /I/ are veryclose to each other in the vowel space. All formant frequencies were trans-formed to a Mel-scale which is more in line with the hearing process thana linear frequency scale. For the Mel transformation we used Equation 3.2(Makhoul and Cosell, 1976).
m � 2595log(1 � f700
) (3.2)
The Euclidean Formant Distance is calculated by Equation 3.3.
DEFD(l � r) ��� (F1 l � F1 r)2 � (F2 l � F2 r)2� (3.3)
35
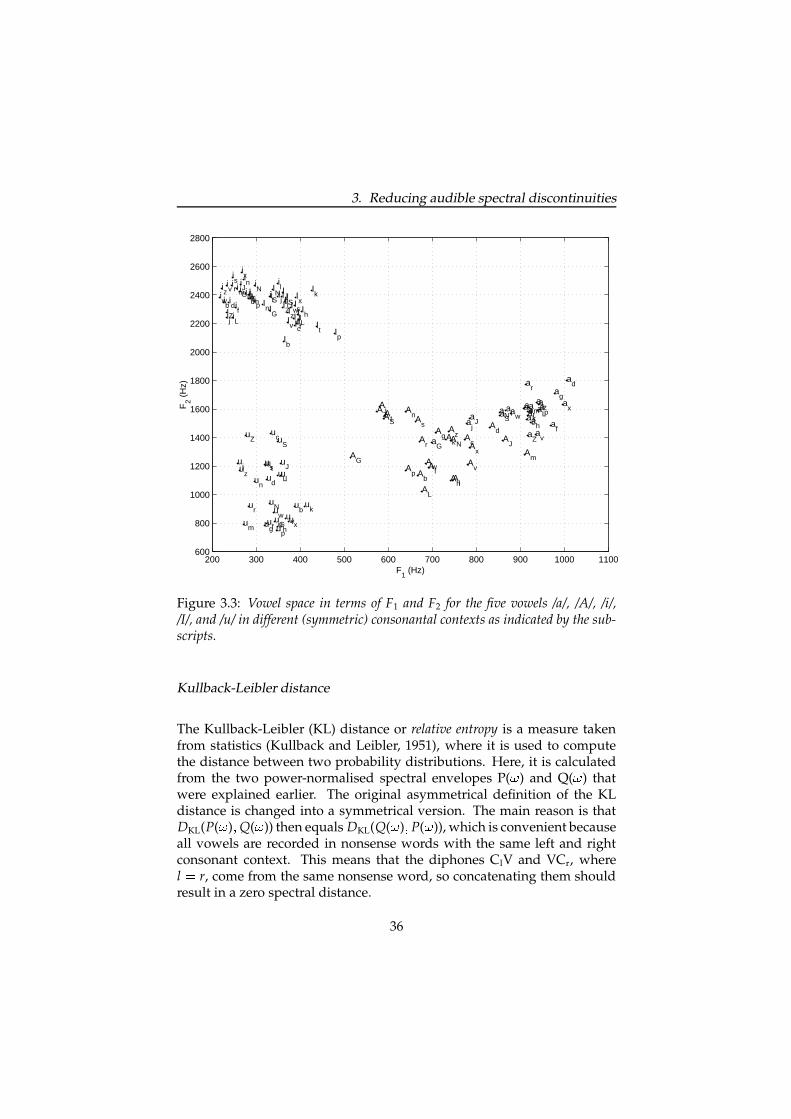
3. Reducing audible spectral discontinuities
200 300 400 500 600 700 800 900 1000 1100600
800
1000
1200
1400
1600
1800
2000
2200
2400
2600
2800
aG
aLa
NaS
aZ
ab
ad
af
ag
aha
j
ak
al
am
aJ
an a
p
ar
as
ac
at
av
aw
ax
az
AG
AL
AN
AS
AZ
Ab
Ad
Af
Ag
Ah
Aj
Ak
Al
Am
AJ
An
Ap
Ar
As
Ac
At
Av
Aw
Ax
Az
iG
iL
iN
iS
iZ
ibidi
f
ig
ih
ij
ik
ili
miJin
ip
ir
is
ic
it
iv
iw
ix
iz
IG I
L
IN I
SIZ
Ib
IdIf
Ig
Ih
Ij
Ik
Il
Im
IJ
In
Ip
Ir I
s
Ic I
tIv
Iw
Ix
Iz
uG
uL
uN
uS
uZ
ub
ud
ufu
g uh
uj
uk
ul
um
uJ
un
up
ur
us
uc
ut
uv
uw u
x
uz
F1 (Hz)
F2 (
Hz)
Figure 3.3: Vowel space in terms of F1 and F2 for the five vowels /a/, /A/, /i/,/I/, and /u/ in different (symmetric) consonantal contexts as indicated by the sub-scripts.
Kullback-Leibler distance
The Kullback-Leibler (KL) distance or relative entropy is a measure takenfrom statistics (Kullback and Leibler, 1951), where it is used to computethe distance between two probability distributions. Here, it is calculatedfrom the two power-normalised spectral envelopes P( � ) and Q( � ) thatwere explained earlier. The original asymmetrical definition of the KLdistance is changed into a symmetrical version. The main reason is thatDKL(P( � ) � Q( � )) then equals DKL(Q( � ) � P( � )), which is convenient becauseall vowels are recorded in nonsense words with the same left and rightconsonant context. This means that the diphones ClV and VCr, wherel � r, come from the same nonsense word, so concatenating them shouldresult in a zero spectral distance.
36

3.2. Analysis of the problem
The KL distance has the important property that it emphasises differencesin spectral regions with high energy more than differences in spectral re-gions with low energy. Thus, spectral peaks are emphasised more thanvalleys between the peaks and low frequencies are emphasised more thanhigh frequencies, due to the 6 dB/octave declination in spectral energythat results from the combination of the damping of the high frequencycomponents in the signal (-12 dB/octave) and the radiation at the mouth(+6 dB/octave). The definition for DKL(P� Q) is given in Equation 3.4.
DKL(P� Q) � �(P( � ) � Q( � )) log � P( � )
Q( � ) � d � � (3.4)
Partial loudness
The partial loudness comes from the area of sound perception. In a studyby Van Dinther, Rao, Veldhuis, and Kohlrausch (1999), partial loudnesswas shown to be a reasonably good predictor for audibility discrimina-tion thresholds. Therefore, it was decided to include this measure tosee how well it would predict audible discontinuity. The partial loud-ness of a signal is the loudness of the signal when presented in a back-ground sound (Moore, Glasberg, and Bear, 1997). The background soundgenerally reduces the loudness of the signal. This effect is called partialmasking. The loudness of a signal in a background sound is thereforecalled partial loudness. In this study, the excitation patterns El and Er atthe ClV and VCr diphone boundaries were computed. These excitationpatterns are decomposed into excitation patterns representing the back-ground sound (min(El � Er)), the total sound (max(El � Er)) and the absolutedifference (
�El
� Er�). The resulting excitation patterns are then fed into
Moore’s partial loudness model.
Mel-Frequency Cepstral Coefficients
In the field of speech recognition, Mel-Frequency Cepstral Coefficients(MFCC) are currently the most commonly used type of signal represen-tation. They provide a successful and efficient way to represent the signalfor the purpose of recognition. The MFCC coefficients were computed asdescribed in Rabiner and Juang (1993), Chapter 4, except that samples ofthe LPC power spectrum (see definition for P( � ) above) were used insteadof the squared magnitudes of the DFT spectrum. Equation 3.5 computesthe Euclidean distance between cepstral coefficients.
37

3. Reducing audible spectral discontinuities
The cepstral coefficients can be interpreted in the following way. The c0
coefficient represents the average energy in the speech frame. It is not in-cluded in the distance measure. c1 reflects the energy balance between lowand high frequencies (or spectral tilt), higher values indicating sonorantsand low values suggesting frication. Higher order cepstral coefficients re-flect increasing spectral detail, but no simple relationship exists betweenthese parameters and formants (Hunt, 1995). In this study, the order p isset to 22.
DMFCC� p
∑k � 1
(ck l � ck r)2� (3.5)
Delta features are estimations of the time derivatives of the static features,thus capturing more of the speech dynamics. Because our stimuli consistof two parts that are both fairly stationary, the addition of delta featureswill not make much difference to the result. In the study presented inWouters and Macon (1998) and Macon, Cronk, and Wouters (1998), theadded effect of delta features was also negligible. The correlation betweenthe distance measure and the perceptual judgements increased with just0.02. Therefore, it was decided not to include delta features in our investi-gation.
Likelihood ratio
The likelihood ratio or Itakura distance, is a measure of spectral similaritybetween two LPC vectors aL and aR, which represent the left and rightdiphones (Itakura, 1975). It indicates how well the analysis filter of theleft diphone matches that of the right diphone. It is defined in terms of anautocorrelation function. VR represents the signal autocorrelation matrixthat gave rise to aR. The likelihood ratio is computed with Equation 3.6taken from Rabiner and Juang (1993), Chapter 4.
DLR(aL � aR) � a�
LVRaL
a�
RVRaR
� 1 � (3.6)
Mean-Squared Log Spectral Distance
The Mean-Squared Log Spectral Distance (MS LSD) is derived from theLog Spectral Distance presented in Rabiner and Juang (1993), Chapter 4and is computed by Equation 3.7. It is similar to the Root-Mean-Squared
38

3.2. Analysis of the problem
(RMS) Log Spectral Distance that performed best in the automatic speechrecognition experiments by Markel and Gray (1976). By taking the loga-rithmic differences between P( � ) and Q( � ), it is expected to better reflectthe hearing process.
DMSLSD� �
(logP( � ) � logQ( � ))2d � � (3.7)
3.2.3 Correlating the results
In order to find out how well the different spectral distance measurescould predict audible discontinuities, it was decided to use Receiver Oper-ator Characteristic curves (Luce and Krumhansl, 1988), coming from sig-nal detection theory. The procedure works as follows. In order to corre-late the measures with the scores of the listeners, two probability densityfunctions p(D
�0) and p(D
�1) are estimated from the data, representing the
probability of a spectral distance (D) given that the transition was markedby the listeners as continuous (0) or discontinuous (1), respectively. For acertain threshold
�, the probability of a false alarm, the case that a transi-
tion is wrongly classified as discontinuous, is PF(�
) (see Equation 3.8) andthe probability of a hit, the correct detection of a discontinuity, is PD(
�) (see
Equation 3.9).
PF(�
) � ���� p(D
�0)dD � (3.8)
PD(�
) � � �� p(D
�1)dD � (3.9)
The probability of a miss, the case that a discontinuity goes undetected, is1 - PD and the probability of a correct rejection, the case that a transition isrightly classified as being smooth, is 1 - PF. Since these are directly deriv-able from the hit and false alarm probabilities, they are not relevant here.
A plot of pairs (PD(�
) � PF(�
)) for all values of�
constitutes a Receiver Op-erating Characteristic (ROC) curve. See Figure 3.4 for a schematic repre-sentation of ROC curves. In this experiment, we assumed that the partic-ipants were correct in their judgements. The question is then how well aspectral distance measure can predict the participants’ judgements. ROCcurves are always upward concave. The straight line represents the chancelevel meaning that a measure gives no information. The further the curveextends to the upper left corner, the better the measure serves as a predic-tor. This indicates that the two probability density functions p(D
�0) and
p(D�1) are moving away from each other, thus increasing the hit rate and
39

3. Reducing audible spectral discontinuities
(falsealarm)
.6 .8.2 .4 1
.2
.4
.6
.8
1
0
β5
β6
β7
β4
β3β2
β1
P F
P D
falsealarm
correctrejection
p(D|0),p(D|1)
β1 β2 β3 β6β5 β7β4
p(D|0)
continuous
p(D|1)
discontinuous
(hit
)
hitmiss
D
Figure 3.4: Principle of Receiver Operating Characteristic curves. The left paneldisplays two probability density functions p(D
�0) and p(D
�1), for the distribu-
tion of distances given that the participants have judged a stimulus as smoothand discontinuous, respectively. The right panel displays a Receiver OperatorCharacteristic curve, formed by plotting the false alarm probabilities against thehit probabilities for different threshold values
�.
decreasing the false alarm rate. We do not have to decide on an appro-priate threshold in this study, since the purpose of the analysis is solelyto determine the best performing distance measure relative to the othermeasures.
3.2.4 Results
Figure 3.5 displays five ROC curves per distance measure, one for eachvowel. Their inspection leads to a number of interesting observations.First, it can be observed that the KL and PL distances perform equallywell for all vowels, whereas the divergence between vowels is greater forthe other measures.
40

3.2. Analysis of the problem
Second, it can be seen that the Euclidean Formant Distance performs wellfor /u/, bad for /a/ and moderately well for the other vowels. This isunderstandable as Figure 3.3 showed that /u/ had the largest degree ofvariation in the second formant. Extending the distance with F3 and F4
did not enhance the measure in any way. It was decided not to includeformant bandwidths in the distance measure. As listed in Rabiner andJuang (1993) the just-noticeable-difference (jnd) for formant bandwidths ismuch larger (20-40%) than for formant frequencies (3-5%). It was thereforenot expected to add much to the performance of the EFD.
Figure 3.6 displays six ROC curves per vowel, one for each distance mea-sure. Here, it can clearly be seen that all spectral distance measures per-form almost equally well for the /u/, whereas the divergence betweenthem is much larger for the other vowels.
The Euclidean distance between Mel-Frequency Cepstral Coefficients isconsistently among the worst predictors of audible discontinuity. In somecases, it is barely above chance level. This is a surprising result, becauseuntil now it was a commonly used distance measure for this task. How-ever, its bad performance is understandable when we consider that thismeasure is almost standard as a distance measure in automatic speechrecognition, where its task is to group together different allophones of aphoneme instead of distinguishing them when their spectral characteris-tics lead to perceptual differences.
Two measures are always positioned in the most upper left corner,meaning that they always performed best, the Partial Loudness and theKullback-Leibler distance. Apparently, they correlate well with humanperception. The fact that the relatively simple Euclidean Formant Distanceonly performs well for /u/ but not as well for other vowels, indicates thatcoarticulation affects the vowels differently. It could be that coarticulationhas a larger effect on the formants for /u/, whereas in the other vowels itmanifests itself in other ways, e.g., via changes in spectral tilt. Addition-ally, the fact that the KL and PL distances are good predictors of audiblediscontinuity for all vowels, shows that there is systematic variation in thesignal due to coarticulation that these measures capture. Because the KLdistance is much easier and faster to compute than the PL distance, it willbe used in the remainder of this study.
41
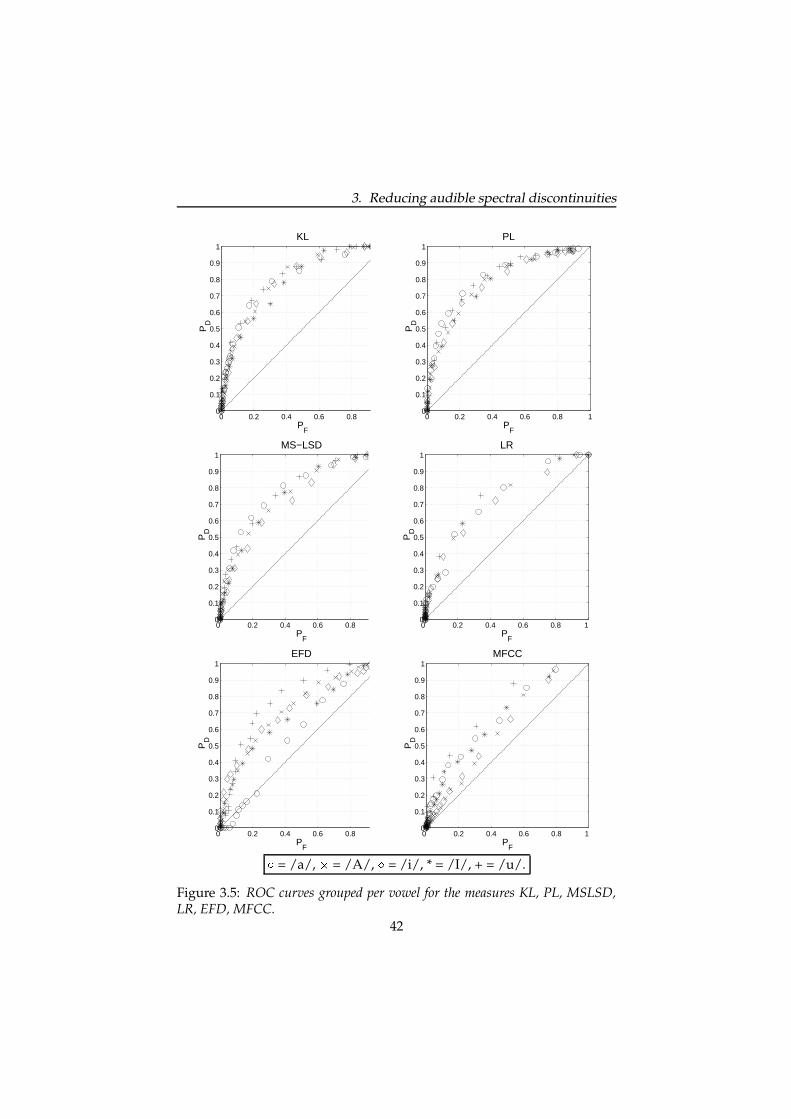
3. Reducing audible spectral discontinuities
0 0.2 0.4 0.6 0.8 10
0.1
0.2
0.3
0.4
0.5
0.6
0.7
0.8
0.9
1
PF
PD
KL
0 0.2 0.4 0.6 0.8 10
0.1
0.2
0.3
0.4
0.5
0.6
0.7
0.8
0.9
1
PF
PD
PL
0 0.2 0.4 0.6 0.8 1 0
0.1
0.2
0.3
0.4
0.5
0.6
0.7
0.8
0.9
1
PF
PD
MS−LSD
0 0.2 0.4 0.6 0.8 1 0
0.1
0.2
0.3
0.4
0.5
0.6
0.7
0.8
0.9
1
PF
PD
LR
0 0.2 0.4 0.6 0.8 1 0
0.1
0.2
0.3
0.4
0.5
0.6
0.7
0.8
0.9
1
PF
PD
EFD
0 0.2 0.4 0.6 0.8 1 0
0.1
0.2
0.3
0.4
0.5
0.6
0.7
0.8
0.9
1
PF
PD
MFCC
� = /a/, � = /A/, � = /i/, * = /I/, + = /u/.
Figure 3.5: ROC curves grouped per vowel for the measures KL, PL, MSLSD,LR, EFD, MFCC.
42
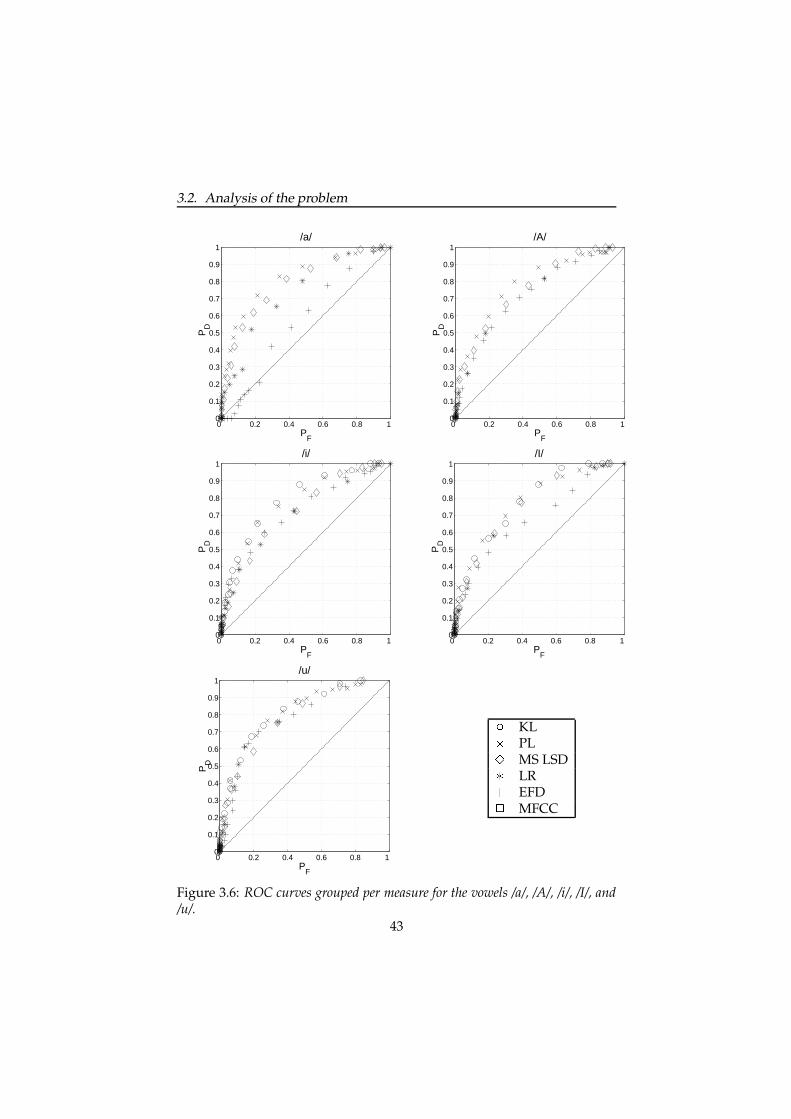
3.2. Analysis of the problem
0 0.2 0.4 0.6 0.8 1 0
0.1
0.2
0.3
0.4
0.5
0.6
0.7
0.8
0.9
1
PF
PD
/a/
0 0.2 0.4 0.6 0.8 1 0
0.1
0.2
0.3
0.4
0.5
0.6
0.7
0.8
0.9
1
PF
PD
/A/
0 0.2 0.4 0.6 0.8 1 0
0.1
0.2
0.3
0.4
0.5
0.6
0.7
0.8
0.9
1
PF
PD
/i/
0 0.2 0.4 0.6 0.8 1 0
0.1
0.2
0.3
0.4
0.5
0.6
0.7
0.8
0.9
1
PF
PD
/I/
0 0.2 0.4 0.6 0.8 1 0
0.1
0.2
0.3
0.4
0.5
0.6
0.7
0.8
0.9
1
PF
PD
/u/
� KL� PL
�MS LSD
� LR� EFD�
MFCC
Figure 3.6: ROC curves grouped per measure for the vowels /a/, /A/, /i/, /I/, and/u/.
43
3. Reducing audible spectral discontinuities
3.3 A solution to the problem
3.3.1 Clustering procedure
In order to reduce the number of audible discontinuities, we propose toextend the diphone database with context-sensitive diphones. One wayof keeping the inventory size within bounds is to cluster contexts that arespectrally alike according to a distance measure. In this part of the study,the KL distance is used for this purpose. Suppose we divide the diphonesets ClV (l � 1 ��������� M) and VCr (r � 1 ��������� M), for a particular vowel V intotwo sets of N clusters
�L(V)1 ������� � L(V)N � and
�R(V)1 ������� � R(V)N � , such
that the maximum KL distance across diphone boundaries in correspond-ing clusters L(V)k and R(V)k (k � 1 ��������� N) is below a threshold
�. The
maximum distance between non-corresponding clusters L(V)k and R(V)l
(k �� l) will then not be limited to�
. We now construct additional clus-ters R(V)l k (k �� l), which contain the diphones of R(V)l, but which arerecorded with a left-side context consisting of a representative diphone inL(V)k, e.g., the diphone closest to the centroid of L(V)k. Instead of concate-nating a diphone from L(V)k with one from R(V)l, a diphone from R(V)l kwill be used, which will reduce the maximum KL distance across diphoneboundaries, which is hopefully lower than
�, although a guarantee can-
not be given in advance. This procedure will increase the number of VCdiphones for a particular vowel by a factor N(
�), which is equal to the
number of clusters.
The number of clusters N(�
) can under certain assumptions statistically berelated to the quality improvement. If the maximum KL distance betweencorresponding clusters is
�, then the total number of transitions between
all corresponding clusters is less or equal than the total number of diphonecombinations with maximum KL distance
�. This is expressed in the right-
hand inequality of Equation 3.10
M2
N(�
)� N(�
)
∑i � 1
m2i
� � �0
p(D)dDM2� (3.10)
with� �
0 p(D)dD being the probability of a distance smaller than�
andM2 being the total number of transitions. It can furthermore be shownthat the total number of transitions between corresponding clusters is al-ways larger than M2 � N(
�). This is expressed in the left-hand inequality
of Equation 3.10. In fact, the minimum is attained when all clusters haveequal sizes.
44
3.3. A solution to the problem
This leads to the following inequality for N(�
):
N(�
)� 1� �
0 p(D)dDdD(3.11)
� 1� �0 (p(D
�0)P
�0 � � p(D
�1)P
�1 � )dD
� (3.12)
This factor can be used as a measure of cost of improvement. After theextension of the diphone inventory, the probability of an audible discon-tinuity occurring, Pclick, can be computed. It constitutes two independentprobabilities, one representing the probability of a discontinuity occurringin a cluster that is not detected (given by P
�1 � [1 � PD(
�)]), and the other
representing the probability of a detected discontinuity occurring betweenthe original left diphone and the newly added right diphone, which is es-timated to be maximally PD(
�)(1 � PD(
�)), assuming that the distance be-
tween the new cluster and the original one is less than�
. Before actualextension of the database, we can compute Pclick by Equation 3.14.
Pclick(�
) � P�1 � [1 � PD(
�) � PD(
�)(1 � PD(
�))] (3.13)� P
�1 � [1 � P2
D(�
)] � (3.14)
Figure 3.7 plots the number of clusters N(�
) against the probability of aclick Pclick. This represents an estimate of the maximum improvement thatcan be obtained by adding a certain number of clusters. The threshold�
can now be chosen according to cost or performance constraints. Fig-ure 3.7 shows that when using three clusters, the probability of an audiblediscontinuity occurring is predicted to maximally decrease from 0.17 to0.04 for /a/, from 0.43 to 0.12 for /i/, from 0.52 to 0.13 for /A/, from 0.55to 0.17 for /I/ and from 0.74 to 0.29 for /u/.
Figure 3.8 illustrates the clustering procedure for the vowel /u/. In our in-vestigation, the maximum number of clusters is restricted to three, whichcontain the same consonantal contexts for left and right diphones. Addingmore than three clusters is not likely to improve synthesis much more.Concatenating /bu/ and /uk/ to make boek is expected to be unproblem-atic, as both consonants come from the same cluster with a small KL dis-tance. However, for the words doek and hoek an audible discontinuity islikely to occur as they come from non-corresponding clusters. In order toremedy this, additional right diphones are recorded with a representativefrom a non-corresponding left cluster. In recording this means that for the/uk/ diphone which was originally recorded in the symmetrical nonsense
45
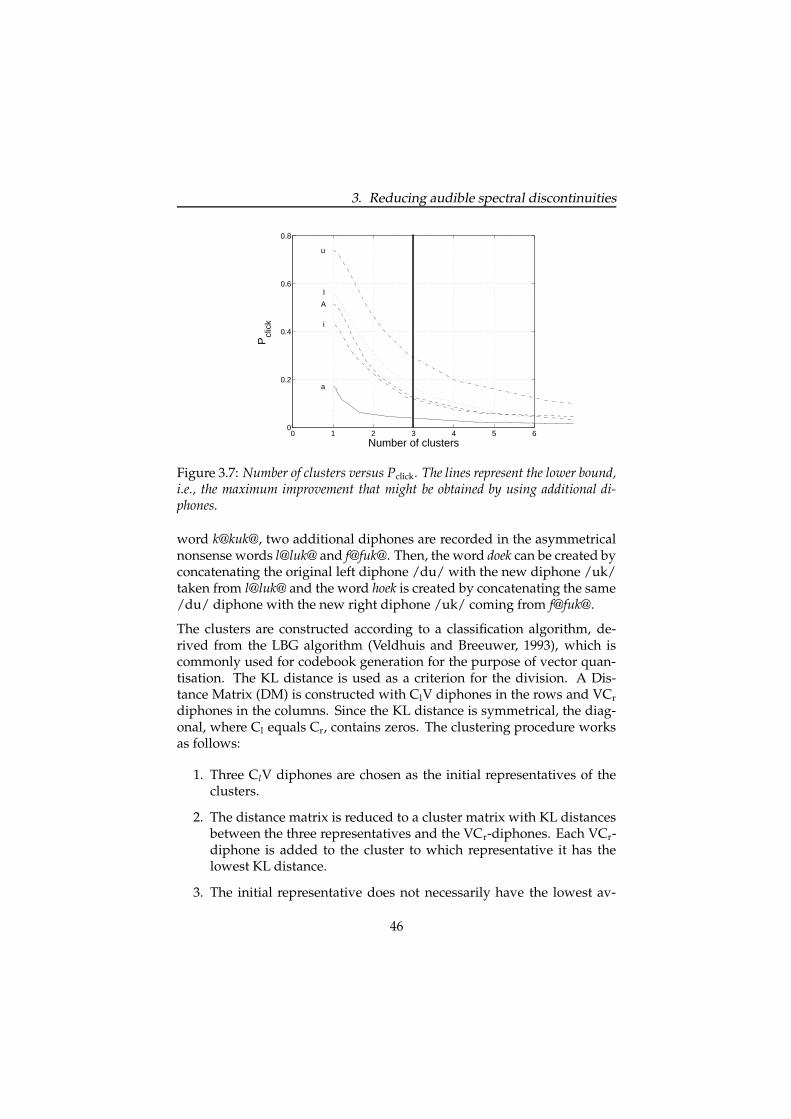
3. Reducing audible spectral discontinuities
0 1 2 3 4 5 60
0.2
0.4
0.6
0.8
Number of clusters
Pcl
ick
a
A
i
I
u
Figure 3.7: Number of clusters versus Pclick. The lines represent the lower bound,i.e., the maximum improvement that might be obtained by using additional di-phones.
word k@kuk@, two additional diphones are recorded in the asymmetricalnonsense words l@luk@ and f@fuk@. Then, the word doek can be created byconcatenating the original left diphone /du/ with the new diphone /uk/taken from l@luk@ and the word hoek is created by concatenating the same/du/ diphone with the new right diphone /uk/ coming from f@fuk@.
The clusters are constructed according to a classification algorithm, de-rived from the LBG algorithm (Veldhuis and Breeuwer, 1993), which iscommonly used for codebook generation for the purpose of vector quan-tisation. The KL distance is used as a criterion for the division. A Dis-tance Matrix (DM) is constructed with ClV diphones in the rows and VCr
diphones in the columns. Since the KL distance is symmetrical, the diag-onal, where Cl equals Cr, contains zeros. The clustering procedure worksas follows:
1. Three ClV diphones are chosen as the initial representatives of theclusters.
2. The distance matrix is reduced to a cluster matrix with KL distancesbetween the three representatives and the VCr-diphones. Each VCr-diphone is added to the cluster to which representative it has thelowest KL distance.
3. The initial representative does not necessarily have the lowest av-
46

3.3. A solution to the problem
recorded symmetricallyRight diphones
clusterthird
clustersecond
recorded with arepresentative
first
representative
cluster
p m
Right diphones
r
Right diphones
p m
r f
h
r f
recorded with a
h
f
p m
r f
hh
x G w
v N
k b g
x G w
v N
k b g
p m
x G w
v N
k b g
n l L
j s z
S Z J
recorded symmetricallyLeft diphones
n l L
j s z
S Z J
t d c
n l L
j s z
S Z J
t d c
n l L
j s z
S Z J
t d c t d c
x wG
v N
k b g
small KL
large KL
small KL
Original database
boek
doek
hoek
Additional database
lu +
Gu +
Gu +
fu +
fu +
lu +
Figure 3.8: The principle of the construction of additional diphone clusters. Thecontext-sensitive diphone-clusters are indicated in grey. They consist of VCr di-phones that were recorded with a representative from a non-corresponding leftcluster. The representative of each cluster is circled.
erage KL distance to all other diphones in the cluster, so for eachcluster a new representative is chosen that does adhere to this crite-rion. Then steps 2 and 3 are repeated until the cluster configurationconverges.
All possible combinations of initial representatives were tried. The bestones, i.e., the ones that lead to the lowest maximal distance in a cluster, aredisplayed in Table 3.3. Weighting the average KL distance with the fre-quency of occurrence of each diphone as measured in a large text corpus(27,000 sentences) did not have any effect on the configuration. It was de-cided to allow the occurrence of just one diphone in a cluster, to be able toseparate an outlier that has a great spectral distance to all other diphones.
47

3. Reducing audible spectral discontinuities
For the /a/, the /S/ ends up in a cluster on its own. There is no clear pat-tern related to manner or place of articulation of the consonants, exceptfor the /u/ where all alveolars end up in the same cluster. We will comeback to this issue in the discussion. The cluster configuration for /u/ wasalready visualised in Figure 3.8
Vowel Consonants Maximum KL Average KLin cluster
/a/ 1: v bfwz 1.08 0.452: S 0.00 0.003: x GJLNcdghjklmnprstz 1.31 0.47
/i/ 1: k GNfgnpstx 2.40 0.902: b JLZdjmrvwz 2.79 0.863: S chl 1.85 0.89
/u/ 1: G Nbgkvwx 2.36 1.082: l JLSZcdjnstz 2.02 0.803: f hmpr 2.39 0.90
Table 3.3: Cluster configurations for /a/, /i/, and /u/. The representatives in eachcluster are the first consonants in each row.
3.3.2 Second perceptual experiment
In order to measure the improvement that results from the addition ofcontext-sensitive diphones new recordings were made with which a newperceptual experiment was performed. In order to make comparison pos-sible, the new recordings were contained both the old symmetrical and thenew asymmetrical nonsense words.
Material
Again, stimuli were created consisting of concatenated ClV and VCr-diphones, except that now for each ClV and VCr combination there weretwo versions, one with a right diphone from the symmetrical nonsenseword Cr@CrVCr@ (database without clustering) and one with a right di-phone from the asymmetrical nonsense word Crep@CrepVCr@ (databasewith clustering). In order to reduce the total number of stimuli, it wasdecided to focus on just three vowels /a/, /i/, and /u/. The total num-ber of stimuli used in the experiment is 2254, of which 1449 were con-
48
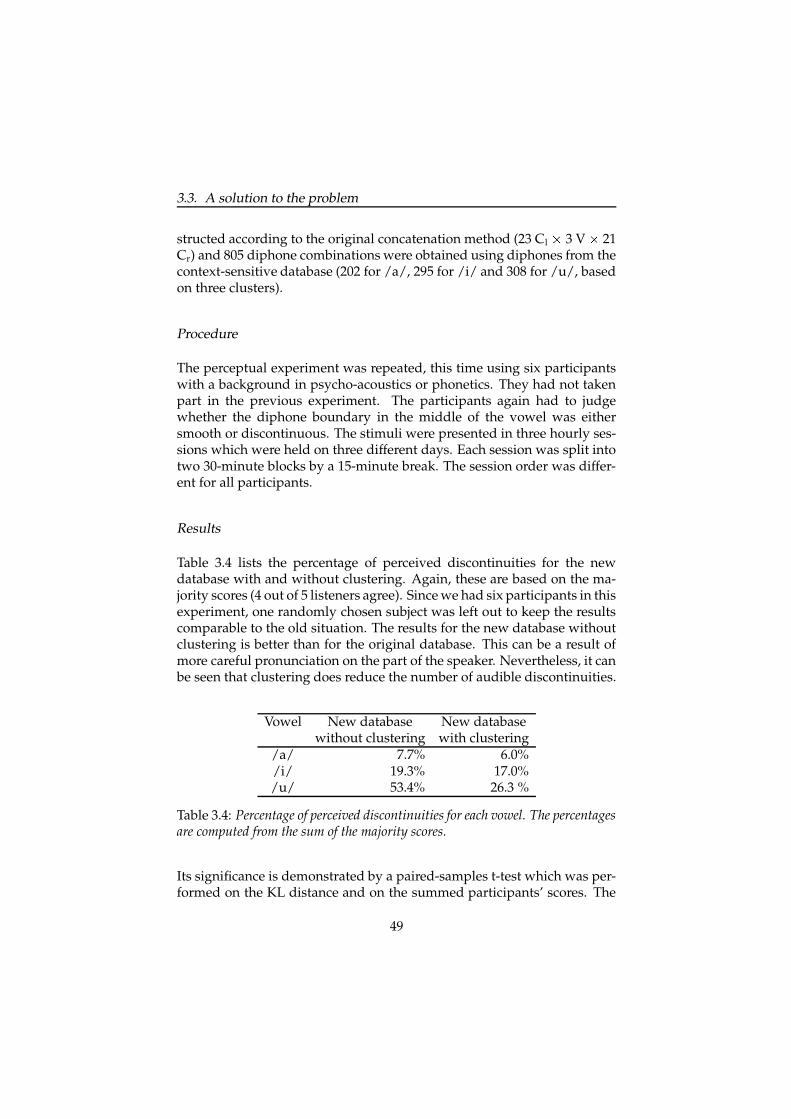
3.3. A solution to the problem
structed according to the original concatenation method (23 Cl� 3 V � 21
Cr) and 805 diphone combinations were obtained using diphones from thecontext-sensitive database (202 for /a/, 295 for /i/ and 308 for /u/, basedon three clusters).
Procedure
The perceptual experiment was repeated, this time using six participantswith a background in psycho-acoustics or phonetics. They had not takenpart in the previous experiment. The participants again had to judgewhether the diphone boundary in the middle of the vowel was eithersmooth or discontinuous. The stimuli were presented in three hourly ses-sions which were held on three different days. Each session was split intotwo 30-minute blocks by a 15-minute break. The session order was differ-ent for all participants.
Results
Table 3.4 lists the percentage of perceived discontinuities for the newdatabase with and without clustering. Again, these are based on the ma-jority scores (4 out of 5 listeners agree). Since we had six participants in thisexperiment, one randomly chosen subject was left out to keep the resultscomparable to the old situation. The results for the new database withoutclustering is better than for the original database. This can be a result ofmore careful pronunciation on the part of the speaker. Nevertheless, it canbe seen that clustering does reduce the number of audible discontinuities.
Vowel New database New databasewithout clustering with clustering
/a/ 7.7% 6.0%/i/ 19.3% 17.0%/u/ 53.4% 26.3 %
Table 3.4: Percentage of perceived discontinuities for each vowel. The percentagesare computed from the sum of the majority scores.
Its significance is demonstrated by a paired-samples t-test which was per-formed on the KL distance and on the summed participants’ scores. The
49
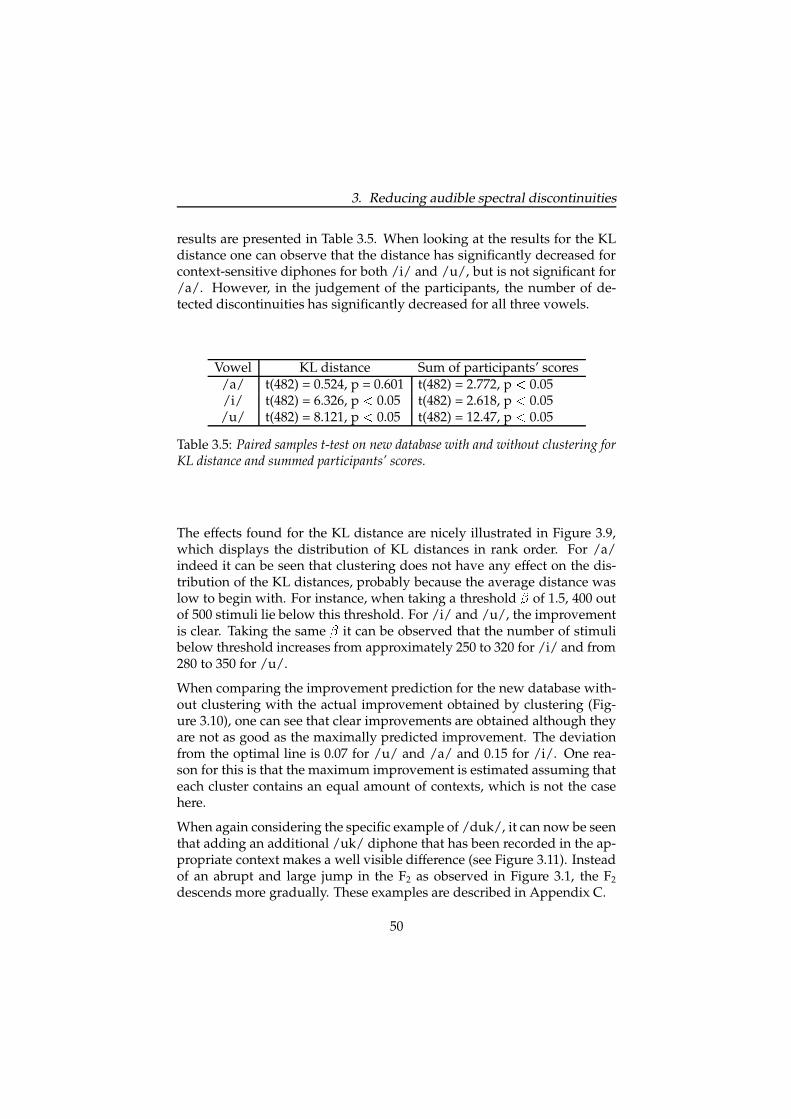
3. Reducing audible spectral discontinuities
results are presented in Table 3.5. When looking at the results for the KLdistance one can observe that the distance has significantly decreased forcontext-sensitive diphones for both /i/ and /u/, but is not significant for/a/. However, in the judgement of the participants, the number of de-tected discontinuities has significantly decreased for all three vowels.
Vowel KL distance Sum of participants’ scores/a/ t(482) = 0.524, p = 0.601 t(482) = 2.772, p � 0.05/i/ t(482) = 6.326, p � 0.05 t(482) = 2.618, p � 0.05/u/ t(482) = 8.121, p � 0.05 t(482) = 12.47, p � 0.05
Table 3.5: Paired samples t-test on new database with and without clustering forKL distance and summed participants’ scores.
The effects found for the KL distance are nicely illustrated in Figure 3.9,which displays the distribution of KL distances in rank order. For /a/indeed it can be seen that clustering does not have any effect on the dis-tribution of the KL distances, probably because the average distance waslow to begin with. For instance, when taking a threshold
�of 1.5, 400 out
of 500 stimuli lie below this threshold. For /i/ and /u/, the improvementis clear. Taking the same
�it can be observed that the number of stimuli
below threshold increases from approximately 250 to 320 for /i/ and from280 to 350 for /u/.
When comparing the improvement prediction for the new database with-out clustering with the actual improvement obtained by clustering (Fig-ure 3.10), one can see that clear improvements are obtained although theyare not as good as the maximally predicted improvement. The deviationfrom the optimal line is 0.07 for /u/ and /a/ and 0.15 for /i/. One rea-son for this is that the maximum improvement is estimated assuming thateach cluster contains an equal amount of contexts, which is not the casehere.
When again considering the specific example of /duk/, it can now be seenthat adding an additional /uk/ diphone that has been recorded in the ap-propriate context makes a well visible difference (see Figure 3.11). Insteadof an abrupt and large jump in the F2 as observed in Figure 3.1, the F2
descends more gradually. These examples are described in Appendix C.
50
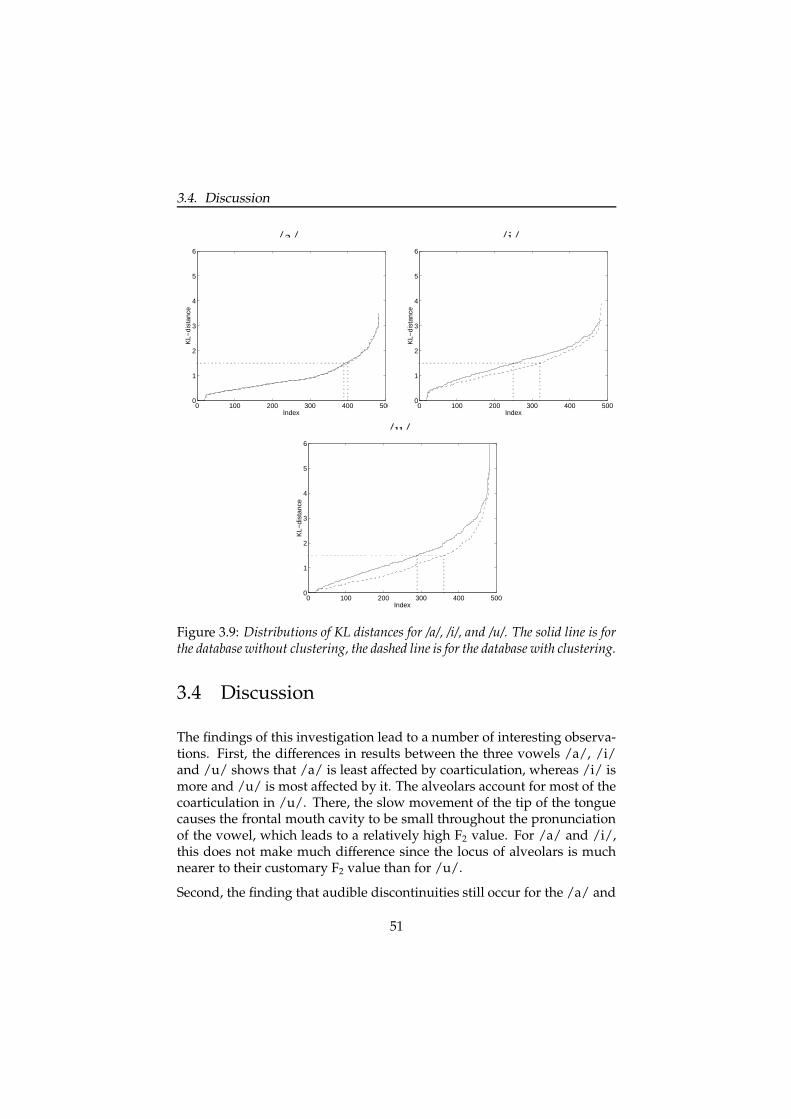
3.4. Discussion
/a/ /i/
0 100 200 300 400 5000
1
2
3
4
5
6
Index
KL−
dist
ance
0 100 200 300 400 5000
1
2
3
4
5
6
IndexK
L−di
stan
ce
/u/
0 100 200 300 400 5000
1
2
3
4
5
6
Index
KL−
dist
ance
Figure 3.9: Distributions of KL distances for /a/, /i/, and /u/. The solid line is forthe database without clustering, the dashed line is for the database with clustering.
3.4 Discussion
The findings of this investigation lead to a number of interesting observa-tions. First, the differences in results between the three vowels /a/, /i/and /u/ shows that /a/ is least affected by coarticulation, whereas /i/ ismore and /u/ is most affected by it. The alveolars account for most of thecoarticulation in /u/. There, the slow movement of the tip of the tonguecauses the frontal mouth cavity to be small throughout the pronunciationof the vowel, which leads to a relatively high F2 value. For /a/ and /i/,this does not make much difference since the locus of alveolars is muchnearer to their customary F2 value than for /u/.
Second, the finding that audible discontinuities still occur for the /a/ and
51

3. Reducing audible spectral discontinuities
0 1 2 3 4 5 60
0.2
0.4
0.6
0.8
Number of clusters
Pcl
ick
a
i
u
a
i
u
Figure 3.10: Number of clusters versus Pclick, the probability of a discontinuityarising, for /a/, /i/, and /u/. The lines represent the lower bound, i.e., the maximumimprovement that might be obtained. The stars indicate the actual improvementobtained when using three clusters.
that clustering does not reduce the amount of audible discontinuities leadsto the conclusion that besides coarticulation there is always random vari-ation in the pronunciation of the stimuli. This was also observed by Oliveet al. (1998) who found F2 variations in excess of 50 Hz for a vowel inrepetitions of the exact same phrase as uttered by a highly professionalspeaker. Van Santen (1997) reports even larger F1 and F2 variations (up to250 Hz) in the repeated pronunciation of /I/ in six and million by a pro-fessional speaker. This indicates the need to record several instances of adiphone and choose the one that is optimal for the database.
Third, the bottom panel in Figure 3.11 shows that when the diphones arerecorded in asymmetrical nonsense words, the formant trajectories are nolonger stable, but change gradually from start to finish. In that case, itmay make sense to optimise the cutting point of the diphone boundary asproposed by Conkie and Isard (1997).
3.5 Conclusion
This chapter reported on the occurrence of audible discontinuities in di-phone synthesis caused by spectral mismatch at the diphone boundaries.
52

3.5. Conclusion
0.00 0.01 0.02 0.03 0.04 0.05 0.06 0.07 0.08 0.09 0.10 0.11 0.12 0.13Time (s)
010
0020
0030
0040
0050
00
Fre
quen
cy (
Hz)
0.0018 0.01 0.02 0.03 0.04 0.05 0.06 0.07 0.08 0.09 0.10 0.11 0.12 0.13Time (s)
010
0020
0030
0040
0050
00
Fre
quen
cy (
Hz)
Figure 3.11: Improvement in the concatenation of /du/ and /uk/ using a differentdiphone for /uk/. Instead of an abrupt jump in F2 as is visible in the top panel, agradual transition is observable in the bottom panel.
A perceptual experiment was conducted to investigate the extent to whichthis phenomenon occurs. The results revealed that there are considerabledifferences between the vowels under investigation. The /a/ showed theleast amount of perceived discontinuities, followed by the /i/. The /A/and /I/ showed more perceived discontinuities, but the largest percentageof perceived discontinuities was found in the /u/. Research by Van Son(1988) and Van Bergem (1995) has shown that coarticulation has a central-izing effect. Maybe that is the reason why /u/ is more affected in termsof F2 and /A/ more in terms of F1. The scores obtained in the percep-tual experiment were correlated with several spectral distance measuresto find an objective measure to predict the occurrence of audible disconti-
53

3. Reducing audible spectral discontinuities
nuities. The correlation was performed using Receiver Operator Charac-teristic curves. The Kullback-Leibler distance, coming from statistics, wasshown to be most adequate for the task.
In the second part of this chapter, a possible solution was presented.Context-sensitive diphones were added to the database. In order to reducethe number of additional diphones, the KL distance was used to clusterconsonantal contexts that have the same spectral effects on the neighbour-ing vowels. A second perceptual experiment was conducted to evaluatethe improvement obtained with this addition to the database. A significantimprovement was obtained for /u/ and /i/ both in terms of the objectiveKL distance and the subjective scores. For /a/ there was only a subjectiveimprovement, but objectively, in terms of KL distance, the improvementwas not significant. This is not a problem, however, as the number of dis-continuities in /a/ was already low to begin with.
The approach can be further extended to other phonemes prone to coartic-ulation effects, such as closed back vowels like /o/, /O/, /y/, and semi-vowels like /j/, /l/ and /w/.
The KL distance can also be applied to find the optimal cutting point indiphones or other concatenative units.
54

Chapter 4Modelling segmental duration
4.1 Introduction
The quality of synthetic speech not only depends on the concatenativeunits themselves, but also on the prosodic modelling that is applied afterconcatenation. One aspect of prosodic modelling concerns the segmentaldurations. In speech perception, variation in segmental duration serves asa cue to the identity of a speech sound and helps to segment a continuousflow of sounds into words and phrases. In natural speech production, seg-mental duration is systematically varied depending on the phonetic con-text. Contextual factors influencing segmental duration operate on differ-ent phonological levels, from the phoneme and syllable level to the phraselevel. If a duration model can take all important contextual factors intoaccount, the resulting speech will not only sound more natural, but willprobably also be more intelligible.
This section reports on the development of a new duration model forDutch, which replaces the traditional sequential rule system in Calipso.The old system gave unsatisfactory results, probably because interactionsamong factors were not sufficiently modelled and some important higher-level prosodic and positional factors were not taken into account. More-over, this system was not specifically modelled after the speaker of thediphones.
One general problem in constructing a duration model is the issue of in-teracting factors. When two factors interact, it means that the effect of onefactor is amplified or attenuated by the other factor. An important char-
55

4. Modelling segmental duration
acteristic of factors affecting duration prediction is that the effect of onefactor does not reverse the effect of another factor, meaning that if one fac-tor causes lengthening then another factor may influence the amount oflengthening, but it will not cause the first factor to induce shortening. Thisphenomenon is called directional invariance (Van Santen, 1992a).
A more specific problem in data-based systems is data sparsity. For all fac-tors relevant for duration prediction levels or features can be identified,e.g., unstressed is a feature of the stress factor. For each segment whose du-ration we want to predict, a feature vector has to be computed describingthe context in which the segment occurs. How this is done is explainedin Section 4.3.2. Data sparsity refers to the problem that the feature space,consisting of all theoretically possible feature combinations, can be astro-nomically large. The linguistic space, a subset of feature vectors actuallyoccurring in a particular language, only occupies a small fraction of thetotal feature space, due to phonotactic and other constraints. But even thisfraction is still huge. The problem is that any large corpus used for anal-ysis will cover only a small and unevenly distributed proportion of thefeature space. Complete coverage is thus practically impossible. Becausethe number of very rare feature vectors is very large, it is not sufficientto simply model only the most common features. The statistical analysismethods used therefore have to be able to deal well with missing data inorder to generalise to feature vectors not previously encountered.
In Section 4.2, different approaches to duration modelling will be intro-duced with their pros and cons, making a distinction between knowledge-based systems, data-based systems and systems that are based on knowl-edge as well as data. Section 4.3 discusses the steps involved in develop-ing a new duration model. In Section 4.4, the resulting duration model forDutch will be discussed together with the main effects found. Finally, inSection 4.5 an evaluation of the new against the old model is presented.
4.2 Possible approaches
4.2.1 Knowledge-based systems
The first type of duration model is a sequential rule system as applied byKlatt (1987) in the MITalk system. His model assumes that a) each pho-netic segment type has an inherent duration specified as one of its dis-
56
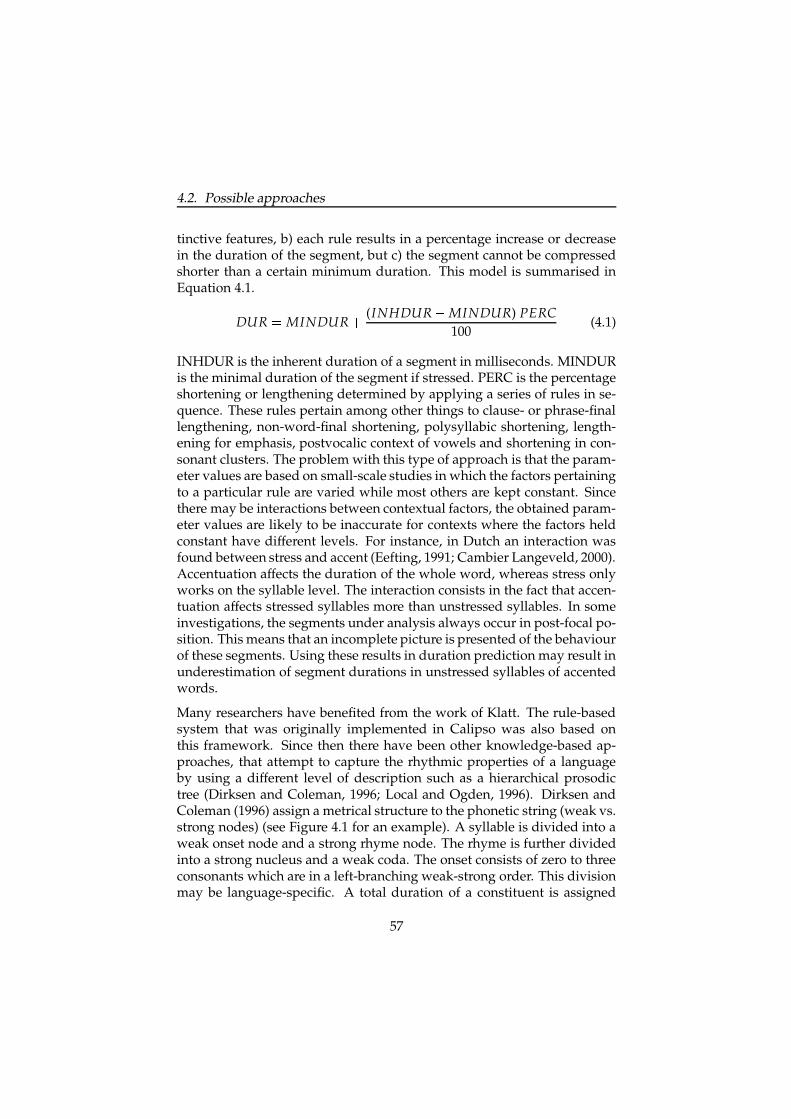
4.2. Possible approaches
tinctive features, b) each rule results in a percentage increase or decreasein the duration of the segment, but c) the segment cannot be compressedshorter than a certain minimum duration. This model is summarised inEquation 4.1.
DUR � MINDUR � (INHDUR � MINDUR) PERC100
(4.1)
INHDUR is the inherent duration of a segment in milliseconds. MINDURis the minimal duration of the segment if stressed. PERC is the percentageshortening or lengthening determined by applying a series of rules in se-quence. These rules pertain among other things to clause- or phrase-finallengthening, non-word-final shortening, polysyllabic shortening, length-ening for emphasis, postvocalic context of vowels and shortening in con-sonant clusters. The problem with this type of approach is that the param-eter values are based on small-scale studies in which the factors pertainingto a particular rule are varied while most others are kept constant. Sincethere may be interactions between contextual factors, the obtained param-eter values are likely to be inaccurate for contexts where the factors heldconstant have different levels. For instance, in Dutch an interaction wasfound between stress and accent (Eefting, 1991; Cambier Langeveld, 2000).Accentuation affects the duration of the whole word, whereas stress onlyworks on the syllable level. The interaction consists in the fact that accen-tuation affects stressed syllables more than unstressed syllables. In someinvestigations, the segments under analysis always occur in post-focal po-sition. This means that an incomplete picture is presented of the behaviourof these segments. Using these results in duration prediction may result inunderestimation of segment durations in unstressed syllables of accentedwords.
Many researchers have benefited from the work of Klatt. The rule-basedsystem that was originally implemented in Calipso was also based onthis framework. Since then there have been other knowledge-based ap-proaches, that attempt to capture the rhythmic properties of a languageby using a different level of description such as a hierarchical prosodictree (Dirksen and Coleman, 1996; Local and Ogden, 1996). Dirksen andColeman (1996) assign a metrical structure to the phonetic string (weak vs.strong nodes) (see Figure 4.1 for an example). A syllable is divided into aweak onset node and a strong rhyme node. The rhyme is further dividedinto a strong nucleus and a weak coda. The onset consists of zero to threeconsonants which are in a left-branching weak-strong order. This divisionmay be language-specific. A total duration of a constituent is assigned
57

4. Modelling segmental duration
to the head of the constituent. The segments within an onset constituentdo not have inherent durations but these follow from statements of non-overlap between sister constituents within an onset. Coda constituents dohave inherent durations as well as statements about non-overlap betweensister constituents within the coda. The CD-ROM provided with the bookof Van Santen, Sproat, Olive, and Hirschberg (1996) gives some examplesgenerated by Dirksen and Coleman (1996).
ri
n
s
p t
syll
i
nucleus: s
cons: s
n
vow: scons: w
s
rhyme: s
coda: w
r
onset: w
cons: sclosure: w
cons: w
t
cons: s
p
Figure 4.1: Example of a strong/weak branching tree and durational compositionof the word sprint according to the metrical approach proposed by Dirksen andColeman (1996).
4.2.2 Data-based systems
When large speech corpora and the computational means for analysingthese corpora became available, new statistical approaches were pro-posed.
Riley (1992) proposed the use of Classification and Regression Trees(CART) to model duration. The principle of CART is to construct a binarybranching tree from which segmental durations can be looked up. Thebranches in the tree are determined by contextual factors such as mannerof articulation of the target segment, manner and place of articulation of
58

4.2. Possible approaches
the preceding and the following segments, lexical stress and the numberof segments up to the end of the word. The grouping of contexts to the leftor right branch is determined by minimising the variance of the estimatederror. The problem with this type of approach is that it is impossible toexhaustively cover all possible feature vectors, even with huge amountsof training data. It is not possible to generalise to unseen cases, other thanby pooling some seen cases that come close to the desired unseen case.For this reason, this method doesn’t cope well with data sparsity. Over-training is also a serious problem, which happens when the distinctions inthe tree are so fine that they fit the training corpus well, but not any othercorpus. This can be overcome by pruning the tree such that more gen-eral distinctions remain. Deciding on the amount of pruning necessary toobtain good results is not trivial, however.
Another approach uses Neural Networks to predict durations (Campbell,1992). The syllable is taken as the basic unit of duration prediction, whichcan be calculated without prior knowledge of phonetic constraints. A neu-ral net is trained taking into account the number of phonemes in the syl-lable, the nature of the syllabic peak (e.g., reduced, lax, tense vowel), theposition in the tone group, the type of foot, stress and word class. Segmen-tal durations are calculated as follows. For each phoneme class, there is adistribution of log durations that resembles a normal distribution and thatis characterised by a mean duration and a standard deviation. One factor kis computed that is applied to each segment in the syllable in terms of stan-dard deviations around its mean to produce an optimal fit to the overallsyllable duration. This relies on the assumption that all segments in a syl-lable are lengthened or shortened equally in terms of standard deviation.This does not necessarily have to be the case. This approach does not takethe segmental make-up of the syllable into account, which can contributeconsiderably to the overall syllable duration. For instance, in Dutch thereis a difference in duration between nar (joker) and nier (kidney). Both /A/and /i/ are in principal short vowels, but the /i/ undergoes considerablelengthening when followed by /r/, whereas the /A/ does not (Moulton,1962). This cannot be captured in this syllabic model. Like CART, this ap-proach can suffer from overtraining and is unable to come up with goodpredictions when the data is sparse.
59
4. Modelling segmental duration
4.2.3 Knowledge-based data systems
The solution proposed by Van Santen (1992b) is the application of a broadclass of mathematical models called sums-of-products models. This ap-proach takes advantage of the fact that most interactions are direction-ally invariant, which allows describing these interactions with equationsconsisting of sums and products. Phonemes that are affected similarlyby the various factors are grouped into subclasses. The decisions con-cerning this grouping are based on exploratory data analysis and pho-netic/phonological literature. For each subclass of segments, a separatesums-of-products model is trained. Exploratory data analysis is an essen-tial step in order to appropriately decide which factors are important andhow many levels on a factor should be distinguished. For each subclassthis can lead to different results. Thus, a great deal of phonetic and phono-logical knowledge can be incorporated in the model.
A sums-of-products model (Equation 4.2) gives the duration for aphoneme/context combination, as described by the feature vector
�
f . Kis a set of indices, each corresponding to a product term. Ii is the set of in-dices of factors occurring in the i-th product term. In other words, a sums-of-products model is an equation whose parameters correspond to factorlevels, which are combined by taking products of sub-groups of param-eters and then adding the products. Two examples of sums-of-productsmodels are the additive model (where K � �
1 ��������� N � , and Ii� �
i � ) andthe multiplicative model (where K � �
1 � and I1� �
1 ��������� N � ).
DUR(�
f ) � ∑i � K
∏j � Ii
Si j( f j) (4.2)
Evidence in favour of this approach is provided by Maghbouleh (1996),who compared the use of the sums-of-products approach to the use ofCART. Two important findings were reported. First, while both methodsperform equally well on a test set that comes from the same corpus asthe training set, the sums-of-products approach needs only one-tenth ofthe data that CART needs to come to its optimal performance. Second,the sums-of-products approach performs better on new texts. Even whenCART was restricted to use the same terms as in the sums-of-productsmodel, its performance on new texts did not improve. Apparently, CARTis unable to capture interactions as accurately as the sums-of-products ap-proach. The sums-of-products approach has successfully been applied tomany languages, including American English, French, German, Italian,Spanish, Japanese and Mandarin Chinese (Sproat, 1998).
60
4.3. The sums-of-products approach
4.3 The sums-of-products approach
For the reasons mentioned in the previous paragraph, the sums-of-products approach was used to develop a new duration model for IPO’sspeech synthesis system Calipso. Additional reasons for using this ap-proach are that it requires a fairly small amount of training data to con-struct a reliable model, the resulting model is generalisable to many texttypes, and it allows a thorough analysis of the durational characteristicsof a speaker. The duration model is created by performing a number ofsteps, as they are listed below. Each of these steps will be explained inmore detail later on.
1. Obtain a large text corpus (Section 4.3.1).
2. Compute from this text all information relevant for duration predic-tion, encode it in feature vectors (Section 4.3.2).
3. Select a subset of the corpus using a greedy algorithm (Section 4.3.3).
4. Record the sentences of the subset and segment the recordings (Sec-tion 4.3.4).
5. Perform statistical analyses to construct a duration model consist-ing of a) a category tree in which all segments are grouped into sub-classes that are affected similarly by contextual factors, (Section 4.3.5)and b) a set of sums-of-products models for each of the leaves in thetree (Section 4.3.6).
4.3.1 Corpus
The source of our database is a large collection of news transcriptions pro-vided by the “Instituut voor Nederlandse Lexicologie” (INL)1. The collec-tion consists of approximately 27,000 sentences from two types of news:the ‘NOS Journaal’ (public broadcast news) and ‘Jeugdjournaal’ (a specialbroadcast news edition for children). Since the sentences are literal tran-scriptions of spoken news reports, they are better suited to our needs thansentences taken from newspapers. The children’s news has the additionaladvantage that sentences are shorter and have a simpler structure than
1We acknowledge the Institute for Dutch Lexicology for providing us with the textdatabase.
61
4. Modelling segmental duration
standard news editions. These sentences were phonetically transcribedusing GRAFON, a grapheme-to-phoneme converter developed at the Uni-versity of Nijmegen, department of Language and Speech (Kerkhoff, Ri-etveld, Gussenhoven, and Elich, 1995). The database ultimately consistedof 1,549,946 segments: 480,796 vowels and 1,069,150 consonants.
4.3.2 Feature vectors
Each segment in the text is annotated with a list of contextual featuresthat are relevant for duration prediction. The following factors were in-cluded in the annotation based on literature on duration in Dutch (e.g.,Nooteboom (1972); Eefting (1991)) and other languages (e.g., Van Santen(1992b); Van Santen (1994)). The number of factor levels per factor is in-dicated between brackets. The meaning of those levels will be explainedafter the listing of the factors.
1. Identity of the current segment (53)
2. Phoneme class of the preceding segment (27)
3. Phoneme class of the following segment (27)
4. Stress (3)
5. Accent (3)
6. Word class (3)
7. Word frequency (3)
8. Left position (LPOS) (16)
� Left position of the segment in the syllable (2)� Left position of the syllable in the word (2)� Left position of the word in the phrase (2)� Left position of the phrase in the sentence (2)
9. Right position (RPOS) (16)
� Right position of the segment in the syllable (2)� Right position of the syllable in the word (2)
62

4.3. The sums-of-products approach
� Right position of the word in the phrase (2)
� Right position of the phrase in the sentence (2)
Factor 1, Identity of the current segment, has 53 levels that include the 44phonemes that are indicated in Table A.1. These phonemes consist of 19vowels (3 of which are diphthongs, and 3 of which are used only in loanwords), 25 consonant segments and the glottal stop. The 7 stops are splitup into two parts: a closure and a burst phase, so that we get a total of51 levels. An additional symbol /R/ was introduced to distinguish thevelar vowel-like /R/ from the fricative-like /r/. The last symbol /sil/ isfor silence.
Factors 2 and 3, Phoneme class of the preceding/following segment, have 27levels. They are classified with basic phonetic labels expressing manner ofarticulation and voicing, such as unvoiced stop, nasal or liquid2. Silenceis also a possible value. Place of articulation was not encoded since pre-vious research proved it to be hardly relevant (Crystal and House, 1988).Furthermore, if a preceding or following consonant is part of a consonantcluster, the size of the cluster is appended to the phonetic class. This ruleapplies within a syllable, so two consonants separated by a syllable bound-ary are not considered as being part of a cluster. The syllable boundarieshave been determined automatically by the grapheme-to-phoneme con-verter.
Factor 4, Stress, has three levels, where 0 means the syllable has no lexi-cal stress, 1 means primary stress and 2 means secondary stress. Factor 5,Accent, also has three levels, 0, 1, and 2, for unaccented, accented and cliti-cised words (e.g., z’n (his), and ‘m (him)). This factor deals with pitch accentand operates on the word level. Factor 6, Word class, makes a distinctionbetween function words, content words with less than four syllables andcontent words with more than four syllables. Factor 7, Word frequency, dis-tinguishes between low-, medium-, and high-frequency words. Factor 8,Left position, consists of a combination of 0 and 1 values to encode position,e.g. 1111 means that the phoneme is the initial phoneme in the syllable,the syllable is initial in the word, the word is initial in the phrase and thephrase is the initial in the sentence. In the same manner, 0000 means thatit is non-initial on all levels. Factor 9, Right position, is similar to factor 8,except that here it is checked whether the position is final vs. non-final.
2These will be abbreviated to ustop, nas, liq.
63

4. Modelling segmental duration
4.3.3 Selecting a subset
Multiplying all factor levels, we could in theory get a total of 770,943,744unique factor combinations. The current corpus contains 99,206 distinctfactor combinations. This is less than 0.01% of the number of theoreti-cal possibilities. Gaps in the factor space are caused for a large part byphonotactic constraints of the language. To some extent accidental gapsoccur. No matter how large a corpus, there will always be legal factorcombinations that are not included. This illustrates exactly the data spar-sity problem mentioned earlier. In unrestricted text-to-speech, the chanceof a rare feature vector occurring is quite big. Therefore, the durationmodel has to be able to generalise to factor combinations never seen be-fore. Nevertheless, it is important to find the smallest subset that cov-ers the same unit types as the entire corpus. This can be done by apply-ing a greedy algorithm (Van Santen and Buchsbaum, 1997). In our case,sub-vectorisation was applied so that complete coverage was achieved forsub-vectors (Van Santen and Sproat, 1998). This means that from each fea-ture vector, a set of sub-vectors is selected that corresponds to preciselythose components that are expected to interact. The sub-vectors usedwere
�1 � ,
�2 � ,
�1,3 � ,
�1,4,5 � ,
�6,7 � ,
�1,8 � ,
�1,9 � . Then the greedy algo-
rithm is applied to a list in which each sentence is represented as a set ofsub-vectors instead of full vectors. In this way, parameters can be esti-mated on far fewer sentences than are required to cover the entire featurespace. For the current data set, the 4069 distinct sub-vectors occurringin the database of 27,000 sentences could be covered completely in just297 sentences, containing 16,775 segments (4968 vowels and 11,807 con-sonants). Some cells consist of just one observation, because they containa rare segment/context combination. However, after grouping the seg-ments into subclasses, each cell contains at least five occurrences.
4.3.4 Recording and segmenting
After manual correction of the phonetic transcriptions, these 297 sentenceswere recorded using the same semi-professional female speaker that wasused for the diphone database and the phrase concatenation recordingsdiscussed in Chapter 2. The recordings were made in a sound-treatedroom on a DAT-tape with a 48 kHz sampling frequency. The speech wasdown-sampled to 16 kHz. It was then segmented by hand using Waves+(Entropic inc.) on a Silicon Graphics workstation. At the time there was no
64

4.3. The sums-of-products approach
automatic segmentation software available for Dutch that could identifysegment boundaries with such small deviations as to make them usefulfor duration prediction.
Both the waveform and the spectrogram were used to determine the seg-ment boundaries, and the placement of the boundaries was confirmed bylistening. For stops, the closure and burst part were segmented separately.In utterance- and phrase-initial unvoiced stops, it was difficult to deter-mine the start of the closure, so it was put at a reasonable distance beforethe release of the burst. These closures were eventually left out of the anal-yses, because they displayed a greater variability than closures at otherpositions. When a stop followed a nasal, the closure phase proved veryshort and was sometimes difficult to detect. In most cases, a reduced en-ergy in the spectrogram signalled the position of the closure. In case it wasnot visible at all, it was assigned a zero duration.
When listening to the recordings, it was decided to assign different labelsto different instances of /r/. The label r was reserved for the fricative/r/. The label R was used to mark the velar vowel-like /r/ that occurs inpostvocalic position in some dialects of Dutch. It resembles the American/r/. This sound was more difficult to segment. The boundary point waschosen to be the point where a sharp decrease in F3 could be detected.
In case of degemination, where two identical consonants occur next toeach other on either side of a word boundary, the phoneme boundary be-tween the two was not distinguishable and was put halfway between thestart and end label.
Vowel-vowel transitions were most difficult to segment. Usually, twovowels in Dutch are separated by a glottal stop, but it is also possible toconnect them with a /j/- or /w/-like transition. When this was the case,the midpoint of the transition was chosen as a cutting point. Between twoconsonants in a coda, such as /L-m/ or /r-k/, a very short schwa wassometimes inserted by our speaker. We decided to mark this as &. Thisonly occurred 14 times in our corpus, insufficient to come up with a reli-able model. This label was discarded in the analysis.
4.3.5 Constructing the category tree
The first step in constructing a duration model using the sums-of-productsapproach is to divide the feature space into subclasses (e.g. ’stressed’ vs.
65
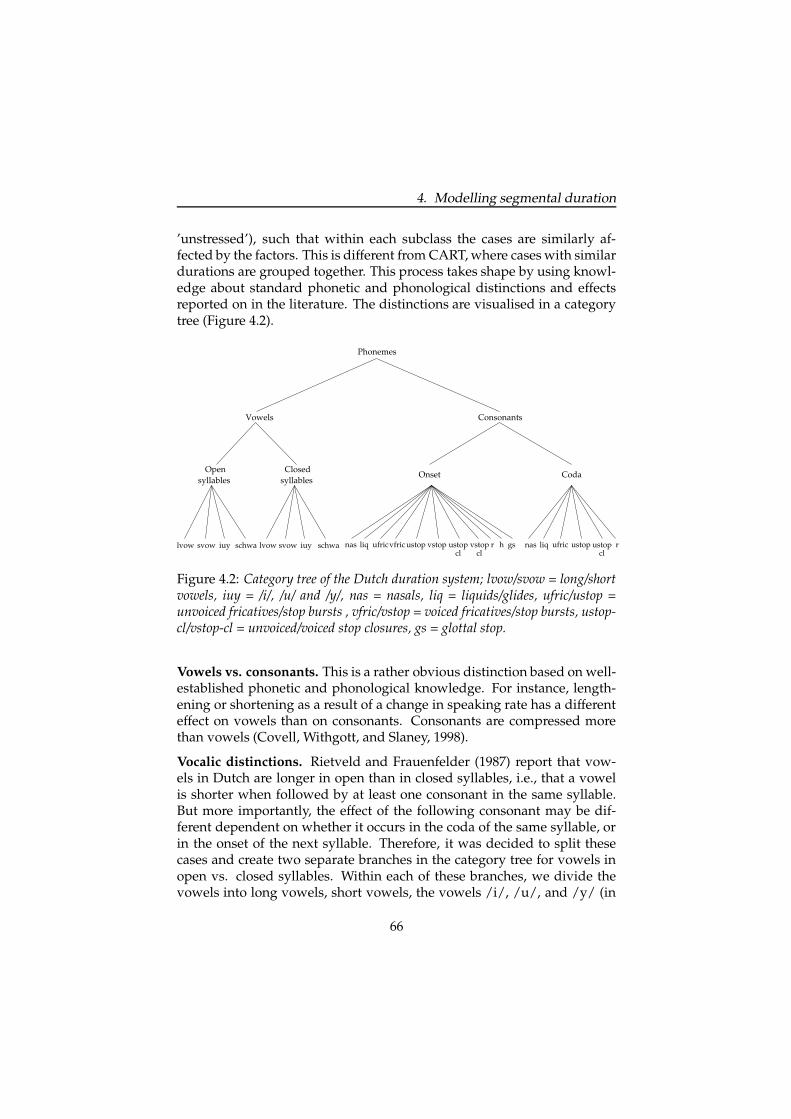
4. Modelling segmental duration
’unstressed’), such that within each subclass the cases are similarly af-fected by the factors. This is different from CART, where cases with similardurations are grouped together. This process takes shape by using knowl-edge about standard phonetic and phonological distinctions and effectsreported on in the literature. The distinctions are visualised in a categorytree (Figure 4.2).
clcl clvstopustopnas liq vfric ustop vstop gsr h
Onset
ustopufric liqnas ufric ustop r
CodaOpen
syllables
lvow svow iuy schwa
Closedsyllables
lvow svow iuy schwa
Consonants
Phonemes
Vowels
Figure 4.2: Category tree of the Dutch duration system; lvow/svow = long/shortvowels, iuy = /i/, /u/ and /y/, nas = nasals, liq = liquids/glides, ufric/ustop =unvoiced fricatives/stop bursts , vfric/vstop = voiced fricatives/stop bursts, ustop-cl/vstop-cl = unvoiced/voiced stop closures, gs = glottal stop.
Vowels vs. consonants. This is a rather obvious distinction based on well-established phonetic and phonological knowledge. For instance, length-ening or shortening as a result of a change in speaking rate has a differenteffect on vowels than on consonants. Consonants are compressed morethan vowels (Covell, Withgott, and Slaney, 1998).
Vocalic distinctions. Rietveld and Frauenfelder (1987) report that vow-els in Dutch are longer in open than in closed syllables, i.e., that a vowelis shorter when followed by at least one consonant in the same syllable.But more importantly, the effect of the following consonant may be dif-ferent dependent on whether it occurs in the coda of the same syllable, orin the onset of the next syllable. Therefore, it was decided to split thesecases and create two separate branches in the category tree for vowels inopen vs. closed syllables. Within each of these branches, we divide thevowels into long vowels, short vowels, the vowels /i/, /u/, and /y/ (in
66

4.3. The sums-of-products approach
short: iuy), and schwa. The category of long vowels consists of /e, a, o,2/, the diphthongs /Ei, Au, 9y/ and the loan vowels /E:, O:, 9:/, whichonly occur in loan words (see Table A.1 for examples). The diphthongsand the loan vowels are generally longer in duration than the other vow-els, but analysis has shown them to behave similarly. The short vowelsare /I, A, E, O, Y/. The short vowels /i/, /u/, and /y/ are classifiedseparately. Their durations are similar to those of short vowels, except be-fore /r/ where considerable lengthening is observed (Nooteboom, 1972).Distributionally, they behave as long vowels. Where short vowels can befollowed by a maximum of two consonants in the coda, long vowels canbe followed by maximally one (e.g., /lAmp/ vs.
�
/lamp/ vs.�
/limp/).Moulton (1962) hypothesises that /i/, /u/, and /y/ probably started outas long vowels, but in the evolution of Dutch changed to short vowels,while retaining their long vowel characteristic before /r/. The schwa /@/is treated as a separate category, because it only occurs in unstressed syl-lables.
Consonantal distinctions. The first distinction to be made is that betweenonsets and codas. The key reason to treat them separately is that the samefactor may have different effects (e.g., stress lengthens consonants in on-sets more than in codas) and the phonotactics of consonants in onsets andcodas are totally different, producing phonemic context factors that arehard to reconcile. The consonants are grouped according to manner of ar-ticulation and voicing. The categories are unvoiced stop closures, /pcl, tcl,kcl, ccl/ (closures for /p/, /t/, /k/, and /c/), voiced stop closures /bcl,dcl, gcl/, unvoiced stop bursts /p, t, k/, voiced stop bursts /b, d, g/, un-voiced fricatives /f, s, x, S, c/, voiced fricatives /v, z, Z/, nasals /m, n,N, J/, liquids & glides /l, j, w/, and the r, h, and glottal stop. The /r/ isnot included with the liquids and glides, because it is suspected to behavedifferently. In Dutch, the number of categories in codas is more limitedthan in onsets because syllable-final devoicing applies. The /h/ and /c/do not occur in the coda either and the dark /L/ occurs as an allophonicvariant of /l/.
The resulting category tree differs to some extent from the American En-glish tree used by Van Santen (1994). There, consonants are divided intointervocalic consonants and consonants in clusters, which are further di-vided into onsets and codas. In our study, it was decided to simplify mat-ters by not considering intervocalic consonants separately from the otherconsonants. In codas, Van Santen (1992a) makes a distinction made be-tween phrase-medial and phrase-final codas to accommodate interactionsbetween post-vocalic consonant class and phrasal position. This interac-
67

4. Modelling segmental duration
tion is specific to the English language and is thus not included in ourtree. In the Dutch duration model, a further distinction is made betweenvowels in open and in closed syllables.
4.3.6 Training the sums-of-products models
For each leaf in the category tree, a sums-of-products model has to betrained that will predict the duration of the segments in that subclassin all possible contexts. The current analysis was restricted to the useof pure multiplicative models following Mobius and Van Santen (1996),because these perform better than strictly additive models, and requireless training data than any other combination of sums and products.The model is summarised in Equation 4.3, where Duri( f 2 � � � f n) is the pre-dicted duration of a given vowel i with factor levels f 2 ��������� f n for factorsF2 ��������� Fn respectively. BaseDuri is the basic duration of the segments,and F2 f 2 ��������� Fn f n are the coefficients of the other factor levels.
Duri( f 2 � � � f n)� BaseDuri
� F2 f 2� F3 f 3
� ��� � Fn f n (4.3)
The calculations take place in the logarithmic domain instead of the lineardomain (see Equation 4.4). This reduces the skewness of the duration dis-tribution and allows a more accurate prediction of small durations. Multi-plication in the linear domain is equivalent to addition in the logarithmicdomain.
log(Duri( f 2 � � � f n))� log(BaseDuri) � log(F2 f 2) � log(F3 f 3) ����� log(Fn f n)
(4.4)
Training the multiplicative models is an iterative process. It involves ex-ploratory data analysis to determine which levels have to be distinguishedon a given factor for each category and which factors interact. By discard-ing irrelevant factors and reducing the number of levels on a factor, thenumber of gaps in the database will decrease and the number of observa-tions per factor level will increase. If the correct levels are collapsed, thepredictions will be more accurate. Interacting factors can be joined to in-corporate them in the model appropriately. These decisions are based ona number of information sources: 1) phonological/phonetic knowledge,2) the means that are computed by each factor to determine the size ofthe effect of each factor levels, 3) the two-way means that are computedto determine whether any two factors interact, 4) and the outcome of themultiplicative model, in terms of prediction error.
68

4.4. A duration model for Dutch
Most durational studies use raw means for analysing data, which is fine aslong as the experiments are carefully controlled and the factors involvedare balanced. In a natural speech database, the frequency distribution isunbalanced and thus the raw means can be quite misleading. The resultmay be biased by a segment occurring more often in some environmentsthan in others. To overcome this problem, analyses are executed using cor-rected means (Van Santen and Sproat, 1998), which account for the fact thatthe corpus is not balanced. Therefore, results are similar to the ones thatwould have been obtained if a balanced corpus was used. It works as fol-lows. If F1 is the factor of interest, then a new factor Fremainder can be defined,which is the product of all remaining factors, F2 ��������� Fn. A 2-factor additiveor multiplicative model can be applied to this new factorisation, and theparameters Duri estimated. These parameter estimates can be interpretedas means of the levels on the factor of interest that have been corrected for theeffects of the remaining factors.
Two-way corrected means are computed to investigate whether two fac-tors interact. When a clear interaction is found, the two factors will becombined into one. Then, a multiplicative model can be trained. All modelfitting is performed with least-squares estimation in the log duration do-main (Van Santen and Sproat, 1998). The resulting model can be assessedby considering the set of predicted durations (in terms of corrected means)for each factor level, the correlation between the predicted and observedduration, and the prediction error. Factor levels with similar means can becollapsed, factors with only a minor effect can be discarded, and interact-ing factors can be combined into one. Every time a change is made to themodel, the analysis is repeated until a satisfactory multiplicative model isobtained.
4.4 A duration model for Dutch
4.4.1 Fitted duration
The performance of the entire duration model is established by compar-ing the observed durations in the 297 sentences of our speech corpus withthe predicted values. Table 4.1 displays the performance of the new Dutchduration model in comparison to the German and French duration mod-els constructed with the same sums-of-products approach (Mobius andVan Santen, 1996; Tzoukermann and Soumoy, 1995). The number of obser-
69
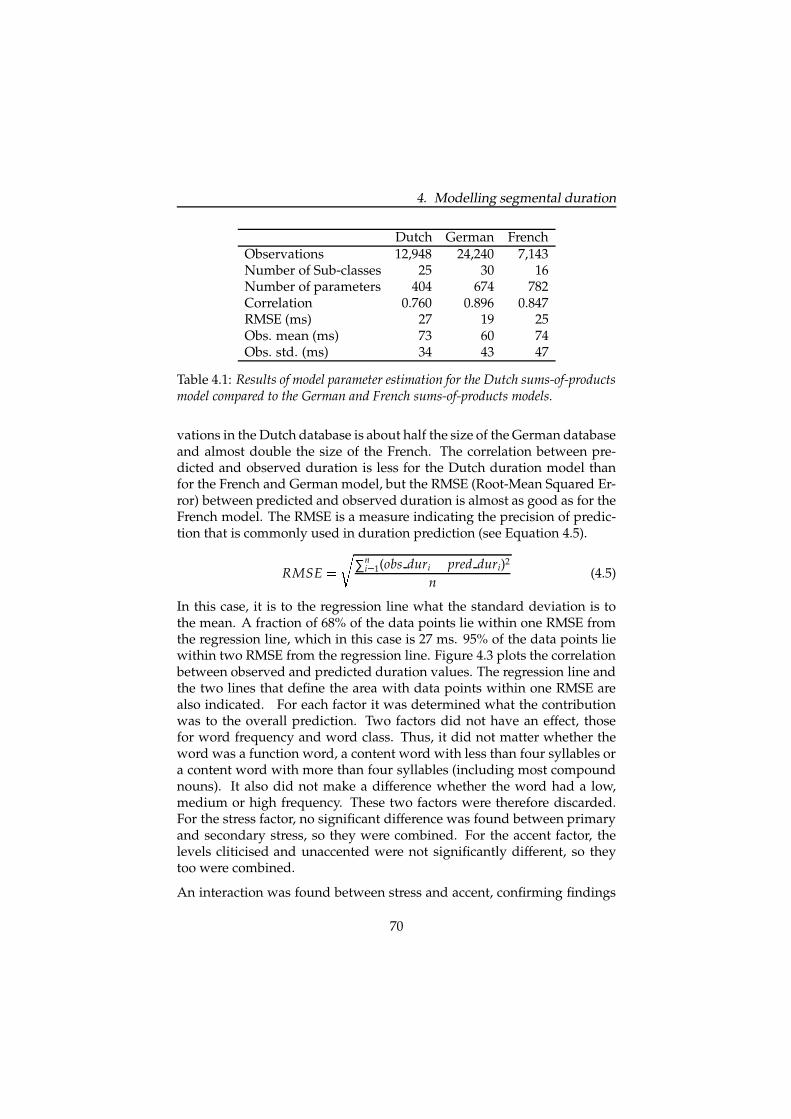
4. Modelling segmental duration
Dutch German FrenchObservations 12,948 24,240 7,143Number of Sub-classes 25 30 16Number of parameters 404 674 782Correlation 0.760 0.896 0.847RMSE (ms) 27 19 25Obs. mean (ms) 73 60 74Obs. std. (ms) 34 43 47
Table 4.1: Results of model parameter estimation for the Dutch sums-of-productsmodel compared to the German and French sums-of-products models.
vations in the Dutch database is about half the size of the German databaseand almost double the size of the French. The correlation between pre-dicted and observed duration is less for the Dutch duration model thanfor the French and German model, but the RMSE (Root-Mean Squared Er-ror) between predicted and observed duration is almost as good as for theFrench model. The RMSE is a measure indicating the precision of predic-tion that is commonly used in duration prediction (see Equation 4.5).
RMSE ��
∑ni � 1(obs duri
� pred duri)2
n(4.5)
In this case, it is to the regression line what the standard deviation is tothe mean. A fraction of 68% of the data points lie within one RMSE fromthe regression line, which in this case is 27 ms. 95% of the data points liewithin two RMSE from the regression line. Figure 4.3 plots the correlationbetween observed and predicted duration values. The regression line andthe two lines that define the area with data points within one RMSE arealso indicated. For each factor it was determined what the contributionwas to the overall prediction. Two factors did not have an effect, thosefor word frequency and word class. Thus, it did not matter whether theword was a function word, a content word with less than four syllables ora content word with more than four syllables (including most compoundnouns). It also did not make a difference whether the word had a low,medium or high frequency. These two factors were therefore discarded.For the stress factor, no significant difference was found between primaryand secondary stress, so they were combined. For the accent factor, thelevels cliticised and unaccented were not significantly different, so theytoo were combined.
An interaction was found between stress and accent, confirming findings
70
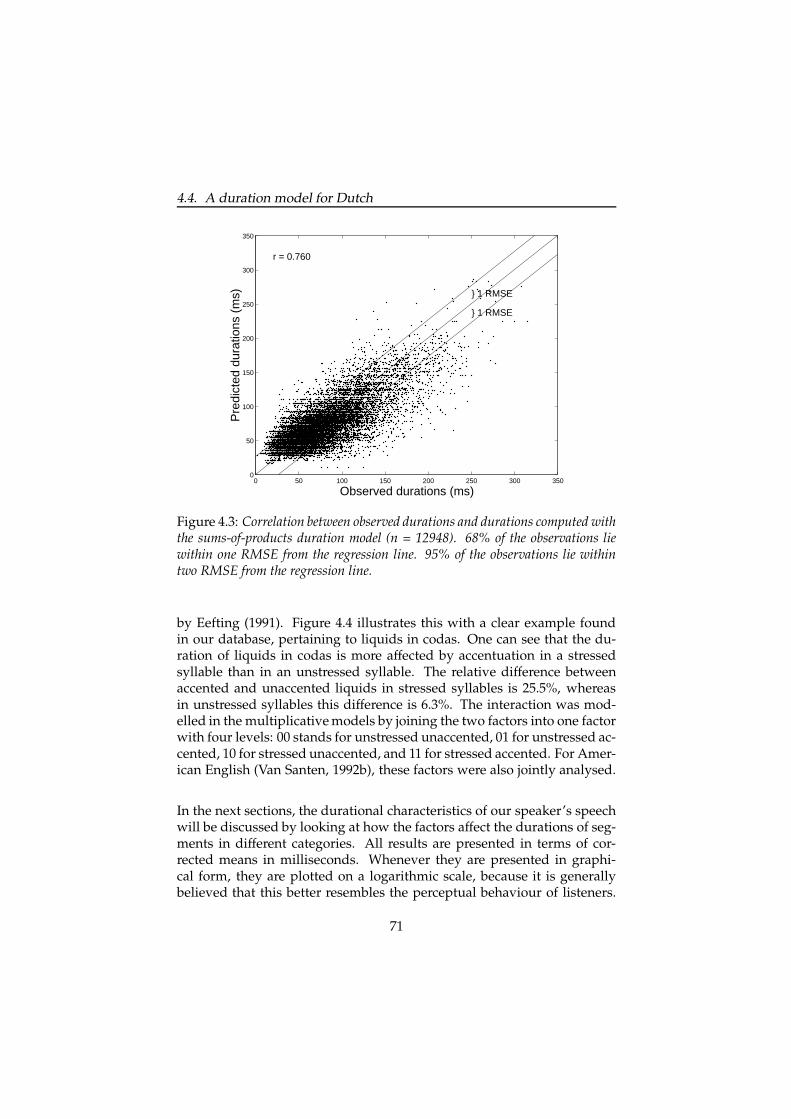
4.4. A duration model for Dutch
0 50 100 150 200 250 300 3500
50
100
150
200
250
300
350
} 1 RMSE
} 1 RMSE
Observed durations (ms)
Pre
dict
ed d
urat
ions
(m
s)
r = 0.760
Figure 4.3: Correlation between observed durations and durations computed withthe sums-of-products duration model (n = 12948). 68% of the observations liewithin one RMSE from the regression line. 95% of the observations lie withintwo RMSE from the regression line.
by Eefting (1991). Figure 4.4 illustrates this with a clear example foundin our database, pertaining to liquids in codas. One can see that the du-ration of liquids in codas is more affected by accentuation in a stressedsyllable than in an unstressed syllable. The relative difference betweenaccented and unaccented liquids in stressed syllables is 25.5%, whereasin unstressed syllables this difference is 6.3%. The interaction was mod-elled in the multiplicative models by joining the two factors into one factorwith four levels: 00 stands for unstressed unaccented, 01 for unstressed ac-cented, 10 for stressed unaccented, and 11 for stressed accented. For Amer-ican English (Van Santen, 1992b), these factors were also jointly analysed.
In the next sections, the durational characteristics of our speaker’s speechwill be discussed by looking at how the factors affect the durations of seg-ments in different categories. All results are presented in terms of cor-rected means in milliseconds. Whenever they are presented in graphi-cal form, they are plotted on a logarithmic scale, because it is generallybelieved that this better resembles the perceptual behaviour of listeners.
71

4. Modelling segmental duration
0−stress 1−stress
20
40
60
80D
urat
ion
(ms)
0−accent1−accent
Figure 4.4: The effect of stress and accent on the duration of liquids in codas.
Van Santen (1992a) explains this by saying that “a 50 ms discrepancy be-tween 65 and 15 ms is perceptually far more salient than a 50 ms discrep-ancy between 200 and 150 ms”. The complete listing of corrected meansfor all subclasses and their relevant factor levels is given in Appendix B.
4.4.2 Vowels
Within the class of vowels a distinction is made between vowels occur-ring in open and in closed syllables. Figure 4.5 illustrates the differencesbetween the two classes in terms of corrected means. The difference is es-pecially large in the case of long vowels and diphthongs. For the othervowel categories, the difference is negligible. Rietveld and Frauenfelder(1987) also conducted a study into this phenomenon, but the scope of theirstudy was restricted to the long vowels /e/ and /o/. The reason for main-taining the distinction between open and closed syllables even for thosecategories that do not differ in their corrected means, is that the effect ofthe following segment is probably different dependent on the presence orabsence of a syllable boundary.
72

4.4. A duration model for Dutch
diph lvow iuy svow schwa40
60
80
100
120
140
160
180
Vowel categories
Dur
atio
n (m
s)Open syllables Closed syllables
Figure 4.5: Corrected means of vowels in open and closed syllables.
Segment Previous Next Stress/ LPOS RPOSclass Accentlvow 1.15 1.22 1.53 1.11 1.71svow 1.13 1.59 1.44 - -iuy 1.69 2.11 1.41 1.27 2.69schwa 1.37 1.39 1.17 1.19 2.57
Table 4.2: Range ratios, indicating the proportional difference between the short-est and longest values for all levels on a factor, for vowels in open syllables.
Vowels in open syllables
Table 4.2 lists the range ratios for all factors. The range ratio is obtained bydividing the largest value by the smallest value on the levels of a factor,to give an indication of the amount of lengthening/shortening a certainfactor induces. (An overview of the corrected means per factor can befound in Tables B.1 to B.4.) A few observations can be made here. Forinstance, for iuy all factors have a large effect on the duration.
The previous segment has a minor effect on the vowels. A vowel is gener-ally longer after a sonorant than after an obstruent and often longer aftera voiced than after a voiceless obstruent. The difference between voicedobstruents and sonorants is quite small, but consistent, which is why we
73

4. Modelling segmental duration
maintained the distinction. For short vowels there is no distinctive dif-ference between the voiced and the voiceless context. The schwa showsdeviant behaviour, because it is shortest after a sonorant and longest afteran unvoiced obstruent.
The next segment has a considerable effect on the vowel duration. This isvisualised in Figure 4.6. The most obvious finding is that of lengtheningbefore /r/. This is most extreme for iuy, but is also considerable for othervowel categories. The phenomenon has been investigated before, amongothers by Nooteboom (1972). In his study, the vowels were produced inthe context pVrt, so the vowel always occurred in a closed syllable. Inopen syllables, the following consonant is always in the onset of the nextsyllable, and it is all the more remarkable that the effect is so large (thevowels /i/, /u/, and /y/ are twice as long before /r/ as before anothersonorant).
lvow iuy svow schwa20
40
60
80
100
120
140160180200220
sonorant
sonorant sonorant
sonorant
vowel
vowel
obstruent
obstruent
obstruent
unvoicedvoiced
r r
r
r
Vowel categories
Dur
atio
n (m
s)
Figure 4.6: Effect of next segment on vowels in open syllables.
74

4.4. A duration model for Dutch
lvow iuy svow schwa20
40
60
80
100
120
140160180200220
00
00
0000
01
01
0101
10
10
10
11
11
11
Vowel categories
Dur
atio
n (m
s)
Figure 4.7: Effect of stress and accent on vowels in open syllables; 00 = un-stressed/unaccented, 01 = unstressed/accented, 10 = stressed/unaccented, 11 =stressed/accented.
lvow iuy schwa20
40
60
80
100
120
140160180200220
syllable−final
syllable−final
syllable−final
word−final
word−final
word−final
phrase−final
phrase−final
phrase−final
Vowel categories
Dur
atio
n (m
s)
Figure 4.8: Effect of right position on vowels in open syllables.
75

4. Modelling segmental duration
When two vowels follow each other in Dutch, there is an optional butcommonly applied rule to insert a glottal stop between the two. In the fewcases where this does not occur, we see that the vowels are lengthened.This is caused by a glide-like change between the vowels. Since the seg-ment boundary is put in the middle of the glide, the lengthening occurs inboth the first and the second vowel.
The effect of stress and accent is very consistent in all vowel conditions (seeFigure 4.7). Vowels are always shorter in unstressed, unaccented positionthan in unstressed, accented position and also always shorter in stressed,unaccented position than in stressed, accented position. This nicely illus-trates the concept of directional invariance. It is also apparent that in eachof the four conditions, even in unstressed unaccented condition, the longvowels are always longer than iuy and the short vowels. The effect ofstress and accent is largest in long vowels, having a range ratio of 1.5. Theschwa is only allowed in unstressed syllables. Even there, one can see sig-nificant lengthening due to the presence of a pitch accent on the word. Itwas not examined whether there was a difference between the duration ofschwa in pre-focal or post-focal position.
The effect of left position is small. A distinction is maintained betweenword-initial and non-initial vowels, where the vowels are longer in thefirst context. This is in agreement with findings by Nooteboom (1972),who in unaccented three-syllable nonsense words also found the vowel inthe first syllable to be longer than the one in the second syllable. This im-plies that the speaker signals word boundaries by durational lengtheningat both ends of the word. The difference between vowels in word-initialand in non-initial syllables averages 8 ms.
The effect of right position is very large, which makes sense consideringthat the vowel in an open syllable always constitutes the final segmentin the syllable (see Figure 4.8). The number of levels is reduced to three:syllable-final, word-final, and phrase-final. Short vowels do not occur inword-final position in open syllables. They have to be followed by at leastone consonant in the coda. For the other vowels, the most extreme length-ening occurs on phrase-final syllables, but the difference between syllable-final and word-final syllables is also considerable.
76
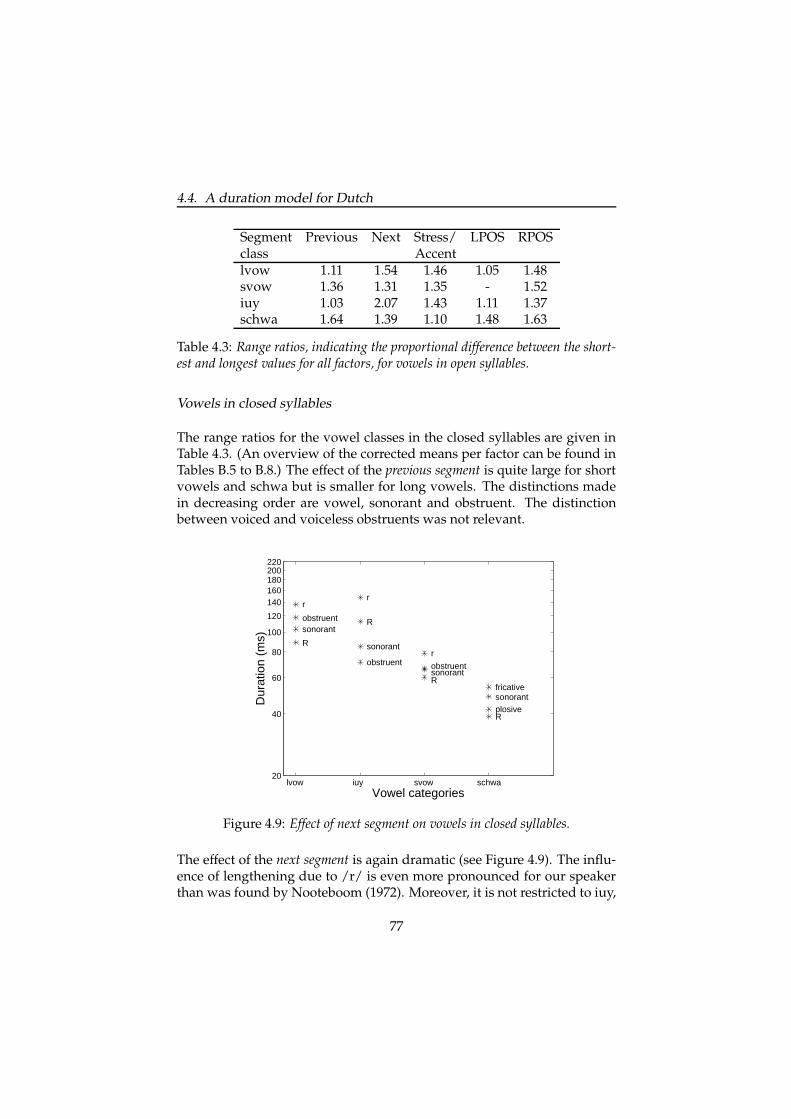
4.4. A duration model for Dutch
Segment Previous Next Stress/ LPOS RPOSclass Accentlvow 1.11 1.54 1.46 1.05 1.48svow 1.36 1.31 1.35 - 1.52iuy 1.03 2.07 1.43 1.11 1.37schwa 1.64 1.39 1.10 1.48 1.63
Table 4.3: Range ratios, indicating the proportional difference between the short-est and longest values for all factors, for vowels in open syllables.
Vowels in closed syllables
The range ratios for the vowel classes in the closed syllables are given inTable 4.3. (An overview of the corrected means per factor can be found inTables B.5 to B.8.) The effect of the previous segment is quite large for shortvowels and schwa but is smaller for long vowels. The distinctions madein decreasing order are vowel, sonorant and obstruent. The distinctionbetween voiced and voiceless obstruents was not relevant.
lvow iuy svow schwa20
40
60
80
100
120
140160180200220
sonorant
plosive
obstruent
obstruent
sonorant
obstruentsonorant
fricative
R
R
R
R
rr
r
sonorant
Vowel categories
Dur
atio
n (m
s)
Figure 4.9: Effect of next segment on vowels in closed syllables.
The effect of the next segment is again dramatic (see Figure 4.9). The influ-ence of lengthening due to /r/ is even more pronounced for our speakerthan was found by Nooteboom (1972). Moreover, it is not restricted to iuy,
77
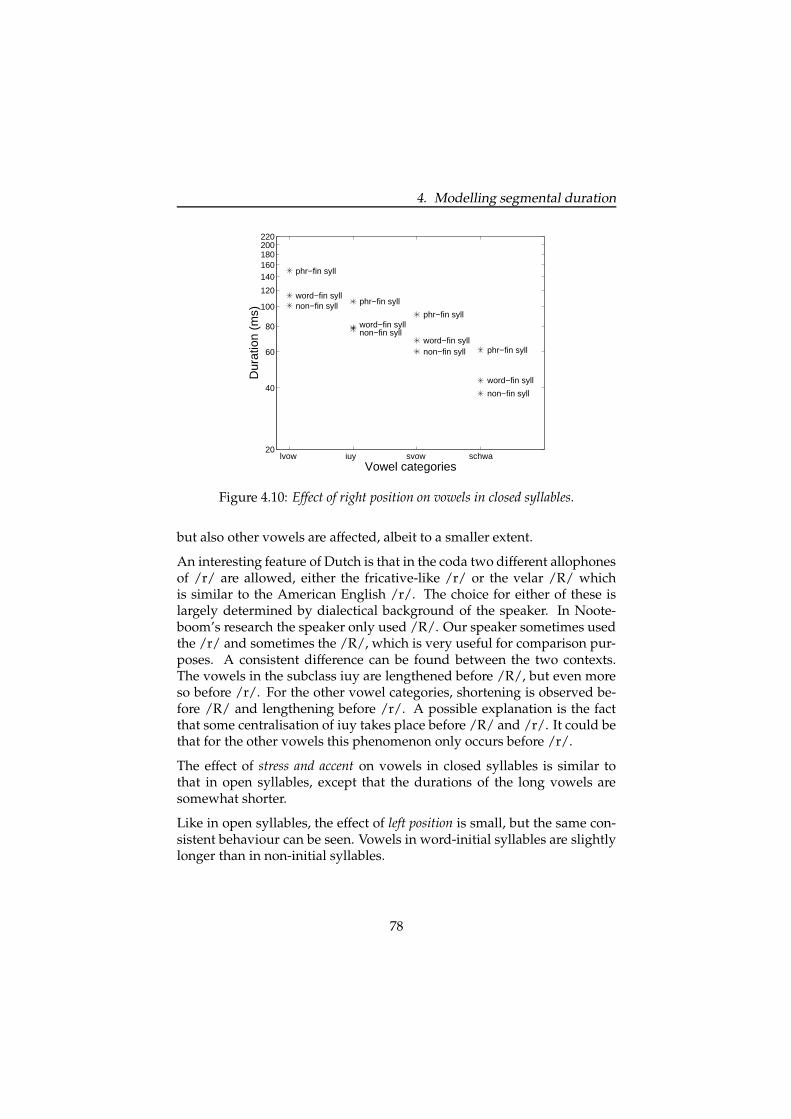
4. Modelling segmental duration
lvow iuy svow schwa20
40
60
80
100
120
140160180200220
non−fin syll
non−fin syll
non−fin syll
non−fin syll
word−fin syll
word−fin syll
word−fin syll
word−fin syll
phr−fin syll
phr−fin syll
phr−fin syll
phr−fin syll
Vowel categories
Dur
atio
n (m
s)
Figure 4.10: Effect of right position on vowels in closed syllables.
but also other vowels are affected, albeit to a smaller extent.
An interesting feature of Dutch is that in the coda two different allophonesof /r/ are allowed, either the fricative-like /r/ or the velar /R/ whichis similar to the American English /r/. The choice for either of these islargely determined by dialectical background of the speaker. In Noote-boom’s research the speaker only used /R/. Our speaker sometimes usedthe /r/ and sometimes the /R/, which is very useful for comparison pur-poses. A consistent difference can be found between the two contexts.The vowels in the subclass iuy are lengthened before /R/, but even moreso before /r/. For the other vowel categories, shortening is observed be-fore /R/ and lengthening before /r/. A possible explanation is the factthat some centralisation of iuy takes place before /R/ and /r/. It could bethat for the other vowels this phenomenon only occurs before /r/.
The effect of stress and accent on vowels in closed syllables is similar tothat in open syllables, except that the durations of the long vowels aresomewhat shorter.
Like in open syllables, the effect of left position is small, but the same con-sistent behaviour can be seen. Vowels in word-initial syllables are slightlylonger than in non-initial syllables.
78
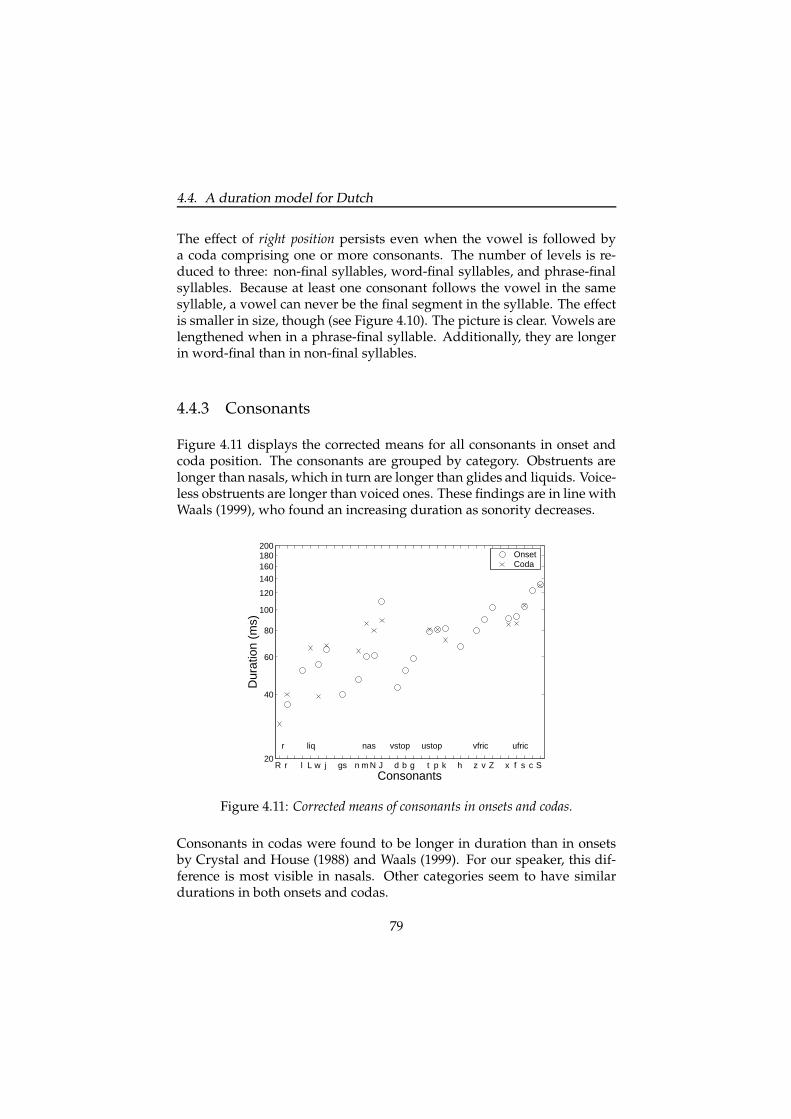
4.4. A duration model for Dutch
The effect of right position persists even when the vowel is followed bya coda comprising one or more consonants. The number of levels is re-duced to three: non-final syllables, word-final syllables, and phrase-finalsyllables. Because at least one consonant follows the vowel in the samesyllable, a vowel can never be the final segment in the syllable. The effectis smaller in size, though (see Figure 4.10). The picture is clear. Vowels arelengthened when in a phrase-final syllable. Additionally, they are longerin word-final than in non-final syllables.
4.4.3 Consonants
Figure 4.11 displays the corrected means for all consonants in onset andcoda position. The consonants are grouped by category. Obstruents arelonger than nasals, which in turn are longer than glides and liquids. Voice-less obstruents are longer than voiced ones. These findings are in line withWaals (1999), who found an increasing duration as sonority decreases.
R r l L w j gs n m N J d b g t p k h z v Z x f s c S 20
40
60
80
100
120
140
160180200
Consonants
Dur
atio
n (m
s)
r liq nas vstop ustop vfric ufric
OnsetCoda
Figure 4.11: Corrected means of consonants in onsets and codas.
Consonants in codas were found to be longer in duration than in onsetsby Crystal and House (1988) and Waals (1999). For our speaker, this dif-ference is most visible in nasals. Other categories seem to have similardurations in both onsets and codas.
79

4. Modelling segmental duration
Onsets
Segment Previous Next Stress/ LPOS RPOSclass Accentnas 1.94 1.08 1.66 1.37 1.04liq 1.63 1.22 1.33 1.22 -r 2.56 - 1.09 - -ufric 1.66 1.13 1.36 1.16 1.16vfric 3.83 - 1.45 1.21 1.08ustop 1.42 1.52 1.06 - 1.12ustop-cl 2.23 1.47 1.43 1.39 -vstop 1.28 1.30 1.05 - -vstop-cl 2.59 1.25 1.61 1.33 -h 1.35 1.76 1.11 - -gs 1.61 - 2.70 - 1.22
Table 4.4: Range ratios, indicating the proportional difference between the short-est and longest values for all factors, for vowels in open syllables.
Let us first focus on consonants in onsets to see what phenomena we canobserve. (An overview of the corrected means per factor can be foundin Tables B.9 to B.19.) In Table 4.4 we can see that the previous segmenthas a considerable effect. For some subclasses, the next segment is alsoimportant. Stress and accent have a large effect on most categories.
It is more difficult to generalise the effects of the previous and next factorto all consonant categories. There is much variation in them due to thedifferent distributional properties of the consonants. According to Dutchphonology, the onset can consist of a minimum of zero to a maximum ofthree consonants. When there is just one consonant, all consonants can oc-cur except /R/, /N/ and /L/, which occur only in codas. Bi-consonantalonsets can consist either of an /s/ followed by an obstruent or sonorant,or an obstruent followed by a liquid (/r/ or /l/). /zw/ is the only voicedobstruent-liquid pair. Tri-consonantal clusters occur only word-initially.They always start with /s/, which is considered to be extra-syllabic, fol-lowed by a voiceless obstruent and a liquid.
When sonorants (nasals, liquids and glides) occur on their own in the on-set, their duration is affected by the segment class of the last segment inthe preceding syllable. Sonorants are shortest when preceded by an ob-struent, which in a Dutch coda is always unvoiced, and longer after vow-els or sonorants. As an example, the corrected means for nasals are 51
80

4.4. A duration model for Dutch
ms after an obstruent, 74 ms after a vowel and 82 ms after a sonorant.When the obstruent is part of the same consonant cluster, the sonorant isshortened even more. A nasal is then 42 ms, indicating a 17% shorteningcompared to the obstruent-sonorant pair that is separated by a syllableboundary. No difference is observed between the duration of /l/ in bi-and tri-consonantal clusters. In addition, for /l/ in a bi-consonantal clus-ter, the voiced-unvoiced property of the preceding obstruent is irrelevant.For all sonorants, there is a small but consistent effect of the quantity ofthe next vowel. They are slightly longer (5-8 ms) before a long vowel thanbefore a short vowel.
The consonant /r/ is often counted among the liquids but our results indi-cate different behaviour with respect to previous and next context. It hasthe same distributional properties as /l/, but voicing of the preceding con-sonant in the cluster matters and shortening is greater in tri-consonantalclusters than in bi-consonantal clusters. The duration of /r/ is 46 ms whenpreceded by a voiced obstruent in the same syllable, 38 ms when precededby an unvoiced obstruent and 29 ms when preceded by an /s/ plus anunvoiced obstruent. Also, it is the only consonant that displays an effectof intervocalic shortening. The quantity of the next vowel (short or longvowel) is irrelevant.
The unvoiced fricatives /S/ and /c/ occur only as singletons. For all frica-tives occurring as singletons, their duration is shorter when preceded byan obstruent than when preceded by a vowel or sonorant. Bi-consonantalonsets can either consist of obstruent-obstruent combinations, for instance/sf/, /sx/, and /ts/, or of obstruent-sonorant combinations, for instance/xr/ and /fr/. In the first case, shortening of the fricative lies around 28%.In the latter case, we observe a small lengthening effect. For instance, /x/is 8 ms longer when followed by a sonorant than by a vowel.
In unvoiced stops, the closures are more affected by their segmental con-text than the bursts. The bursts are shortest when the stops occur as secondconsonant in a bi- or tri-consonantal cluster and the same goes for the clo-sures. When they are the first consonant in a cluster, the duration is notshortened. Only the identity of the preceding segment plays a role. Af-ter nasals, closures are shorter than after unvoiced obstruents. They arelongest after other sonorants. When followed by a vowel, the bursts areslightly shorter when the vowel is a schwa.
Voiced fricatives can either occur as singletons or as the first consonantin a bi-consonantal cluster followed by /l/ or /r/. The duration doesnot change in these two conditions. When preceded by a sonorant in the
81

4. Modelling segmental duration
previous syllable, it is longer than when preceded by an obstruent. Ineight cases, a voiced fricative occurred in a consonant cluster preceded bya voiced obstruent. These were all loan words from English, e.g., George/dZORtS/. In these cases, the /Z/ was extremely shortened.
The bursts in voiced stops were hardly effected by the context. The clo-sures were shortest when preceded by a nasal and longest when precededby a vowel. When followed by a schwa, it was also shortened somewhatin comparison to other contexts.
When the first phoneme in the onset has the same phoneme identity asthe last phoneme in the previous word, degemination occurs. This is aphonological phenomenon that deletes one of the consonants. A studyby Martens and Quene (1994) shows that complete deletion does not oc-cur. The duration is shorter than the sum of the two consonants normallywould be, but they are longer than in the case of a single consonant onset.Speech rate affects the amount of shortening. Our data shows the durationto be around 75% of the total duration of the two consonants rather than50%. In the case of stops, one stop is left which is about 15% longer thanwhen it would have occurred as a singleton.
vfric ufric h nas liq uclos vclos r ustop vstop
20
40
60
80
100
120140160
00 00
00 00 0000
00
0000
00
0101
01
0101
01
01 0101
01
1010
10 1010
10
10
1010
10
1111
1111
1111
1111
11
11
Stress and Accent
Dur
atio
n (m
s)
Figure 4.12: Effect of stress and accent on consonants in onsets; 00 = un-stressed/unaccented, 01 = unstressed/accented, 10 = stressed/unaccented, 11 =stressed/accented.
82

4.4. A duration model for Dutch
The effect of stress and accent varies greatly among categories (see Fig-ure 4.12). The largest effects can be observed in /h/, fricatives, and stopclosures. On stop bursts, this factor has only a small effect.
The effect of left position is small but consistent across all categories. Con-sonants are slightly longer when in a word-initial syllable than in a non-initial syllable. The effect of right position is equally small. Here, conso-nants are slightly longer in word-final syllables than in non-final syllables.Only in the case of unvoiced stops is there no difference between non-finaland word-final, but a small effect in phrase-final syllables can be observed,which implies that the entire final syllable in the phrase is affected to someextent. The setup of this study does not allow separate analysis of penul-timate syllables, so we do not know for sure whether the effect persistseven there. But considering the small effect on consonant onsets in thefinal syllable, an effect in the penultimate syllable is not very likely.
Codas
In Dutch codas, all obstruents are devoiced. Furthermore, the /h/ andglottal stop do not occur. This reduces the categories to six. Bi-consonantalcodas consist either of two obstruents (e.g., /pt/, /ts/, /ft/), two sono-rants (e.g., /lm/, /rn/), or a sonorant and an obstruent (e.g., /lp/, /nt/,/ft/). In tri-consonantal codas the last consonant is always a dental ob-struent (/t/ or /s/). The first two consonants can be two obstruents or asonorant followed by an obstruent.
Segment Previous Next Stress/ LPOS RPOSclass Accentnas 1.39 1.10 1.99 1.60 3.10liq - 1.75 1.38 1.20 2.18r - 1.78 1.92 - 2.21ufric 1.27 1.42 1.46 - 2.49ustop 1.37 1.75 1.39 - 5.29ustop-cl 2.30 1.45 1.26 - 1.37
Table 4.5: Range ratios, indicating the proportional difference between the short-est and longest values for all factors, for vowels in open syllables.
(An overview of the corrected means per factor can be found in Tables B.20to B.25.) The range ratios listed in Table 4.5 show that the right positionis the factor with the largest effect on codas. The effect of the previous
83

4. Modelling segmental duration
segment was only relevant for unvoiced obstruents and nasals. For theother categories, it was discarded. The next factor also had a considerableinfluence.
Of the unvoiced fricatives it is usually the /s/ occurring as the secondelement in a bi- or tri-consonantal cluster. It is shorter after a consonantthan after a vowel, and it also makes a difference whether the precedingconsonant is an unvoiced obstruent or a sonorant. The following segmenthas a lengthening effect when it is a consonant and a shortening effectwhen it is a vowel. The effect of left position was only relevant for nasalsand liquids. For other subclasses it was discarded.
The bursts in unvoiced stops are not affected very much by their segmentalcontext. They are shortest when followed by a voiced stop in the followingsyllable. Other than that, it is hardly relevant whether it is part of a largercluster or not. The closures however, are much more affected. In Table B.25we can see than when the unvoiced stop closure is in a cluster precededby a nasal the duration is 20 ms, when preceded by an unvoiced stop it is29 ms, and when preceded by a vowel or sonorant it is 45 ms. A stop canalso be the first consonant in a cluster followed by /s/. In that case, theclosure is slightly shorter than when it marks the end of the syllable.
For liquids and glides, the difference in duration between occurrence as asingleton or in a bi-consonantal cluster is only small. This is in line withfindings by Waals (1999). /L/ is shortest when followed by a schwa. For/r/, only the following segment matters. The /r/ is shortest when fol-lowed by a vowel. This is related to the intervocalic shortening observedin the onset /r/. When it is followed by an unvoiced obstruent in a bi-consonantal cluster, it is about 10 ms shorter than when followed by asyllable boundary.
There are only nine cases where a nasal is preceded by another sonorantin a coda. They are not shorter than when preceded by a vowel. When anasal is followed by a voiced obstruent in the onset of the next syllable, itis longer than when it is followed by any other category. In cases wherethe nasal is followed by an unvoiced obstruent in a bi-consonantal cluster,shortening takes place, although for /n/ this effect is minor. For /m/ thedifference is 30%.
Figure 4.13 shows similar behaviour to the effect of stress and accent ononset consonants. Nevertheless, the range ratios vary greatly betweenclasses. This also shows that the amount of interaction between stress andaccent is different for various subclasses.
84

4.4. A duration model for Dutch
ufric nas liq uclos r ustop
20
40
60
80
100
120140160180200
00
0000
00
00
00
01
0101
01
0101
10
10
10
1010
10
11
11
11
1111
11
Stress and Accent
Dur
atio
n (m
s)
Figure 4.13: Effect of stress and accent on consonants in codas; 00 = un-stressed/unaccented, 01 = unstressed/accented, 10 = stressed/unaccented, 11 =stressed/accented.
ufric nas liq uclos r ustop
20
40
60
80
100
120140160180200220
non−finword−fin
phr−fin syll
phr−fin
utt−fin
non−fin
word−fin
phr−fin
utt−fin
non−fin
word−fin
phr−finutt−fin
non−finword−finutt−fin
non−fin
word−fin
word−fin syll
phr−fin
non−fin
word−fin
phr−fin
utt−fin
Right position
Dur
atio
n (m
s)
Figure 4.14: Effect of right position on consonants in codas.
Figure 4.14 shows that the effect of right position on consonants in codas isconsiderable. It has often been reported that lengthening occurs at the end
85
4. Modelling segmental duration
of a phrase or sentence. Our results also show word-final consonants tobe longer than non-final ones. The greatest effect is achieved on unvoicedstop bursts. The unvoiced stop closures however, are hardly affected.
4.4.4 Conclusion
This concludes the discussion of the duration model developed for Dutchusing the sums-of-products approach. We have seen that with a relativelysmall corpus of 297 sentences (16,775 segments) a duration model can beconstructed with a RMSE of 27 ms. The use of phonetic and phonologicalknowledge in the construction of the category tree and the data analysis,which was designed specifically for this purpose, results in a model thatreflects the most important effects and interactions found in factors influ-encing duration prediction.
It could be observed that directional invariance holds for most categories,justifying the approach taken to generalise to unseen cases in the sums-of-products model. Even though the results only reflect data from one par-ticular speaker, some effects reported on in literature on Dutch durationcould be confirmed. First, the large effect of /r/ on the vowels /i/, /u/,and /y/ reported on by Moulton (1962) and Nooteboom (1972) was con-firmed. Because the data used in our study is closer to natural speech thanin their small-scale studies, it can even be refined. It was found that con-siderable lengthening takes place regardless of whether the /r/ occurredin the coda of the same syllable or in the onset of the next syllable, al-though the lengthening effect was not so great in the latter case. Further-more, the effect was larger when iuy were followed by a fricative /r/ thanby a velar /R/.
Second, the interaction between stress and accent as found by Eefting(1991) was confirmed. For this reason, these two factors were combinedinto one factor.
Third, it was found that lengthening of consonants and vowels occurs bothin word-initial and in word-final syllables. This is probably an importantcue for listeners to segment a stream of sounds into words.
Two additional observations have been made with respect to the data thatare not included in the model. The first observation is that for all conso-nants, the coronal consonants usually show a larger effect than labial andpost-coronal consonants. Van Son and Van Santen (1997) found the same
86
4.5. Evaluation
result for American English speech data. We decided not to include thisparameter in our model, as the training corpus would need to be extendedconsiderably and only a small improvement was to be expected.
The second observation is an interaction between stress and accent andright position. The effect of right position, i.e., lengthening in phrase-finalsyllables, appears to be attenuated by the effect of stress and accent. Thisis in line with findings by Cambier Langeveld (2000) on Dutch durationdata. Cambier Langeveld (2000) compared the Dutch data to English data,but found no such interaction there. This interaction was not included inour model, again because a considerable extension of the training corpuswould be necessary.
4.5 Evaluation
In this section, the performance of the new sums-of-products durationmodel (NDM) and the old rule-based duration model (ODM) will be com-pared. Section 4.5.1 discusses a perceptual experiment in which sentencesgenerated with the diphone synthesis system using either the NDM or theODM were presented to a group of listeners in a pairwise comparison.Section 4.5.2 discusses a quantitative comparison between the NDM andthe ODM.
4.5.1 Subjective evaluation
In order to find out which duration model listeners prefer, a paired com-parison listening experiment was performed.
Material
The material for the experiment consisted of 20 sentences taken from newsreports on Teletext. Each sentence had a duration of between 6 and 8 sec-onds, i.e., long enough to get a good impression of its durational struc-ture. The number of phonemes per sentence ranged from 58 to 93. Eachsentence was generated twice with the same diphone synthesis system,once using the old duration model and once using the new model. Thedurations were not normalised for differences in speaking rate, since this
87
4. Modelling segmental duration
difference was less than 5%. Moreover, if changes in speaking rate areachieved by linear lengthening or shortening, they might have an effecton the accuracy of the predicted durations and thus on the output quality.Prior to the start of the experiment, an example pair was played to intro-duce the task at hand. See Appendix C for a description of the sentencesused. They can be listened to on the accompanying web site.
Procedure
The experiment was presented over the internet, using a standard Web-browser. The participants needed a PC or SGI station with audio output,a speaker and a headset. They had to press a button to listen to a pair ofsentences and had to express their preferences on a five-point scale whichcorrespond to the following statements:
� -2: I prefer the first sentence strongly over the second sentence.
� -1: I prefer the first sentence slightly over the second sentence.
� 0: I do not have a preference for either the first or the second sen-tence.
� 1: I prefer the second sentence slightly over the first sentence.
� 2: I prefer the second sentence strongly over the first sentence.
The sentences were presented in random order. In 10 out of 20 cases, thefirst sentence was generated with the ODM and the second sentence wasgenerated with the NDM (order i � j), and in the 10 other cases it was theother way around (order j � i). The presentation of these different orderswas also randomised for each participant.
Subjects
Twenty participants with a background in phonetics took part in the ex-periment. They had no reported hearing problems and were not paid fortheir participation.
88

4.5. Evaluation
Results
The scores were processed such that negative scores indicated a prefer-ence for the old model and positive scores indicated a preference for thenew model. With 20 participants rating 20 sentence pairs, a total of 400observations was obtained. Figure 4.15 displays the distribution of scoresin the experiment. The mean score was 0.1125, which reveals a slight pref-erence for the new model over the old one. The standard deviation was1.17. A one-sample t-test was conducted (t(399) = 1.920, p = 0.056), whichrevealed that the difference of the mean from zero was not significant. The95% confidence interval for the mean ranged from -0.003 to 0.23.
−2 −1 0 1 20
50
100
150
mean = 0.1125
Difference scores
Num
ber
of o
ccur
renc
es
Figure 4.15: Results from the preferential choice experiment.
A Wilcoxon Matched-Pairs Signed Ranks Test (Sheskin, 1996) was per-formed. It is more sensitive than the sign test in that it considers the size ofthe differences in positive and negative direction and tests whether theyhave the same probability. Zero scores are ignored. The result (W- 20024,W+ 25427, N=301, p � = 0.06) shows that there are more and larger positivescores than negative ones, but the difference is not significant. So one hasto conclude that the NDM is not judged as being significantly better thanthe ODM. Next to this overall impression, the results per sentence werealso considered to detect any differences between them. Per sentence, aWilcoxon Matched-Pairs Signed Ranks Test was performed. It proves thatthe NDM is judged as being significantly better in 5 cases and the ODM is
89

4. Modelling segmental duration
judged as being significantly better in 3 cases (For details see Table 4.6). Inthe other 12 cases, the difference is not significant.
NDM preferredsentence 2 W- 12 W+ 66 N = 15 p � 0.03sentence 4 W- 15 W+ 156 N = 18 p � 0.001sentence 6 W- 4.5 W+ 148.4 N = 17 p � 0.001sentence 8 W- 17.5 W+ 73.5 N = 13 p � 0.05sentence 11 W- 4 W+ 51 N = 10 p � 0.02sentence 5 W- 32 W+ 104 N = 16 n.s.sentence 9 W- 34 W+ 102 N = 16 n.s.sentence 10 W- 41 W+ 95 N = 16 n.s.sentence 13 W- 28.5 W+ 37.5 N = 11 n.s.sentence 15 W- 57.5 W+ 132.5 N = 19 n.s.
ODM preferredsentence 1 W- 97.5 W+ 22.5 N = 15 p � 0.03sentence 16 W- 116.5 W+ 19.5 N = 16 p � 0.01sentence 19 W- 145.5 W+ 44.5 N = 19 p � 0.04sentence 3 W- 80 W+ 73 N = 17 n.s.sentence 7 W- 105.5 W+ 47.5 N = 18 n.s.sentence 12 W- 33 W+ 22 N = 10 n.s.sentence 14 W- 69 W+ 51 N = 15 n.s.sentence 17 W- 52.5 W+ 52.5 N = 14 n.s.sentence 18 W- 114.5 W+ 38.5 N = 17 n.s.sentence 20 W- 61 W+ 30 N = 13 n.s.
Table 4.6: Wilcoxon Matched-Pairs Signed Ranks Test for each of the sentencesin the evaluation experiment.
4.5.2 Quantitative comparison between observed and pre-dicted durations
In order to make some statement about the objective performance of theODM and NDM, correlations and RMS errors were computed for bothmodels relative to the observed durations in the training corpus. Aftercomputing these measures for the entire corpus, they were computed sep-arately for each of the phonetic subclasses. Table 4.7 shows the data ob-tained. In the field of automatic speech recognition and pattern recogni-tion, it is common practice to evaluate the performance on an independent
90

4.5. Evaluation
test set. In this study, in order to get a good view of the performance ofboth duration models, a large test set would be required, covering all sub-classes and factors sufficiently. It would require a lot of effort to recordand segment this test set, which was not available at the time. However,Maghbouleh (1996) has shown that RMSE and correlations are approxi-mately equal on training and testing data for the sums-of-products ap-proach. Therefore, it is expected that the results presented in Table 4.7 willbe similar to the situation where an independent test set is used.
NDM ODMClass N Corr RMSE (ms) Corr RMSE (ms)
all 12918 0.76 26.96 0.62 31.88Nucleus lvow 739 0.70 33.30 0.47 42.13(open) svow 214 0.33 21.17 0.27 20.85
iuy 358 0.68 27.82 0.53 33.98schwa 692 0.40 24.66 0.41 23.49
Nucleus lvow 601 0.61 36.27 0.49 41.89(closed) svow 1424 0.56 19.28 0.49 20.19
iuy 164 0.75 26.14 0.64 28.96schwa 739 0.20 30.16 0.29 32.96
onset ustop 797 0.48 24.17 0.43 31.72ufric 685 0.53 26.20 0.26 31.01vstop 852 0.53 24.36 0.41 25.63vfric 583 0.52 25.39 0.15 39.17nas 493 0.65 21.64 0.38 26.80liq 556 0.55 19.31 0.34 23.77r 412 0.41 23.42 0.30 33.00h 148 0.38 28.76 0.35 27.03
coda ustop 848 0.75 37.56 0.59 43.42ufric 637 0.77 30.07 0.58 38.85nas 1116 0.60 27.17 0.42 29.24liq 247 0.66 21.34 0.25 27.27r 513 0.54 19.34 0.45 29.53
Table 4.7: Objective evaluation of NDM and ODM in terms of Pearson’s r cor-relation and RMSE relative to the observed durations.
Table 4.7 shows that the performance of the NDM on the entire corpusis better than that of the ODM. The correlation is higher (0.76 vs. 0.62)and the RMSE is lower (27 vs. 32 ms). A paired-samples t-test which wasperformed comparing the correlations of the subclasses for the new andold model, shows that the correlations in the new model are significantlyhigher than in the old one (t(20) = 5.637, p � 0.001). The mean differencewas 0.15 with a 95% confidence interval running from 0.09 to 0.20. Thedifference in RMSE is also significant (t(20) = -5.599, p � 0.001). On av-
91

4. Modelling segmental duration
erage the RMSE is 4.9 ms shorter with a 95% confidence interval between3.09 and 6.76. The largest difference can be observed in the subclass con-taining voiced fricatives in onsets, where the difference in RMSE is 14 ms.The schwa is difficult to predict with high accuracy as the low correlationsuggests. The short vowels are predicted equally well by the new and theold duration model.
4.6 Discussion
4.6.1 Explanation of findings
In the previous section, it was observed that although the objective eval-uation shows an improvement of the new duration model over the oldone, the subjective evaluation does not convincingly support that finding.There could be several reasons for this. First, the objective differences be-tween the NDM and ODM are often very small. It could be the case thatthey are below threshold. Second, it is observed that the occurrence of oneor more errors in the prediction has an effect on the perceived quality ofthe entire sentence. Third, it could be that the poor quality of the synthesisitself causes differences in duration to go unnoticed.
In informal listening we have observed that the new duration model usu-ally has a better rhythmic build-up than the old model. Analysis of thetwenty sentences used in the experiment reveals the differences in predic-tion quite well.
1. Diphthongs are usually longer in the ODM than in the NDM. Thiswas known to be a problem in the ODM. RMSE values obtained inthe comparison of both duration models with the observed dura-tions in the corpus show that the new model indeed has a smallerprediction error for diphthongs than the old model (29.4 versus 44.3ms).
2. Voiced fricatives are often much longer in the new model than in theold model. Because the objective evaluation presented in Table 4.7reveals that the voiced fricatives are predicted much more accuratelyby the new model than by the old one (RMSE of 25.4 vs. 39.2 ms), wefeel safe in saying that in this respect the NDM is superior.
3. Lengthening of the vowels /i/, /u/, and /y/ before /r/ is often
92

4.6. Discussion
much greater in the new model than in the old one. The RMSE valuesconfirm that the new model is more accurate (37.9 versus 49.9 ms).
4. Phrase- and sentence-final lengthening is sometimes much larger forthe NDM than for the ODM.
This chapter has shown that a duration model using the sums-of-productsapproach can be produced in a very straightforward manner, resulting ina quality that is as good as the old duration model, and in some cases evenbetter. There are still a few things left for future research. First, it wouldbe worthwhile to record the twenty sentences of the subjective evaluationexperiment using the same female speaker, and compare the observed du-rations to those predicted by the ODM and the NDM. The availability ofthese sentences in natural speech also makes it possible to transplant thepredicted durations onto these sentences, such that the poor quality of thesynthesis is factored out. The perceptual experiment can then be repeated.Second, the NDM can be further improved by adding more training data.
In a study by Bellegarda (1998), an improved duration modelling with thesums-of-products approach was proposed using a root-sinusoidal trans-formation on the raw durations instead of a logarithmic one. In his view,short durations are underestimated and long durations are overestimatedin the sums-of-products approach. The transformation is carried out us-ing Equation 4.6. There x represents the raw duration, A is the minimumobserved duration in the training corpus and B is the maximum observedduration.
F(x) � sin
���2
� x � AB � A � 0 � 8 � 2
(4.6)
Applying this transformation to the durations obtained with the NDMdid not give a significant improvement. The new correlation with the ob-served duration is 0.761 and the RMSE is 30.91, which is worse than whatwas obtained with the standard sums-of-products model. Apparently, itis not the case that short durations are underestimated and long durationsare overestimated (as can also be deducted from Figure 4.3), or else theimprovement would have been clear.
4.6.2 Finding a meaningful predictor for perceived quality
Another important issue is that it is not certain whether the RMSE is anadequate predictor of perceived quality. It does not take into account the
93

4. Modelling segmental duration
fact that errors in prediction may be less or more acceptable dependent onthe phoneme class (e.g. vowels vs. consonants), the stress or accent status,or the position of the syllable in the word, etc. In a study by Kato, Tsuzaki,and Sagisaka (1998), it was investigated what the listeners’ acceptabilityfor temporal modification was of single vowel segments in isolated words.It was shown that the acceptable range of modification depended on theposition of the vowel in the word, such that the range was narrower forvowels in the first moraic position versus the third moraic position. It wasalso narrower for the vowel /a/ than for /i/ and similarly narrower forvowels followed by unvoiced consonants than voiced consonants. Thissuggests that the RMSE may not be a suitable predictor of acceptabilitybecause no weighting of factors takes place.
Cordoba et al. (1999) proposed the use of a relative RMSE instead of an ab-solute RMSE, in which the average duration t and the optimum durationsti are taken into account.
RelativeRMSE � RMSE�(ti
� t)2(4.7)
However, Kato et al. (1998) also found in their study that the base durationof the vowels did not affect the acceptable range of modification, despitethe fact that the durations varied widely (between 35 and 145 ms). Thisimplies that a relative RMSE will not be a better predictor than the absoluteRMSE. It must be marked however, that the results presented by Kato et al.(1998) have been obtained in a small-scale study using isolated words andit is not obvious how this generalises to natural running speech as used inour own database.
94
Chapter 5Summary and conclusion
5.1 Summary of findings
This thesis aimed at finding segmental and prosodic improvements inspeech generation. Two types of speech generation were investigated: di-phone synthesis and phrase concatenation. The research was carried outin the context of a spoken dialogue system called OVIS, which gives traintimetable information over the telephone. In this type of applications, theapproach to speech generation is often very simplistic. The speech out-put is achieved by a straightforward concatenation of words and phrases.They literally correspond to the text that is to be spoken. This approach hasa major drawback in that it lacks variability in accentuation and the mark-ing of phrase boundaries, which is essential for creating natural speech.Proper accentuation is necessary to highlight the information structureof the messages by accenting new or contrastive information and deac-centing given information, and prosodic boundary marking helps to high-light the linguistic structure of the messages by dividing them into smallerpieces that can be comprehended more easily. The fact that the words andphrases to be concatenated are often spoken in isolation results in mis-matches in pitch, loudness and tempo which makes the speech sound lessfluent.
In OVIS, the natural language generation module provides the prosodicinformation needed to introduce the required variability. It generates thelocation of accents and phrase boundaries on the basis of syntactic, seman-tic and pragmatic information. These locations can be predicted with more
95

5. Summary and conclusion
accuracy via a data-to-speech system than when a text-to-speech systemcomputes them from unknown text.
The speech generation module had to be extended, so that it could ac-commodate the prosodic variability introduced by the natural languagegeneration module. To this end, an advanced phrase concatenation tech-nique was developed that is superior to a straightforward sequencing ofwords and phrases. Different versions of words were recorded depen-dent on whether they occur in an accented or unaccented condition and onwhether they occur before a phrase boundary of some depth. All wordsand phrases were recorded in the proper context, to automatically elicitthe appropriate versions. That and a careful recording resulted in speechoutput that sounded almost as fluent as natural speech and that minimisedthe occurrence of mismatch in pitch, loudness and tempo.
The drawback of this phrase concatenation approach is that a consider-able amount of phonetic knowledge is required to construct a corpus thatcovers the sentences the natural language generation module creates withtheir prosodic variations. For every new application, this has to be fig-ured out again. Moreover, this approach to speech generation only worksfor applications that suffice with a medium-sized stable vocabulary. Thereis a maximum to the amount of speech a speaker can utter with adequateconstancy and regular updates of the recordings will soon become imprac-tical. When the need for flexibility increases, speech synthesis is the onlyalternative that is left. Although the most popular implementation, i.e., di-phone synthesis, is fairly intelligible, listeners still judge the overall qualitytoo low for it to be used in commercial applications.
Chapter 3 and 4 concentrated on two problems affecting the quality of di-phone synthesis. A significant problem that interferes with the segmentalquality is the occurrence of audible discontinuities at diphone boundaries.In Chapter 3, it was shown that the addition of context-sensitive diphonesto the standard diphone database reduces the number of audible discon-tinuities. These discontinuities are mainly caused by spectral mismatch atthe diphone boundaries. A listening experiment was conducted to investi-gate the extent to which discontinuities are perceived. The results revealedconsiderable differences between the vowels under investigation. The /a/showed the smallest percentage of perceived discontinuities, followed bythe /i/. The /A/ and /I/ showed a higher percentage, but the largest per-centage of perceived discontinuities was found in the /u/. The alveolarsaccount for most of the coarticulation, probably because their F2 is muchhigher than that for /u/. The scores obtained in the listening experiment
96

5.1. Summary of findings
were correlated with several spectral distance measures to find an objec-tive measure that predicts the occurrence of audible discontinuities. Thecorrelation was performed using Receiver Operator Characteristics. TheKullback-Leibler (KL) distance, coming from statistics, was shown to bemost adequate for the task.
Context-sensitive diphones were added to the diphone database. In orderto limit the number of additional diphones, the KL distance was used tocluster consonantal contexts with similar spectral effects on the neighbour-ing vowels. A second listening experiment was conducted for the vowels/a/, /i/, and /u/, to evaluate the improvement obtained with this addi-tion to the database. The results show that the number of audible disconti-nuities has significantly decreased for all vowels. The KL distance has sig-nificantly decreased for /i/ and /u/, but not for /a/. Future research inthis area could be directed at extending the diphone database even further,including context-sensitive diphones for other phonemes that are heav-ily affected by coarticulation, for instance /o/, /O/ and /y/ and semi-vowels like /l/ and /w/. An additional improvement might be obtainedby recording several repetitions of each diphone to be able to select theone that best fits a particular context.
A second problem that affects the prosodic quality is the inadequate pre-diction of segmental durations. Therefore, a new duration model wasdeveloped using the sums-of-products approach of Van Santen (1992a).Chapter 4 reports on the development of this new model. With a rela-tively small corpus of 297 sentences, containing 16,775 segments, a dura-tion model could be constructed, which compares well with similar mod-els constructed for French and German. The use of phonetic and phono-logical knowledge in the construction of the category tree and the dataanalysis, which was designed specifically for this purpose, results in amodel that incorporates the most important effects and interactions foundin factors influencing duration prediction.
The performance of the old and the new duration models was evaluatedby comparing them to the actual segmental durations in the 297-sentencetraining corpus. The new model was shown to be a significant improve-ment over the old one. A perceptual pairwise comparison experiment us-ing sentences generated with the old and new model, did not provide con-clusive evidence for the improvement. There could be additional reasonsfor this. First, the objective differences between the new duration modeland the old one are often very small. It could be the case that they are be-low threshold. Second, it was observed that the occurrence of one or more
97

5. Summary and conclusion
errors in the prediction has an effect on the perceived quality of the entiresentence.
5.2 Conclusion and future research
The research presented in this thesis has shown that with basic phoneticresearch and detailed perceptual experiments, some major problems indiphone synthesis and phrase concatenation could be brought closer toa solution. Unfortunately, the inherent disadvantages of these two ap-proaches still remain. Although phrase concatenation can now producenear-natural speech, it is still inflexible in that units have to be carefullyselected, recorded and excised. Diphone synthesis still produces unnatu-ral results. Probably the most important problem in diphone synthesis isthe deterioration of the speech quality due to signal modifications. Thiscan be remedied in two ways, either by coming up with a new signal rep-resentation that leaves the original speech quality intact or by avoidingsignal modification as much as possible.
As a possible solution for both speech generation techniques, an exten-sion to diphone synthesis often referred to as unit selection has becomequite popular recently (Campbell and Black, 1997; Black and Taylor, 1997;Balestri, Pacchiotti, Quazza, Salza, and Sandri, 1999). It differs from con-ventional diphone synthesis systems in a number of ways. First, the cor-pus can often be many times larger than the standard diphone database,allowing for several instances of units that vary in context, in terms of e.g.,surrounding phonemes, stress, accentuation, and position in the word orphrase. Second, the size of the unit can be non-uniform. By segmentingthe database into half phones, units ranging from phones and diphonesto syllables, words and even phrases can be selected. And third, the unitsneed not be extracted off-line, but can be selected on-line on the basis ofautomatic selection criteria that compute the concatenation cost, i.e., howwell will this unit concatenate with the previously selected unit, and thetarget cost, i.e., how well does this unit fit the computed prosodic charac-teristics.
When the database is tuned to a particular application, the vocabularycoverage increases, which makes the approach similar to the phrase con-catenation approach described in Chapter 2 of this thesis. The only dif-ference is that the units are not pre-excised. A first attempt is reported byStober et al. (1999), who used it in the Verbmobil project, an application
98

5.2. Conclusion and future research
which offers translation assistance in a dialogue situation.
The general expectation of this unit selection approach is that less audi-ble discontinuities will occur because the units are selected from the bestsuitable context and because the number of concatenative boundaries isusually lower. Moreover, because the units are taken from the appropriateprosodic and acoustic context their prosodic characteristics will better fitthe previously selected units, thus making prosodic modifications unnec-essary in many cases.
The success of unit selection crucially depends on the knowledge that wasgained with diphone synthesis and phrase concatenation in the past. Theconstruction of the corpus is the most important step in the developmentof such a synthesis system. Similar to the duration corpus presented inChapter 4, it has to cover a large feature space taking into account preced-ing and following phonemes, stress, accentuation and positional factors.In many cases complete coverage will not be possible, thus requiring di-phones as a backup. Computation of F0 and duration is still necessaryto compare units to target values and to make slight modifications when-ever needed. A suitable spectral distance measure is essential to computethe concatenation cost in order to avoid audible discontinuities at the unitboundaries. Even then, discontinuities can occur due to differences inloudness or voice quality.
Whether unit selection is the solution to generate natural sounding speech,remains to be seen. This question can only be answered by continuing ba-sic phonetic, prosodic and perceptual research in the area of speech syn-thesis.
99

5. Summary and conclusion
100

Bibliography
Aust, H., M. Oerder, F. Seide, and V. Steinbiss (1995). The Philips auto-matic train timetable information system. Speech Communication 17,249–262.
Balestri, M., A. Pacchiotti, S. Quazza, P. Salza, and S. Sandri (1999).Choose the best to modify the least: A new generation concatena-tive synthesis system. In: Proceedings of the 6th European Conference onSpeech Communication and Technology (EUROSPEECH’99), Budapest,Hungary, Volume 5, pp. 2291–2294.
Bellegarda, J. (1998). Improved duration modeling of English phonemesusing a root sinusoidal transformation. In: Proceedings of the 5th Inter-national Conference on Spoken Language Processing (ICSLP’98), Sydney,Australia, Volume 2, pp. 21–24.
Black, A. and P. Taylor (1997). Automatically clustering similar unitsfor unit selection in speech synthesis. In: Proceedings of the 5thEuropean Conference on Speech Communication and Technology (EU-ROSPEECH’97), Rhodes, Greece, Volume 2, pp. 601–604.
Boersma, P. and D. Weenink (1996). Praat, a system for doing Phonet-ics by Computer. Report 132, Institute of Phonetic Sciences of theUniversity of Amsterdam, Amsterdam. http://www.praat.org/.
Bonnema, R., R. Bod, and R. Scha (1997). A DOP model for semanticinterpretation. In: Proceedings of the ACL/EACL 1997, Madrid, Spain,pp. 159–167.
Cambier Langeveld, T. (2000). Temporal marking of accents and boundaries.Ph. D. thesis, University of Amsterdam.
Campbell, N. and A. Black (1997). Prosody and the selection of sourceunits for concatenative synthesis. In: J. Van Santen, R. Sproat,
101
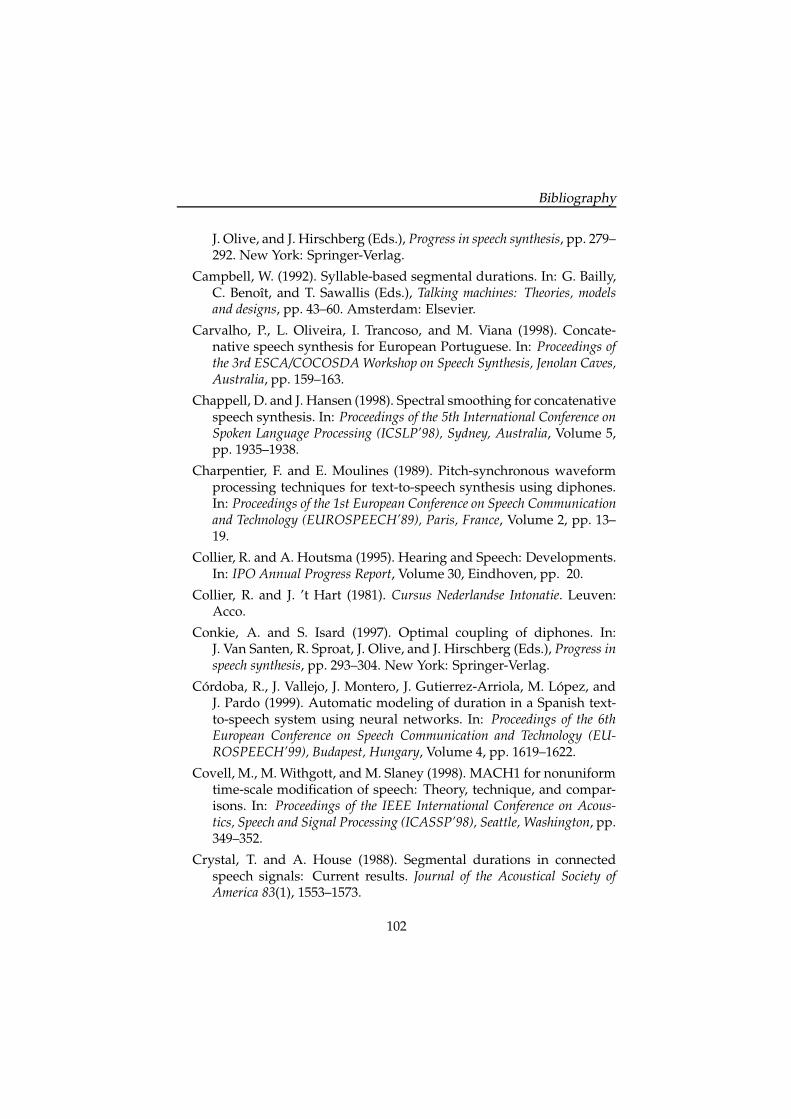
Bibliography
J. Olive, and J. Hirschberg (Eds.), Progress in speech synthesis, pp. 279–292. New York: Springer-Verlag.
Campbell, W. (1992). Syllable-based segmental durations. In: G. Bailly,C. Benoıt, and T. Sawallis (Eds.), Talking machines: Theories, modelsand designs, pp. 43–60. Amsterdam: Elsevier.
Carvalho, P., L. Oliveira, I. Trancoso, and M. Viana (1998). Concate-native speech synthesis for European Portuguese. In: Proceedings ofthe 3rd ESCA/COCOSDA Workshop on Speech Synthesis, Jenolan Caves,Australia, pp. 159–163.
Chappell, D. and J. Hansen (1998). Spectral smoothing for concatenativespeech synthesis. In: Proceedings of the 5th International Conference onSpoken Language Processing (ICSLP’98), Sydney, Australia, Volume 5,pp. 1935–1938.
Charpentier, F. and E. Moulines (1989). Pitch-synchronous waveformprocessing techniques for text-to-speech synthesis using diphones.In: Proceedings of the 1st European Conference on Speech Communicationand Technology (EUROSPEECH’89), Paris, France, Volume 2, pp. 13–19.
Collier, R. and A. Houtsma (1995). Hearing and Speech: Developments.In: IPO Annual Progress Report, Volume 30, Eindhoven, pp. 20.
Collier, R. and J. ’t Hart (1981). Cursus Nederlandse Intonatie. Leuven:Acco.
Conkie, A. and S. Isard (1997). Optimal coupling of diphones. In:J. Van Santen, R. Sproat, J. Olive, and J. Hirschberg (Eds.), Progress inspeech synthesis, pp. 293–304. New York: Springer-Verlag.
Cordoba, R., J. Vallejo, J. Montero, J. Gutierrez-Arriola, M. Lopez, andJ. Pardo (1999). Automatic modeling of duration in a Spanish text-to-speech system using neural networks. In: Proceedings of the 6thEuropean Conference on Speech Communication and Technology (EU-ROSPEECH’99), Budapest, Hungary, Volume 4, pp. 1619–1622.
Covell, M., M. Withgott, and M. Slaney (1998). MACH1 for nonuniformtime-scale modification of speech: Theory, technique, and compar-isons. In: Proceedings of the IEEE International Conference on Acous-tics, Speech and Signal Processing (ICASSP’98), Seattle, Washington, pp.349–352.
Crystal, T. and A. House (1988). Segmental durations in connectedspeech signals: Current results. Journal of the Acoustical Society ofAmerica 83(1), 1553–1573.
102
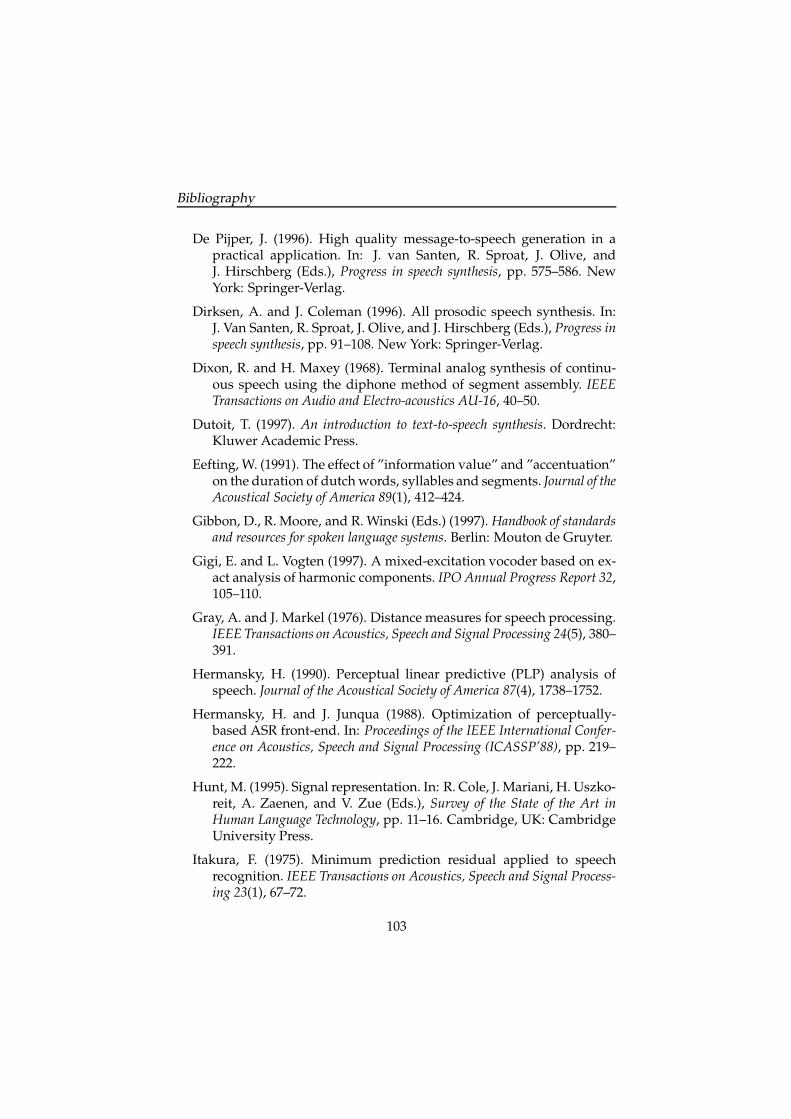
Bibliography
De Pijper, J. (1996). High quality message-to-speech generation in apractical application. In: J. van Santen, R. Sproat, J. Olive, andJ. Hirschberg (Eds.), Progress in speech synthesis, pp. 575–586. NewYork: Springer-Verlag.
Dirksen, A. and J. Coleman (1996). All prosodic speech synthesis. In:J. Van Santen, R. Sproat, J. Olive, and J. Hirschberg (Eds.), Progress inspeech synthesis, pp. 91–108. New York: Springer-Verlag.
Dixon, R. and H. Maxey (1968). Terminal analog synthesis of continu-ous speech using the diphone method of segment assembly. IEEETransactions on Audio and Electro-acoustics AU-16, 40–50.
Dutoit, T. (1997). An introduction to text-to-speech synthesis. Dordrecht:Kluwer Academic Press.
Eefting, W. (1991). The effect of ”information value” and ”accentuation”on the duration of dutch words, syllables and segments. Journal of theAcoustical Society of America 89(1), 412–424.
Gibbon, D., R. Moore, and R. Winski (Eds.) (1997). Handbook of standardsand resources for spoken language systems. Berlin: Mouton de Gruyter.
Gigi, E. and L. Vogten (1997). A mixed-excitation vocoder based on ex-act analysis of harmonic components. IPO Annual Progress Report 32,105–110.
Gray, A. and J. Markel (1976). Distance measures for speech processing.IEEE Transactions on Acoustics, Speech and Signal Processing 24(5), 380–391.
Hermansky, H. (1990). Perceptual linear predictive (PLP) analysis ofspeech. Journal of the Acoustical Society of America 87(4), 1738–1752.
Hermansky, H. and J. Junqua (1988). Optimization of perceptually-based ASR front-end. In: Proceedings of the IEEE International Confer-ence on Acoustics, Speech and Signal Processing (ICASSP’88), pp. 219–222.
Hunt, M. (1995). Signal representation. In: R. Cole, J. Mariani, H. Uszko-reit, A. Zaenen, and V. Zue (Eds.), Survey of the State of the Art inHuman Language Technology, pp. 11–16. Cambridge, UK: CambridgeUniversity Press.
Itakura, F. (1975). Minimum prediction residual applied to speechrecognition. IEEE Transactions on Acoustics, Speech and Signal Process-ing 23(1), 67–72.
103

Bibliography
Kato, H., M. Tsuzaki, and Y. Sagisaka (1998). Acceptability for temporalmodifications of single vowel segments in isolated words. Journal ofthe Acoustical Society of America 104(1), 540–549.
Kerkhoff, J., T. Rietveld, C. Gussenhoven, and L. Elich (1995). NIROS:The Nijmegen Interactive Rule Oriented Speech-synthesis system,an overview. Internal report, Dept. of Language and Speech, Uni-versity of Nijmegen.
Klabbers, E., J. Odijk, J. De Pijper, and M. Theune (1996). GoalGetter:From teletext to speech. In: IPO Annual Progress Report, Volume 31,Eindhoven, the Netherlands, pp. 66–75.
Klabbers, E. and R. Veldhuis (1998). On the reduction of concatena-tion artefacts in diphone synthesis. In: Proceedings of the 5th Inter-national Conference on Spoken Language Processing (ICSLP’98), Sydney,Australia, Volume 5, pp. 1983–1986.
Klatt, D. (1987). Review of text-to-speech conversion for English. Journalof the Acoustical Society of America 82(3), 737–783.
Krishnan, S. and P. Rao (1996). A comparative study of explicit fre-quency and conventional signal representations for speech recogni-tion. Digital Signal Processing 6, 249–284.
Kullback, S. and R. Leibler (1951). On information and sufficiency. An-nals of Mathematical Statistics 22, 79–86.
Local, J. and R. Ogden (1996). A model of timing for non-segmentalphonological structure. In: J. Van Santen, R. Sproat, J. Olive, andJ. Hirschberg (Eds.), Progress in speech synthesis, pp. 109–119. NewYork: Springer-Verlag.
Luce, R. and C. Krumhansl (1988). Measurement, scaling and psy-chophysics. In: S. Stevens (Ed.), Handbook of experimental psychology,Chapter 1, pp. 3–73. New York: Wiley.
Macon, M., A. Cronk, and J. Wouters (1998). Generalization and dis-crimination in tree-structured unit selection. In: Proceedings of theThird ESCA/COCOSDA Workshop on Speech Synthesis, Jenolan Caves,Australia, pp. 195–200.
Maghbouleh, A. (1996). An empirical comparison of automatic decisiontree and linear regression models for vowel durations. In: Proceed-ings of the second meeting of the ACL Special Interest Group in Computa-tional Phonology, Santa Cruz.
104
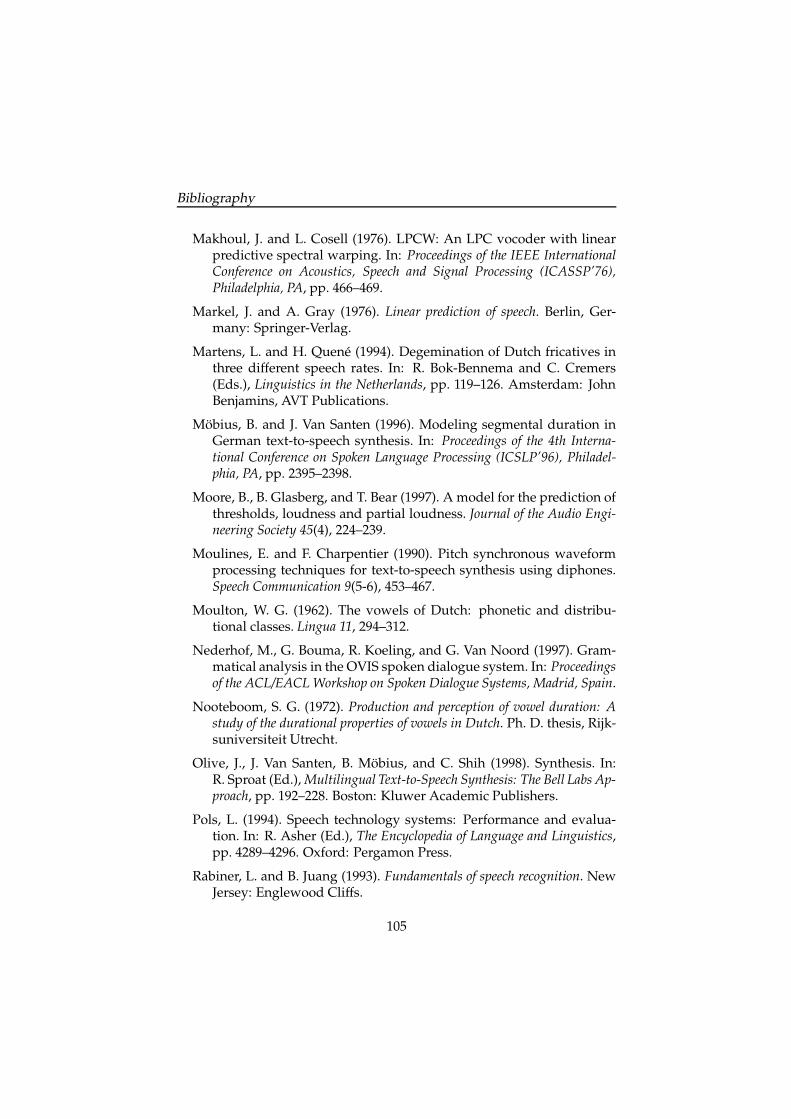
Bibliography
Makhoul, J. and L. Cosell (1976). LPCW: An LPC vocoder with linearpredictive spectral warping. In: Proceedings of the IEEE InternationalConference on Acoustics, Speech and Signal Processing (ICASSP’76),Philadelphia, PA, pp. 466–469.
Markel, J. and A. Gray (1976). Linear prediction of speech. Berlin, Ger-many: Springer-Verlag.
Martens, L. and H. Quene (1994). Degemination of Dutch fricatives inthree different speech rates. In: R. Bok-Bennema and C. Cremers(Eds.), Linguistics in the Netherlands, pp. 119–126. Amsterdam: JohnBenjamins, AVT Publications.
Mobius, B. and J. Van Santen (1996). Modeling segmental duration inGerman text-to-speech synthesis. In: Proceedings of the 4th Interna-tional Conference on Spoken Language Processing (ICSLP’96), Philadel-phia, PA, pp. 2395–2398.
Moore, B., B. Glasberg, and T. Bear (1997). A model for the prediction ofthresholds, loudness and partial loudness. Journal of the Audio Engi-neering Society 45(4), 224–239.
Moulines, E. and F. Charpentier (1990). Pitch synchronous waveformprocessing techniques for text-to-speech synthesis using diphones.Speech Communication 9(5-6), 453–467.
Moulton, W. G. (1962). The vowels of Dutch: phonetic and distribu-tional classes. Lingua 11, 294–312.
Nederhof, M., G. Bouma, R. Koeling, and G. Van Noord (1997). Gram-matical analysis in the OVIS spoken dialogue system. In: Proceedingsof the ACL/EACL Workshop on Spoken Dialogue Systems, Madrid, Spain.
Nooteboom, S. G. (1972). Production and perception of vowel duration: Astudy of the durational properties of vowels in Dutch. Ph. D. thesis, Rijk-suniversiteit Utrecht.
Olive, J., J. Van Santen, B. Mobius, and C. Shih (1998). Synthesis. In:R. Sproat (Ed.), Multilingual Text-to-Speech Synthesis: The Bell Labs Ap-proach, pp. 192–228. Boston: Kluwer Academic Publishers.
Pols, L. (1994). Speech technology systems: Performance and evalua-tion. In: R. Asher (Ed.), The Encyclopedia of Language and Linguistics,pp. 4289–4296. Oxford: Pergamon Press.
Rabiner, L. and B. Juang (1993). Fundamentals of speech recognition. NewJersey: Englewood Cliffs.
105

Bibliography
Rietveld, A. C. M. and U. H. Frauenfelder (1987). The effect of syllablestructure on vowel duration. In: Proceedings of the International Con-ference on Phonetic Science (ICPhS’87), Tallinn, USSR, pp. 28–31.
Rietveld, T., J. Kerkhoff, M. Emons, E. Meijer, A. Sanderman, andA. Sluijter (1997). Evaluation of speech synthesis systems for Dutchin telecommunication applications in GSM and PSTN networks. In:Proceedings of the 5th European Conference on Speech Communicationand Technology (EUROSPEECH’97), Rhodes, Greece, Volume 2, pp.577–580.
Riley, M. (1992). Tree-based modeling for speech synthesis. In: G. Bailly,C. Benoıt, and T. Sawallis (Eds.), Talking machines: Theories, modelsand designs, pp. 265–273. Amsterdam: Elsevier.
Sheskin, D. (1996). Handbook of parametric and nonparametric statisticalprocedures. Boca Raton, Fla: CRC Press LLC.
Sproat, R. (Ed.) (1998). Multilingual Text-to-Speech Synthesis: The Bell LabsApproach. Dordrecht: Kluwer Academic Publishers.
Steeneken, H. (1992). Quality evaluation of speech processing systems.In: N. Ince (Ed.), Digital speech coding: Speech coding, synthesis andrecognition, pp. 127–160. Norwell, USA: Kluwer.
Stober, K., T. Portele, P. Wagner, and W. Hess (1999). Synthesis by wordconcatenation. In: Proceedings of the 6th European Conference on SpeechCommunication and Technology (EUROSPEECH’99), Budapest, Hun-gary, Volume 2, pp. 619–622.
Strik, H., A. Russel, H. Van den Heuvel, C. Cucchiarini, and L. Boves(1996). Localizing an automatic inquiry system for public transportinformation. In: Proceedings of the International Conference on SpokenLanguage Processing (ICSLP’96), Philadelphia, PA, pp. 853–856.
Stylianou, Y., T. Dutoit, and J. Schroeter (1997). Diphone concatenationusing a harmonic plus noise model of speech. In: Proceedings of the5th European Conference on Speech Communication and Technology (EU-ROSPEECH’97), Rhodes, Greece, Volume 2, pp. 613–615.
’t Hart, J., R. Collier, and A. Cohen (1990). A perceptual study of intona-tion: An experimental phonetic approach to speech melody. Cambridge:Cambridge University Press.
Terken, J. (1996). Language and speech technology: Developments. In:IPO Annual Progress Report, Volume 31, Eindhoven, the Netherlands,pp. 64.
106

Bibliography
Theune, M. (2000). From Data to Speech. Ph. D. thesis, Eindhoven Uni-versity of Technology. To appear.
Theune, M., E. Klabbers, J. Odijk, and J. De Pijper (1997). Computingprosodic properties in a data-to-speech system. In: Proceedings of theACL/EACL Workshop on Concept-to-Speech Generation Systems, Madrid,Spain, pp. 39–46.
Tzoukermann, E. and O. Soumoy (1995). Segmental duration in Frenchtext-to-speech synthesis. In: Proceedings of the 4th European Conferenceon Speech Communication and Technology (EUROSPEECH’95), Madrid,Spain, pp. 607–611.
Van Bergem, D. (1995). Acoustic and lexical vowel reduction. Ph. D. thesis,IFOTT, University of Amsterdam.
Van Coile, B. (1989). Tekst-naar-spraak omzetting: een taalkundig, fonetischen akoestisch probleem. Ph. D. thesis, Rijksuniversiteit Gent.
Van den Heuvel, H., B. Cranen, and T. Rietveld (1996). Speaker variabil-ity in the coarticulation of /a,i,u/. Speech Communication 18, 113–130.
Van Dinther, R., P. Rao, R. Veldhuis, and A. Kohlrausch (1999). A mea-sure for predicting audibility discriminatoin thresholds. In: to appearin IPO Annual Progress Report, Volume 34, Eindhoven, the Nether-lands.
Van Santen, J. (1992a). Contextual effects on vowel duration. SpeechCommunication 11, 513–546.
Van Santen, J. (1992b). Deriving text-to-speech durations from natu-ral speech. In: G. Bailly, C. Benoıt, and T. Sawallis (Eds.), Talkingmachines: Theories, models and designs, pp. 275–285. Amsterdam, theNetherlands: Elsevier.
Van Santen, J. (1994). Assignment of segmental duration in text-to-speech synthesis. Computer, Speech and Language 8, 95–128.
Van Santen, J. (1997). Prosodic modeling in text-to-speech synthesis. In:Proceedings of the 5th European Conference on Speech Communicationand Technology (EUROSPEECH’97), Rhodes, Greece, pp. KN19–28.
Van Santen, J. and A. Buchsbaum (1997). Methods for optimal text selec-tion. In: Proceedings of the 5th European Conference on Speech Commu-nication and Technology (EUROSPEECH’97), Rhodes, Greece, Volume 2,pp. 553–556.
Van Santen, J., L. Pols, M. Abe, D. Kahn, E. Keller, and J. Vonwiller(1998). Report on the Third ESCA TTS Workshop Evaluation. In: Pro-
107
Bibliography
ceedings of the Third ESCA/COCOSDA Workshop on Speech Synthesis,Jenolan Caves, Australia, pp. 329–332.
Van Santen, J. and R. Sproat (1998). Methods and tools. In: R. Sproat(Ed.), Multilingual Text-to-Speech Synthesis: The Bell Labs Approach,pp. 7–30. Boston: Kluwer Academic Publishers.
Van Santen, J., R. Sproat, J. Olive, and J. Hirschberg (Eds.) (1996).Progress in Speech Synthesis. New York: Springer Verlag.
Van Son, R. (1988). Spectro-temporal features of vowel segments. Ph. D. the-sis, IFOTT, University of Amsterdam.
Van Son, R. and J. Van Santen (1997). Strong interaction betweenfactors influencing consonant duration. In: Proceedings of the 5thEuropean Conference on Speech Communication and Technology (EU-ROSPEECH’97), Rhodes, Greece, pp. 319–322.
Veldhuijzen van Zanten, G. (1998). Adaptive mixed-initiative dialoguemodelling. In: Proceedings of IVTTA’98: IEEE 4th Workshop on Interac-tive Voice Technology for Telecommunications Applications, Turin, Italy,pp. 65–70.
Veldhuis, R. and M. Breeuwer (1993). An introduction to source coding.UK: Prentice Hall International Ltd.
Waals, J. (1999). An experimental view on the Dutch syllable. Ph. D. thesis,Utrecht University.
Waterworth, J. (1983). Effect of intonation form and pause durations ofautomatic telephone number announcements on subjective prefer-ence and memory performance. Applied Ergonomics 14(1), 39–42.
Wouters, J. and M. Macon (1998). A perceptual evaluation of distancemeasures for concatenative speech synthesis. In: Proceedings of the5th International Conference on Spoken Language Processing (ICSLP’98),Sydney, Australia, Volume 6, pp. 2747–2750.
108

Appendix AListing of the phoneme inventory
This appendix contains a listing of the phoneme inventory that was usedin our synthesis system. The notation is derived from SAMPA. It is differ-ent in that long vowels are represented with lower case letters, not fol-lowed by a colon as in the official SAMPA notation. Furthermore, thesymbols /c/, representing an assimilation of /t/ and /j/, and /J/, rep-resenting an assimilation of /n/ and /j/, are added.
109

A. Listing of the phoneme inventory
Consonants Vowelsp pak pAk a naam namt tak tAk e veer verk kap kAp 2 deur d2rb bak bAk o door dord dak dAk Ei fijn fEing goal goL Au goud xAutf fel fEL 9y huis h9yss sein sEin E: creme krE:mx toch tOx O: roze rO:z@c katje kAc@ 9: freule fr9:l@S show So i vier virv vel vEL u voer vurz zijn zEin y vuur vyrZ bagage bAxaZ@ A pad pAth hand hAnt E pet pEtm met mEt O pot pOtn net nEt I pit pItN bang bAN Y put pYtJ oranje orAJ@ @ bange bAN@l land lAntL bal bALr rand rAntj ja ja
w wit wIt? aap ?ap
Table A.1: The consonants and vowels of Dutch in SAMPA-like notation. Theirmeaning is illustrated with an example, presented in orthographic and phonetictranscription.
110

Appendix BDuration factors
This appendix lists the results found in the duration analysis that is re-ported on in Chapter 4. For each category in the category tree, the relevantfactors and factor levels are listed. The number of observations is given togive an indication of the coverage of the corpus. The effect of a factor levelis indicated by the corrected means duration (in milliseconds).
Factors Factor levels Number of Correctedobservations means (ms)
Previous unvoiced obstruent 190 119.9sonorant 362 130.2voiced obstruent 187 137.5
Next sonorant 139 114.8vowel 35 121.3obstruent 505 126.3/r/ 60 140.1
Stress/Accent 00 85 121.701 226 99.310 88 134.311 340 151.8
Left position word-initial syllable 412 130.6other 297 134.4syllable-initial 30 144.6
Right position syllable-final 581 120.6word-final 113 142.3phrase-final 45 206.1
Table B.1: Factor effects on long vowels in open syllables.
111

B. Duration factors
Factors Factor levels Number of Correctedobservations means (ms)
Previous obstruent 121 64.4sonorant 93 72.6
Next obstruent 105 65.1sonorant 101 66.0/r/ 8 103.2
Stress/Accent 00 7 53.301 84 60.910 31 64.511 92 77.0
Table B.2: Factor effects on short vowels in open syllables.
Factors Factor levels Number of Correctedobservations means (ms)
Previous unvoiced obstruent 112 58.6vowel 8 98.8sonorant 153 85.9voiced obstruent 85 79.8
Next sonorant 65 66.6unvoiced obstruent 144 67.7voiced obstruent 89 77.0vowel 39 87.5/r/ 21 140.7
Stress/Accent 00 58 67.101 199 75.410 10 77.011 91 94.3
Left position non-initial 205 70.4word-initial syllable 128 78.2phrase-initial syllable 15 161.2
Right position syllable-final 249 59.9word-final 94 95.8phrase-final 15 161.2
Table B.3: Factor effects on /i, u, y/ in open syllables.
112

Factors Factor levels Number of Correctedobservations means (ms)
Previous sonorant 110 47.1voiced obstruent 342 54.2unvoiced obstruent 243 64.6
Next sonorant 148 43.8obstruent 491 49.7/r/ 56 60.9
Stress/Accent 00 344 48.401 351 56.8
Left position non-initial 329 58.5syllable-initial 11 69.5word-initial syllable 355 66.5
Right position syllable-final 252 42.1word-final 418 62.3phrase-final 25 108.2
Table B.4: Factor effects on schwa in open syllables.
Factors Factor levels Number of Correctedobservations means (ms)
Previous obstruent 401 104.3sonorant 200 115.6
Next /R/ 144 88.7sonorant 192 103.5obstruent 206 117.3/r/ 59 136.8
Stress/Accent 00 239 93.801 69 109.010 48 109.211 245 137.1
Left position word-initial syllable 434 110.8non-initial 167 116.5
Right position non-final 147 100.8word-final syllable 147 100.8phrase-final syllable 88 149.3
Table B.5: Factor effects on long vowels in closed syllables.
113

B. Duration factors
Factors Factor levels Number of Correctedobservations means (ms)
Previous obstruent 1000 62.8sonorant 404 72.9vowel 21 85.5
Next /R/ 77 60.4sonorant 735 65.7unvoiced obstruent 534 66.5/r/ 79 79.0
Stress/Accent 00 612 57.401 312 64.810 85 71.811 416 77.7
Right position non-final 488 60.2word-final syllable 786 68.3phrase-final syllable 151 91.5
Table B.6: Factor effects on short vowels in closed syllables.
Factors Factor levels Number of Correctedobservations means (ms)
Next unvoiced obstruent 86 71.4sonorant 48 85.3/R/ 19 112.2/r/ 11 147.9
Stress/Accent 00 30 65.301 41 69.910 8 80.611 85 93.5
Left position word-initial syllable 96 80.4non-initial 68 89.0
Right position non-final 42 77.6word-final syllable 89 78.7phrase-final syllable 33 106.1
Table B.7: Factor effects on /i, u, y/ in closed syllables.
114
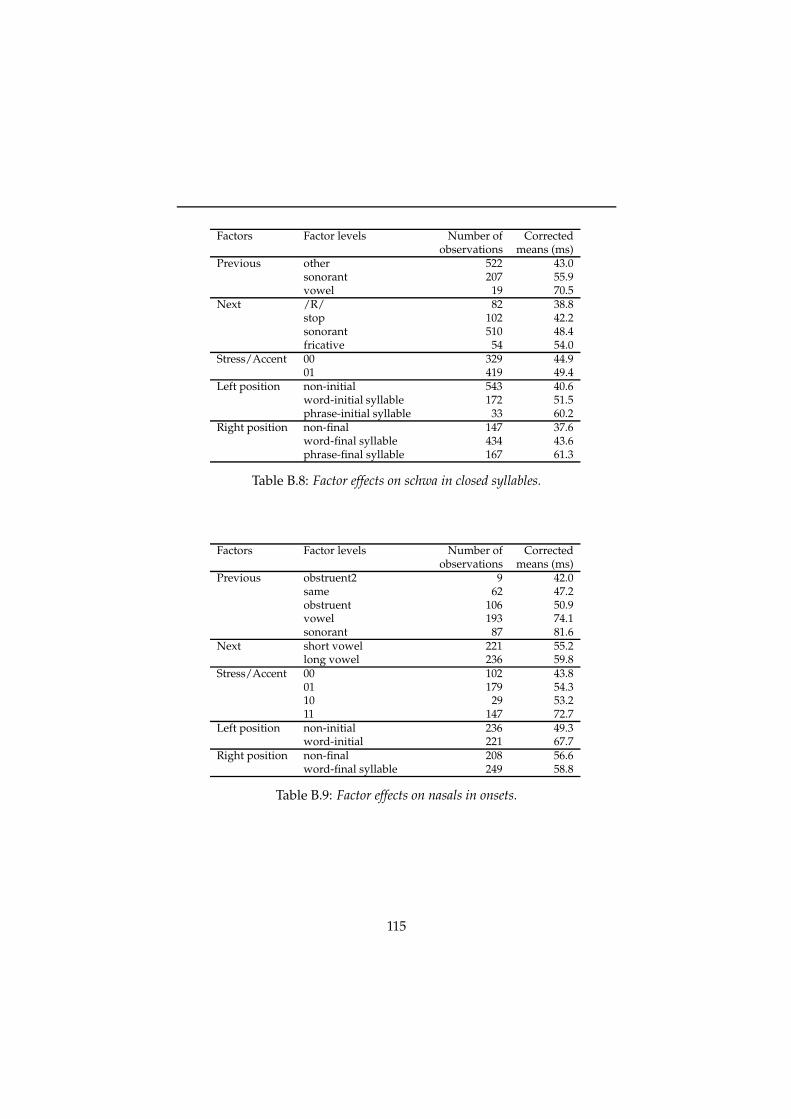
Factors Factor levels Number of Correctedobservations means (ms)
Previous other 522 43.0sonorant 207 55.9vowel 19 70.5
Next /R/ 82 38.8stop 102 42.2sonorant 510 48.4fricative 54 54.0
Stress/Accent 00 329 44.901 419 49.4
Left position non-initial 543 40.6word-initial syllable 172 51.5phrase-initial syllable 33 60.2
Right position non-final 147 37.6word-final syllable 434 43.6phrase-final syllable 167 61.3
Table B.8: Factor effects on schwa in closed syllables.
Factors Factor levels Number of Correctedobservations means (ms)
Previous obstruent2 9 42.0same 62 47.2obstruent 106 50.9vowel 193 74.1sonorant 87 81.6
Next short vowel 221 55.2long vowel 236 59.8
Stress/Accent 00 102 43.801 179 54.310 29 53.211 147 72.7
Left position non-initial 236 49.3word-initial 221 67.7
Right position non-final 208 56.6word-final syllable 249 58.8
Table B.9: Factor effects on nasals in onsets.
115
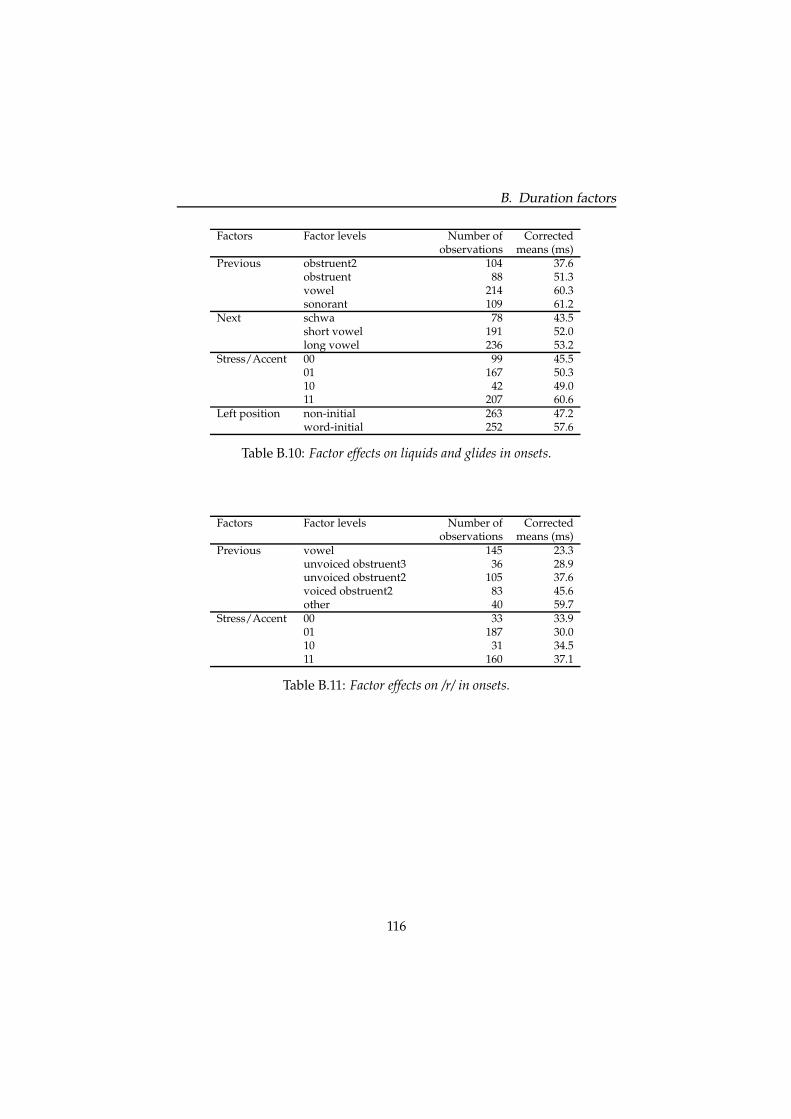
B. Duration factors
Factors Factor levels Number of Correctedobservations means (ms)
Previous obstruent2 104 37.6obstruent 88 51.3vowel 214 60.3sonorant 109 61.2
Next schwa 78 43.5short vowel 191 52.0long vowel 236 53.2
Stress/Accent 00 99 45.501 167 50.310 42 49.011 207 60.6
Left position non-initial 263 47.2word-initial 252 57.6
Table B.10: Factor effects on liquids and glides in onsets.
Factors Factor levels Number of Correctedobservations means (ms)
Previous vowel 145 23.3unvoiced obstruent3 36 28.9unvoiced obstruent2 105 37.6voiced obstruent2 83 45.6other 40 59.7
Stress/Accent 00 33 33.901 187 30.010 31 34.511 160 37.1
Table B.11: Factor effects on /r/ in onsets.
116
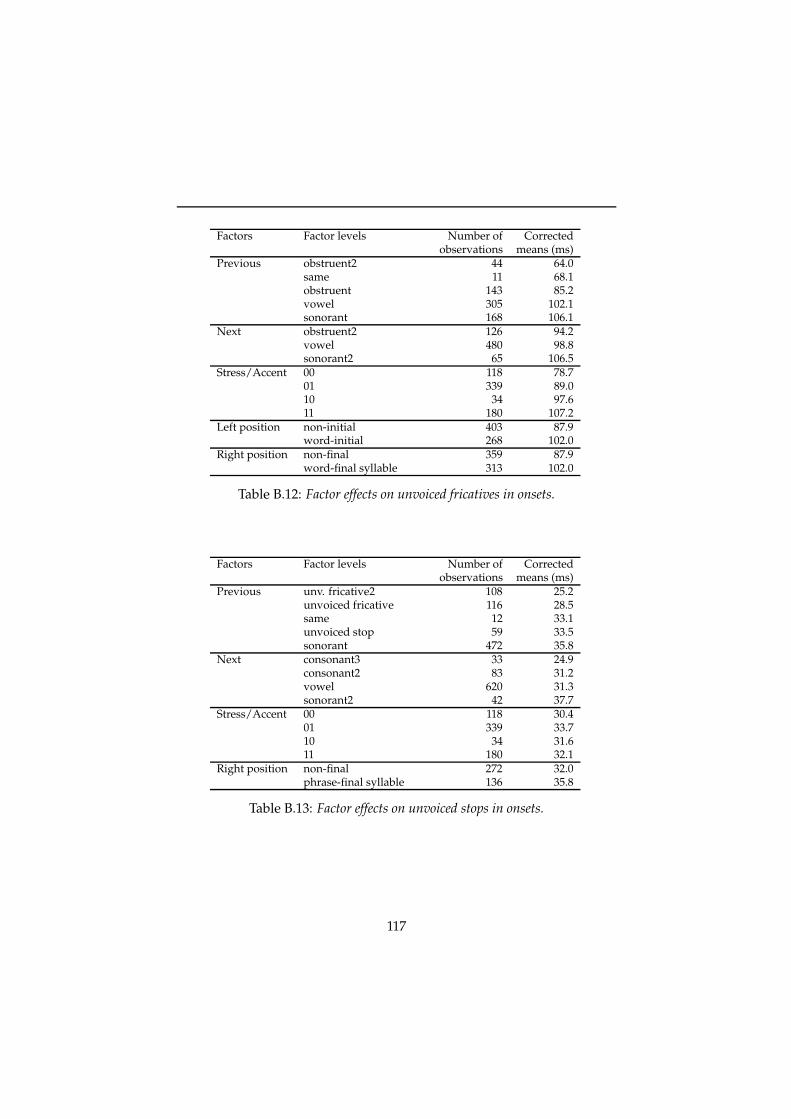
Factors Factor levels Number of Correctedobservations means (ms)
Previous obstruent2 44 64.0same 11 68.1obstruent 143 85.2vowel 305 102.1sonorant 168 106.1
Next obstruent2 126 94.2vowel 480 98.8sonorant2 65 106.5
Stress/Accent 00 118 78.701 339 89.010 34 97.611 180 107.2
Left position non-initial 403 87.9word-initial 268 102.0
Right position non-final 359 87.9word-final syllable 313 102.0
Table B.12: Factor effects on unvoiced fricatives in onsets.
Factors Factor levels Number of Correctedobservations means (ms)
Previous unv. fricative2 108 25.2unvoiced fricative 116 28.5same 12 33.1unvoiced stop 59 33.5sonorant 472 35.8
Next consonant3 33 24.9consonant2 83 31.2vowel 620 31.3sonorant2 42 37.7
Stress/Accent 00 118 30.401 339 33.710 34 31.611 180 32.1
Right position non-final 272 32.0phrase-final syllable 136 35.8
Table B.13: Factor effects on unvoiced stops in onsets.
117

B. Duration factors
Factors Factor levels Number of Correctedobservations means (ms)
Previous unvoiced obstruent2 108 26.2nasal 116 36.2unvoiced obstruent 176 39.6sonorant 383 58.3
Next unvoiced fricative2 19 31.4schwa 232 39.4sonorant2 138 41.5vowel 394 46.1
Stress/Accent 00 128 38.801 390 40.610 46 45.511 219 55.4
Left position non-initial 513 38.8word-initial 270 54.0
Table B.14: Factor effects on unvoiced stop closures in onsets.
Factors Factor levels Number of Correctedobservations means (ms)
Previous voiced stop2 8 36.5unvoiced obstruent 123 85.3schwa 86 92.5sonorant 305 139.4
Stress/Accent 00 199 81.301 153 96.610 22 108.211 148 117.6
Left position non-initial 201 88.2word-initial 321 106.8
Right position non-final 221 94.4word-final syllable 301 101.9
Table B.15: Factor effects on voiced fricatives in onsets.
118

Factors Factor levels Number of Correctedobservations means (ms)
Previous sonorant 601 12.6unvoiced obstruent 154 16.1
Stress/Accent 00 310 12.001 268 13.110 36 14.311 141 15.6
Left position non-initial 346 12.9word-initial 409 13.6
Table B.16: Factor effects on voiced stops in onsets.
Factors Factor levels Number of Correctedobservations means (ms)
Previous nasal 228 15.2other 291 29.7vowel 236 39.4
Next schwa 370 26.4consonant2 67 33.1vowel 318 33.0
Stress/Accent 00 310 26.701 268 28.210 36 28.011 141 42.9
Left position non-initial 346 22.9word-initial 409 30.5
Table B.17: Factor effects on voiced stop closures in onsets.
119

B. Duration factors
Factors Factor levels Number of Correctedobservations means (ms)
Previous unvoiced fricative 12 46.7vowel 45 54.2unvoiced stop 32 55.9sonorant 42 63.2
Stress/Accent 00 49 45.901 24 43.810 12 53.911 46 80.8
Left position non-initial 32 53.0word-initial 99 58.9
Table B.18: Factor effects on /h/ in onsets.
Factors Factor levels Number of Correctedobservations means (ms)
Previous unvoiced obstruent 186 28.7long vowel 43 36.3sonorant 154 40.4schwa 71 46.1
Stress/Accent 00 241 23.501 54 32.910 24 41.811 135 63.5
Right position non-final 189 32.8word-final syllable 265 39.9
Table B.19: Factor effects on glottal stops in onsets.
120

Factors Factor levels Number of Correctedobservations means (ms)
Previous vowel 1161 57.4sonorant2 9 79.9
Next unvoiced obstruent2 144 51.5vowel 49 55.1other 632 56.8voiced obstruent 345 67.8
Stress/Accent 00 557 45.301 369 61.510 35 68.711 209 90.1
Left position non-initial 541 48.8word-initial syllable 629 78.2
Right position non-final 282 43.1word-final 680 59.0phrase-final 97 92.1utterance-final 111 133.7
Table B.20: Factor effects on nasals in codas.
Factors Factor levels Number of Correctedobservations means (ms)
Next schwa 21 36.3consonant2 55 54.0other 174 63.6
Stress/Accent 00 56 51.901 83 55.210 18 57.011 93 71.5
Left position non-initial 109 54.2word-initial syllable 141 65.3
Right position non-final 132 48.9word-final 82 59.6phrase-final 20 102.2utterance-final 16 106.4
Table B.21: Factor effects on liquids and glides in codas.
121

B. Duration factors
Factors Factor levels Number of Correctedobservations means (ms)
Next vowel 26 22.5obstruent2 109 27.6other 412 34.1
Stress/Accent 00 186 25.801 182 28.410 38 46.111 143 49.5
Right position non-final 221 27.3word-final 197 33.9word-final syllable 99 49.6phrase-final 32 60.5
Table B.22: Factor effects on /r/ in codas.
Factors Factor levels Number of Correctedobservations means (ms)
Previous unvoiced obstruent2 76 86.9sonorant2 113 101.3vowel 450 110.2
Next same 11 77.7vowel 23 74.3obstruent 540 91.9sonorant 65 105.3
Stress/Accent 00 164 81.401 193 92.310 34 100.711 248 118.5
Right position non-final 185 83.7word-final 340 97.9phrase-final syllable 30 123.8phrase-final 44 160.8utterance-final 40 208.0
Table B.23: Factor effects on unvoiced fricatives in codas.
122
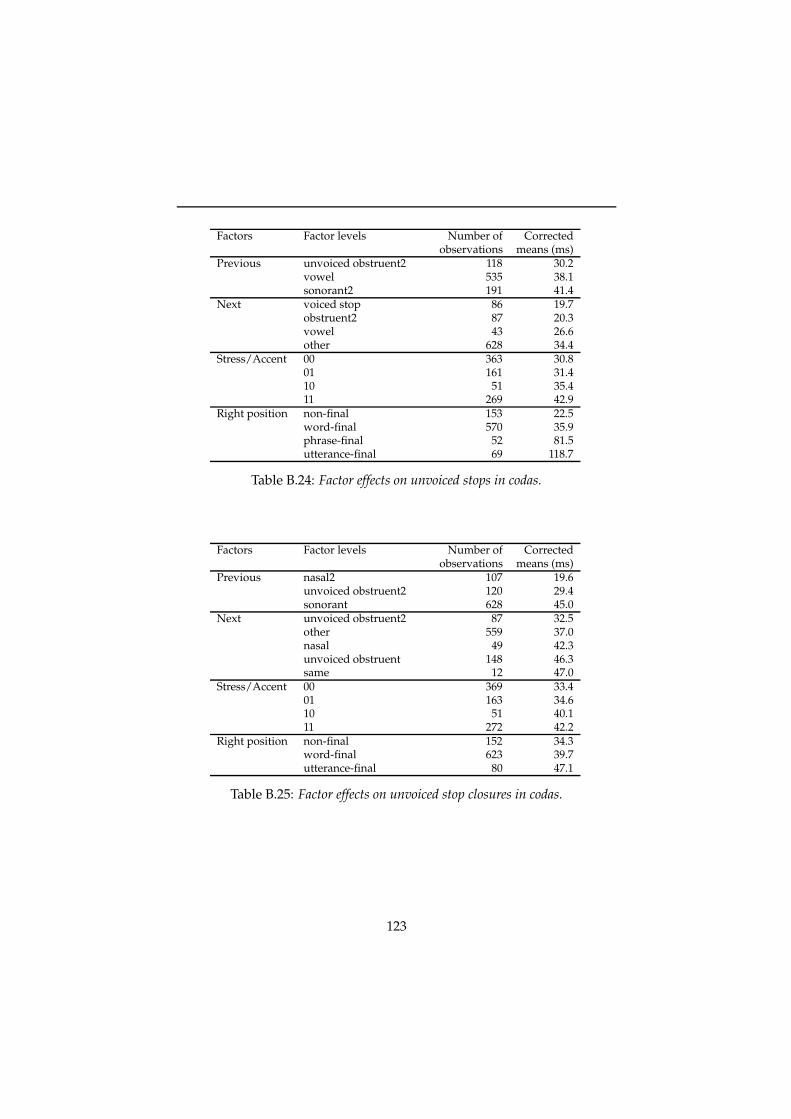
Factors Factor levels Number of Correctedobservations means (ms)
Previous unvoiced obstruent2 118 30.2vowel 535 38.1sonorant2 191 41.4
Next voiced stop 86 19.7obstruent2 87 20.3vowel 43 26.6other 628 34.4
Stress/Accent 00 363 30.801 161 31.410 51 35.411 269 42.9
Right position non-final 153 22.5word-final 570 35.9phrase-final 52 81.5utterance-final 69 118.7
Table B.24: Factor effects on unvoiced stops in codas.
Factors Factor levels Number of Correctedobservations means (ms)
Previous nasal2 107 19.6unvoiced obstruent2 120 29.4sonorant 628 45.0
Next unvoiced obstruent2 87 32.5other 559 37.0nasal 49 42.3unvoiced obstruent 148 46.3same 12 47.0
Stress/Accent 00 369 33.401 163 34.610 51 40.111 272 42.2
Right position non-final 152 34.3word-final 623 39.7utterance-final 80 47.1
Table B.25: Factor effects on unvoiced stop closures in codas.
123

B. Duration factors
124
Appendix CAudio examples
This appendix gives a description of the audio examples that are containedon the following web site:
http://www.ipo.tue.nl/homepages/eklabber/audio.html
The numbers associated with each of the speech examples correspond tothe filename of the examples on the site. All examples are stored in .wavformat. Section C.1 presents examples of IPO’s phrase concatenation ap-proach (for Dutch and German) in comparison with IPO’s diphone syn-thesis and two instances of conventional phrase concatenation. These ex-amples serve as illustrations for Chapter 2. Section C.2 presents some ex-amples of audible discontinuities, which are discussed in Chapter 3. Sec-tion C.3 presents twenty sentences that were used in the duration evalu-ation experiment of Chapter 4. They have been taken from the ’Nieuwsvoor Doven en Slechthorenden’, a teletext service providing concise newsreports to hearing impaired people.
125
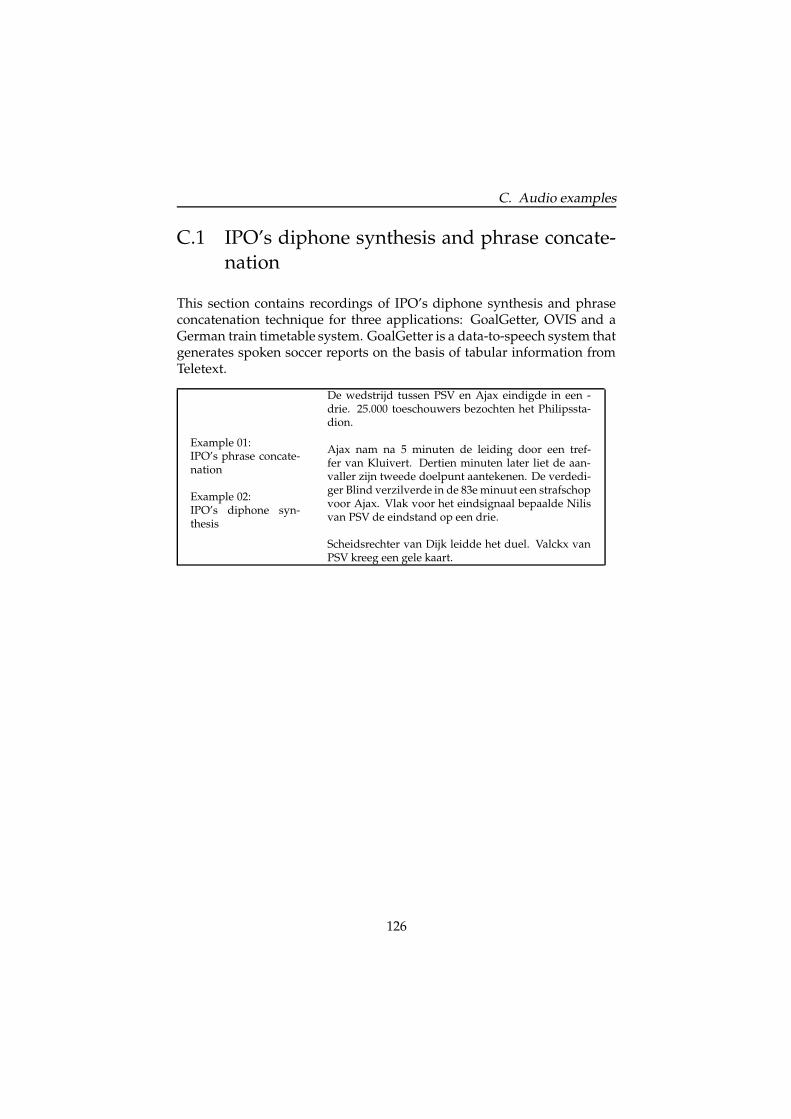
C. Audio examples
C.1 IPO’s diphone synthesis and phrase concate-nation
This section contains recordings of IPO’s diphone synthesis and phraseconcatenation technique for three applications: GoalGetter, OVIS and aGerman train timetable system. GoalGetter is a data-to-speech system thatgenerates spoken soccer reports on the basis of tabular information fromTeletext.
Example 01:IPO’s phrase concate-nation
Example 02:IPO’s diphone syn-thesis
De wedstrijd tussen PSV en Ajax eindigde in een -drie. 25.000 toeschouwers bezochten het Philipssta-dion.
Ajax nam na 5 minuten de leiding door een tref-fer van Kluivert. Dertien minuten later liet de aan-valler zijn tweede doelpunt aantekenen. De verdedi-ger Blind verzilverde in de 83e minuut een strafschopvoor Ajax. Vlak voor het eindsignaal bepaalde Nilisvan PSV de eindstand op een drie.
Scheidsrechter van Dijk leidde het duel. Valckx vanPSV kreeg een gele kaart.
126

C.1. IPO’s diphone synthesis and phrase concatenation
This section contains three recordings of a sample train connection takenfrom OVIS using three speech generation methods. The first is IPO’sphrase concatenation method, the second is conventional phrase concate-nation and the third is diphone synthesis. The conventional concatenationmethod differs from IPO’s phrase concatenation in that the concatenativeunits have been recorded in isolation, and all words and phrases havebeen recorded in one prosodically neutral version only. The recordingswere used in the evaluation experiment of Chapter 2.
Example 03:IPO’s phrase concate-nation.
Ik heb de volgende verbinding gevonden.Met de sneltrein, vertrek vanuit Groningen, om elfuur vierenvijftig, aankomst in Oudenbosch, om tienuur tweeenveertig.Daar verder met de stoptrein, vertrek om vier uurvierendertig, aankomst in Leidschendam-Voorburg,om een uur tweeentwintig.Wilt u nog een andere verbinding weten?
Example 04:conventional phraseconcatenation.
Ik heb de volgende verbinding gevonden.Met de sneltrein, vertrek vanuit Enkhuizen, om elfuur eenenvijftig, aankomst in Oosterbeek, om drieen-twintig uur twee.Daar verder met de stoptrein, vertrek om dertien uurzeventien, aankomst in Stavoren, om drie uur achten-twintig.Wilt u nog een andere verbinding weten?
Example 05:IPO’s diphone syn-thesis.
Ik heb de volgende verbinding gevonden.Met de sneltrein, vertrek vanuit Harlingen, omzeventien uur twintig, aankomst in Pijnacker, om ee-nentwintig uur drie.Daar verder met de stoptrein, vertrek om twee uurdrieenveertig, aankomst in Roosendaal, om dertienuur achttien.Wilt u nog een andere verbinding weten?
127
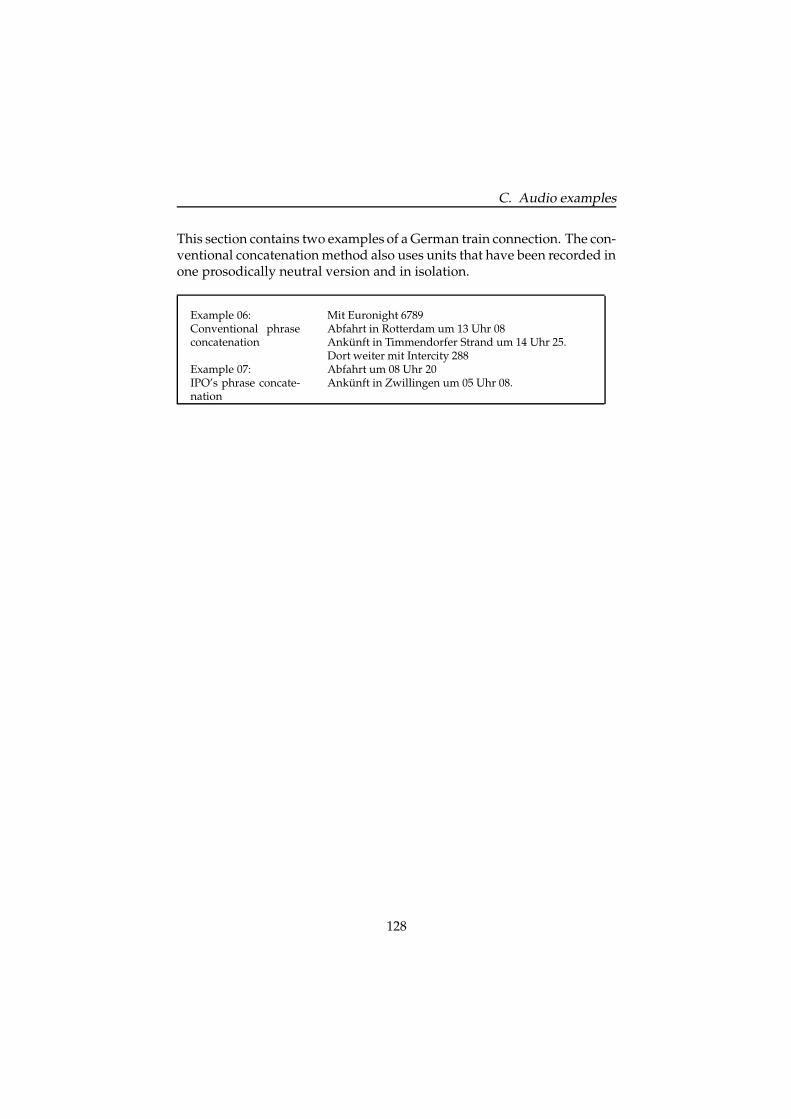
C. Audio examples
This section contains two examples of a German train connection. The con-ventional concatenation method also uses units that have been recorded inone prosodically neutral version and in isolation.
Example 06:Conventional phraseconcatenation
Example 07:IPO’s phrase concate-nation
Mit Euronight 6789Abfahrt in Rotterdam um 13 Uhr 08Ankunft in Timmendorfer Strand um 14 Uhr 25.Dort weiter mit Intercity 288Abfahrt um 08 Uhr 20Ankunft in Zwillingen um 05 Uhr 08.
128

C.2. Audible discontinuities
C.2 Audible discontinuities
This section contains two examples of vowel segments of the /a/, /i/, and/u/, which were constructed using diphone synthesis. One has a smoothtransition at the diphone boundary in the middle of the vowel, the otherhas a discontinuous transition. These stimuli were used as examples in thetraining session of the first listening experiment presented in Chapter 3.
Smooth Discontinuous VowelExample 08 Example 09 /a/Example 10 Example 11 /i/Example 12 Example 13 /u/
Additionally, this section contains two examples of the word /duk/, onegenerated with the original diphones and the other generated with an ad-ditional /uk/ diphone from a context-sensitive cluster. Their spectra canbe seen in Figure 3.11.
Example 14: /duk/ generated with original databaseExample 15: /duk/ generated with new database
129

C. Audio examples
C.3 Duration evaluation
This section contains twenty sentences that were used in the duration ex-periment of Chapter 4. Each sentence was generated with diphone syn-thesis using either the new duration model or the old duration model.
New Old Sentence
Example 16 Example 17Er wordt rekening mee gehouden dat hetdodental oploopt tot ruim veertig duizend
Example 18 Example 19
De VS heeft verklaard dat de NAVO deaanvallen voortzet, ondanks de vrijlatingvan drie krijgsgevangenen
Example 20 Example 21
Staatssecretaris Cohen zegde vorige weektoe dat Nederland zo’n 2000 ontheemdenzal opnemen
Example 22 Example 23
De vierde groep vluchtelingen uit Kosovois maandag aangekomen op de vliegbasisEindhoven
Example 24 Example 25
Ondanks een vrij rustig verloop zijn bij deoud- en nieuw-viering toch weer slachtof-fers gevallen
Example 26 Example 27
De regeringscrisis in Israel neemt verdertoe, nu ook minister Neeman van Financienmet aftreden dreigt
Example 28 Example 29
De storm die dit weekeinde over het no-ordwesten van Europa raasde, heeft aan 14mensen het leven gekost
Example 30 Example 31
Korpschef Veenstra trad gisteren af, na debekendmaking van een voor hem negatiefonderzoeks-rapport
Example 32 Example 33
Bijna alle werknemers gaan er dit jaar nettotoch op vooruit, blijkt uit een onderzoek vande NOS
130

C.3. Duration evaluation
New Old Sentence
Example 34 Example 35
Oud-korpschef Brand van de politieHaaglanden is gevraagd om tijdelijk depolitie in Groningen te leiden
Example 36 Example 37
Brand, die in Den Haag vervroegd met pen-sioen ging, is door burgemeester Ouwerkerkvan Groningen benaderd
Example 38 Example 39
In Belgie zijn bij een overval op een geld-transport de chauffeur en een bewakerdoodgeschoten
Example 40 Example 41
Het is niet bekend of de rovers de transport-wagen wisten te openen en hoe groot deeventuele buit is
Example 42 Example 43
Leraren in het voortgezet onderwijs leggenop 29 januari het werk neer uit onvrede overde grote werkdruk
Example 44 Example 45
Koningin Beatrix ontvangt vandaag defractieleiders van de kleinere partijen inzakede kabinetscrisis
Example 46 Example 47
Vermoedelijk wijst de koningin daarna eenformateur aan die moet proberen de breukte lijmen
Example 48 Example 49
Minister de Vries van Sociale Zaken stelteen onderzoek in naar fraude met Europeessubsidiegeld
Example 50 Example 51
Voor werkgelegenheidsprojecten werden teveel deelnemers opgegeven waardoor meersubsidie werd geind
Example 52 Example 53
In Belgie mogen vetrijke vleeswaren nietmeer verkocht worden vanwege het gevaarvoor dioxine-besmetting
Example 54 Example 55
Korthals had de Kamer maandag al achtergesloten deuren geinformeerd over decocaine zaak
131

C. Audio examples
132

Summary
This thesis aims at finding segmental and prosodic improvements tospeech generation.
In Chapter 2 two types of speech generation are discussed: diphone syn-thesis and phrase concatenation. The research is carried out in the contextof a spoken dialogue system called OVIS, which gives train timetable in-formation over the telephone. In this type of applications, the approach tospeech generation is often very simplistic. The speech output is achievedby a straightforward concatenation of words and phrases that literally cor-respond to the text that is to be spoken. This approach has a major draw-back in that it lacks variability in accentuation and the marking of phraseboundaries, which is essential for creating natural speech. The fact thatthe words and phrases to be concatenated are often spoken in isolation re-sults in mismatches in pitch, loudness and tempo which makes the speechsound disfluent.
The speech generation module is extended, to accommodate the prosodicvariability introduced by the natural language generation module. Dif-ferent versions of words have been recorded dependent on whether theyoccur in an accented or unaccented condition and on whether they occurbefore a phrase boundary of some depth. All words and phrases havebeen recorded in the proper context, to automatically elicit the appropri-ate versions. That and a careful recording results in speech output thatsounds almost as fluent as natural speech and that minimises the occur-rence of mismatch in pitch, loudness and tempo.
The drawback of this phrase concatenation approach is that a considerableamount of phonetic knowledge is required to construct an application-dependent corpus that covers the sentences the natural language gener-
133

ation module creates with their prosodic variations. Moreover, this ap-proach to speech generation only works for applications that suffice witha medium-sized stable vocabulary. When the need for flexibility increases,speech synthesis is the only alternative that is left. Although the most pop-ular implementation, i.e., diphone synthesis, is fairly intelligible, listenersstill judge the overall quality too low for it to be used in commercial appli-cations.
Chapter 3 concentrates on a significant problem that interferes with thesegmental quality, namely the occurrence of audible discontinuities at di-phone boundaries. These discontinuities are mainly caused by spectralmismatch at the diphone boundaries and are most obvious in vowels. Alistening experiment has been conducted with five vowels /a/, /i/, /A/,/I/ and /u/, to investigate the extent to which discontinuities are per-ceived. The results reveal considerable differences between the vowels un-der investigation. The /u/ has the highest percentage of perceived discon-tinuities, whereas the /a/ has the lowest percentage. The scores obtainedin the listening experiment have been correlated with several spectral dis-tance measures to find an objective measure that predicts the occurrence ofaudible discontinuities. The correlation is performed using Receiver Op-erator Characteristics. The Kullback-Leibler (KL) distance was shown tobe most adequate for the task.
To reduce the number of audible discontinuities context-sensitive di-phones have been added to the diphone database. In order to limit thenumber of additional diphones, the KL distance is used to cluster conso-nantal contexts with similar spectral effects on the neighbouring vowels.A second listening experiment has been conducted for the vowels /a/,/i/, and /u/, to evaluate the improvement obtained with this addition tothe database. The results show that the number of audible discontinuitieshas significantly decreased for all vowels. However, the objective KL dis-tance has significantly decreased only for /i/ and /u/, but not for /a/.But the KL distances were already lower in the /a/ to begin with.
Chapter 4 concentrates on a problem that affects the prosodic quality ofspeech synthesis, namely the inadequate prediction of segmental dura-tions. A new duration model has been developed using the sums-of-products approach of Van Santen (1992a). With a relatively small corpusof 297 sentences, containing 16,775 segments, a duration model could beconstructed that compares well with German and French duration modelsthat have been constructed using the same sums-of-products approach.The use of phonetic and phonological knowledge in the construction of
134

the category tree and the data analysis, which was designed specificallyfor this purpose, result in a model that incorporates the most importanteffects and interactions found to influence duration prediction.
The performance of the old and the new duration model has been eval-uated quantitatively by comparing the computed to the actual segmentaldurations in the 297-sentence training corpus. The new model was shownto be a significant improvement over the old one. A perceptual pairwisecomparison experiment using sentences generated with the old and newmodel, did not provide conclusive subjective evidence for the improve-ment.
135

136

Samenvatting
Dit proefschrift heeft als doel om segmentele en prosodische verbeterin-gen in spraakgeneratie tot stand te brengen.
Hoofdstuk 2 bespreekt twee soorten spraakgeneratie: difoonsynthese enfrasenconcatenatie. Het onderzoek is uitgevoerd in de context van eengesproken dialoogsysteem OVIS genaamd, dat telefonisch informatie overtreinverbindingen geeft. In dit type van applicaties is de spraakgener-atie aanpak vaak erg simplistisch. De spraakuitvoer wordt bereikt via hetrechttoe-rechtaan aan elkaar plakken van opgenomen woorden en frasendie letterlijk corresponderen met de tekst die uitgesproken dient te wor-den. Het voornaamste nadeel van deze aanpak is dat het variabiliteit mistin accentuering en markering van frasegrenzen, die beiden essentieel zijnvoor de creatie van natuurlijke spraak. Het feit dat de woorden en frasendie uitgesproken moeten worden vaak in isolatie worden opgenomen, re-sulteert in abrupte verschillen in toonhoogte, luidheid en tempo, waar-door de spraak niet vloeiend klinkt.
De spraakgeneratie module is uitgebreid, om de prosodische variatie tekunnen uiten die door de taalgeneratie module geintroduceerd wordt.Verschillende versies van woorden zijn opgenomen afhankelijk van of zein een geaccentueerde of een ongeaccentueerde conditie voorkomen enof ze voor een frasegrens van enige diepte voorkomen. Alle woorden enfrasen zijn in de juiste context opgenomen, om automatisch de juiste ver-sies te laten uitspreken. Dit in combinatie met een zorgvuldige manier vanopnemen heeft geleid to spraakuitvoer die bijna net zo vloeiend klinkt alsnatuurlijke spraak en waarbij het voorkomen van abrupte verschillen intoonhoogte, luidheid en tempo is geminimaliseerd.
Het nadeel van deze frasenconcatenatie methode is dat aardig wat fonetis-
137
che kennis vereist is om een applicatie-specifiek corpus te construeren datde zinnen dekt die de taalgeneratie module genereert met hun prosodis-che variatie. Bovendien werkt deze spraakgeneratie aanpak alleen voorapplicaties met een niet te groot, stabiel vocabulaire. Wanneer de behoefteaan flexibiliteit toeneemt, is spraaksynthese het enige alternatief. Hoewelde meest populaire implementatie, d.w.z., difoonsynthese, redelijk goedverstaanbaar is, vinden luisteraars de globale kwaliteit nog te laag om hetgebruik daarvan te accepteren in commerciele applicaties.
Hoofdstuk 3 concentreert zich op een belangrijk probleem dat de seg-mentele kwaliteit aantast, namelijk het probleem van hoorbare dis-continuıteiten op difoongrenzen. Deze discontinuıteiten worden voor-namelijk veroorzaakt door spectrale verschillen op de difoongrenzen enzijn het duidelijkst in klinkers. Er is een luisterexperiment uitgevoerdmet de klinkers /a/, /i/, /A/, /I/ en /u/, om te onderzoeken in welkemate deze discontinuiteiten worden waargenomen. De resultaten latenzien dat er flinke verschillen tussen de verschillende klinkers zijn. De /u/heeft het grootste percentage waargenomen discontinuıteiten, terwijl de/a/ het laagste percentage heeft. De scores die in het luisterexperimentzijn verkregen werden gecorreleerd met verschillende spectrale afstands-maten. De correlatie is via Receiver Operator Characteristics tot stand ge-bracht. De Kullback-Leibler (KL) afstand kwam als beste uit de bus.
Om het aantal hoorbare discontinuıteiten te verminderen zijn context-afhankelijke difonen aan de difoondatabase toegevoegd. Om het aantalextra difonen te beperken, is de KL afstand gebruikt om medeklinkers teclusteren die gelijke spectrale effecten op de omringende klinkers hebben.Er is een tweede luisterexperiment uitgevoerd voor de klinkers /a/, /i/,en /u/, om de verbetering die deze extra difonen met zich meebrengente evalueren. De resultaten laten zien dat het aantal hoorbare discon-tinuiteiten voor alle drie de klinkers significant is verminderd. Als wekijken naar de vermindering van de KL afstand is die alleen significantvoor de /i/ en de /u/. Daarbij moeten we zeggen dat de /a/ al veel min-der discontinuiteiten bevatte om mee te beginnen.
Hoofdstuk 4 concentreert zich op een tweede probleem dat de prosodis-che kwaliteit van spraaksynthese aantast, namelijk de inadequate voor-spelling van segmentele duren. Daarom is er een nieuw duurmodelontwikkeld met gebruikmaking van de sums-of-products methode vanVan Santen (1992a). Met een relatief klein corpus van 297 zinnen,bestaande uit 16,775 segmenten, kon een duurmodel geconstrueerd wor-den dat zich goed meet met duurmodellen voor het Frans en Duits die
138
met dezelfde sums-of-products aanpak geconstrueerd zijn. Het gebruikvan fonetische en fonologische kennis in de constructie van de boom metcategorieen en de data analyse, die specifiek voor dit doel is ontwikkeld,resulteert in een model dat de meest belangrijke effecten en interacties be-vat van factoren die de duurvoorspellingen beinvloeden.
De werking van het oude en het nieuwe duurmodel is kwantitatiefgeevalueerd in een vergelijking met de segmentele duren in het training-corpus van 297 zinnen. Het nieuwe model was significant beter dan hetoude. Een perceptief paarsgewijs vergelijkingsexperiment, dat zinnen ge-bruikte die zowel met het oude als het nieuwe model gegenereerd waren,gaf geen uitsluitsel over de perceptieve verbetering.
139

140

Biography
Esther Klabbers was born in Nijmegen on 11 July 1973. She attendedthe Nijmeegse Scholengemeenschap Groenewoud in Nijmegen from 1985to 1991, where she obtained her VWO diploma in 1991. From 1991 to1992 she studied English Language and Literature at the University ofNijmegen. From 1992 to 1995 she studied Language and Computer Sci-ence at the University of Nijmegen. She obtained her Master’s degree in1995 in Language and Computer Science, with a specialisation in speechtechnology. From 1996 until 1999 she was employed as a PhD studentby NWO (Netherlands Organisation for Scientific Research) for the ’Lan-guage and Speech Technology’ Priority Programme. During this time shewas stationed at IPO, Center for User-System Interaction at the EindhovenUniversity of Technology.
141

142