Embed Size (px)
DESCRIPTION
Compilation of student programs and data for Seeley-Swan High School.
Citation preview

456 Airport Road
Seeley Lake, MT
59868
Phone:
406.677.2224
Web:
www.mcpsmt.org
Principal:
Kathleen Pecora
Seeley-Swan
High School
2014
BUILDING PROFILE

1
Building Profile: Seeley-Swan High School 2014
Address: 456 Airport Road
Seeley Lake, Montana 59868
Phone: 406.677.2400
Principal: Kathleen Pecora
Administrative Asst: Cathy Novak
Total Administrative Staff: 1
Total Certified Teaching Staff: 14
Total Classified Support Staff: 7
Seeley-Swan High School is located in the Swan Valley approximately 60
miles north of Missoula in the town of Seeley Lake. A string of lakes runs
the length of the Swan Valley between the Mission and Swan Mountain
ranges making this one of the most breathtaking spots on earth. In 2012
Seeley-Swan High School was ranked as one of the best high schools in
the country and one of the top 15 in the State of Montana by U.S. News
and World Report. Rigorous academic opportunities combined with the
grandeur of the outdoors provide a high quality learning experience for
students.

2
Building Profile: Seeley-Swan High School 2014
Table of Contents
ENROLLMENT DEMOGRAPHICS ........................................................................................................ 3
STUDENT ACHIEVEMENT .................................................................................................................. 5
ACT ................................................................................................................................................ 5
GRADE DISTRIBUTION ................................................................................................................... 5
STUDENT ENGAGEMENT ................................................................................................................ 10
GRADUATION RATE ..................................................................................................................... 10
DROP OUT RATE .......................................................................................................................... 10
AVERAGE DAILY ATTENDANCE .................................................................................................... 11
CHRONIC ABSENTEEISM .............................................................................................................. 12

3
Building Profile: Seeley-Swan High School 2014
ENROLLMENT DEMOGRAPHICS
2011-2012 2012-2013 2013-2014
Gender
Race/
Ethnicity
% Low
Income
% Special
Education
% Plan
504
56%44%
Male
Female 58%
42% Male
Female 56%44%
Male
Female
91
3 4 0 1 00
20406080
100 88.8
5.2 4.3 0 1.7 00
20406080
100 87.2
5.1 4.3 0 3.4 00
20406080
100
38%
% Low Income
39%
% Low Income
57%
% Low Income
11%
% With
IEP
8%
% With
IEP
5%
% With
IEP
0%
% 504
0%
% 504
0%
% 504

4
Building Profile: Seeley-Swan High School 2014 2011-2012 2012-2013 2013-2014
Gifted
Education
English
Language
Learners
0%
%
COMPASS
0%
%
COMPASS
0%
%
COMPASS
0%
% ELL
0%
% ELL
0%
% ELL

5
Building Profile: Seeley-Swan High School 2014
STUDENT ACHIEVEMENT
ACT
The ACT, a curriculum-based achievement exam, is used to assess what students have learned throughout their
academic career and is not based on the student’s aptitude for learning. Based on the ACT College Readiness
Standards, ACT results provide a means to measure what students need to know to be prepared for the transition to
higher learning.
Thanks to a partnership between the Office of Public Instruction (OPI) and the Office of the Commissioner of Higher
Education’s (OCHE’s) Montana GEAR UP, a grant was secured to provide ACT testing at no cost to all Montana public
high school juniors for four years beginning in April of 2012. Offering the ACT to high school juniors provides an early
readiness assessment, giving students an opportunity to adjust their coursework to be ready for the next
step…..admission into college.
The ACT consists of tests in educational development in English, mathematics, reading, and science and results are
converted to “scale scores”. The Composite score and each test score (English, Mathematics, Reading, Science) range
from 1 (low) to 36 (high). (There is no direct, arithmetic relationship between subscores and test scores – test
subscores do not add up to the test score.)
0
10
20
30
English Mathematics Reading Science Composite
21.4
24.122.9 23 22.8
17.8
21.920.5 19.6 20.1
2012-2013 2013-2014

6
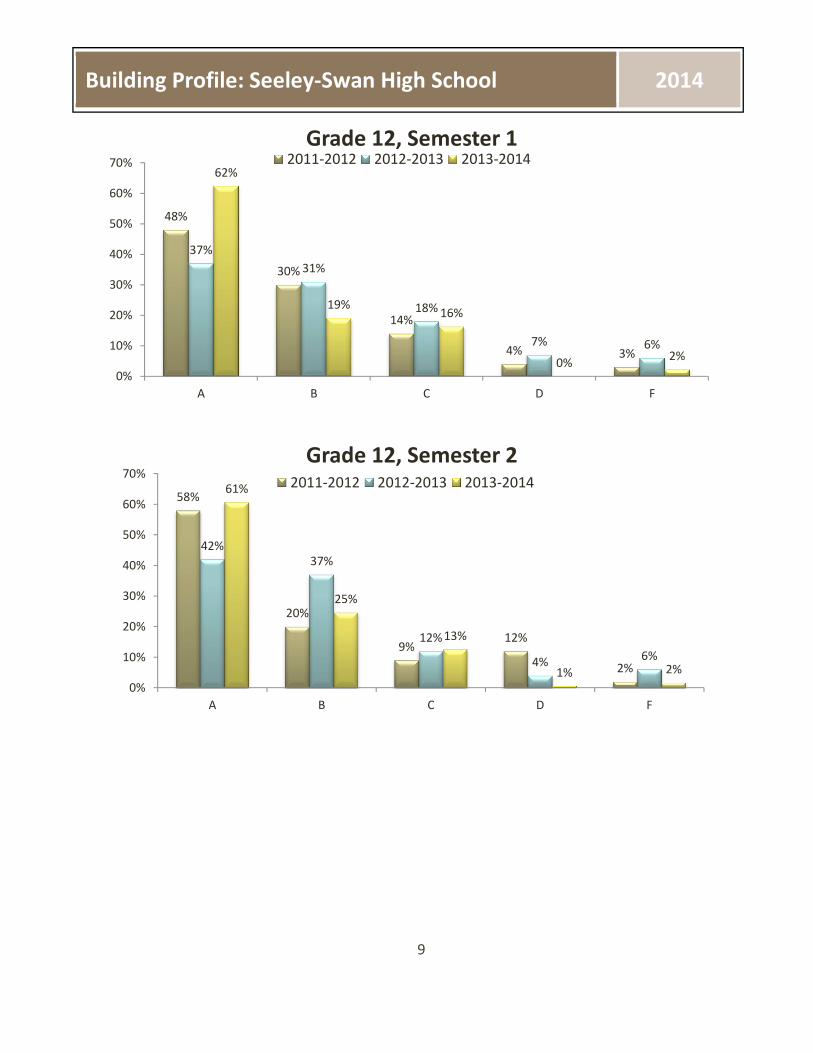
Building Profile: Seeley-Swan High School 2014 GRADE DISTRIBUTION
42%
26%
21%
7%4%
44%
28%
15%
9%5%
41%
35%
18%
0%
6%
0%
10%
20%
30%
40%
50%
60%
70%
A B C D F
Grade 9, Semester 1
2011-2012 2012-2013 2013-2014
45%
30%
13%10%
2%
51%
29%
12%
6%3%
47%
29%
18%
0%
7%
0%
10%
20%
30%
40%
50%
60%
70%
A B C D F
Grade 9, Semester 22011-2012 2012-2013 2013-2014

7
Building Profile: Seeley-Swan High School 2014
52%
31%
9%
4% 4%
36%
29%
21%
12%
2%
41%
32%
19%
0%
8%
0%
10%
20%
30%
40%
50%
60%
70%
A B C D F
Grade 10, Semester 1
2011-2012 2012-2013 2013-2014
54%
24%
12%
5% 6%
44%
32%
18%
5%1%
40%
33%
23%
2% 3%
0%
10%
20%
30%
40%
50%
60%
70%
A B C D F
Grade 10, Semester 2
2011-2012 2012-2013 2013-2014

8
Building Profile: Seeley-Swan High School 2014
36%
43%
10%
5% 6%
38%
32%
16%
6% 7%
43%
31%
24%
0%3%
0%
10%
20%
30%
40%
50%
60%
70%
A B C D F
Grade 11, Semester 1
2011-2012 2012-2013 2013-2014
38%35%
19%
3%6%
44%
23%20%
8%6%
39%
21%
28%
3%
10%
0%
10%
20%
30%
40%
50%
60%
70%
A B C D F
Grade 11, Semester 22011-2012 2012-2013 2013-2014
9
Building Profile: Seeley-Swan High School 2014
48%
30%
14%
4% 3%
37%
31%
18%
7% 6%
62%
19%16%
0%2%
0%
10%
20%
30%
40%
50%
60%
70%
A B C D F
Grade 12, Semester 12011-2012 2012-2013 2013-2014
58%
20%
9%12%
2%
42%
37%
12%
4%6%
61%
25%
13%
1% 2%
0%
10%
20%
30%
40%
50%
60%
70%
A B C D F
Grade 12, Semester 22011-2012 2012-2013 2013-2014

10
Building Profile: Seeley-Swan High School 2014
STUDENT ENGAGEMENT
GRADUATION RATE
DROP OUT RATE
0.0%
20.0%
40.0%
60.0%
80.0%
100.0%
2012 2013 2014
95.2% 93.9% 88.6%
0.00%
2.00%
4.00%
6.00%
8.00%
10.00%
2011-2012 2012-2013 2013-2014
0.00%
1.72% 1.71%

11
Building Profile: Seeley-Swan High School 2014
AVERAGE DAILY ATTENDANCE Average Daily Attendance is the average percentage of total students in attendance each day during one
month and throughout the year.
70
75
80
85
90
95
100
Sept Oct Nov Dec Jan FebMar Apr
MayJun
Annual
Sept Oct Nov Dec Jan Feb Mar Apr May Jun Annual
2011-2012 91 88 87 88 87 82 88 75 77 88 85
2012-2013 89 90 90 88 87 84 87 84 80 96 88
2013-2014 95 92 90 94 93 92 91 89 90 95 92
2011-2012 2012-2013 2013-2014

12
Building Profile: Seeley-Swan High School 2014 CHRONIC ABSENTEEISM Chronic absenteeism is the percent of total students absent more than 10% of instructional time during one semester.
2011-2012 2012-2013 2013-2014
Gr
9
Gr
10
Gr
11
Gr
12
14% 16% 12%
% Chronic
Absent
16% 21% 25%
% Chronic
Absent
32% 34% 35%
% Chronic
Absent
32%29% 33%
% Chronic
Absent

Missoula County Public Schools 215 South Sixth Street West
Missoula, Montana 59801
406.728.2400
www.mcpsmt.org