Embed Size (px)
Citation preview

27 November 2017
West African Resources (WAF)
26g/t gold resource driving Sanbrado
Recommendation
Buy (Initiation) Price
$0.39 Valuation
$0.62 (Initiation)
Risk
Speculative
Analyst
Duncan Hughes 618 9326 7667
Authorisation
David Coates 612 8224 2887
GICS Sector
Materials
Expected Return
Capital growth 59.0%
Dividend yield 0.0%
Total expected return 59.0%
Company Data & Ratios
Enterprise value $201.3m
Market cap $225.7m
Issued capital 578.7m
Free float 95.9%
Avg. daily val. (52wk) $289,562
12 month price range $0.18-$0.45
Price Performance
BELL POTTER SECURITIES LIMITED ABN 25 006 390 7721 AFSL 243480
DISCLAIMER: THIS REPORT MUST BE READ WITH THE DISCLAIMER ON PAGE 24 THAT FORMS PART OF IT.
Page 1
(1m) (3m) (12m)
Price (A$) 0.41 0.37 0.26
Absolute (%) -3.70 5.41 50.00
Rel market (%) -5.26 1.14 39.36
Speculative See key risks on Page 22.
Speculative securities may not be suitable for retail clients
Sanbrado project transformed through high-grade additions
We feel the DFS completed in February demonstrates the quality of understanding on
the open pit operations but also demonstrated the need for additional exploration
success. We believe the exploration success achieved since February and the recent
resource upgrade to 2.7Moz has transformed the project with high grade underground
ore (575koz @ 22g/t Au) likely to complement bulk tonnage open pit operations. The
blending of high-grade open pit and underground ore creates significant flexibility and
diversification. But, more significantly the M1 South Underground Resource will add
overall grade and production ounces to the first years of mining (and LOM), lower strip
ratios and potentially improve recoveries. An updated DFS is expected in mid – 2018
and we expect this to be vastly improved.
Exploration upside expected to add further value
We believe the favourable geology at Sanbrado positions for project for additional
exploration success. The high grade M1 South Resource remains open at depth and is
currently being drill tested. If mineralisation continues to be defined at 1500ozpvm then
each additional 100m of resource will add 150koz of gold. We expect near term
newsflow from drilling this position and anticipate M1 South additions to a likely
resource upgrade next quarter. In addition, drilling at depth in the southern portion of
the M5 Resource indicates potential for an underground resource here also.
Investment thesis – BUY (Speculative), Valuation $0.62/sh
Our SOTP valuation consists of a discounted (40%) NPV valuation on the Sanbrado
project, cash at face value and a peer reviewed exploration valuation. At Sanbrado we
assume a 10 year 2.5Mtpa CIL project utilising underground and open pit ore to
produce an average of 160kozpa LOM at AISC of circa A$900/oz. We discount this
valuation to reflect technical, exploration, permitting and funding risk. We assume
additional equity funding of A$95m and dilute our valuation accordingly. We believe
WAF is an excellent and undervalued exploration story and initiate with a Spec. Buy.
Absolute Price Earnings Forecast
Year ending 30 June 2018e 2019e 2020e 2021e
Sales (A$m) - - - 521
EBITDA (A$m) (14) (11) (9) 361
NPAT (reported) (A$m) (14) (11) (10) 257
NPAT (adjusted) (A$m) (14) (11) (10) 257
EPS (adjusted) (¢ps) (2) (1) (1) 31
EPS growth (%) n.a n.a n.a n.a
PER (x) (16.1) (31.1) (31.2) 1.3
FCF Yield (%) nm nm nm 81%
EV/EBITDA (x) (14.2) (19.2) (23.7) 0.6
Dividend (¢ps) - - - -
Dividend Yield (%) 0% 0% 0% 0%
Franking (%) 0% 0% 0% 0%
ROE (%) -81% -17% -11% 116%
SOURCE: IRESS SOURCE: BELL POTTER SECURITIES ESTIMATES
$0.00
$0.10
$0.20
$0.30
$0.40
$0.50
Nov 15 May 16 Nov 16 May 17 Nov 17
WAF S&P 300 Rebased

Page 2
West African Resources (WAF) 27 November 2017
Contents
Investment case ............................................................................. 3
Valuation ......................................................................................... 6 Peer Analysis ................................................................................. 8 Company overview ........................................................................ 9 Sanbrado Project, Burkina Faso (90%) ...................................... 10 Regional Exploration, Burkina Faso (90%) ................................ 17
Burkina Faso ................................................................................ 18 Board and management .............................................................. 19
West African Resources (WAF) .................................................. 20 Resource sector risks.................................................................. 22

Page 3
West African Resources (WAF) 27 November 2017
Investment case
High grade M1 South resource transforms the project
We feel the DFS completed in February demonstrates the quality of understanding on the
open pit operations but also demonstrated the need for additional exploration success. We
believe the exploration success achieved since February and the recent resource upgrade
(and likely future upgrades) has transformed the project with high-grade underground ore
(575koz @ 22g/t Au) expected to complement bulk tonnage open pit operations. The
blending of high grade open pit and underground ore creates significant flexibility and
diversification. But, more significantly the M1 South Underground Resource will add overall
grade and production ounces to the first years of mining (and LOM), lower strip ratios and
improve recoveries. An updated DFS is expected in mid – 2018 and we expect this to be
vastly improved.
Strong resource base expected to grow and convert
The resource upgrade in October provides a strong resource base of 2.7Moz for the
project. Importantly M1 South (575koz) is at exceptional grades (26g/t Au in Indicated and
16g/t in inferred). Current reserves of 0.9moz are expected to grow from this resource
upgrade where indicated resources currently sit at 2.1moz. We assume reserve life will
grow to support a solid 10 year mine life at ~160kozpa on average over LOM. In addition,
exploration upside is considered excellent with an aggressive 60km drilling program
expected to grow resources further. The favourable geological position of Sanbrado leads
us to believe there is more gold to be found. We see exellent potential to grow high grade
resources down dip of the M1 South and M5 resources.
Depth extensions at M1 South offer near-term upside
The high grade M1 South Resource remains open at depth and is currently being drill
tested. If mineralisation continues to be defined at 1500ozpvm then each additional 100m
of resource will add 150koz of gold (~1 year of underground mine life). The resource is still
relatively shallow and indications are that ground conditions should support mining to
significantly greater depths than the known resource. We expect near term newsflow from
drilling this position and anticipate M1 South additions to a likely resource upgrade next
quarter. In addition, drilling at depth in the southern portion of M5 indicates potential for an
underground resource here also.
However, strike limits on M1 South need careful definition
One consideration at M1 South is the short strike length of mineralisation at <100m. Given
the high-grade of the mineralisation any change from the estimated strike of the ore body
will have a greater than usual impact on the ounces per vertical metre (ozpvm) and the
relative cost of development infrastructure. Based on current strike length estimates the
underground is set to average 1500ozpvm which looks able to support a profitable
underground mine. Resource modelling also looks favourably conservative, however the
risk of unexpectedly shorter strike lengths to this mineralisation and the consequent
dramatic drop-off in ounces should be considered. This should be a major focus in the
updated DFS and ongoing drilling program.
Strike lengths on plunging shoot are short at M1 South
High-grade has transformed the
project
Resources and
reserves to grow
100m = 150koz

Page 4
West African Resources (WAF) 27 November 2017
Processing re-design and blending expected to add value
Metallurgical recoveries in the DFS were 90.7%, however blending more of the higher
grade (higher recovery) M1 South ore as well as an improved SAG and ball mill
comminution circuit is expected to lift recoveries to >93%. Overall gold recovery and costs
will also likely be assisted by the improved gravity recovery (~40% LOM) from coarser M1
South ore and the addition of a Wilfley (shaker) table to the Knelson gravity concentrator
circuit.
Permitted for heap leach operation
The project is currently permitted for a heap leach open pit operation. We believe that,
whilst permitting for a CIL processing plant and underground mine is still required, this
initial permit will assist and uncomplicate the pathway to final permitting.
Management experienced and qualified
Management is experienced in the discovery and development of gold assets in West
Africa. Management has experience from a number of successful ventures in West Africa
including the successful takeover of ASX listed Papillon Resources, the merger of ASX
listed Adamus Resources and the operation of Equigold’s Bonikro Gold project. However,
WAF will need to add to its current team should it wish to develop and mine Sanbrado.
Strong balance sheet will take WAF to a production decision
WAF has circa $25m in cash and no debt. WAF is well placed to fund aggressive
exploration and a DFS in 2018. The current shareholder base that includes Sprott,
Dynamic and Macquarie likely leaves WAF better placed than most should it require future
project funding support.
Expect M&A interest
With a strong project and exploration upside we believe WAF will be attracting the interest
of existing producers in West Africa and is potentially at risk of takeover as Sanbrado
progresses towards a funding decision. At current market valuations we see an opportunity
for a larger incumbent producer to acquire Sanbrado and fund from their own balance
sheet. This has the potential for a near term realisation of value for shareholders.
Undervalued on NAV and peer analysis
Our SOTP valuation of $522m indicates considerable upside on the current market
valuation for WAF. Our peer analysis supports our view that the company has a sizeable
resource base to underpin an operation and does not carry the premium valuation we feel
it should when measured against other ASX listed gold explorers.
Table 1 - WAF sum of the parts valuation (A$m)
SOURCE: BELL POTTER SECURITIES ESTIMATES. * FOR FURTHER DETAIL ON THE VALUATION METHODOLOGY PLEASE SEE THE VALUATION SECTION ON PAGE 6
Fair Value Calculation Discount rate NAV (AUD $M) NAV "X" Factor NAV Target (AUD $M) Target SP (AUD
$)
Sanbrado (90%) 10% $582.5 M 0.60 X $349.5 M $0.41
Exploration Upside $50.0 M 1.00 X $50.0 M $0.06
Unpaid capital $95.0 M 1.00 X $95.0 M $0.11
Cash from options $3.2 M 1.00 X $3.2 M $0.00
Cash (est. end qtr) $24.4 M 1.00 X $24.4 M $0.03
Investments $0.0 M 1.00 X $0.0 M $0.00
Total NAV $755.1 M $522.1 M $0.62
Permitting
commenced
Processing recoveries expected to improve
Management has had success in West Africa
WAF a potential M&A target
Funded to a development
decision

Page 5
West African Resources (WAF) 27 November 2017
Figure 1 - SWOT Analysis
SOURCE: BELL POTTER SECURITIES
Upcoming Catalysts
High grade drilling intersections – ongoing;
Metallurgical test work on M1 South and new processing on M5 – 1QCY18;
Resource update – 1QCY18; and
DFS on underground and open pit mine – 1HCY18.
Strengths
Fully focussed on gold
Exceptionally high grade M1 South
Sizeable resource/ reserve with blending of high grade underground and bulk open pit
Good metallurgy with upside
DFS completed on open pits
Healthy balance sheet. $25m cash, no debt
Permitted – but not for CIL
Capable management with track record
Undervalued
Weaknesses
Need to re-house some locals
Study yet to be completed on underground potential
Permitting still to be completed
Government free- carried 10%
Threats
Gold price volatility
Regional security, political risk
Relatively short strike of plunging shoot
Potential takeover target
FX changes
Opportunities
Exploration upside and large budget
Potential Takeover target
Improve metallurgy
Grid power?

Page 6
West African Resources (WAF) 27 November 2017
Valuation
Sanbrado (90%, Burkina Faso 10% free-carry)
We have modelled Sanbrado to commence production in FY21 with a 10 year mine life
supported by production from high grade underground mining for 4 years from FY21 and
lower grade open pit operations over LOM. We assume open pit and underground ore is
blended over the life of the underground operation. Our mine plan assumes 23.3Mt @
2.41g/t Au for 1.9Moz is mined over LOM, compared to current reserves of 0.9Moz. We
assume additional conversion of resources to reserves on the back of the recent high
grade resource upgrade (150% increase) and future upgrades from underground ounces.
We assume production in excess of 200kozpa over the life of the underground (first four
years) and production of circa 120kozpa thereafter.
Table 2 - Sanbrado assumed mine plan (100% of project)
SOURCE: BELL POTTER SECURITIES ESTIMATES.
We have assumed production efficiency and costs based on company announcements and
our own assumptions. Our FX and gold price assumptions are based on Bell Potter
forecasts.
Table 3 - Sanbrado modelling assumptions
SOURCE: BELL POTTER SECURITIES ESTIMATES
We value WAF’s 90% interest in the Sanbrado project on a post-tax basis, calculating an
NPV10% of A$583m. However, given the underground resources are yet to be converted to
reserves or undergo a feasibility study (the open pit reserves were subject to a study prior
to the recent underground resource upgrade) we have decided to risk our valuation by 40%
to reflect technical and funding risk. Our risked 0.6X NPV for WAF’s 90% share in the
project is A$350m or 41c/share (fully diluted) and 60c/share undiluted.
Mine Plan FY21 FY22 FY23 FY24 FY25
Total Plant Feed (Mt) 2.1 2.5 2.5 2.5 2.5
Average Head Grade (g/t Au) 4.6 3.8 3.1 2.8 1.7
Average Plant Recovery (%) 93.0 93.0 93.0 93.0 93.0
Gold produced (koz) 269 284 234 206 124
Assumption Life of Mine
Open Pit Mining Cost (A$/t rock) 3.20
Underground Mining Cost (A$/t ore) 160.00
CIL Processing Cost (A$/t ore) 14.50
M1 South Processing Cost (A$/t ore) 21.33
G&A Cost (A$/t ore) 4.67
Initial Capex (A$m) 200.00
Sustaining Capex (A$m pa) 10.33
Exploration (A$m pa) 5.00
Government Royalty (%) 5.0%
Community Royalty (%) 1.0%
Corporate Tax (% p.a) 27.5%
LOM C1 cost (A$/oz) 558
LOM All in sustaining cost (A$/oz) 847
LOM Average Gold Price (A$/oz) 1933
A$/US$ (Long term) 0. 75
We value Sanbrado at $350m or 41c/sh

Page 7
West African Resources (WAF) 27 November 2017
Exploration tenure
Exploration tenure, a ~1,000km2 package hosting circa 100km of strike of greenstone,
includes the large but relatively low grade Sartenga gold and copper discovery and the
Moktedu exploration trend which was formerly the main focus of the business before
Sanbrado. Exploration tenure also includes additional resources of 800koz at Sanbrado.
We value exploration tenure at A$50m based on peer comparisons.
Cash, corporate costs, unpaid capital and investments
We assume cash at 31 December 2017 of A$24m and value it at face value. Corporate
costs (A$4mpa) and debt funding are factored into our Sanbrado model. WAF has no
significant additional investments.
We assume the A$3.2m in share options are exercised and dilute our valuation by 20m
shares accordingly. We also assume A$95m (45%) of the assumed capital and working
capital expenditure for Sanbrado is funded through the issue of 244m shares at the current
share price. We dilute our valuation to reflect the unpaid capital of 244m shares.
Total valuation
Our total discounted sum-of-the-parts (SOTP) NAV valuation for WAF is A$522m or
A$0.62/share.
Table 4 - WAF: sum-of-the parts valuation
SOURCE: BELL POTTER SECURITIES ESTIMATES.
Shares on issue (m) 578.7
ITM options (m) 20.0
Performance rights (m) -
Unpaid capital (m) 243.6
Diluted (m) 842.3
SOTP* A$m A$/sh
90% Sanbrado (risk discount 40%, NPV10%) 349.5 0.60
Exploration Upside 50.0 0.09
Cash (est. end qtr) 24.4 0.04
Investments - -
Total (undiluted) 423.8 0.73
Cash from options 3.2 0.00
Unpaid capital 95.0 0.11
Total (fully diluted) 522.1 0.62
Discounted valuation of $522m ($0.62/sh)

Page 8
West African Resources (WAF) 27 November 2017
Peer Analysis
Figure 2 below summarises the attributable resource ounces across the ASX listed gold
sector. WAF has a sizeable resource base, the fourth largest for an explorer on the ASX
and the second largest in Africa. As a result we would expect the company to attract
investor attention and a premium valuation.
Figure 3 below summarises the market valuation of each company’s resource ounces. The
chart displays enterprise value per resource ounce and arguably affords a rough
approximation of what the market appears to be valuing each company’s resources at.
There are several notable limitations with an EV per ounce valuation as not all resources
are the same in terms of depth, grade, commerciality and upside potential. In addition, an
EV per ounce valuation does not account for other valuation metrics such as management
quality, country risk, infrastructure or technical evaluation stage.
Across the sector, WAF appears only moderately valued (a slight premium to median
valuations) for its resources against peers. This surprises us given the large resource base
(~2.5moz), strong exploration upside, level of technical studies (DFS on part of project) and
the very attractive combination of 575koz at exceptional grade (22g/t Au) that can be
blended with open pit tonnes. We believe WAF’s resources should be valued at a
substantial premium to peers.
Figure 2 - ASX listed gold explorers - resources Figure 3 – ASX listed gold explorers – EV per resource ounce
SOURCE: COMPANY DATA & BELL POTTER SECURITIES SOURCE: BELL POTTER SECURITIES ESTIMATES
As a consequence, we feel our peer analysis indicates that there is upside in WAF’s
relative valuation against peers owing to the high quality of the Sanbrado resource ounces.
-
1.00
2.00
3.00
4.00
5.00
6.00
7.00
Mo
z
0
20
40
60
80
100
120
140
160
180
200
EV/o
z (A
$)
WAF’s resources should be valued at a greater premium
WAF’s resources are valued only moderately against peers

Page 9
West African Resources (WAF) 27 November 2017
Company overview
Background
West African Resources (WAF) is a Perth based gold explorer focussed on Burkina Faso
and listed on the ASX and TSXV. WAF listed on the ASX in 2010 with a focus on its Boulsa
project – the northern portion of its current tenement package. Initial results were
encouraging but largely confined to shallow oxide mineralisation at the Moktedu prospect.
In 2012 the company’s focus switched to a large but relatively low grade gold and copper
“porphyry style” deposit called Sartenga.
In 2014 WAF acquired TSXV listed Channel Resources for 30m shares and subsequently
listed on the TSXV in 2014. Channel Resources’ contiguous tenements host the Sanbrado
project (called Tanlouka at the time). Initially WAF looked to develop a low grade heap
leach operation. However, additional high grade intersections and investor appetite led the
company to define a more conventional CIL gold project at Sanbrado and complete a
Definitive Feasibility Study (DFS) on open pit resources in February 2017. The release of a
significant high grade underground resource update in October 2017 looks to have
transformed the economics of the project.
Corporate summary
WAF has 579m shares on issue and 20m options at an average strike price of 16c for a
total potential cash value of $3.24m. The options need to be exercised at various dates
between February 2018 and December 2020 as outlined in the table below. At the current
share price all options are in the money.
Table 5 - WAF options on Issue
SOURCE: WAF, BELL POTTER
There are no performance rights on issue. WAF has net cash estimated at A$24m.
M&A
With a strong project and exploration upside we believe WAF will be attracting the interest
of existing producers in West Africa and is potentially at risk of takeover as Sanbrado
progresses towards a funding decision. At current market valuations we see an opportunity
for a larger incumbent producer to acquire Sanbrado and fund from their own balance
sheet. This has the potential for a near term realisation of value for shareholders.
The Sanbrado Project is located adjacent to TSXV listed Orezone Gold Corporation’s
(ORE) large but very low grade Bombore gold development project (5.7Moz @ 0.64g/t Au).
ORE has a market capitalisation in the order of C$110m. Despite the overall low grade of
Bombore, we see potential synergies with both projects adjacent to each other and looking
to potentially develop their resources.
Expiring Shares (m) ex. Price Value (A$m) ITM (A$m) ITM shares (m)
20/02/2018 5.0 $0.15 $0.73 $0.73 5.0
18/08/2018 0.5 $0.10 $0.05 $0.05 0.5
1/12/2018 2.0 $0.15 $0.29 $0.29 2.0
6/06/2019 5.0 $0.08 $0.42 $0.42 5.0
3/06/2019 1.0 $0.10 $0.10 $0.10 1.0
3/06/2019 1.0 $0.15 $0.15 $0.15 1.0
24/07/2019 1.1 $0.32 $0.35 $0.35 1.1
21/03/2020 0.4 $0.24 $0.10 $0.10 0.4
12/05/2020 0.5 $0.24 $0.12 $0.12 0.5
18/10/2020 0.8 $0.38 $0.28 $0.28 0.8
9/11/2020 2.8 $0.24 $0.66 $0.66 2.8
Total 20.0 $0.16 $3.24 $3.24 20.0
Page 10
West African Resources (WAF) 27 November 2017
Sanbrado Project, Burkina Faso (90%)
Background
The Sanbrado gold project was originally discovered in 2010 by TSXV listed Channel
Resources (CHU). Channel defined the Mankarga 5 (M5) resource of 1Moz. Since
acquiring Channel Resources, WAF has advanced Sanbrado to an open pit DFS and a
combined high grade (M1 south) and low grade (M5) resource of 2.7Moz. WAF owns 90%
of the project with the Burkina Faso government free carried after payback on capital.
Location, Infrastructure and access
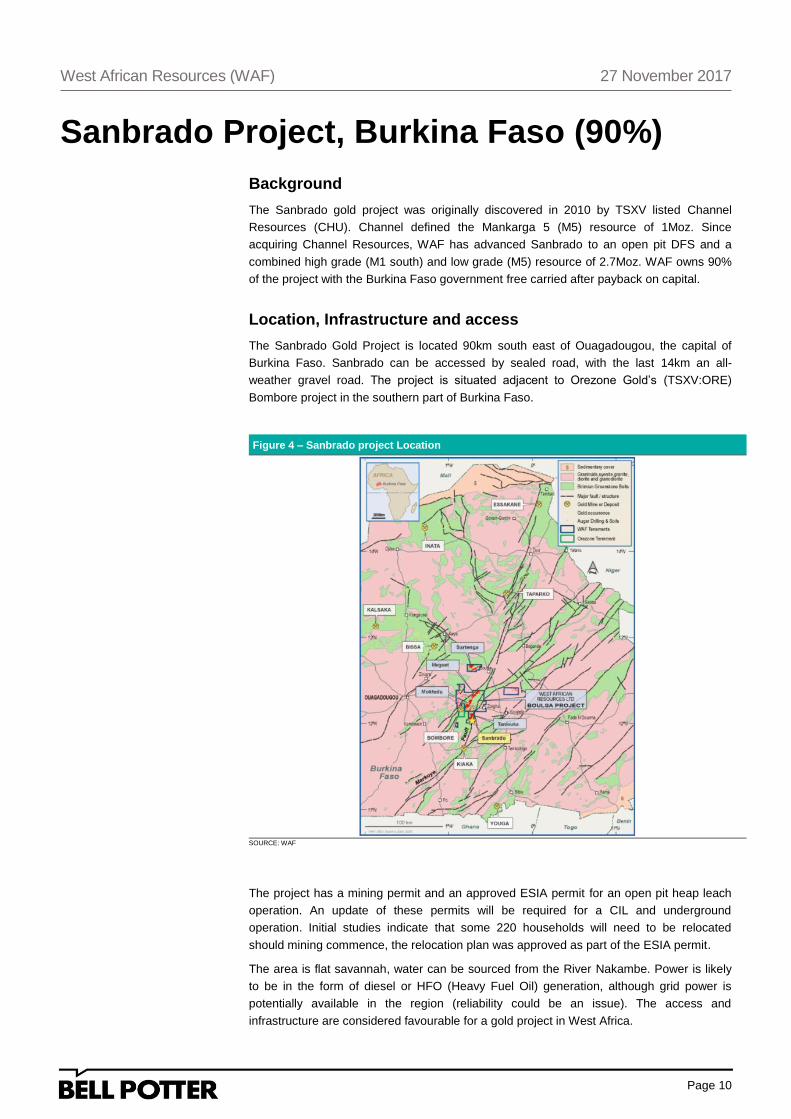
The Sanbrado Gold Project is located 90km south east of Ouagadougou, the capital of
Burkina Faso. Sanbrado can be accessed by sealed road, with the last 14km an all-
weather gravel road. The project is situated adjacent to Orezone Gold’s (TSXV:ORE)
Bombore project in the southern part of Burkina Faso.
Figure 4 – Sanbrado project Location
SOURCE: WAF
The project has a mining permit and an approved ESIA permit for an open pit heap leach
operation. An update of these permits will be required for a CIL and underground
operation. Initial studies indicate that some 220 households will need to be relocated
should mining commence, the relocation plan was approved as part of the ESIA permit.
The area is flat savannah, water can be sourced from the River Nakambe. Power is likely
to be in the form of diesel or HFO (Heavy Fuel Oil) generation, although grid power is
potentially available in the region (reliability could be an issue). The access and
infrastructure are considered favourable for a gold project in West Africa.

Page 11
West African Resources (WAF) 27 November 2017
Geology, resources and reserves
The right structural setting
Sanbrado is hosted within a sequence of structurally deformed Birimian Greenstone rocks,
the Proterozoic aged rocks that host other gold deposits in the region. The sequence of
metamorphosed volcanics and sediments is structurally deformed as part of a regional
deformation event where roughly north-south compression has formed a sequence of
regional transcurrent shear zones that tend northeast as shown in Figure 4. The sequence
of shears and greenstones is intruded by granites and porphyry bodies that often assist in
locating gold mineralisation.
At Sanbrado the M5 structure appears to be a second or third order splay off the regional
Markoye fault zone where it jogs (or deviates) slightly to the north making the area more
favourable for the precipitation of mineralisation fluids in a more extensional/dilational
environment. In addition, the mineralisation appears to be located in the “pressure shadow”
to the south of a competent granodiorite intrusive body. This is a common structural setting
and trap for gold as the large granodiorite affords a ‘de-stress zone’ and dilation which
provides space to trap gold. M1 is likely another structure forced around the granodiorite to
the north. The high grade M1 South shoot likely reflects localized fold hinges or later
faulting that intersects the north trending M1 shear, the likely result from N-S compression.
The Sanbrado gold project is in a geologically favourable location for gold mineralisation
and we see potential for additional gold discoveries here. Interestingly the higher grade
and deeper portions of the M5 trend is located in the south where the M1 trend potentially
intersects, making this a good target for additional high grade gold at depth.
Figure 5 – Sanbrado geology plan
SOURCE: WAF
Gold is found within sheared and boudinaged quartz veining associated with silica,
sulphide (pyrite, arsenopyrite and pyrrhotite), carbonate and calc-silicate alteration. The
high grade plunging shoot at M1 South is associated with particularly intense silicification,

Page 12
West African Resources (WAF) 27 November 2017
this alteration suggests a large amount of fluid flow and potential for a relatively sizeable
gold deposit rather than just a smaller tension gash style of mineralisation.
In long section (Figure 6 below), the high grade plunging shoot at M1 South appears to be
offset slightly to the northwest below 400m vertical depth. We believe this may be a late
structure that could also offset the smaller plunging shoots located at shallow depths to the
northwest in the long section below. In our view, this could open up potential for the offset
continuation of these shallow shoots at depth also. This hypothesised late structure could
also potentially explain why the mineralisation also appears to split at depth on cross
section to the south (Figure 7).
Figure 6 - M1 South long section Figure 7 - M1 South Cross section: ore body splitting at depth
SOURCE: WAF SOURCE: WAF
Resources
Sanbrado hosts four resources, the larger M5 resource, the high-grade M1 South resource
and the smaller M3 and M1 North resources. On 30th October, WAF announced a
substantial (150%) increase in resource ounces at Sanbrado, largely due to the 575koz @
22g/t Au resource from M1 South. M1 South and M5 form the backbone of our assumed
mine plan. M3 will likely provide shallow oxide satellite pits as outlined in the open pit DFS.
Sanbrado hosts a 2.7Moz resource that is JORC 2012 compliant as shown below. The
resource was defined independently with open pit resources defined at a 0.5g/t lower cut
and underground resources at a 3g/t Au lower cut and 250g/t upper cut. Additional
resource upgrades are expected in 2018. The M5 open pit resource and M1 South
underground resource remain open at depth.

Page 13
West African Resources (WAF) 27 November 2017
Table 6 – Sanbrado mineral resources (30 October 2017)
SOURCE: WAF, 100% OF PROJECT
Within the global resource above is an exceptionally high-grade resource at M1 South.
This underground resource is confined to a plunging shoot of mineralisation that has a
relatively short strike length. Given the exceptional grade it is important that mineralisation
is not projected aggressively along strike. Consequently the resource was calculated using
Ordinary Kriging on small parent cell (2.5m x 5m x 5m) block sizes. Modelling allowed
extrapolation no more than 10m along strike at the edge of the resource. Grade distribution
in M1 South shows acceptable variance and a favourably low nugget effect for such a high-
grade ore body with only 4 samples reporting above the 250g/t Au upper cut.
Table 7 – Sanbrado High Grade M1 South mineral resource (30 October 2017)
SOURCE: WAF, 100% OF PROJECT
The high grade resource remains open below 450m.
Open pit reserves were estimated in February 2017 utilizing a 5:1 average strip ratio and
US$1,200/oz gold price. These reserves are expected to grow and the strip ratio fall in an
updated DFS due 1HCY18.
Table 8 - Sanbrado mineral reserves (20 February 2017)
SOURCE: WAF, 100% OF PROJECT
Mining and mine plan
In a potential mining scenario the operation would likely be a combination of open pit
mining and an underground mining operation on M1 South (and possibly at depth on M5
South). The February 2017 DFS assumed an open pit mining operation that would produce
150kozpa over the first 3 years and 93kozpa over the remaining 6 years, at estimated life
of mine (LOM) all in sustaining costs (AISC) of US$759/oz. But with initial capital
expenditure of US$131m the post-tax NPV5 was estimated at ~$100m. This initial DFS was
only based on open pit mining and assumed an extreme 36:1 strip ratio on M1 South.
We believe the recent resource upgrade (and future upgrades) has transformed the
operation with high grade underground ore to complement bulk tonnage open pit
operations. The blending of high grade open pit and underground ore creates significant
flexibility and diversification. But, more significantly the M1 South resource will add overall
grade and production ounces to the first years of mining (and LOM), lower strip ratios and
improve recoveries. We assume contract mining (lower capex slightly higher opex) in our
modelling.
Category Tonnes (Mt) Grade (g/t Au) Contained Gold (Koz)
Measured 0.0 0.0 0
Indicated 38.0 1.7 2,080
Inferred 13.3 1.5 655
Total 51.3 1.66 2,735
Category Tonnes (Mt) Grade (g/t Au) Contained Gold (Koz)
Indicated 0.5 26.4 395
Inferred 0.4 16.1 180
Total 0.8 21.8 575
Category Tonnes (Mt) Grade (g/t Au) Contained Gold (Koz)
Probable 16.8 1.70 918
Total 16.8 1.70 918

Page 14
West African Resources (WAF) 27 November 2017
In the recent resource upgrade the company’s Whittle Pit Optimisation assumed relatively
shallow slope angles of 50⁰ for fresh ore, we believe steeper slope angles are possible and
this would likely lower strip ratios and improve the economics of these pits. The Whittle Pit
design assumes an open pit to 120m at M1 South. An underground operation is currently
expected to commence beneath this pit, accessed by a separate box-cut to enable
underground mining at the same time as open pit mining. M1 South underground mining is
likely to be conventional long-hole open stoping. The dip and widths of mineralisation look
to be supportive of this technique with average widths of 45m and a steep dip and plunge.
More geotechnical work will be done as part of the updated DFS in order to more
confidently determine ground support conditions.
One consideration at M1 South is the short strike length of mineralisation at <100m. Given
the high-grade of the mineralisation any change from the estimated strike of the ore body
will have a greater than usual impact on the ounces per vertical metre (ozpvm) and the
relative cost of development infrastructure. Based on current strike length estimates the
underground is set to average 1500ozpvm which looks set to support a profitable
underground mine. Resource modelling also looks favourably conservative, however the
risk of unexpectedly shorter strike lengths to this mineralisation and the consequent
dramatic drop-off in ounces should be considered and be a major focus in the updated
DFS and ongoing drilling program. Drilling to date shows a consistent ore body that is
relatively predictable at M1 South.
Figure 8 - Planned site layout showing open pit, underground access and plant locations
SOURCE: WAF
Processing
Processing is expected to utilize a conventional 2.5mtpa gravity-CIL processing plant.
Metallurgical recoveries in the DFS were 90.7%, however blending more of the higher
grade (higher recovery) M1 South ore as well as an improved SAG and ball mill
comminution circuit is expected to lift recoveries to >93%. Overall gold recovery and costs

Page 15
West African Resources (WAF) 27 November 2017
will also likely be assisted by the improved gravity recovery (~40% LOM) from coarser M1
South ore and the addition of a Wilfley (shaker) table to the Knelson gravity concentrator
circuit. The company will need to consider the risk of gold theft associated with an open
Wilfley table.
Ore is hard and the M1 South ore recovery benefits from finer grind to 75 microns
compared to M5 at 90 microns – hence the introduction of a SAG- Ball mill combination.
This will add to capex and opex but should be offset by the greater recoveries (assumed in
our modelling). Cyanide consumption is low at 300mg/l to achieve relatively rapid leach
times of circa 24 hours which is favourable.
Given the hardness of the ore and the requirement for a relatively fine grind, power costs
will be relatively high. The company is exploring options on possible grid power, Heavy
Fuel Oil or diesel.
Exploration
Exploration upside potential is considerable at Sanbrado. WAF will have 6 drilling rigs on
site and will complete a geophysical (IP) program to aid exploration targeting at Sanbrado
shortly.
M1 South
The highest priority target is clearly down dip of the M1 South resource. The company is
currently drill testing this area. If mineralisation continues to be defined at 1500ozpvm then
each additional 100m of resource will add 150koz of gold (~1 year of underground mine
life). The resource is still relatively shallow and indications are that ground conditions
should support mining to significantly greater depths than the known resource. We expect
near term newsflow from drilling this position and anticipate M1 South additions to a likely
resource upgrade next quarter.
At M1 South we believe a potential faulted offset of shallow shoots to the south could open
up potential for a continuation of these shallow shoots at depth (as outlined in the geology
section on pages 11 & 12).
M1 South remains open to the south. Reconnaissance drilling of this trend is likely oriented
incorrectly given the shear appears to trend more east-west and drilling traverses are
oriented east west and could potentially miss the ore zone.
M5
Another compelling target is at depth beneath the southern part of the M5 pit design. As
outlined in the geology section on page 11, this higher grade portion of M5 is coincident
with a possible intersection with the M1 trend and makes a compelling geological target
that is complemented by favourable drilling results to date. Gold is often focussed and at
higher grades where two gold bearing structures insect.
Drilling at depth at M5 south has returned some very encouraging widths and grades that
could potentially support an underground operation. Better intersections include 27m @
12.3g/t Au and 8m @ 17.5g/t Au.
The M5 trend extends 1.5km along strike to the northeast of the M5 resource. We expect
drilling to test this trend 2018. The size of the Sanbrado tenement limits the strike extent of
these mineralised trends on company ground, although (in our opinion) WAF’s tenement
covers the geologically most prospective ground within the pressure shadow of the
Sanbrado Granodiorite.

Page 16
West African Resources (WAF) 27 November 2017
Figure 9 – M5 Drilling and pit outline and intersections to south Figure 10 – X-section showing depth potential at M5 South
SOURCE: WAF SOURCE: WAF
The bulk of the FY18 field season’s planned 60,000m of RC and Diamond drilling will likely
focus on Sanbrado.

Page 17
West African Resources (WAF) 27 November 2017
Regional Exploration, Burkina Faso (90%)
Sartenga
The Sartenga copper-gold-molybdenum project is a large tonnage porphyry system which
is unique in the Biriman rocks of West Africa. The Inferred Mineral Resources contain
174,000t copper, 651,000oz gold (70 million tonnes at 0.2% copper, 0.3g/t gold, 166g/t
molybdenum and 1.1g/t silver using a 0.45% copper equivalent cut-off). The dominant
sulphide is bornite and therefore mineralisation has the potential to create a high-grade
copper-gold concentrate. The project is located close to potential infrastructure including
rail to port less than 40 km from the project.
Preliminary metallurgical test work has been carried out on a composite sample of
Sartenga primary ore with a head grade of 0.23% Cu and 0.43g/t Au, at a relatively coarse
primary grind size of 106 microns. Flotation rougher recovery of 97.9% was returned for
gold, while a recovery of 96.1% was recorded for copper. These very high rougher
recoveries indicate that final copper and gold recovery levels into a commercial grade
concentrate will also be quite high, potentially in excess of 90%.
Sartenga was the company’s flagship asset prior to accessing the Sanbrado Project.
Moktedu
The Moktedu prospect is located in the southwestern part of the Boulsa Project. The
prospect covers some 10km of strike and is confined within a northeast trending regional
shear. The prospect is also located some 2km northeast of Orezone Gold Corporation’s
(TSXV: ORE) Bomboré gold deposit. Favourable shallow oxide mineralisation was
intersected including 4m @ 8.4g/t Au and 5m @ 10g/t Au. Mineralisation does not appear
to continue at depth into fresh rock.
Other
The Meguet and Fatmatenga prospects are located near the town of Meguet, some 24km
northwest of Zorgho, and are centrally situated within the Boulsa Project. Best drilling
results include 10m at 7.67g/t Au and 10m at 2.77 g/t Au.

Page 18
West African Resources (WAF) 27 November 2017
Burkina Faso
Burkina Faso is a West African nation located between Ghana and Mali. Burkina Faso has
a strong track record of gold mining and exploration success. Burkina hosts nine gold
mines owned and operated by largely North American and European mining companies
including Roxgold (Yaramoko mine), Avocet (Inata mine), Semafo (Mana mine and
Natougou development), IamGold (Essakane Mine), Nordgold (Bissa Hill and Taparko
mines), MNG Gold (Youga mine) and Endeavour Mining (Karma and Hounde mines).
RoxGold’s Yaramoko gold mine is a high grade and profitable underground gold mine and
likely the best analogy for a potential operation at M1 South.
Burkina Faso is currently ranked 8th in Africa and 48th globally in the Fraser Institute
attractiveness for mining investment survey. The country has a transparent mining code,
the corporate tax rate is 27.5% and government gold royalty is 5%. The government
acquires a 10% free carry in mining projects (after capital payback).
In recent years Burkina Faso’s capital has been on the receiving end of a number of
terrorist attacks. The northern part of the country near the border with Mali is deemed
challenging from a security perspective. WAF’s project is located in the southern portion of
the country that is considered relatively safe to operate in by comparison.

Page 19
West African Resources (WAF) 27 November 2017
Board and management
Management has strong and relevant experience in West Africa. However, the executive
team is small and geared towards exploration and would need complementing should the
company look to develop the project to a producing asset (assuming the asset is not
bought by an incumbent producer).
Non-Executive Chairman – Mark Connelly has more than 27 years of experience in the
mining industry, and has held senior executive positions with Newmont Mining Corporation
and Inmet Mining Corporation. He is the former Managing Director and Chief Executive
Officer of Papillon Resources Limited, a Mali-based gold developer which merged with
B2Gold Corp in a US$570 million deal.
He was Chief Operating Officer of Endeavour Mining Corporation following its merger with
Adamus Resources, where he was Managing Director and CEO. Mark has extensive
experience in financing, development, construction and operation of mining projects in a
variety of commodities including gold, base metals and other resources in West Africa,
Australia, North America and Europe.
Managing Director – Richard Hyde is a geologist with 20 years’ experience in the
minerals industry and more than 15 years of experience in West Africa. Richard has
managed large exploration and development projects in a range of different geological
environments in Australia, Africa and Eastern Europe. He has consulted extensively to the
mining industry as a senior consultant with RSG Global and Coffey Mining based in West
Africa and Australia. Richard is a founding director and shareholder of West African
Resources. He is Member of the Australian Institute of Mining and Metallurgy.
Non-Executive Director – Simon Storm is a chartered accountant with more than 25
years of Australian and international experience in the accounting profession and
commerce. He commenced his career with Deloitte Haskins & Sells in Africa and then
transferred to London before joining Price Waterhouse in Perth. He has held various
senior finance and company secretarial roles with listed and unlisted entities in the
banking, resources, construction, telecommunications, property development and funds
management industries. In the past 10 years, he has provided consulting services
involving accounting, financial and company secretarial matters to various companies in
these sectors.
Chief Operating Officer – Lyndon Hopkins has more than 20 years of experience in gold
exploration, development and production. He is the former COO of Equigold NL’s Ivory
Coast operations and Mine Manager for the construction of Regis Resources Ltd’s
Rosemont Gold Mine.

Page 20
West African Resources (WAF) 27 November 2017
West African Resources (WAF)
Company description
WAF is a Perth-based company focused on gold exploration at its 90% owned Sanbrado
project in Burkina Faso. WAF is listed on the ASX and TSX-V.
Sanbrado hosts >2.5moz of gold resources and is undergoing an aggressive 60,000m per
annum exploration program and Definitive Feasibility Study on a potential gold mining
operation. The project hosts the extremely high grade underground resource at M1 South
(575koz @ 22g/t Au) that will likely supplement bulk open pit mining from M5. The
Feasibility Study is due for completion in mid-2018.
Investment thesis – BUY (speculative), Valuation $0.62/sh
Our SOTP valuation consists of a discounted (40%) NPV valuation on the Sanbrado
project, cash at face value and a peer reviewed exploration valuation. At Sanbrado we
assume a 10 year 2.5mtpa CIL project utilizing underground and open pit ore to produce
an average of 160kozpa LOM at AISC of circa A$900/oz. We discount this valuation to
reflect technical, exploration, permitting and funding risk. We assume additional equity
funding of A$95m and dilute our valuation accordingly. We believe WAF is an excellent
and undervalued exploration story and initiate with a Spec. Buy.
Valuation – risk discounted SOTP with DCF on Sanbrado
We have modelled Sanbrado to commence production in FY21 with a 10 year mine life
supported by production from high grade underground mining for 4 years from FY21 and
lower grade open pit operations over LOM. We assume open pit and underground ore is
blended over the life of the underground operation. Our mine plan assumes 23.3Mt @
2.41g/t Au for 1.9Moz compared to reserves of 0.9Moz. We assume additional conversion
of resources to reserves on the back of the recent high grade resource upgrade (150%
increase) and future upgrades from underground ounces.
We value WAF’s 90% interest in the Sanbrado project on a post-tax basis, calculating an
NPV10% of A$583m. However, given the underground resources are yet to be converted
to reserves or undergo a feasibility study (the open pit reserves were subject to a study
prior to the recent underground resource upgrade) we have decided to risk our valuation by
40% to reflect technical and funding risk. Our risked 0.6X NPV for WAF’s 90% share in the
project is A$350m or 40c/share (fully diluted).
Exploration tenure includes the large but relatively low grade Sartenga gold and copper
discovery and the Moktedu exploration trend which was formerly the main focus of the
business before Sanbrado. Exploration tenure also includes additional resources of 800koz
at Sanbrado. We value exploration tenure at A$50m based on peer comparisons.
We assume cash at 31 December 2017 of A$24m and value it at face value. Corporate
costs and debt funding are factored into our Sanbrado model. WAF has no significant
additional investments.
We assume the A$3.2m in share options are exercised and dilute our valuation by 20m
shares accordingly. We also assume the A$95m (45%) of the assumed capital and working
capital expenditure for Sanbrado is funded through the issue of 275m shares at the current
share price. We dilute our valuation to reflect the unpaid capital of 275m shares.
Our total discounted sum-of-the-parts (SOTP) NAV valuation for WAF is A$522m or
A$0.62/share.
Discounted valuation of $522m ($0.62/sh)

Page 21
West African Resources (WAF) 27 November 2017
Figure 11 - WAF: sum-of-the-parts valuation
SOURCE: BELL POTTER SECURITIES ESTIMATES
Shares on issue (m) 578.7
ITM options (m) 20.0
Performance rights (m) -
Unpaid capital (m) 243.6
Diluted (m) 842.3
SOTP* A$m A$/sh
90% Sanbrado (risk discount 40%, NPV10%) 349.5 0.60
Exploration Upside 50.0 0.09
Cash (est. end qtr) 24.4 0.04
Investments - -
Total (undiluted) 423.8 0.73
Cash from options 3.2 0.00
Unpaid capital 95.0 0.11
Total (fully diluted) 522.1 0.62

Page 22
West African Resources (WAF) 27 November 2017
Resource sector risks
Risks to WAF include, but are not limited to:
Operating and capital cost fluctuations. Markets for exploration, development and
mining inputs can fluctuate widely and cause significant differences between planned and
actual operating and capital costs. Key operating costs are linked to energy and labour
costs as well as access to, and availability of, technical skills, operating equipment and
consumables. West Africa is a relatively expensive place to operate.
Lack of exploration success: Our modelling assumes additional exploration success
and the company’s ability to convert resources to reserves. Exploration is by its very nature
risky and there is no certainty, despite our view on its prospectivity. The M1 South ore body
is particularly exposed to risk in fluctuations in its geometry where an unexpected shrink in
strike length could significantly impact economics of mining.
Lack of funding: Exploration/development companies generally do not have a source of
revenue and so they require access to funding to enable them to carry out adequate
exploration and related development activities in order to continue to develop their
operations. WAF will need to acquire funding for the project which we assume to be in the
order of $200m. WAF is well funded for near term requirements with net cash of ~$25m.
Metallurgical issues: Detailed metallurgical test work has been completed on the open pit
options but is yet to be completed on the underground resource in detail. Initial indications
suggest that improvements can be expected, but this is pending additional test work.
Regulatory and social licence approvals: WAF has a mining permit and ESIA approved
for a Heap Leach operation. It is yet to update this process for a CIL processing plant and
underground operation. The granting of a heap leach permit suggests, but does not
guarantee these additional permits will be granted.
Technical risks: a Definitive Feasibility study has been completed on an open pit mining
scenario at Sanbrado. A study is yet to be completed on a combined underground and
open pit mining scenario. Greater de-risking of the project is expected as the company
completes a combined Feasibility Study in 2018.
Corporate/M&A risks. Risks associated with M&A activity include differences between the
entities and the market’s perception of value associated with completed transactions, the
actual performance of an acquired asset vs its expected performance as assessed by the
acquirer. We view WAF as a potential takeover target.
Commodity price and exchange rate volatility: Gold price and exchange rates are
exposed to a number of unpredictable economic factors that are hard to predict and could
alter WAFs revenue potential. Revenue and costs are paid in a different currency (USD
and CAF) to WAF’s domestic currency.
Africa: Africa offers considerable upside opportunities due to its relative lack of
development and exploration of its mining potential. However, with this opportunity comes
risk of social unrest, lack of infrastructure and unexpected government changes to mining
codes and nationalisation. Each country will vary in risk profile and Burkina Faso is
considered considerably more favourable than many African countries due to a stable
mining code that supports mining investment. However, Burkina Faso has experienced a
forced change in government in recent years and some social unrest, though this has not
overly impacted mining in the country to date.

Page 23
West African Resources (WAF) 27 November 2017
West African Resources as at 27 November 2017
Recommendation Buy, Speculative
Price $0.39
$0.62
Table 9 - Financial summary
SOURCE: BELL POTTER SECURITIES ESTIMATES
PROFIT AND LOSS FINANCIAL RATIOS
Year ending 30 June Unit 2018e 2019e 2020e 2021e 2022e Year ending 30 June Unit 2018e 2019e 2020e 2021e 2022e
Revenue $m - - - 520.7 549.9 VALUATION
Expense $m (14.2) (10.5) (8.5) (159.4) (175.6) NPAT $m (14) (11) (10) 257 242
EBITDA $m (14.2) (10.5) (8.5) 361.3 374.2 Reported EPS c/sh (2) (1) (1) 31 29
Depreciation $m - - - (35.3) (40.5) EPS growth % n.a n.a n.a n.a -6%
EBIT $m (14.2) (10.5) (8.5) 325.9 333.7 PER x -16.1x -31.1x -31.2x 1.3x 1.4x
Net interest expense $m 0.0 - (2.3) (7.7) (2.4) DPS c/sh - - - - -
PBT $m (14.1) (10.5) (10.5) 318.5 331.3 Franking % 0% 0% 0% 0% 0%
Tax expense $m - - - (61.3) (89.0) Yield % 0% 0% 0% 0% 0%
NPAT $m (14.1) (10.5) (10.5) 257.2 242.3 FCF/share c/sh nm nm nm 32 32
P/FCFPS x nm nm nm 1.2x 1.2x
CASH FLOW EV/EBITDA x -14.2x -19.2x -23.7x 0.6x 0.5x
Year ending 30 June Unit 2018e 2019e 2020e 2021e 2022e EBITDA margin % nm nm nm 69% 68%
OPERATING CASHFLOW EBIT margin % nm nm nm 63% 61%
Receipts $m - - - 520.7 549.9 Return on assets % -72% -14% -6% 80% 46%
Payments $m (2.3) (2.0) (2.0) (154.4) (170.6) Return on equity % -81% -17% -11% 116% 51%
Tax $m - - - (61.3) (89.0) LIQUIDITY & LEVERAGE
Net interest $m 0.0 - (2.3) (7.7) (2.4) Net debt (cash) $m (19) (45) 105 (163) (430)
Other $m - - 0.3 0.3 - ND / E % na na 113% na na
Operating cash flow $m (2.2) (2.0) (4.0) 297.6 287.8 ND / (ND + E) % na na 53% na na
INVESTING CASHFLOW Current ratio x 9.8x 2.3x 0.1x 3.1x 13.3x
Capex & Mine Development $m (0.1) (60.0) (140.0) (25.1) (15.9) EBITDA / Interest x nm nm -3.7x 47.0x 154.5x
Sale of PP&E $m - - - - -
Exploration $m (11.9) (8.5) (6.5) (5.0) (5.0) MINERAL RESOURCES, RESERVES & MINE PLAN ASSUMPTIONS (Attributable)
Investing cash flow $m (12.0) (68.5) (146.5) (30.1) (20.9) Total Mt Au (g/t) Moz Au EV/oz
FINANCING CASHFLOW Reserve 15 1.7 0.8 $244
Share issues/(buy-backs) $m 22.6 96.0 0.6 0.9 - Resource 46 1.7 2.5 $82
Debt proceeds/(repayments) $m - 30.0 90.0 (43.6) (43.6) LOM Production 23 2.2 1.7 $120
Dividends $m - - - - - - *assumed production includes low grade stockpiles but excludes 0.5moz of TB underground reserves
Other $m 0.2 (0.3) - - - PROJECT ASSUMPTIONS - production profile, costs, capex & pricing
Financing cash flow $m 22.7 126.0 90.6 (42.7) (43.6) Year ending 30 June Unit 2018e 2019e 2020e 2021e 2022e
Cash generated/(lost) $m 8.6 55.5 (59.9) 224.8 223.3 Currency US$/A$ 0.77 0.75 0.75 0.75 0.75
Gold price US$/oz 1,313 1,360 1,420 1,450 1,450
BALANCE SHEET Gold price A$/oz 1,706 1,813 1,893 1,933 1,933
Year ending 30 June Unit 2018e 2019e 2020e 2021e 2022e Cash costs (C1) A$/oz - - - 459 489
ASSETS AISC A$/oz - - - 696 709
Cash & short term investments $m 19.1 74.6 14.7 239.5 462.8 CAPEX - growth A$m - (60) (140) (10) -
Other current assets $m 0.4 0.4 0.4 0.4 0.3 CAPEX - sustaining A$m - - - (15) (16)
PPE & Exp. & Dev. $m 0.1 60.1 200.1 189.9 165.3 Ore milled Mt - - - 2.1 2.5
Other non-current assets $m (0.0) (0.0) (0.0) 0.0 0.0 Head grade g/t Au - - - 4.6 3.8
Total assets $m 19.6 135.1 215.2 429.8 628.4 Attributable Gold Production oz Au - - - 269,311 284,410
LIABILITIES Gold sold oz Au - - - 269,311 284,410
Accounts payable $m 2.0 2.0 2.0 2.0 2.0
Borrowings $m - 30.0 120.0 76.4 32.7 VALUATION
Provisions $m - - - - - Shares on issue (m) 578.7
Other $m - - - - - ITM options (m) 20.0
Total liabilities $m 2.0 32.0 122.0 78.3 34.7 Performance rights (m) -
SHAREHOLDER'S EQUITY Unpaid capital (m) 243.6
Share capital $m 88.2 184.2 184.8 185.7 185.7 Diluted (m) 842.3
Reserves $m 6.3 6.3 6.3 6.3 6.3 SOTP* A$m A$/sh
Retained earnings $m (77.0) (87.5) (98.0) 159.2 401.6 90% Sanbrado (risk discount 40%, NPV10%) 349.5 0.60
Non-controlling interest $m - - - - - Exploration Upside 50.0 0.09
Total equity $m 17.5 103.0 93.1 351.3 593.6 Cash (est. end qtr) 24.4 0.04
Shares on issue at year end m 583.7 836.8 838.8 842.3 842.3 Investments - -
Total (undiluted) 423.8 0.73
CAPITAL STRUCTURE Cash from options 3.2 0.00
Unpaid capital 95.0 0.11
Shares on issue m 578.7 Total (fully diluted) 522.1 0.62
Performance shares / other m 0.0 * corporate costs and debt incorporated in project NPV
Total shares on issue m 578.7
Share price $/sh 0.390 LT* GOLD PRICE (US$/oz) & DISCOUNT RATE VALUATION SENSITIVITY TABLE
Market capitalisation $m 225.7 Discount/Price $1,150 $1,250 $1,300 $1,400 $1,450 $1,500
Net cash (est.end qtr) $m 24.4 15% $0.39 $0.43 $0.46 $0.50 $0.52 $0.54
Enterprise value (undiluted) $m 201.3 12% $0.43 $0.48 $0.50 $0.55 $0.58 $0.60
Options outstanding m 20.0 10% $0.46 $0.51 $0.54 $0.59 $0.62 $0.65
Options (in the money) m 20.0 8% $0.49 $0.55 $0.58 $0.64 $0.67 $0.70
Performance rights m 0.0 5% $0.55 $0.62 $0.66 $0.73 $0.77 $0.80
Issued shares (diluted for options/rights) m 598.7 0% $0.69 $0.79 $0.84 $0.93 $0.98 $1.03Market capitalisation (diluted) m 233.5 * long term = FY21 onwards
Net cash + options $m 27.6 PRODUCTION PROFILE FY17-FY23
Enterprise value (diluted) $m 205.9
MAJOR SHAREHOLDERS DIRECTORS & MANAGEMENT
% m Non Exec. Chair
Dynamic Fund (1832) 7.9% 45.7 Managing Director
Macquarie 7.0% 40.5 Non Exec. Director
Sprott 5.7% 33.0 Chief Ops Officer
Dir. & Mngmt. 4.1% 23.7
- -
Top 4 24.7% 142.9
Mine Life Assumption
Operation Sanbrado
Years 10
VALUATION METRICS
Implied capital return (%)
P/NAV (x)
End Qtr.
Mark Conelly
Richard Hyde
Simon Storm
Lyndon Hopkins
Current
59%
0.63
-
200
400
600
800
1,000
1,200
1,400
1,600
1,800
2,000
2,200
-
50,000
100,000
150,000
200,000
250,000
300,000
FY2021 FY2022 FY2023 FY2024 FY2025 FY2026 FY2027 FY2028 FY2029
Gold Produced Gold Price (A$/oz) AISC (A$/oz)

Page 24
West African Resources (WAF) 27 November 2017
Bell Potter Securities Limited ACN 25 006 390 7721
Level 38, Aurora Place 88 Phillip Street, Sydney 2000
Telephone +61 2 9255 7200 www.bellpotter.com.au
Recommendation structure
Buy: Expect >15% total return on a
12 month view. For stocks regarded
as ‘Speculative’ a return of >30% is
expected.
Hold: Expect total return between -5%
and 15% on a 12 month view
Sell: Expect <-5% total return on a
12 month view
Speculative Investments are either start-up
enterprises with nil or only prospective
operations or recently commenced
operations with only forecast cash flows, or
companies that have commenced
operations or have been in operation for
some time but have only forecast cash
flows and/or a stressed balance sheet.
Such investments may carry an
exceptionally high level of capital risk and
volatility of returns.
Research Team
Staff Member
TS Lim
Industrials
Sam Haddad
Chris Savage
Jonathan Snape
Tim Piper
John Hester
Tanushree Jain
Financials
TS Lim
Lafitani Sotiriou
Resources
Peter Arden
David Coates
Duncan Hughes
Associates
James Filius
Alexander McLean
Title/Sector
Head of Research
Industrials
Industrials
Industrials
Industrials
Healthcare
Healthcare/Biotech
Banks/Regionals
Diversified Financials
Resources
Resources
Resources
Associate Analyst
Associate Analyst
Phone
612 8224 2810
612 8224 2819
612 8224 2835
613 9235 1601
612 8224 2825
612 8224 2871
612 8224 2849
612 8224 2810
613 9235 1668
613 9235 1833
612 8224 2887
618 9326 7667
613 9235 1612
612 8224 2886
@bellpotter.com.au
tslim
shaddad
csavage
jsnape
tpiper
jhester
tnjain
tslim
lsotiriou
parden
dcoates
dhughes
jfilius
amclean
The following may affect your legal rights. Important Disclaimer:
This document is a private communication to clients and is not intended for public circulation or for the use of any third party, without the prior approval of Bell Potter Securities
Limited. In the USA and the UK this research is only for institutional investors. It is not for release, publication or distribution in whole or in part to any persons in the two specified
countries. In Hong Kong this research is being distributed by Bell Potter Securities (HK) Limited which is licensed and regulated by the Securities and Futures Commission,
Hong Kong. This is general investment advice only and does not constitute personal advice to any person. Because this document has been prepared without consideration of
any specific client’s financial situation, particular needs and investment objectives (‘relevant personal circumstances’), a Bell Potter Securities Limited investment adviser (or the
financial services licensee, or the representative of such licensee, who has provided you with this report by arrangement with Bell Potter Securities Limited) should be made
aware of your relevant personal circumstances and consulted before any investment decision is made on the basis of this document.
While this document is based on information from sources which are considered reliable, Bell Potter Securities Limited has not verified independently the information contained
in the document and Bell Potter Securities Limited and its directors, employees and consultants do not represent, warrant or guarantee, expressly or impliedly, that the
information contained in this document is complete or accurate. Nor does Bell Potter Securities Limited accept any responsibility for updating any advice, views opinions, or
recommendations contained in this document or for correcting any error or omission which may become apparent after the document has been issued.
Except insofar as liability under any statute cannot be excluded. Bell Potter Securities Limited and its directors, employees and consultants do not accept any liability (whether
arising in contract, in tort or negligence or otherwise) for any error or omission in this document or for any resulting loss or damage (whether direct, indirect, consequential or
otherwise) suffered by the recipient of this document or any other person.
Disclosure of interest:
Bell Potter Securities Limited, its employees, consultants and its associates within the meaning of Chapter 7 of the Corporations Law may receive commissions, underwriting
and management fees from transactions involving securities referred to in this document (which its representatives may directly share) and may from time to time hold interests
in the securities referred to in this document.
Exploration Risk Warning:
The stocks of resource companies without revenue streams from product sales should always be regarded as speculative in character. Since most exploration companies fit this
description, the speculative designation applies to all exploration stocks. Stocks with ‘Speculative’ designation are prone to high volatility in share price movements. Exploration and
regulatory risks are inherent in exploration stocks. Exploration companies engage in exploration programs that usually have multiple phases to them where positive results at some
stages are not indicative of ultimate exploration success and even after exploration success, there is often insufficient economic justification to warrant development of an extractive
operation and there is still significant risk that even a development project with favourable economic parameters and forecast outcomes may fail to achieve those outcomes.
Investors are advised to be cognisant of these risks before buying such a stock as WAF.
ANALYST CERTIFICATION
Each research analyst primarily responsible for the content of this research report, in whole or in part, certifies that with respect to each security or issuer that the analyst covered in this report: (1) all of the views expressed accurately reflect his or her personal views about those securities or issuers and were prepared in an independent manner and (2) no part of his or her compensation was, is, or will be, directly or indirectly, related to the specific recommendations or views expressed by that research analyst in the research report.