Embed Size (px)
Citation preview

Sedimentological and tectonic studies in the Central Aquitaine basin: constraints on subsidence and
deformation of a retro-foreland basin
Master 2 internship report
Supervisors: Mary Ford (CRPG, Nancy)
Frédéric Christophoul (OMP, Toulouse)
Anne-Gaëlle Bader (BRGM, Orléans)
Géraldine ROUGIER – Juin 2014
Master 2 – GPIR : Géosciences Pétrolières et Ingénierie des Réservoirs


i
Résumé
Le Bassin Aquitain constitue le bassin d’avant-pays du rétroprisme nord
pyrénéen. Il fait partie des bassins les plus explorés pour ses ressources pétrolières et
gazières. Néanmoins, la déformation et la stratigraphie des dépôts syn-orogéniques sont
peu documentées. L’interprétation des données de sub-surface (puits pétroliers et
profils sismiques) permettent de reconstruire l’histoire sédimentaire pré-, syn- et post-
orogénique. Nous présentons une nouvelle lithostratigraphie mésozoïque-cénozoïque
complète le long d’un transect NNE-SSO de 120 km, de Saint-Gaudens à Montauban. La
coupe est subdivisée en trois zones tectono-stratigraphiques : la plateforme nord, les
Petites Pyrénées, la Zone Nord Pyrénéenne. Depuis le Crétacé supérieur, les épaisseurs
des séries et la migration des faciès sont contrôlées par les variations de subsidence
liées à l’orogenèse pyrénéenne. La chronologie de la déformation alpine et sa
distribution sont affinées. La plate-forme au nord n’est pas déformée. Sa sédimentation
migre vers l’avant-pays depuis l’Ilerdien jusqu’à la base du Miocène et s’accompagne
d’une nette diminution d’épaisseur des dépôts marins, devenant vers le nord détritiques
et continentaux.
Les dépôts anté-albiens de la Zone Nord-Pyrénéenne très déformés pourraient être la
signature d’une tectonique distensive avant la phase de déformation alpine, associée à
un diapirisme actif dès le Jurassique. La déformation du bassin liée à l’orogenèse est
concentrée sur trente kilomètres et constitue les Petites Pyrénées. C’est un dépôt-centre
où reposent plusieurs kilomètres de dépôts turbiditiques crétacés impliqués dans des
plis de croissance pluri-kilométriques d’axe SE-NO. La déformation se propage vers le
nord au cours du temps et est aussi contrôlée par une activité diapirique probablement
initiée dès le Jurassique. Nous montrons le rôle des structures crustales héritées des
phases extensives mésozoïques. Par exemple, le Front des Petites Pyrénées, dont le jeu
compressif s’échelonne du Crétacé supérieur à l’Oligocène, est scellé par les dépôts
détritiques miocènes. Le Chevauchement Frontal Nord Pyrénéen correspond à
l’inversion de la bordure nord du bassin albo-cénomanien qui contrôlait sa
sédimentation. Les dépôts du Crétacé supérieur scellent son activité.
Ce projet rentre dans le cadre de l’ANR PYRAMID et est financé par le BRGM (RGF-
Pyrénées).
Mots clés : rétro-bassin, Pyrénées, subsidence, lithostratigraphie

ii
Abstract
The Aquitaine basin is the retro-foreland basin associated with the north Pyrenean retro-
wedge. It is one of the most explored hydrocarbon retro-foreland basins in the world.
However, the stratigraphy of syn-orogenic deposits and their deformation history are
poorly documented in literature. Interpretations of subsurface data, such as seismic lines
and well data, are used to reconstruct pre-, syn- and post-orogenic sedimentary history.
In this study we provide a new lithostratigraphy along a 120 km transect, from Saint-
Gaudens to Montauban. The section is divided into three tectonostratigraphic zones, the
northern platform, the Petites Pyrenees and the North Pyrenean Zone. Since the Late
Cretaceous, series thickness and facies migrations have been controlled by subsidence
variations linked to Pyrenean orogenesis and halokinesis. Alpine deformation chronology
and its distribution within the basin are here refined.
The northern platform is not deformed. Here, sedimentation migrated toward the north
from Ilerdian to the base of Miocene. Marine deposits thin northwards and become pass
progressively northward into detrital and continental facies.
The deformation of the basin linked to the orogeny constitutes a 30 km wide area: the
Petites Pyrenees. It is an inverted depocentre consisting of several kilometers of
Cretaceous turbiditic deposits, lying in kilometric SE-NW growth folds. Compressional
deformation propagated northwards with time and strongly influenced by halokinesis of
Keuper deposits that probably initiated in Jurassic time. We show the role of inherited
crustal structures from Mesozoic extensional phases. The Petites Pyrenees Front is a
reactivated fault active from Late Cretaceous to Oligocene and sealed by Miocene strata.
In the North Pyrenean Zone, the North Pyrenean Thrust controlled the former border of
an Albo-Cenomanian basin and its activity is sealed by Upper Cretaceous deposits.
In the North Pyrenean Zone, deformed Albo-Cenomanian deposits could be the result of a
tectonic extension occurred before Iberia/Europe convergence.
This project is part of ANR PYRAMID and is founded by the BRGM (RGF-Pyrenees).
Key words: retro-foreland basin, Pyrenees, subsidence, lithostratigraphy

iii
Remerciements
Je tiens tout d’abord à remercier Mary Ford pour m’avoir proposé ce passionnant
sujet de deux ans et pour m’avoir fait confiance tout au long du projet. Ce stage a été
pour moi une expérience très riche pendant laquelle j’ai énormément appris et me suis
beaucoup investi. Merci pour m’avoir donné la possibilité de présenter mes travaux au
congrès Pyramid en novembre dernier, et de m’avoir permis de participer à la formation
PetroMod à Aachen. Merci pour votre patience, vos encouragements et votre expertise
sur les bassins d’avant-pays et en géologie structurale, j’ai bien cru qu’on n’arriverait
jamais à restorer cette coupe (!!).
Un grand merci à Fréderic Christophoul d’avoir quitté durant quelques mois Toulouse
pour venir aider toute l’équipe Pyramid du CRPG, et pour le nombre incalculable de fois
que je l’ai dérangé ! Votre disponibilité et votre expertise sur la stratigraphie et
sédimentologie du Bassin aquitain nous ont été très précieuses.
Je tiens également à remercier Anne-Gaëlle Bader pour son accueil à Orléans et pour
nous avoir permis de collaborer avec le BRGM ; ainsi qu’à Thierry Baudin et son équipe
qui ont choisi notre sujet de Master 2 pour le chantier RGF Pyrénées. De plus, je souhaite
remercier Cédric Carpentier pour être venu plusieurs fois nous aider et pour tous ses
bons conseils.
Merci à mes collègues de bureau, Louis Hemmer (« on va à l’inist ? »), Larissa NGomby et
ses gâteaux, Arjan Grool (bon courage pour la poursuite de ta thèse) pour ses relectures
et ses conseils. Merci aussi à mes amis François Turlin et Guillaume Barré de m’avoir
supporté pendant ces deux années (à bientôt au Québec !), à mes parents et mon frère
pour leur soutien.

iv

v
Avant-propos
Ce projet de Master 2 s’est déroulé de février à juillet 2014 au Centre de
Recherches Pétrographiques et Géochimiques (CRPG) (UMR 7358, Vandoeuvre-les-
Nancy). Le CRPG est un laboratoire du CNRS, et fait partie de l'OSU OTELo qui est un des
pôles de recherche de l'Université de Lorraine. Il a été créé par Marcel Roubault en 1953,
et est actuellement dirigé par Christian France-Lanord.
Cette étude s’insère dans la thématique « Tectonique, Erosion et Evolution du relief » du
laboratoire et s’inscrit dans le cadre de l'ANR PYRAMID1, conduite par Mary Ford. Ce
programme, débuté en Mai 2012, s'intéresse au système d'avant-pays associé à la chaîne
pyrénéenne. Les quatre objectifs principaux de ce projet sont les suivants : il s'agit (1) de
contraindre la structure et l'architecture du système d'avant-pays ; (2) de faire un lien
entre les systèmes de transport des sédiments et les processus d'exhumation à
l'évolution d'un bassin d'avant-pays ; (3) de quantifier les interactions fluides-roches-
déformation ainsi que la migration et l'expulsion des fluides tout au long des phases
d'extension et de compression ; (4) de modéliser les processus géodynamiques. Mon
projet s'inscrit directement dans la première tache et une sous-partie de la deuxième
tâche qui a pour objectif de contraindre la chronologie, l'ampleur et l'architecture de la
déformation du Bassin aquitain.
Par ailleurs ce projet, financé par le BRGM, rentre dans le cadre du Référentiel
Géologique de la France (RGF) dont le premier chantier régional est consacré aux
Pyrénées. Il s’insère plus particulièrement dans la thématique « Sédimentologie des
bassins tertiaires de la Zone Nord-Pyrénéenne » et a pour objectif d’harmoniser toutes
les données géologiques relatives à ce domaine d’étude. Ma contribution se fait sous la
forme de l’élaboration d’un lexique dans lequel un inventaire des différentes formations
rencontrées à travers sept cartes géologiques dans le Bassin Aquitain central est réalisé.
Ce travail fait suite aux travaux de Master 1 qui ont conduit à réaliser une analyse
préliminaire de la zone d’étude permettant de définir les grands axes d’approche pour la
présente étude. Une étude structurale sur une centaine de kilomètres dans l’avant-pays
pyrénéen ainsi qu’une analyse de subsidence et de diagraphies de quelques puits au
nord du bassin avaient été réalisées. Ce rapport présente une étude stratigraphique,
structurale et de subsidence plus détaillée et plus approfondie afin de pouvoir répondre
aux problématiques soulevées.
1 Pyramid: North PYRenees: Integrated Assessment of fluid Migration history, rift Inversion, the role of surface
processes and Deformation in the evolution of an orogenic retro-wedge and its foreland basin.

vi
Table of contents
1. Introduction ..................................................................................................................................................... 1
2. Geological context ......................................................................................................................................... 3
Main structures .................................................................................................................................................. 3
Study area ............................................................................................................................................................. 5
Methodology ........................................................................................................................................................ 6
3. Chrono- & litho-stratigraphy in the Central Aquitaine basin .................................................. 9
North-South Stratigraphy.............................................................................................................................. 9
West-East Stratigraphic correlation...................................................................................................... 10
Lithofacies associations............................................................................................................................... 12
Groups and Formations ............................................................................................................................... 13
Main unconformities ..................................................................................................................................... 18
4. Interpretation of seismic data .............................................................................................................. 20
Construction of a velocity model ............................................................................................................ 20
Seismic stratigraphy ..................................................................................................................................... 20
5. Balanced cross-section ............................................................................................................................ 26
6. Subsidence analysis .................................................................................................................................. 32
7. Discussion ...................................................................................................................................................... 38
Interpretation of subsidence history .................................................................................................... 38
Paleogeographic evolution ........................................................................................................................ 40
Sequential restoration and evolution of Pyrenean retro-foreland basin ............................ 41
8. Conclusion ..................................................................................................................................................... 45
9. References ..................................................................................................................................................... 46
10. Appendices .................................................................................................................................................... 50
List of Appendices .......................................................................................................................................... 50

vii
List of illustrations
FIGURE 1: SIMPLIFIED MAP OF THE PYRENEAN RETRO-FORELAND SYSTEM. STUDY AREA IS OUTLINED BY BOX. (MODIFIED FROM
CHOUKROUNE 1976 AND BITEAU ET AL. 2006) .................................................................................................... 2
FIGURE 2: SCHEMATIC REPRESENTATION OF THE CONTRASTING CHARACTERISTICS OF PRO-FORELAND AND RETRO-FORELAND BASINS,
MODIFIED FROM NAYLOR AND SINCLAIR (2008) .................................................................................................... 3
FIGURE 3: GENERAL MAP OF THE PYRENEES SHOWING THE TWO PARTS OF THE DOUBLE VERGANT MOUNTAIN CHAIN: TO THE SOUTH
THE PRO-FORELAND SYSTEM MADE OF THE PRO-WEDGE AND THE EBRO BASIN; AND TO THE NORTH THE RETRO-FORELAND
SYTEM COMPOSED OF THE RETRO-WEDGE AD THE AQUITAINE BASIN. THE PURPLE LINE CORRESPONDS TO THE STUDIED
TRANSECT (FROM VERGES ET AL., 2012).............................................................................................................. 4
FIGURE 4: ZOOM ON THE STUDY AREA SHOWING THE BOREHOLES USED IN THE CONSTRUCTION OF THE STRUCTURAL CROSS-SECTION;
THE MAIN STRUCTURAL ZONES, AND THE POSITION OF THE SEISMIC PROFILE. FOR THE LEGEND, PLEASE REPORT TO FIGURE 1 .... 6
FIGURE 5: STRUCTURAL MAP OF THE SOUTHERN PART OF THE STUDY AREA, INCLUDING THE NPZ AND THE PETITES PYRENEES,
SHOWING THE MAIN STRUCTURAL AND LITHOLOGICAL UNITS (REPORT TO FIG.7 TO SEE THE AGE AND FACIES OF THE UNITS),
LOCATIONS OF THE CROSS-SECTION AND THE SEISMIC PROFILE. IT HAS BEEN CONSTRUCTED USING GEOLOGICAL MAPS (1/50
000) (FEUILLES SAINT-GAUDENS AND FOUSSERET). NPFT FOR NORTH PYRENEAN FRONTAL THRUST: PPF FOR PETITES
PYRENEES FRONT. FOR THE RESPECTIVE AGES, PLEASE REPORT TO CHAPTER 3 “CHRONO- AND LITHO-STRATIGRAPHY IN THE
CENTRAL AQUITAINE BASIN; FIG.9) ..................................................................................................................... 7
FIGURE 6: GENERAL CHRONOSTRATIGRAPHY OF THE CENTRAL AND EASTERN PYRENEES. (CHRISTOPHOUL & BERNARD (S1), FORD
(S2), GROOL (S3), HEMMER (S4), ROUGIER (S5), NGOMBY MAVOUNGOU (S6), 2014). THE LOCATION OF THESE SECTIONS IS
SHOWN IN APPENDIX 3. THE TOULOUSE FAULT IS LOCATED BETWEEN THE S4 AND S5................................................... 11
FIGURE 7: LITHOFACIES ASSOCIATIONS AND THE ASSOCIATED SHAPES USED IN THE CONSTRUCTION OF THE CHRONO-STRATIGRAPHY AND
THE LITHO-STRATIGRAPHY. .............................................................................................................................. 12
FIGURE 8: SCHEMATIC REPRESENTATION OF (A) A CARBONATE PLATFORM WITH A BARRIER REEF AND (BE) A RAMP, SHOWING THE
LITHOFACIES ASSOCIATIONS USED IN THIS STUDY FOR THE CONSTRUCTION OF THE CHRONO- AND LITHO-STRATIGRAPHY......... 14
FIGURE 9: CHRONOSTRATIGRAPHY OF THE STUDY AREA .................................................................................................. 15
FIGURE 10: LITHOSTRATIGRAPHY OF THE STUDY AREA .................................................................................................... 19
FIGURE 11: SEISMIC PROFILE AND INTERPRETATION IN THE STABLE PLATFORM AROUND THE BOREHOLE AG-1. IT SHOWS THE MAJOR
REFLECTORS CORRESPONDING TO THE TOP OF STRATIGRAPHIC GROUPS: R1 (COUSTOUGE GROUP); R2 (RIEUBACH GROUP), R3
(PETITES PYRENEES GROUP); R4 (DOGGER); R5 (KEUPER GROUP); R6 (BASEMENT); R7 (CARCASSONNE GROUP) ............ 21
FIGURE 12: SEISMIC PROFILE AND INTERPRETATION IN THE STABLE PLATFORM AROUND THE BOREHOLE MTG1. IT SHOWS THE MAJOR
REFLECTORS CORRESPONDING TO THE TOP OF STRATIGRAPHIC GROUPS: R1 (COUSTOUGE GROUP, FIRST EROSIONAL SURFACE);
R2 (RIEUBACH GROUP), R3 (PETITES PYRENEES GROUP); R4 (DOGGER); R5 (KEUPER GROUP); R6 (BASEMENT); R7
(CARCASSONNE GROUP; SECOND EROSIONAL SURFACE); R8 (THIRD EROSIONAL SURFACE) ............................................. 23
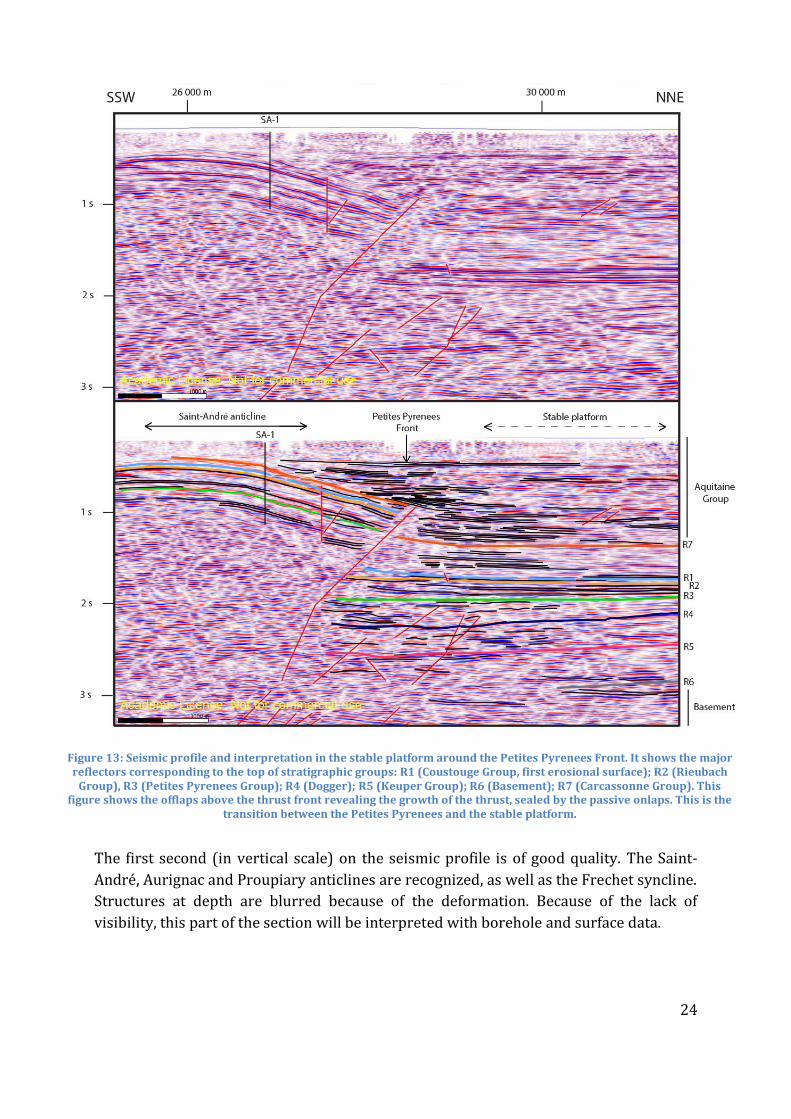
FIGURE 13: SEISMIC PROFILE AND INTERPRETATION IN THE STABLE PLATFORM AROUND THE PETITES PYRENEES FRONT. IT SHOWS THE
MAJOR REFLECTORS CORRESPONDING TO THE TOP OF STRATIGRAPHIC GROUPS: R1 (COUSTOUGE GROUP, FIRST EROSIONAL
SURFACE); R2 (RIEUBACH GROUP), R3 (PETITES PYRENEES GROUP); R4 (DOGGER); R5 (KEUPER GROUP); R6 (BASEMENT);
R7 (CARCASSONNE GROUP). THIS FIGURE SHOWS THE OFFLAPS ABOVE THE THRUST FRONT REVEALING THE GROWTH OF THE
THRUST, SEALED BY THE PASSIVE ONLAPS. THIS IS THE TRANSITION BETWEEN THE PETITES PYRENEES AND THE STABLE
PLATFORM. ................................................................................................................................................. 24
FIGURE 14: SEISMIC PROFILE AND INTERPRETATION IN THE STABLE PLATFORM IN THE PETITES PYRENEES IT SHOWS THE MAJOR
REFLECTORS CORRESPONDING TO THE TOP OF STRATIGRAPHIC GROUPS: R1 (COUSTOUGE GROUP); R2 (RIEUBACH GROUP), R3
(PETITES PYRENEES GROUP); R7 (CARCASSONNE GROUP). IT SHOWS THE SUCCESSION OF ANTICLINES AND SYNCLINES AND THE
TRANSITION WITH THE STABLE PLATFORM BY THE PETITES PYRENEES FRONT. .............................................................. 25
FIGURE 15: BALANCED CROSS-SECTION ALONG THE STUDIED TRANSECT .............................................................................. 27
FIGURE 16: REPRESENTATION OF THE EVOLUTION OF A SALT DIAPIR: REACTIVE (ACTIVE) DIAPIRISM DURING EXTENSION, PASSIVE
DIAPIRISM WHEN SEDIMENT LOAD IS IMPORTANT, THE SALT IS THUS FORCED TO MIGRATE (FROM FOSSEN, 2010) ............... 29
FIGURE 17: REPRESENTATION OF AN INVERTED NORMAL FAULT. AT THE BASE OF THE FAULT THE DISPLACEMENT IS NORMAL, AT THE
TOP IT IS INVERTED. THE NOD POINT CORRESPONDS TO ZERO DISPLACEMENT. ............................................................. 31

viii
FIGURE 18: DECOMPACTION CURVES FOR THE BOREHOLE AV-101, REALIZED WITH PETROMOD .............................................. 34
FIGURE 19: DECOMPACTION CURVES FOR THE BOREHOLE MTG-1, REALIZED WITH PETROMOD .............................................. 35
FIGURE 20: DECOMPACTION CURVES FOR THE BOREHOLE SA-1, REALIZED WITH PETROMOD .................................................. 36
FIGURE 21: DECOMPACTION CURVES FOR THE BOREHOLE PSI-1, REALIZED WITH PETROMOD ................................................. 37
FIGURE 22: SUMMARIZING PLOT OF THE TOTAL SUBSIDENCE REALIZED FOR 4 BOREHOLES (AV-101, MTG-1, SA-1 AND PSI-1) WITH
SUBSIDENCE.EXE ........................................................................................................................................... 38
FIGURE 23: SEQUENTIAL RESTORATION OF THE BALANCED CROSS-SECTION (SEE FIG. 15) INTO FOUR STEPS. THE SHORTENING BETWEEN
THE END OF APTO-LOWER ALBIAN AND THE PRESENT SECTION IS ESTIMATED AT 22%. .................................................. 42
FIGURE 24: SCHEMATIC REPRESENTATION OF THE RATIO USED (2:1) TO CONSTRUCT THE OVERHANGING BLOCK IN THE CONSTRUCTION
OF THE RESTORATION (SECOND STEP) , WHERE “X” IS THE LENGTH OF THE BASIN MARGIN. ............................................. 43
List of tables
TABLE 1 : CHARACTERISTICS OF THE 21 WELLS USED IN THIS STUDY: NAME, LOCALITY, COORDINATES (LAMBERT 2 ÉTENDU), YEAR OF
DRILLING, DEPTH AND ALTITUDE IN METRES (FROM INFOTERRE, BRGM WEBSITE) ......................................................... 8

1
1. Introduction
The Aquitaine basin is one of the most explored retro-foreland basins in the world.
Regional exploration and exploitation of oil and gas resources have been intense over
the last 60 years. This is the foreland basin associated with the north Pyrenean retro-
wedge that was generated by the convergence of the Iberian and European plates. It
developed on the overriding European plate, while the Ebro basin lying on the
subducting Iberian plate constitutes the pro-foreland basin (Munoz, 1992; Roure et al.,
1990). From Late Cretaceous to Miocene times, the Pyrenean orogeny generated a fold-
and-thrust belt consisting of deformed Mesozoic and Cenozoic sub-basins.
From recent studies, retro-foreland basins are thought to preserve a complete syn-
orogenic stratigraphic history. They display a condensed record of sedimentation as the
basin does not migrate (or to a very limited degree) towards the foreland (Naylor &
Sinclair, 2008). In contrast, in the pro-foreland basin these authors show onlaps onto the
pro-foreland forebulge indicating, as series of disconnected successive depocentres due
to relatively important migration. Furthermore, these authors suggest that retro-
foreland basins are narrower than pro-basins. Their model subdivides orogenesis into
two periods: (i) growth due to orogenic-wedge accretion and (ii) stabilization of the
mountain chain after convergence has stopped; subsidence is then only due to
sedimentation. Subsidence rate is considered to be constant during the growth phase in
the retro-foreland basin; it decreases with time and is null during the quiescence phase
(Sinclair & Naylor, 2012).
In the case of the north Pyrenean foreland, early propagation of the retro-wedge
thrust front occurred from Late Campanian until Early Eocene (Sinclair et al., 2005),
associated with the inversion of extensional structures and the growth of the pro-wedge.
Using thermochronology, magnetostratigraphic data and sediment rates in the two
foreland basins, these authors create sand-box experiments representing a flux-based
evolutionary model. They demonstrate that the ending of pro-wedge frontal accretion
led to accretion in the retro-wedge resulting in internal thickening. This may have been
developed between Middle Eocene and Upper Eocene. In contrast to the pro-side, the
retro-wedge thrust front activity ceased in the Priabonian according to Sinclair et al.
(2005).
The aim of this work is to use the Central Aquitaine basin as a detailed case study to
address the following questions: what are the controlling factors on a retro-foreland
system and what are the structural characteristics? What is the influence/control of the
Pyrenean orogeny on the sedimentation? What was its chronology? What role did salt
play in deformation of the foreland area? What role did crustal structures inherited from
the pre-convergence tectonic history play? How did they influence the actual basinal and
structural geometries? What is the amount of shortening? What is the evolution of the
subsidence history and what is its driving force? What is the part of tectonic subsidence

2
inferred from the total subsidence? How can we interpret the subsidence curves in
terms of regional tectonic events?
Although this basin has been well-studied, the stratigraphy of syn-orogenic deposits
and their deformation history are poorly documented in literature as they are not of
interest to petroleum industry. The first objective of our work was to provide a new
litho- and chrono-stratigraphy along a 120 km-long transect, from Saint-Gaudens to
Montauban (fig.1). The second objective was to study the foreland deformation style
along this section based on the examination on geological maps, borehole data and
seismic lines, most of poor-quality. Three zones with different deformation styles are
identified: the North Pyrenean Zone (ZNP), the Petites Pyrenees, and the northern
platform. In each zone structures are defined including thrust faults, fold, growth folds
and salt diapirs.
Figure 1: Simplified map of the Pyrenean retro-foreland system. Study area is outlined by box. (modified from Choukroune 1976 and Biteau et al. 2006)
These structures are sequentially restored constrained by detailed stratigraphic
geometries. The amount, timing and distribution of shortening due to Pyrenean
compression within the retro-foreland basin can thus be estimated. We discuss the role
of palaeo-relief on the Paleozoic substratum (Choukroune, 1974), inherited crustal
structures from Mesozoic extensional phases (Debroas, 1990; Baby et al., 1988) as well
as Keuper evaporite diapirism (Jammes et al., 2010; Ferrer et al., 2012) these features
may have a crucial control on the mechanics and the distribution of the deformation.
Since the Late Cretaceous, series thicknesses and facies migrations were controlled by

3
subsidence variations linked to Pyrenean orogenesis and salt tectonics. Consequently,
the final objective of the present study is the construction of subsidence curves along the
whole transect. Results from these analyses enable us to define and constrain the timing
of alpine deformation, its distribution in time and space, and the subsidence history in
the Central Aquitaine basin. Finally, we comment on published models for the retro-
foreland basins of Naylor & Sinclair (2008), Sinclair & Naylor (2012), and Sinclair et al
(2005).
2. Geological context
Main structures The Pyrenean orogen has two foreland systems, the Aquitaine foreland system
composed of the retro-wedge and retro-basin (French side) and the Ebro foreland
system composed of its pro-wedge and pro-basin (Spanish side)(fig.2). These two sides
are separated by the Axial Zone (fig.3). This zone is an antiformal stack that comprises
crystalline basement rocks and locally preserved Permian, Triassic, and Cretaceous
cover (Verges et al., 2012). After several episodes of crustal thinning and rifting from
Early Trias until Early Cretaceous, the convergence between these two plates is thought
to have begun during Late Cretaceous (Santonian times) and completed in Miocene
times. N-S convergence between Iberia and Europe led to a N100°-110° oriented
mountain range with double vergence (Sinclair et al., 2005). The shortening
accommodated by upper crustal thickening is estimated as about 165 km (Munoz, 1992;
Beaumont et al., 2000).
Figure 2: Schematic representation of the contrasting characteristics of pro-foreland and retro-foreland basins, modified from Naylor and Sinclair (2008)

4
Figure 3: General map of the Pyrenees showing the two parts of the double vergant mountain chain: to the south the pro-foreland system made of the pro-wedge and the Ebro basin; and to the north the retro-foreland
sytem composed of the retro-wedge ad the Aquitaine basin. The purple line corresponds to the studied transect (from Verges et al., 2012)
In the present study we focus on the northern foreland system, and more
particularly on the central eastern Aquitaine foreland basin, within which three
tectonostratigraphic units are defined. From north to south these are (fig.1):
- (i) The slightly deformed Aquitaine platform integrating Mesozoic and Tertiary
deposits over a Paleozoic basement; it extends to the north towards the Variscan French
Massif Central.
- (ii) The Sub-Pyrenean Zone (SPZ) or Petites Pyrenees, is overthrust by the NPZ
along the North Pyrenean Frontal Thrust (NPFT) to the south and delimited to the north
by the Petites Pyrenees Front (PPF). The PPF is also a major south-dipping thrust sealed
by post-orogenic sediments, which has been recognized thanks to geophysical
prospection (fig. 13). The SPZ is composed of folded pre- and syn-orogenic sediments
lying in several sub-basins, such as Comminges, Arzacq, Mirande or Tarbes for instance.
These folds are sealed by Miocene and younger post-orogenic strata.
- (iii) The North Pyrenean Zone (NPZ), delimited to the south by the E-W steeply
dipping North Pyrenean Fault (NPF), is characterized by extremely deformed Mesozoic
deposits in thrust sheets, Paleozoic sediments and metasediments and crystalline
basement forming the external crystalline massifs. Many known Albo-Cenomanian

5
basins (Bigorre basin, Debroas 1990; Camarade basin, Baby 1988) lie in the immediate
hanging wall of the south-dipping North Pyrenean Frontal Thrust (NPTF).
Study area The study area is located in the central foreland basin, from south of Saint-
Gaudens to the north of Montauban (fig. 4). This 120 km-long transect has a SSW-NNE
trend from Estabens to Aurignac; a N-S trend from Aurignac to Agassac; a SSW-NNE
trend from Agassac to the northern end of the section.
From south to north it cuts through several structures (fig.4):
(1) the NPZ extending towards Castillon (fig. 5) where the Albo-Cenomanian
basin constitutes a 10 km-wide north-dipping monocline. The NPFT is a salt-injected
structure and is partly hidden by post-orogenic deposits in this area, while it outcrops in
the eastern part of the Saint-Gaudens map (Paris et al. 1971).
(2) The SPZ, also termed in this area “Petites Pyrenees” from Castillon to Saint-
André (fig.5). First order folds are identified in the NPZ and the SPZ: (i) the Cabanes
syncline and (ii) the Lôo anticline in the NZP showing a WSW-ENE axis; (iii) the Latoue
syncline, (iv) the Proupiary anticline, (v) the Frechet syncline, (vi) the Aurignac anticline
and (vii) Saint-André anticline in the SPZ that all display a NW-SE axial trend. This part
of the Petites Pyrenees zone is called the Comminges sub-basin. This zone has been
intensely drilled especially in the Aurignac and Proupiary anticlines as it is very rich in
natural oil and gas resources (Biteau et al., 2006). The Saint-Marcet field (the western
extension of the Proupiary anticline) is the best-known gas field in the Comminges sub-
basin that was exploited for more than 50 years since 1949.
(3) The stable northern platform constitutes the northern part of the transect.
The Aquitaine platform is covered by Miocene detrital deposits and Quaternary
alluvium. In the study area, this part of the platform is termed the Mirande sub-basin.
Less rich in natural resources, the density of wells is much lower in this zone than in the
Petites Pyrenees.

6
Figure 4: Zoom on the study area showing the boreholes used in the construction of the structural cross-section; the main structural zones, and the position of the seismic profile. For the legend, please report to
figure 1
Methodology In order to provide a detailed analysis of the study area, 21 wells (fig.4) are used in
addition to the following eight geological maps (1/50 000) published by the BRGM
(Appendix 1):
Montréjeau (n°1054)
Saint-Gaudens (n°1055)
Le Fousseret (n°1033)
Lombez (n°1008)
Gimont (n°982)
Beaumont-de-Lomagne (n°955)
Saint-Nicolas de la Grave (n°929)
Montauban (n°930)
The maps constrain lithostratigraphic boundaries at surface as well as providing dips
and information on thicknesses of layers.

7
Figure 5: Structural map of the southern part of the study area, including the NPZ and the Petites Pyrenees, showing the main structural and
lithological units (report to fig.7 to see the age and facies of the units), locations of the cross-section and the seismic profile. It has been constructed using geological maps (1/50 000) (Feuilles Saint-Gaudens and Fousseret). NPFT for North Pyrenean Frontal Thrust: PPF for Petites
Pyrenees Front. For the respective ages, please report to Chapter 3 “Chrono- and litho-stratigraphy in the Central Aquitaine basin; fig.9)

8
Well data are available on InfoTerre (BRGM website, Table 1, Fig. 4, and Appendices
4 to 24). They all lie within 10 km of the section line. Six wells reach the crystalline
basement (LF-1; CS-101, CS-102, AV-101, CDR-101 in the platform and LA-2 in the NPZ).
An orthogonal projection onto the cross-section is required, except for 4 wells (Lôo-1, A-
101, A-4, A-2) that are projected parallel to the relevant anticlinal axial plane. For each
well, the depth, the year of drilling and the altitude are listed in Table1. The location of
the wells is shown in figure 4.
Table 1 : Characteristics of the 21 wells used in this study: name, locality, coordinates (Lambert 2 étendu), year of drilling, depth and altitude in metres (from InfoTerre, BRGM website)
Lithological descriptions, biostratigraphic data and well logs are available in the
survey reports of each well provided by the BRGM (InfoTerre) and via the Bureau
Exploration-Production des Hydrocarbures (BEPH) database. This very large database
lists all the documents available for every well drilled in the Aquitaine basin (seismic
profiles, stratigraphic logs, well logs, survey reports). The stratigraphy and the
lithologies are most of time better detailed in theses survey reports than on the
InfoTerre site.
We used the software MoveTM 2014.1 to build a 3D database. All the wells were
represented as lithostratigraphic columns below the georeferenced geological maps that
are themselves projected onto the regional digital elevation model (DEM; ASTER).
Dipmeter measurements and well deviations (Appendices 4 to 24) are added on these
columns and are useful to have a quick overview of the structures at depth.

9
We also used a seismic profile to guide us in subsurface structural
interpretations. This line starts at the northwest of Estabens (fig.5) and is sub-parallel to
the cross-section to the southern part of the Petites Pyrenees (NE trend). Then the
seismic line marks a sudden divergence to the west, and it finally has a continuous NE
trend to the east of Polastron (fig.4). Thus, it crosses through the NPZ, the Petites
Pyrenees and the south of the northern platform. It is not parallel to the cross-section, so
boreholes, which have been converted into time, also need to be projected on it.
Sometimes, the location from where the well is projected has a different altitude from
the point of projection on the seismic line. In order to minimize the risk of variations of
the altitudes, a vertical shift is made manually so that the wells and the seismic profile
match. The vertical scale of this profile reaches 5seconds.
Finally, comparisons are made between our structural cross-section and previous
interpreted work (Paris et al., 1971; Héritier et al., 1972; Debroas, 1990; Bourrouilh et
al., 1995; Total database, 1998; Serrano et al., 2006).
3. Chrono- & litho-stratigraphy in the Central
Aquitaine basin
In this section we present a chrono-stratigraphy and a litho-stratigraphy of the
central foreland basin along a NNE-SSW transect. In order to apprehend the spatial
distribution and thus the basin fill architecture, we adopt a harmonized approach along
the whole transect so data can be more easily compared. To this end, we carried out an
inventory of all stratigraphic units in boreholes along the segment, we defined a series of
lithofacies associations and we created lithostratigraphic groups. This work was carried
out along cross-sections to the east and west to present section in order to establish a
harmonized stratigraphic scheme along the proximal Aquitaine foreland basin and
covers a 200 km-long area, from the Corbières to Lourdes for the PYRAMID project
(fig.6).
North-South Stratigraphy An inventory of all stratigraphic units (formations) outcropping and identified in
boreholes in the study area has been established (Appendix 2). For each main structural
zone (NPZ, Petites Pyrenees, platform), all lithostratigraphic units are identified by
formation names and/or age (often only defined by their age) and by a stratigraphic
code. Theses codes are frequently in-consistent between BRGM maps due to the year of
publication. On well logs, assignment of age and formation names to stratigraphic units
is very heterogeneous in precision and certainty both along the borehole and between
boreholes. Lots of time was spent on this essential task because of the lack of detailed
descriptions and lack of precision in age assignment in the logs provided by InfoTerre
and the BEPH database. In some cases, ages were referenced only as series name such as

10
“Upper Cretaceous” or Malm” for instance, with detailed lithological descriptions or
biostratigraphic markers to confirm age assignment. The goal was to assign the most
reasonable age to each layer (e.g. Maastrichtian, Campanian, Santonian and so on). The
first step was to check in the explanatory notes (in InfoTerre and BEPH) in order to see
if dating details were provided and with what uncertainty. Then, the log descriptions are
compared to palaeogeographic maps (BRGM, 1974; and Barnolas et al., unpublished) to
check that they corresponded to the proposed spatial and temporal extension of
assigned lithological formations.
The construction of this stratigraphic lexicon harmonizes for the first time the
stratigraphic nomenclature and age estimates of all the geological maps and borehole
data in the proximal Aquitaine basin. This detailed work was essential to allow the N-S
correlation of stratigraphy. It constitutes the basis for the construction of the
chronostratigraphy, the lithostratigraphy and structural history leading to foreland
basin reconstruction.
West-East Stratigraphic correlation The same kind of inventories have been synchronously established for 5 others N-S
sections (Appendix 3): one to the west (n°6, near Boulogne-sur-Gesse,) and 4 at the east
(n°1 and n°2 crossing the Mouthoumet massif, n°3 near Lavelanet, n°4 near Mas d’Azil)
of the studied section. For each cross-section, a chronostratigraphic column is realized
(fig.6) summarizing all the formations present (in outcrop and/or in boreholes) in the
Petites Pyrenees. Juxtaposed side by side, regional E-W correlation is possible.
Sediment distribution across the central and eastern foreland basin presents some
discontinuities. The Toulouse Fault separates two main zones: the western part displays
an almost complete stratigraphic sequence from Trias to Miocene, whereas the eastern
part includes a 110 km-long zone (W-E trend, from Toulouse Fault through the
Carcassonne Strait to Mouthoumet Massif) where Trias to Upper Cretaceous strata are
absent. These strata reappear along the eastern side of the Mouthoumet massif in the
“Nappe des Corbières”. Moreover, it must be noticed that the sedimentation at the East
of the Toulouse Fault is more continental than the sedimentation at the West.

11
Figure 6: General chronostratigraphy of the Central and Eastern Pyrenees. (Christophoul & Bernard (S1), Ford (S2), Grool (S3), Hemmer (S4), Rougier
(S5), Ngomby Mavoungou (S6), 2014). The location of these sections is shown in Appendix 3. The Toulouse fault is located between the S4 and S5.

12
Lithofacies associations We distinguish several lithofacies associations (LFA), classified according to their
depositional environment. Four main categories are differentiated (fig.7), and their
respective bathymetries are indicated in figure 8.
Figure 7: Lithofacies associations and the associated shapes used in the construction of the chrono-stratigraphy and the litho-stratigraphy.
-1] Continental LFA including fluvial and alluvial plain deposits, backswamps and
oxbow lakes with mudstones and sandstones. It comprises mainly brown and red marls,
variegated shales, shaly sand and sandstones with quartz pebbles and organic matter
(C1); lacustrine limestone (C2);
-2] Brackish to shallow marine clastic LFA including shallow marine clastic
deposits (SM1) and evaporite (SM2). This LFA comprises confined coastal environments,
but also continental-marine transitional environments. It is mainly represented by
variegated marls interbedded with gypsum and sand. Fossils such as Alveolina and
Nummulites are often described.
-3] Marine carbonate LFA (fig. 8a) including low energy internal platform
(lagoons, embayments) deposits (MCA1); high-energy sediments of platform margin
(MCA2) and low-energy settings of external platform (MCA3); secondary dolomitized
carbonates are grouped into a fourth sub-group (MCA4). MCA1 is represented by white
limestone, oolithic limestone, slightly marly. Echinoderms, molluscs, brachiopods,

13
Turitella, Alveolina and algae are the fossils often described. MCA2 is fossil-rich (rudists,
ooliths, reef).
-4] Marine clastics LFA (fig.8b) including marine sandstones interbedded with
shales, corresponding to offshore deposits or turbiditic deposits (MCL1); marine
polygenic breccias (MCL2). The respective bathymetries are indicated on the figure 8.
They are deduced from the depositional environments and the presence of specific
fossils. For instance Turitella, Nummulites and Alveolina are fossils found into the
internal platform. When the environments are not easily deduced, we need to refer to
palaeogeographic synthesis (BRGM, 1974; Barnolas et al., unpublished).
Groups and Formations From the NPZ to the northern part of the Aquitaine platform, deposits can be
divided into eleven informal stratigraphic groups which in turn can be subdivided into
formations (fig. 9). This is a first proposal or working model of stratigraphic
nomenclature and it is clear that in places the definition of formations in particular is
incomplete. Established names of formations are respected as much as possible.
However, many group names are newly assigned. From these subdivisions and borehole
information, a lithostratigraphy is also constructed (Fig. 10).
Buntsandstein Group (Lower Trias) It is found only in one borehole (AV-101) in the
platform. It is constituted by shaly and fine-grained sandstone with rare black shale. It is
300 metres thick. For this group, there is no formation name assigned.
Keuper Group This group is found everywhere along the transect and corresponds to
Upper Triassic and Lower Liassic evaporites (halite, anhydrite and gypsum) interbedded
with variegated marls, dolomite and polygenic breccias. It comprises three formations:
the Avensac Formation (Carnian, Norian and Rhaetian), Gypsiferous and saline shale
Formation (Carnian and Norian) and the Anhydrite Formation
(Hettangian/Sinemurian). These evaporites deposits are found deep in boreholes but
also in outcrops along thrust faults at the border between the NPZ and the Petites
Pyrenees.
Black Dolomite Group This unit comprises all Jurassic strata except the Lower Liassic
Anhydrite Formation. The description is subdivided into three parts:
- a] Liassic unit is found all along the transect. It is made of marls, marly
limestones and black shaly marls. Dolomite and limestones are also present at the base
of the Lias. Thickness can vary widely, between 40 and 300m in the platform and about
400 m thick in the NPZ and the Petites Pyrenees zone. Toarcian marls are the source
rock of the Saint-Marcet gas field (Biteau et al., 2006). There is no specific formation
name assigned for this group.

14
- b] Middle Jurassic: this unit is found along the whole segment except in the
northern part of the platform. It consists of dolomites and dolomitic breccias. The
thickness varies between about 130 m (NPZ) and 280 m in the southern part of the
platform. This is the equivalent of the Ossun Formation described by Biteau et al. (2006),
in the northeast of the Aquitaine basin.
- c] Upper Jurassic: strata of this age are found everywhere except in the northern
part of the platform. It consists of limestones, calcareous dolomite, and gray dolomitic
breccias in the Petites Pyrenees. Several formations are recognized : (i) Cagnotte
Formation (Lower Kimmeridgian) is made of fossil-rich dolomitic limestones
(Pseudoclammina jaccardi); (ii) Lons Formation (Upper Kimmeridgian) comprises
dolomitic limestones containing lots of fragments of shells; (iii) Mano Formation
(Tithonian), known as “Mano Dolomite”, is a grainstone dolomitic limestone; (iv)
“Breche de Garlin Formation” (top of Tithonian) consists of brecciated limestone (Biteau
et al., 2006). This Upper Jurassic unit is 830 m thick in the south of the platform and
about 400 m thick in the northern part. These deposits constitute the main reservoirs of
the Saint-Marcet gas field (Biteau et al., 2006). The fractured dolomites and limestones
are directly in contact with Toarcian source rock giving them an important role in the
Comminges petroleum system as a reservoir.
Figure 8: Schematic representation of (a) a carbonate platform with a barrier reef and (be) a ramp, showing the lithofacies associations used in this study for the construction of the chrono- and litho-stratigraphy

15
Figure 9: Chronostratigraphy of the study area

16
Miranda Limestone Group This group represents Neocomian ages (Berriasian to
Hauterivian). It is found in the NPZ where the Berriasian stage is missing; the whole
group is completely absent in the Petites Pyrenees, and is found again in the southern
part of the northern platform in two wells (MTG-1 and PO-101). This group consists of
fossil-rich limestones (characea, choffatella and annelids) with intercalations of
dolomitic limestone.
Sainte Suzanne Group is situated in the NPZ and the Petites Pyrenees but it is not present
on the platform. This group comprises Aptian and Lower Albian black marls and shaly
limestones, reef limestone (Upper Aptian, Cledes Fm) and fossil-rich limestone (Lower
Albian) (Toucasia, Florideae, Melobesia).
Black Flysch Group The ZNP contains undifferentiated Albo-Cenomanian marine clastic
deposits (marls alternating with breccias and sandstones). They are approximately two
kilometers thick. At the same time in the Aurignac region volcanism was very important
and widespread (Recurt Formation). Its thickness increases northwards, from about 300
meters in the anticline hinge to 700 meters in its northern flank, and can reach more
than 1 km near Saint-André (Fig.15). This magmatic episode ranges from Upper Albian
to Turonian, and can be divided into two phases (Tchimichkian, 1971): (i) a volcanic
phase is distinguished from Late Albian to Early Cenomanian and (ii) an intrusive phase
during Late Cenomanian and Turonian. The Recurt Formation consists of many different
black to purple rocks. They are described as syenites through to theralites, such as
ankaramites, diabases and picrites (Cavaillé & Paris, 1975). This important volcanic
body is probably responsible for the positive magnetic anomaly in Aurignac area
(Cavaillé & Paris, 1975).
Gray Flysch Group (Turonian-Santonian) This group is found in the Petites Pyrenees
only. It consists of marly limestone, muddy sandstone and breccias. Thickness of this
group is about a hundred metres excluding volcanism whose thickness can vary widely.
The Gensac Formation (Santonian) is made of coastal sandstones. This formation is the
equivalent of a formation described in the explanatory note of the Saint-Gaudens
geological map: the dark-coloured “Lower Flyschs Formation”.
Petites Pyrenees Group (Campanian to Maastrichtian) consists of the light-coloured
“Upper Flysch Formation” called in this area the Plagne Formation (Campanian to Lower
Maastrichtian) made of marls alternating with sandstones, rich in a variety of planktonic
foraminifera (globotruncana). This formation is present everywhere except in the
northern platform and its thickness varies from a few meters above the Black Flysch
Group between LA-2 and C-1 (Fig. 15) to more than 2400 metres in the Petites Pyrenees
(in the borehole A-4, fig.4) The top of the Plagne Formation comprises limestones and
forms the transition with the overlying Nankin Formation (Upper Maastrichtian) which
is made of massive slightly sandy limestone deposits, associated with fossil-rich marls
up to 150 m of thickness. This formation is mainly present in the Petites Pyrenees and in

17
the southern part of the northern platform. The Auzas Formation (Upper Maastrichtian)
is the youngest formation of the Upper Cretaceous and is mainly present in the northern
platform. It consists of 250 metres thick marine shaly marls associated with local
occurrences of continental facies.
Rieubach and Aude Valley groups (Paleocene) These groups are present both in the
Petites Pyrenees and the northern platform. Aude Valley Group (Danian & Selandian)
comprises the Esperaza Formation which is a continental formation, composed of
lacustrine limestone and dolomite (lacustrine gastropods), interbedded with variegated
marls. It is 130 m thick in the south and only 20 m thick in the north. Thanetian times
are represented by LeCarla Formation belonging to the Rieubach Group. Contrary to the
Aude Valley Group, this is a marine unit, particularly present in the south of the northern
platform (60 m thick) and in the Petites Pyrenees (from 100 to 250 m thick). It consists
of internal platform organism-rich sandy limestones and shaly sandstones (Miliolina,
Operculina). The top of Thanetian stage has a marine-continental transitional
sedimentation (Albas Formation), constituted of variegated marls with lignite
intercalations.
Coustouge Group (Lower Ilerdian) corresponds to an important marine transgression
and is widespread both in the north of the Petites Pyrenees and the south of the
northern platform. Its thickness rapidly decreases northward from 50 m to a few
meters. This group is subdivided into 3 formations. At the base lies Alveolina Limestone
Formation, composed of shaly limestones and sandy shales; it is characterized by the
Alveolina cucumiformis zone (Plaziat, 1981; Tambareau et al., 1995), Alveolina
ellipsoidalis (Serra-Kiel et al., 1998) and Operculina granulosa (Tambareau et al., 1995).
The Mancioux limestone Formation is located above and is composed of massive white
limestone with sand-rich intercalations; it is rich in various species such as Operculina,
Assilina, nummulites and algae. The Turitella Marls Formation constitutes the uppermost
formation but is rarely found along the section.
Carcassonne group (Upper Ypresian to Bartonian). Its base corresponds to the
appearance of detrital continental sediments recording the westward marine regression
(Cahuzac et al., 2005). It is found from the north of the Petites Pyrenees to Avensac. It is
made of two formations: (i) the Palassou Formation is mainly made of continental and
coarse detrital deposits such as red shale and conglomerates with calcareous pebbles
interbedded with yellowish sandstone layers. This formation passes laterally
northwards into (ii) the Lussagnet Sandstone Formation composed of azoic fine- to
coarse-grained sandstone, interbedded with variegated marls, and pebbles (Sztrakos,
1998). The Lussagnet Sandstone Formation is the coastal equivalent of the Palassou
Formation, which is considered to be the first significant contribution of the destruction
of the orogen to the foreland basin sedimentation (Cavaillé & Paris, 1975). The thickness
of this group does not exceed 70 metres and progressively decreases northwards.

18
Aquitaine group (Priabonian–Serravallian) This group comprises detrital continental
sediments extending from the northern part of the Petites Pyrenees to the northern part
of the platform. It includes also littoral to lagoon environment deposits (Sztrakos, 1998)
due to several Oligo-Miocene marine transgressions from the western Aquitaine basin
(Cahuzac et al., 2005). Thickness decreases northward from 900 m to a hundred metres.
It is mainly composed of variegated marls and shales, becoming sandy toward the north.
This group comprises several formations (Campagne Formation (Sztrakos, 1998),
Agenais Formation, Armagnac Formation…). Serravallian sedimentation seals the syn-
orogenic structures.
Main unconformities - a] In the northern platform, four main unconformities are recognized: one at
the base of Bartonian in the area of Castelsarrasin (fig.4) where fluvial
sediments directly lie on the basement in the borehole CS-101; one at the base
of Carcassonne Group in the south of the platform where the Coustouge Group
(Thanetian) is absent; the third main unconformity is seen in 5 wells at the
base of the Auzas Formation, and at the base of the Nankin Formation in AG-1.
The unconformity at the base of the Miranda Group (Valanginian) is found
near MTG-1 and PO-101 (fig.4).
- b] In the southern part of the Petites Pyrenees, sediments representing the
stages between Cenomanian and Tithonian are absent, thus a major
unconformity appears in the borehole C-1 where the Plagne Formation lies
directly above the Keuper Group; near Aurignac, sediments representing the
Hauterivian, Valanginian and Berriasian stages are missing.
- c] A progressive unconformity appears in the NPZ, near the NPFT where Albo-
Cenomanian deposits lie directly on Keuper Group and southwards at the
base of Aptian and Valanginian where Berriasian stage is not represented
(Miranda Limestone Group).
The lithostratigraphy (fig. 10) allows a quick overview of the thicknesses of the Groups
in boreholes. The reference level chosen is the base of Cenomanian in order to see the
evolution of thicknesses in the retro-foreland basin. In the NPZ and the Petites Pyrenees,
groups and lithologies represented are those described in boreholes. The complex
structure at depth will be represented further in the structural cross-section.
From this lithostratigraphy, we can see a migration of sedimentation northwards,
toward the foreland basin. We can also see that the major faults control the
sedimentation (NPFT and FPP and the normal fault to the south of the 0982-4-2
borehole). These lithostratigraphy and chronostratigraphy constitute the base for the
construction of the structural cross-section.

19
Figure 10: Lithostratigraphy of the study area

20
4. Interpretation of seismic data
Construction of a velocity model This task has been realized by three engineering students from the Ecole Nationale
Supérieure de Géologie (ENSG, Nancy, May 214). The first objective was to convert
scanned seismic lines provided by the BRGM into SEG-Y files, thanks to a MATLAB
program developed by the GOCAD team (ENSG). The second objective was to import
SEG-Y files into the geomodeling software GOCAD. It constitutes the basis of our work.
After importing these files in the software, they appeared georeferenced in space (UTM
coordinates). We also provided the students all the well data we had on our sections.
They used them to create vertical wells and deviated wells on GOCAD.
VSP (Vertical Seismic profile) data, sonic data and well logging constitutes very useful
data for the construction of the velocity model. Unfortunately in this case, well logs data
were not available, but the BRGM provided us VSP data. These velocities correspond to
well data and were integrated to calculate time-to-depth curves for all the wells. Then,
they interpolated all the vertical wells that allowed the creation of a 3D cube, which
constitutes the velocity model. This model is thus used to convert wells in depth into
wells in time.
Then they reported the top of all the groups (as defined previously) on each well as
horizon markers. This task is essential in order to interpret the seismic profile.
Seismic stratigraphy -A- (Fig. 11)
In the platform, the well AG-1 is the only well that is perfectly at the meeting point
between the cross-section and the seismic profile (Fig. 4). For that reason, we consider
the major horizons recognized cutting through this well are reliable. After projecting the
wells MTG-1 and PO-101 on the section too, the different horizons are followed from AG-
1 northwards. The first well-marked reflector (R1) corresponds to the top of the
Coustouge Group, as the sedimentation changes from continental to marine it may
imprint high velocities contrasts. Below R1, another well-defined reflector appear (R2)
and seem to coincide with marine sedimentation of Rieubach Group, since there are
alternating layers of limestones, shaly sandstones and variegated marls (Albas
Formation). Upper Cretaceous (Auzas Formation) is correlated to the third less-marked
reflector (R3). The Dogger and Keuper Group seem to be the last ones (respectively R4
and R5): they cross MTG-1 and we can follow those southwards to AG-1. In the absence
of boreholes reaching deeper layers, the top of the basement is guessed (R6). All the
horizons seem to dip slightly toward the southwest.

2 1
F i g u r e 1 1 : S e i s m i c p r o f i l e a n d i n t e r p r e t a t i o n i n t h e s t a b l e p l a t f o r m a r o u n d t h e b o r e h o l e A G - 1 . I t s h o w s t h e m a j o r r e f l e c t o r s
c o r r e s p o n d i n g t o t h e t o p o f s t r a t i g r a p h i c g r o u p s : R 1 ( C o u s t o u g e G r o u p ) ; R 2 ( R i e u b a c h G r o u p ) , R 3 ( P e t i t e s P y r e n e e s G r o u p ) ; R 4
( D o g g e r ) ; R 5 ( K e u p e r G r o u p ) ; R 6 ( B a s e m e n t ) ; R 7 ( C a r c a s s o n n e G r o u p )

22
-B- (Fig. 12)
The borehole MTG-1 is very close to the cross-section (Fig.4). The last group that is
reached is the Keuper Group at 3482 metres, equivalent to ~2.1 seconds. This area is
particular because of the presence of many erosional surfaces, extending on 7 kms
around MTG-1. The first one corresponds to the Carcassonne Group. This horizon is not
visible in AG-1 probably because the facies in this well are represented by marls. In
MTG-1, this group becomes sandier and thus makes contrast between the above shales
and marls (Aquitaine Group). This horizon (R7) dips towards the southwest with a
larger angle than the ones below and it cuts across small reflectors between the 47.5th
km and the 48th km. Between AG-1 and MTG-1, above R7 (Carcassonne Group) and
below the flat reflectors at ~1 second, the reflectors are curved on the edges and seem to
represent a sediment infill.
The second erosional surface is R1 (Coustouge Group) and cuts across many horizons
such as Rieubach and Aude Valley Groups, Petites Pyrenees Group and Miranda
Limestone Group between the 44.5th and the 47th km. Further towards the 49th km, the
flat horizons noticed previously dip towards the northeast and cut across small
reflectors. This is the third incision surface, extending over 1.5 km (R8). It becomes a
reflector lying conformably on the underlying horizons at ~50.5th km.
The northern part of the seismic profile reveals no major deformation. The different
horizons recognized are continuous and dip slightly towards the southwest. The Keuper
Group thickens near MTG-1. It must be noticed that the borehole PO-101 is situated 10
kms far from the profile. For that reason, the major reflectors marked on the section are
not necessarily found in the borehole. This is the case with the Coustouge and the
Rieubach Groups, visible on the seismic profile but not in the well. The spatial extension
of this marine transgression probably stopped between them.
-C- (Fig. 13)
The southern part of the platform and the relationship between the platform and the
Petites Pyrenees is recorded on the seismic profile. Indeed, each side of the thrust zone
is recognizable; the south-dipping PPF can be deduced from the blurred area. R1, R2, R3
and R4 define packages showing a thickening towards the thrust front. The same
reflectors are marked on the southern side of the front. The Carcassonne reflector (R7)
on the southern side of the PPF is the highest reflector which dips northwards and ends
on the thrust. Above it, remarkable reflectors are outlined. Packages of inclined lines
represent offlaps, revealing the growth of the thrust front, pushing northwards the
Aquitaine Group sedimentation. At 0.75 s, flat reflectors appear and make the transition
to a passive sedimentation: progressive onlaps cover the top of the Carcassonne Group.
They sealed the front activity.

23
Figure 12: Seismic profile and interpretation in the stable platform around the borehole MTG1. It shows the major reflectors corresponding to the top of stratigraphic groups: R1 (Coustouge Group, first erosional
surface); R2 (Rieubach Group), R3 (Petites Pyrenees Group); R4 (Dogger); R5 (Keuper Group); R6 (Basement); R7 (Carcassonne Group; second erosional surface); R8 (third erosional surface)
24
-E
The first second (in vertical scale) on the seismic profile is of good quality. The Saint-
André, Aurignac and Proupiary anticlines are recognized, as well as the Frechet syncline.
Structures at depth are blurred because of the deformation. Because of the lack of
visibility, this part of the section will be interpreted with borehole and surface data.
Figure 13: Seismic profile and interpretation in the stable platform around the Petites Pyrenees Front. It shows the major reflectors corresponding to the top of stratigraphic groups: R1 (Coustouge Group, first erosional surface); R2 (Rieubach
Group), R3 (Petites Pyrenees Group); R4 (Dogger); R5 (Keuper Group); R6 (Basement); R7 (Carcassonne Group). This figure shows the offlaps above the thrust front revealing the growth of the thrust, sealed by the passive onlaps. This is the
transition between the Petites Pyrenees and the stable platform.

2 5
F i g u r e 1 4 : S e i s m i c p r o f i l e a n d i n t e r p r e t a t i o n i n t h e s t a b l e p l a t f o r m i n t h e P e t i t e s P y r e n e e s I t s h o w s t h e m a j o r
r e f l e c t o r s c o r r e s p o n d i n g t o t h e t o p o f s t r a t i g r a p h i c g r o u p s : R 1 ( C o u s t o u g e G r o u p ) ; R 2 ( R i e u b a c h G r o u p ) , R 3 ( P e t i t e s
P y r e n e e s G r o u p ) ; R 7 ( C a r c a s s o n n e G r o u p ) . I t s h o w s t h e s u c c e s s i o n o f a n t i c l i n e s a n d s y n c l i n e s a n d t h e t r a n s i t i o n w i t h t h e s t a b l e p l a t f o r m b y t h e P e t i t e s P y r e n e e s F r o n t .

26
5. Balanced cross-section
A balanced cross-section was realized using surface data, seismic data and well
information. From the structural section, three zones showing different deformation
styles are identified. From south to north these are:
1] The NPZ (Fig. 15)
To the south, the Synclinal des Cabanes is a north-verging fold (Fig.5) showing steep
Black Dolomite and Saint-Suzanne Groups strata (up to 70°) revealing a complex
structure at depth, folded and faulted along a salt layer. Pre-Albian folding does not
correspond to the timing of deformation that is commonly accepted. Indeed,
compression is thought to have begun during Late Cretaceous. The folding could thus be
explained by salt diapirism that pushed the strata upwards. This is the explanation
chosen here; although it could also result from an extensional context (sliding tectonics)
as described by Lagabrielle et al. (2010).
The structure at depth of the Lôo anticline is constrained by the borehole LOO-1. It
successively crosses the Saint-Suzanne Group (200 m thick), the Black Dolomite Group
(Upper and the Middle Jurassic, 1200 m thick ), Keuper Group (Avensac Formation, 240
m thick), and the Black Dolomite Group (Dogger and Oxfordian, about 350 m thick). The
first 150 m of the Liassic unit belong to a normal series, the fold axial plane is recognized
at 2478 m deep and the series below are described reversed (Paris et al., 1971).
Regarding these observations and the dips at depth, we draw below the salt a north-
verging anticline. In this zone, it is impossible to evaluate the thickness of the salt as the
well does not reach the basement.
Further to the north, the Albo-Cenomanian turbiditic deposits (Black Flysch Group) are
restricted into a 5.5 km-large sub-basin bordered to the North by the NPFT. The
borehole PSI-1 crosses through this sub-basin the Black Dolomite Group and ends in the
Keuper Group. It is about 3.3 km thick. The Black Flysch Group sedimentation is
unconformably deposited above the south-dipping older series (Appendix 25, Paris et
al., 1971). This depocentre forms a north-verging monocline and contains lots of steeply
north-dipping (40 to 70°) tectonic breccias, composed of Paleozoic, Black Dolomite and
Saint Suzanne clasts (Paris et al., 1971). The well LA-2, which mainly encounters tectonic
breccias, reaches the basement at 2 km deep. This suggests that the basement is
probably involved in the deformation, thus the structural style is characterized by thick-
skinned structures. The top of LA-2 comprises a few meters of the Plagne Formation that
sealed the NPFT activity.
It must be noticed that the uppermost part of the Black Flysch sub-basin is hidden by
Quaternary alluvium so its northern boundary was initially placed arbitrarily. The
borehole C-1 cuts through 940 m of the Petites Pyrenees Group (Plagne Formation) and

27
Figure 15: Balanced cross-section along the studied transect

28
ends in the Keuper Group. There is no Black Flysch Group deposit in this borehole.
Consequently, this allows a little area to put the northern boundary of the sub-basin
between the wells LA-2 and C-1. Tectonic breccias are described at the base of the
Plagne Formation; this is why a fault probably crosses it.
Debroas (1990) describes the Albo-Cenomanian Bigorre (Appendix 26) sub-basin that is
equivalent to this Black Flysch sub-basin. The author outlines the presence of the north-
dipping tectonic breccias and the monocline. The author does not show the underlying
strata and the connection with the Petites Pyrenees.
2] The Petites Pyrenees (Fig.15)
The Petites Pyrenees represent the deepest depocentre along the studied transect and
extend for about 30 km in the NNE-SSW direction. Bounded by the NPFT to the south
and by the PPF to the north, it accumulated several thousand metres of Petites Pyrenees,
Rieubach and Aude Valley, Coustouge and Carcassonne Groups deposits lying in
kilometric SE-NW growth folds. The depocentre is affected by salt tectonics where salt
forms a diapir in Proupiary region and acts as a detachment level for the major thrust
faults. The northern part of this zone, near the borehole SA-1 and the PPF, is better
constrained by the seismic line (Fig. 13).
a- The synclinal de Latoue is visible in outcrop but disappears quickly under the
Miocene cover (Paris et al, 1971). On the geological map (Paris et al., 1971)
several triple points reveal the unconformity between the Aquitaine Group and
Paleocene (both the Rieubach and the Aude Valley Group) and the Petites
Pyrenees Group (Auzas and Nankin Formations). This is an asymmetrical fold; the
southern limb dips at 40-45° to the north and the northern limb dips at 30° to the
south. Its wavelength is 600 m and is 300 m in amplitude. This is consistent with
the interpretation of Paris et al. (1971).
b- The Proupiary anticline is described here by 4 boreholes (PR-1, PR-2, PR-3,
PR-4 (Fig.4, Appendices 17-20). It is a straight fold (Paris et al., 1971) with an
amplitude of 1.5 km and a half wavelength of 5.5 km. The dips at surface (10-15°)
are much shallower than those at depth (Paris et al., 1971). This is a growth fold
where lie the Petites Pyrenees, the Rieubach, the Aude Valley, the Coustouge and
the Carcassonne Groups. We observe variations of thickness: layers are thicker in
the synclines (more than 3000m in the Latoue & Frechet synclines) and thinner
in the Proupiary anticline (about 2300 m in PR-2). This means that the
sedimentation was syn-deformation.

29
Its structure has been well studied as it was the major gas field of the Comminges
basin. At depth it appears as a diapir. This part of our seismic profile is of bad-quality.
Our interpretation was only based on the 4 wells cited previously. PR-2 crosses the
Plagne Formation, the Grey Flysch Group and the Lower Jurassic, and this is the only
borehole that reaches the Keuper Group. PR-4 crosses the Plagne Formation, the Grey
Flysch Group and ends in the Upper Jurassic. PR-3 starts and ends in the Plagne
Formation. Some breccias are found at the base of the boreholes PR-2 and PR-4.
According to Fossen (2010), fractures at the top of a diapir are the consequence of
passive salt diapirism. The author presents the ideal evolution of a salt diapir (Fig. 16):
(i) Active (or reactive) diapirism starts during an extensional event; the thinning of the
crust allows the salt to migrate upwards;
(ii) As the sedimentation continues, the load applied on the salt becomes important and
the salt is forced to migrate. The diapirism is thus passive. During this step, the top of the
diapir is stretched and can break, leading to fractures. At that moment, the flanks of the
diapir are very steep.
Figure 16: Representation of the evolution of a salt diapir: reactive (active) diapirism during extension, passive diapirism when sediment load is important, the salt is thus forced to migrate (from Fossen, 2010)
30
Published cross-sections propose different interpretations of this area (Serrano
et al., 2006 (Appendix 27); Total, 1998 (Appendices 28-29), Bourrouilh et al., 1995
(Appendix 30)). The interpretation of Serrano et al. (2006) was based on seismic data
and an only well (PR-1). The interpretation of Total (1998) presents a squeezed diapir
with many fractures at the top and is very close to our interpretation. Bourrouilh et al.
(1995) studied the Saint-Marcet anticline constrained by 6 wells. It is the western
continuation of the Proupiary anticline. Their interpretation is very close to ours: it is a
squeezed diapir with many faults and breccias at its top, revealing the breakup of its
roof.
Jammes et al. (2010) study the interactions between salt and detachment faults in
a hyper-extensional context in the Parentis sub-basin (NW of the Aquitaine basin).
According to them, thick evaporite layer has a major control on the evolution of the
basin geometry. In our case study, we are aware of the importance of the salt tectonics, it
is very probable to have had huge amount of evaporite deposits (probably more than 2
km). Indeed, the salt diapir is sealed by the Grey Flysch Group. If we consider that the
active diapirism began during Early Jurassic until the Late Albian, the salt was reworked
during ~100 Ma and its thickness is apparently still important. This point will be
discussed in the chapter “7.Disucssion-Restoration”
c- Further to the north, the Aurignac anticline seems to be slightly north-verging. Three
boreholes are available (A-4, A-2, A-101). The borehole A-4 crosses the Rieubach and the
Aude Valley Groups (230 m), the Petites Pyrenees Group (2490 m), the Grey Flysch
Group (60 m), the Cenomanian volcanic deposits (460 m), the Sainte-Suzanne Group and
the Miranda Limestone Group (575 m) and ends in the Upper Jurassic. The borehole A-2
crosses the Petites Pyrenees Group (2255 m) and ends in the Grey Flysch Group. The
borehole A-101 presents stratigraphic repetitions: Petites Pyrenees Group and Grey
Flysch Group from the top of the well to 2815 m deep; the Plagne Formation between
2815 m and 3026 m deep, and the succession Petites Pyrenees-Grey Flysch Groups until
the base (4405 m deep). These repetitions are interpreted as thrusts, as shown on the
cross-section (Fig.15).
Heritier et al. (1998) (Appendix 31) present a structural cross-section of the
Aurignac anticline, based on the same three wells as us (A-4, A-2 and A-101). They place
a thrust between the wells A-4 and A-2 but they do not have any constrain. They want to
justify the fact that they do not find any Grey Flysch deposits at the base of A-2. In the
well description available on InfoTerre (Appendices 14-16), it is said that A-2 crosses
more than 500 m of Grey Flysch Group, including lots of volcanic deposits. Plus, we
consider that the thickness of volcanic deposits can vary widely so no thrust is needed.
They interpret the repetition of stratigraphic units in A-101 as a recumbent fold. In the
lithological descriptions, there is no evidence for the presence of reverse series; this is
why we interpret this as a second thrust crossing through A-101. Also, they continue the
thrust up to the Montian (Paleocene). In our cross-section we decide to seal it by the

31
Plagne Formation, according to the timing of the deformation described in Chapter “7.
Discussion- Sequential restoration and evolution of Pyrenean retro-foreland”.
According to the dips at surface, there is a syncline between the Aurignac and the
Saint-Andre anticlines. This has not been represented on the cross-sections from
Total (1998) (Appendices 28-29), where the Aurignac anticline is continuous
with the Saint-André anticline. In our representation, this south-verging syncline
is 2 km deep, consisting of the Petites Pyrenees Group, as well as the Paleocene
(both the Rieubach and the Aude Valley Groups), the Coustouge, the Carcassonne
and the Aquitaine Groups. It must be noticed that the thickness of the
Carcassonne Group increased a lot in the syncline axial plane. This means that the
sedimentation of this group occurred during the growth of the fold.
The Saint-Andre anticline is located at the northern border of the Petites
Pyrenees. It crosses all the groups from the Aquitaine Group to the Miranda
Limestone Group. The volcanic deposits are very important (1440 m thick).
The PPF presents a normal displacement at the base of the fault, and an inverse
displacement at the top. This sort of configuration is often seen in compressional
contexts where extensional faults are reactivated and inverted. The nod point is
the point where there is no displacement (Fig. 17):
Figure 17: Representation of an inverted normal fault. At the base of the fault the displacement is normal, at the top it is inverted. The nod point corresponds to zero displacement.

32
3] The platform (Fig. 15)
As the cross-section shows, the major features recognizable in this part of the transect
are the following:
-It is slightly deformed; the thickness of Carcassonne strata increased beyond the
Petites Pyrenees Front as well as the Aquitaine Group.
-As described with the interpretation of seismic data, there is a major unconformity
situated at the base of the Coustouge Group and two other erosional surfaces. There is
no evidence of this unconformity in literature. At first sight, it looks like an incisional
surface at the base of Ilerdian times, but this does not make sense as this was the onset
of a major transgression, recorded along the whole Aquitaine basin (Cahuzac et al.,
1995). Indeed, if we consider that this is an incision, it means that there was a forced
regression, the fall of the sea level led to the creation of an incised valley. Thus, this is
not consistent with a transgression. We propose that this geometry is a consequence of
the normal faults situated between MTG-1 and AG-1: this is confirmed by the sequences
found in the mini-graben.
-Plus, there is an important thickness variation of the Black Dolomite Group that is due
to the presence of a normal fault between PO-101 and 0982-4-2 that makes the Upper
Jurassic absent in the northern part of the platform.
6. Subsidence analysis
Sediment deposits record the variations of subsidence through time. A sedimentological
log is thus an essential tool to study the history of the subsidence.
The representation in time of the subsidence can be visualized on a geohistory plot.
This plot presents the vertical movements of a point of the basement as a function of
time in a fixed point of reference (Brunet, 1991). In order to calculate this depth, we
need to know the thicknesses, the ages and the lithologies of the sediments, as well as
their palaeobathymetry and the eustatic variations. Some parameters has a huge
influence on the subsidence, such as the palaeobathymetry which is directly related to
the type of sedimentation, and the eustatic variations that lead to variations of the
isostasic compensation.
A geohistory plot allows to quickly see the variations of subsidence rate. In this study
we calculate decompaction curves, the total subsidence and the tectonic subsidence (e.g.
without the effect of sediment load, eustasy and palaeobathymetry). Tectonic
subsidence represents the subsidence caused by deep tectonic events (Brunet, 1991).
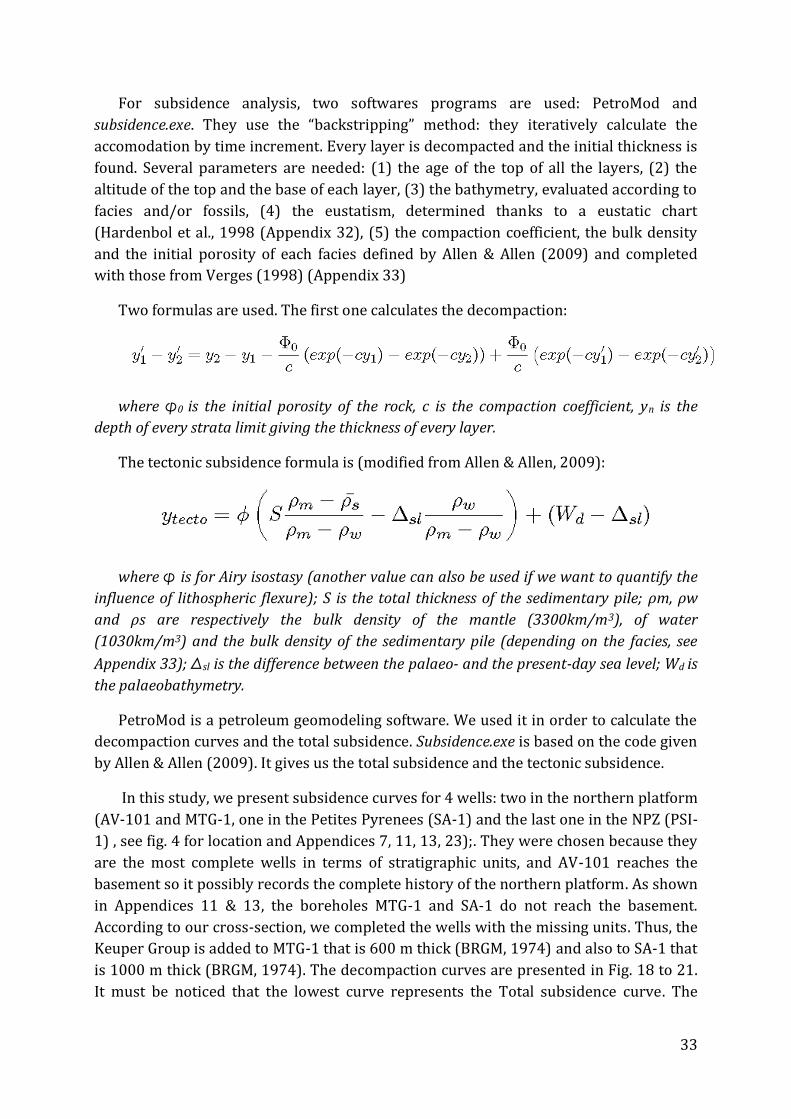
33
For subsidence analysis, two softwares programs are used: PetroMod and
subsidence.exe. They use the “backstripping” method: they iteratively calculate the
accomodation by time increment. Every layer is decompacted and the initial thickness is
found. Several parameters are needed: (1) the age of the top of all the layers, (2) the
altitude of the top and the base of each layer, (3) the bathymetry, evaluated according to
facies and/or fossils, (4) the eustatism, determined thanks to a eustatic chart
(Hardenbol et al., 1998 (Appendix 32), (5) the compaction coefficient, the bulk density
and the initial porosity of each facies defined by Allen & Allen (2009) and completed
with those from Verges (1998) (Appendix 33)
Two formulas are used. The first one calculates the decompaction:
where φ0 is the initial porosity of the rock, c is the compaction coefficient, yn is the
depth of every strata limit giving the thickness of every layer.
The tectonic subsidence formula is (modified from Allen & Allen, 2009):
where φ is for Airy isostasy (another value can also be used if we want to quantify the
influence of lithospheric flexure); S is the total thickness of the sedimentary pile; ρm, ρw
and ρs are respectively the bulk density of the mantle (3300km/m3), of water
(1030km/m3) and the bulk density of the sedimentary pile (depending on the facies, see
Appendix 33); Δsl is the difference between the palaeo- and the present-day sea level; Wd is
the palaeobathymetry.
PetroMod is a petroleum geomodeling software. We used it in order to calculate the
decompaction curves and the total subsidence. Subsidence.exe is based on the code given
by Allen & Allen (2009). It gives us the total subsidence and the tectonic subsidence.
In this study, we present subsidence curves for 4 wells: two in the northern platform
(AV-101 and MTG-1, one in the Petites Pyrenees (SA-1) and the last one in the NPZ (PSI-
1) , see fig. 4 for location and Appendices 7, 11, 13, 23);. They were chosen because they
are the most complete wells in terms of stratigraphic units, and AV-101 reaches the
basement so it possibly records the complete history of the northern platform. As shown
in Appendices 11 & 13, the boreholes MTG-1 and SA-1 do not reach the basement.
According to our cross-section, we completed the wells with the missing units. Thus, the
Keuper Group is added to MTG-1 that is 600 m thick (BRGM, 1974) and also to SA-1 that
is 1000 m thick (BRGM, 1974). The decompaction curves are presented in Fig. 18 to 21.
It must be noticed that the lowest curve represents the Total subsidence curve. The

34
calculation tables are presented in Appendices 34 to 37, and the respective subsidence
curves (total and tectonic) in Appendices 39 &40.
AV-101 (fig. 18)
Figure 18: Decompaction curves for the borehole AV-101, realized with PetroMod
This plot presents the decompaction curves for the borehole AV-101 situated in the
northern part of the platform. It shows four periods of rapid subsidence:
-Lower and Middle Trias: 300 m of subsidence (0.05 mm/yr) followed by a decrease of
subsidence until the Late Trias (0.006 mm/yr)
-Upper Trias to Lower Lias (Anhydrite Formation): this is the most rapid phase of
subsidence in this borehole. The subsidence rate is 0.07 mm/yr. From that time to Upper
Cretaceous, the subsidence rate is very low (0.001 mm/yr), it is not zero even though
this is a period of non-deposition.
-An acceleration of subsidence (0.1 mm/yr) is recorded in the Auzas Formation (Upper
Maastrichtian), and is followed by a quiescence phase in the Paleocene (Esperaza
Formation).
-The last phase of subsidence is recorded from Paleocene to Early Miocene times (0.06
mm/yr), during the sedimentation of the Carcassonne Group and the Aquitaine Group.
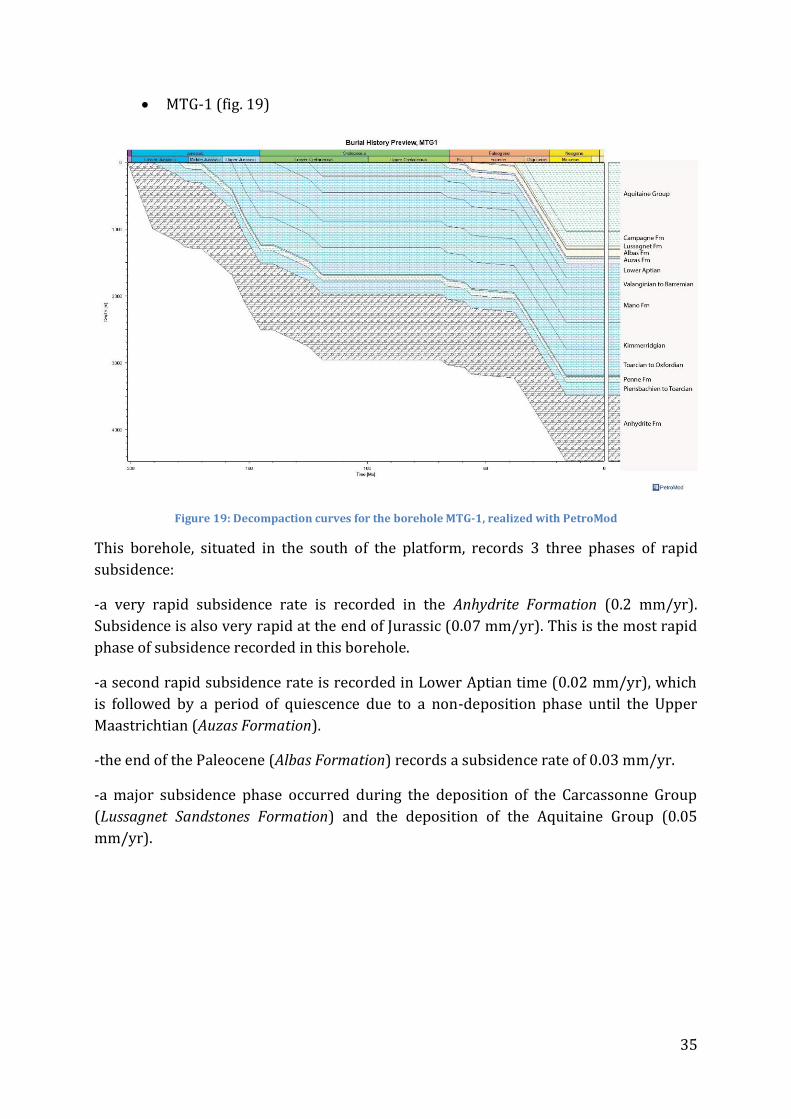
35
MTG-1 (fig. 19)
Figure 19: Decompaction curves for the borehole MTG-1, realized with PetroMod
This borehole, situated in the south of the platform, records 3 three phases of rapid
subsidence:
-a very rapid subsidence rate is recorded in the Anhydrite Formation (0.2 mm/yr).
Subsidence is also very rapid at the end of Jurassic (0.07 mm/yr). This is the most rapid
phase of subsidence recorded in this borehole.
-a second rapid subsidence rate is recorded in Lower Aptian time (0.02 mm/yr), which
is followed by a period of quiescence due to a non-deposition phase until the Upper
Maastrichtian (Auzas Formation).
-the end of the Paleocene (Albas Formation) records a subsidence rate of 0.03 mm/yr.
-a major subsidence phase occurred during the deposition of the Carcassonne Group
(Lussagnet Sandstones Formation) and the deposition of the Aquitaine Group (0.05
mm/yr).

36
SA-1 (fig. 20)
Figure 20: Decompaction curves for the borehole SA-1, realized with PetroMod
This borehole is located near the PPF in the Petites Pyrenees. It records four major
subsidence phases:
-the Lower Cretaceous (Aptian to Albian) reveals a subsidence rate of 0.03 mm/yr.
-a very rapid subsidence phase occurred during the appearance of the Recurt Formation
(volcanism) during Late Albian to Turonian (0.3 mm/yr);
-a major subsidence rate occurred during the deposition of the Grey Flysch Group (0.6
mm/yr).
-the last acceleration of the subsidence rate (0.06 mm/yr) occurred during Late
Paleocene (LeCarla Formation) following a short quiescence phase (Middle Eocene). The
end of the graph shows a relatively quiet subsidence until Early Miocene (Aquitaine
Group).

37
PSI-1 (fig.21)
Figure 21: Decompaction curves for the borehole PSI-1, realized with PetroMod
We did a last subsidence analysis on the borehole PSI-1 that is situated in the NPZ. It
records three main subsidence phases:
-the first phase occurred during Middle to Late Trias (0.06 mm/yr);
-the second acceleration of subsidence rate occurred during Early and Late Jurassic (0.4
mm/yr).
-the last major acceleration of subsidence occurred during the Late Cretaceous, at the
rate 0.04 mm/yr.
To summarize, in the platform there is an acceleration of subsidence during Trias and
Jurassic and Aptian, then another acceleration during the end of Maastrichtian (Auzas
Formation), and the final one occurred during the Late Eocene (Carcassonne Group and
Aquitaine Group). In the Petites Pyrenees, the major subsidence is related to the volcanic
episode, whereas in the NPZ major subsidence rates are recorded from Trias to the
Black Flysch deposition. The interpretation of these phases is discussed in the following
“Chapter 7: Discussion-Interpretation of subsidence history”

38
7. Discussion
Interpretation of subsidence history In order to easily compare the subsidence curves (fig. 18 to 21) and to evaluate the
differences of subsidence rates between the stratigraphic zones, we constructed two
graphs summarizing the total subsidence for the four wells (fig.22) and the tectonic
subsidence (Appendix 38). It must be noticed that the curves show a typical trend of
foreland basins, they are concave upwards (Sinclair & Naylor, 2008).
Figure 22: Summarizing plot of the total subsidence realized for 4 boreholes (AV-101, MTG-1, SA-1 and PSI-1) with subsidence.exe
The several accelerations of subsidence from Early to Late Trias are recorded in
the four wells. They mainly occurred during the deposition of the Avensac Formation and
the Anhydrite Formation. This is linked to the formation of several extensional basins,
due to movements between the Iberian and the European plates (Brunet, 1991). A
second acceleration of subsidence rate is seen during the Late Jurassic (Oxfordian to
Kimmeridgian) revealing the formation of the Aquitaine sub-basins with a N110 trend
(Brunet, 1991). These sub-basins are thought to have been created in a transpressional
context; this is also linked to the rotation between the two plates (Serrano et al., 2006).
A third acceleration of subsidence is seen in SA-1 and PSI-1 (in the Petites Pyrenees and
in the NPZ) from Aptian to Cenomanian. This is a major phase of distension recorded
along the whole basin and all the sub-basins underwent crustal thinning (Desegaulx &
-5500
-5000
-4500
-4000
-3500
-3000
-2500
-2000
-1500
-1000
-500
0
-280 -260 -240 -220 -200 -180 -160 -140 -120 -100 -80 -60 -40 -20 0
Dep
th (
m)
Time (Ma)
Total subsidence
AV-101
SA-1
PSI-1
MGT-1

39
Brunet, 1990). During that time, the wells in the platform do not show acceleration of
subsidence as there is a major unconformity at the base of the Auzas Formation. It shows
these basins were restricted to the southern part of the Aquitaine basin. The borehole
SA-1 is the only well that records the important extensional event during the Albo-
Cenomanian. It is also visible in PSI-I but at a smaller scale. This phase is well-known in
the Aquitaine basin because it led to the formation of Albo-Cenomanian basins in the
NPZ, infilled with turbiditic deposits and breccias (Debroas, 1990). Also, the volcanism
seen in the Comminges basin (Proupiary anticline) is considered to have appeared
during this time increment. This is due to an extreme crustal thinning (Jammes et al.,
2010; Lagabrielle et al., 2010).
The tectonic regime changed during Late Cretaceous, from an extension to
compression. In SA-1, only few subsidence is recorded. This can be correlated to the pre-
orogenic thermal subsidence period (Sinclair & Naylor, 2008). In this well, the total
subsidence sharply increased (0.6 mm/yr) at ~70Ma (Campanian). It is also recorded in
the borehole AV-101 with less intensity. This phase can be interpreted as either a
thermic subsidence or a flexural subsidence, as it corresponds to the onset of the
convergence between the Iberian and European plates. Moreover, the extreme crustal
thinning occurring during Albo-Cenomanian times may have heat the crust northwards
and led to a thermal re-adjustment during the Late Cretaceous. According to Sinclair et
al. (2005), Pyrenean compression began during the Campanian (~75Ma). This episode is
not seen on the subsidence curves, but the acceleration of the subsidence rates during
the Paleocene (Late Danian) seems to be related. A relatively low subsidence rate (not
null) occurred between Late Cretaceous and Early Paleocene. This is interpreted in
literature as a quiescence phase (Sinclair et al., 2005; Whitchurch et al., 2011). Indeed,
two wells (MTG-1 and SA-1) record this increasing rate of subsidence during Late
Paleocene. This can be interpreted as the formation of flexural basins and the inversion
of extensional faults (Sinclair et al., 2005).
MTG-1 records a last acceleration of subsidence rate the Priabonian (Late
Eocene). In our case study, this corresponds to the deposition of the upper part of the
Carcassonne Group, constituted of coarse detrital deposits. Moreover, we saw on the
cross-section between the Aurignac and the Saint-Andre anticlines an increasing of the
thickness of these sediments in a growth fold (Fig. 15). Thus, this acceleration of
subsidence can be the consequence of the major phase of compression that led to the
formation of the succession of anticlines and synclines in the Petites Pyrenees,
concomitant with a phase of flexural subsidence in the platform. The subsidence curve
for SA-1 does not show such a trend because it is situated in the Petites Pyrenees and
the flexural subsidence was mainly occurring in the Aquitaine platform. By these times,
the Petites Pyrenees were part of the thrust wedge.
According to Sinclair et al. (2005), the subsidence is considered to stop since the
Priabonian, as the retro-wedge thrust front activity ceased. In the case of AV-101 which

40
records sedimentation until Miocene, we can see that the subsidence rate is 0.06 mm/yr
so it is not null as predicted by authors.
Moreover, Naylor & Sinclair (2008) predict the non-migration of the
sedimentation in the retro-foreland basin, in contrast with the pro-foreland basin where
stratigraphic onlaps on the cratonic margin are described. They show a progressive
onlap cratonward at a rate of 5 mm/yr. In order to comment this proposition, we
evaluate the migration of sedimentation in the retro-foreland basin along the studied
transect. In our cross-section, there is no onlap on the cratonic margin, but there is slight
onlaps on pre-orogenic sequences: to the south of the well CDR-101, we can see the
Petites Pyrenees, the Rieubach and the Coustouge Group deposits making progressive
onlaps on the Jurassic substratum. Between the Petites Pyrenees and the Rieubach
Group we calculate a onlap propagation of 0.088mm/yr, and between the Rieubach and
Coustouge Group sediments a rate of 0.36 mm/yr. Thus, the onlap propagation rate
increased with time, as described by Sinclair et al. (2005). Although they are 1 or 2 order
of magnitude less, the propagation is not null and this contradicts their prediction. The
authors interpreted this increasing rate by a flexural component: they assume that as
the flexure is very important during the growth phase, the propagation of the cratonic
onlap is low. On the contrary, as soon as the flexure decreases, the stratigraphic onlaps
become more and more important and so the rate increases. The evolution we have
along the studied transect is similar but it is much smaller in scale.
Paleogeographic evolution Triassic and Liassic times were characterized by evaporitic to shallow marine deposits
where shallow carbonate platforms predominate. The thicknesses of these deposits are
homogeneous in the southern part of the Petites Pyrenees, and are thicker in the
platform. This shallow marine sedimentation is related to an extensional tectonics
leading to the opening to the West of the Atlantic Ocean (Brunet, 1991).
Variations in facies occurred during Early Cretaceous near the thrust front showing a
relative shallowing, as testified by fossil-rich reef facies (Aptian Urgonian limestones for
instance). The transition between Albian and Cenomanian is marked by marine clastic
sedimentation (Albo-Cenomanian sedimentation). At the same time, the considerable
thickness of volcanism (Recurt Formation) deposited in the north of the Petites Pyrenees
must be noted. This is probably related to an extreme crustal extension event
(Choukroune, 1976; Jammes et al., 2010; Lagabrielle et al., 2010). Late Cretaceous
sedimentation is predominantly present south to the PPF and shows a progressive
shallowing, from the turbidites deposits (Plagne Formation) to shallow marine (Nankin
Formation) and marine-continental transitional sedimentation (Auzas Formation). As
the Pyrenean chain grew during the Cenozoic, conditions became continental except for
Late Paleocene and Ilerdian marine transgressions. Variations in thicknesses, facies and
spatial distribution of deposits are related to an increase in tectonic activity which is

41
marked by the first contribution of the chain’s uplift and erosion during Middle Eocene
(Palassou Formation and Lussagnet Sandstone Formation), and extends to Miocene. Syn-
growth folds are sealed by the post-orogenic Aquitaine Group.
Sequential restoration and evolution of Pyrenean retro-foreland basin The studied transect has been sequentially restored into four steps in order to estimate
the amount, timing and distribution of shortening due to Pyrenean compression within
the retro-foreland basin. It also allows to understand the current structural geometries,
their relationship with sedimentation and their inheritance from Mesozoic extensional
phases. The major role of Keuper evaporite diapirism and its crucial control on the
distribution of deformation will also be discussed. Constrained by detailed stratigraphic
geometries, the method used consists in restoring step by step the structures and
evaluate the timing of their activity and their influence on the basins; from a pin-line
situated in the south of the non-deformed platform (see Fig.15 for the location of the
pin-line). As salt diapirism is present in the studied zone, the strain can be concentrated
over a large area. The thicknesses of the units near the salt structures can thus vary
along the transect as well as the thickness of the salt, which is very ductile. The
restoration of the pre-orogenic state is shown by two stages, the third one is an
intermediate stage and the last one represents the first state of orogeny (fig. 23 a-e).
The pre-orogenic stage corresponds to Apto-Lower Albian times (fig. 23e). Three
mini-basins are distinguished along ~45 km from south to north. They are separated by
three diapirs. The southernmost diapir was very thick and evolved along a south-
dipping normal fault that was the precursor of the northern margin of the Black Flysch
basin. This fault took its origin in the basement. On both sides of this diapir, thicknesses
of the Black Dolomite Group varied; they were thicker on the southern side. This
indicates that diapirism was active from Early Jurassic, and as the salt moved upwards,
the strata were tilted and slightly folded. At that time, the crystalline basement was 3 km
deep. The southernmost mini-basin comprised a very thick Apto-Lower Albian sequence
(probably more than 4 km thick), overlying the Miranda Limestone and Black Dolomite
deposits. The central mini-basin comprised thinner layers pinching out along the flanks
of the diapirs. The third mini-basin had a similar shape, with longer strata. The down-
dipping strata along the northernmost diapir are typical of a turtle-back structure,
revealing the collapse of the diapir. The growth of this diapir was facilitated thanks to a
south-dipping normal fault, taking its origin in the Keuper Group. This fault was the
precursor of the Petites Pyrenees Front. To the north, strata were straight and there was
no sedimentation of the Miranda Limestone and Sainte-Suzanne Groups. The top of
Apto-Lower Albian represents a major erosional stage.
The second stage (fig. 23d) shows the architecture at the end of Upper Albian-
Cenomanian. It is characterized by the development of a 15 km-wide Black Flysch basin.
This step corresponds to a major extensional stage. To the south, the normal fault led to
the sliding of the underlying strata. As the extension continued, the basement was

42
Figure 23: Sequential restoration of the balanced cross-section (see Fig. 15) into four steps. The shortening between the end of Apto-Lower Albian and the present section is estimated at 22%.

43
pushed upwards and reached the surface as well as the overlying deposits. It was drew
considering a ratio of 2 to 1 (the length of the basin margin is twice as big as the
overhanging block length, fig. 24).
Figure 24: Schematic representation of the ratio used (2:1) to construct the overhanging block in the construction of the restoration (second step) , where “x” is the length of the basin margin.
Consequently, the erosion of the overhanging block filled the northern margin of the
newly-formed basin in breccias made of Paleozoic to Lower Albian clasts. They are thus
south-dipping. Also, the sliding caused the decrease in thickness of the salt; the dips of
the strata below this basin were less steep than in the previous stage and their folding
increased. A second smaller normal fault was formed to the south of the major normal
fault and it appeared at the base of the Albo-Cenomanian basin. To the north along the
second major normal fault, extension led to the sliding of the strata above the salt diapir.
It must be noticed that this step is marked by the onset of extrusive volcanism (Recurt
Formation, Cenomanian time). The hyper-extensional context caused the extreme
thinning of the crust and promoted magmatic ascents along normal faults.
Figure 23c shows the transition between the extension and the onset of the
compression. After the erosion of the overhanging block, the Grey Flysch sediments
deposited over the whole area. They lied unconformably on the underlying strata.
Constrained by well descriptions, the thickness of this Group is thicker to the south than
in the north. We interpreted this as a thermal subsidence stage, leading to a slight
flexure of the southern part of the transect. To the north, the Grey Flysch sedimentation
made a progressive unconformity upon the Upper Jurassic strata. At this time, the
volcanism at the north of the restored cross-section became intrusive (Turonian time),
and thickened the overall Recurt Formation.
The fourth stage corresponds to the onset of the convergence (fig. 23b). This
stage represents the top of the Plagne Formation (Campanian-Lower Maastrichtian
time). To the south, the major normal faults were inverted and are at this stage the NPFT
and the PPF. In the southern part of the transect, the strata above the NPFT (from Black
Dolomite to Grey Flysch sediments) were tilted, and their folding is accentuated.
Consequently, the Apto-Lower Albian basin, the Black Flysch basin and the Grey Flysch
deposits were eroded (1.5 km), as none of these sediments are found at present-day in
this area. The convergence caused also the tilting of the basement, which from that time
is pushed by the NPFT and it started to push the mini-basin sedimentation northwards,
acting as bulldozer. The major diapir (in the future Proupiary anticline) started to be
squeezed. On the both sides of the NPFT, the salt migrated downwards and its thickness

44
decreased. This stage shows the beginning of the formation of the flexural basin, filled by
the Plagne Formation. The blind thrust fault is sealed by these sediments that deposited
onlapping onto the Black Flysch basin. The newly-formed flexural basin was well-
delimited to the south (NPFT) and the north (FPP), and the biggest flexure occurred in
its southern part. Thus, the Plagne Formation is thicker to south of the main diapir (~3.5
km) and thinner northwards (~2.5 km). To the north, the sedimentation prograded
progressively upon the Grey Flysch deposits and extends 5 km further to the north than
these sediments.
This sequential restoration shows that the deposits are slightly folded at the end
of the Maastrichtian, but the main folding episode occurred after this phase. The main
compressional phase seems to have occurred during Early Eocene until Late Eocene
revealed by the thickening of the Carcassonne Group between the Aurignac and the
Saint-Andre anticlines. Also, the stratigraphic repetitions seen in the borehole A-101
(fig. 15) are caused by a reverse fault appeared after the Plagne Formation
sedimentation. The Quaternary erosion is estimated between 700 and 750 m
(calculated from fig. 15).
By comparison between the first stage (Apto-Lower Albian, Fig. 23e) and the
present day section (Fig. 23a), the shortening is calculated to be ~9.25 km, which
represents 22% of the undeformed length. The major part of the shortening is attributed
to the NPFT (~5.65 km), the displacement due to the PPF is much lower (1.8 km) and 1.8
km can be ascribed to the thrust between them affecting A-101. It is important to
remember that these values do not represent the total shortening of the Pyrenean chain;
it only concerns the retro-foreland basin from the northern part of the NPZ.

45
8. Conclusion
The aim of this work was to use the Central Aquitaine basin as a detailed case study,
in order to estimate the amount, timing and distribution of shortening due to Pyrenean
compression within the retro-foreland basin. We show along the studied transect that
there are three zones with different deformation style. To the south, the NPZ records the
pre-orogenic history, from Trias to Lower Albian. It presents a pre-orogenic folding and
a major discordance at the base of the Upper Albian. The Petites Pyrenees are bordered
to the north by the PPF which controlled its sedimentation. They contain the whole
stratigraphic series, from Trias to the Aquitaine Group. The northern platform is slightly
deformed.
Thanks to the sequentially restoration, we outline several points: (i) inherited
structures from Mesozoic extensional phases have a major role on the mechanics of
deformation; (ii) the major faults (extensional and then inverted NPFT and PPF)
controlled the sedimentation since the Early Mesozoic; (iii) the salt has a major role in
the deformation: active salt diapirism from Jurassic separated several min-basins and
several faults, such as the PPF, took their origin in the Keuper group.
The shortening is estimated at 22%, equivalent to 9.25 km, from the northern part of
the NPZ to the south of the stable platform.
The chronology of the deformation was constrained thanks to the sequential
restoration and the subsidence curves: the Trias and the Jurassic corresponded to
extensional phases as the west of the Atlantic ocean opened. A major extensional phase
is recorded since the Aptian until the Cenomanian, leading to the deposition of deep
basins and to extrusive volcanism. From the Turonian until the Santonian, this is
probably a thermal subsidence phase, the south of the studied transect sagged slightly
downwards. This phase has also probably a flexural component, but the major onset of
flexural phase occurred during the Upper Cretaceous and more particularly during the
Petites Pyrenees Group (Plagne Formation). This is the beginning of the creation of the
flexural basin. The subsidence rate, which is not important during this stage, increased
during the Late Paleocene, revealing the creation of the flexural basin (Petites Pyrenees).
The Late Eocene is also marked by a high subsidence rate, which has been interpreted as
a major deformation stage, during which the folding seen in the Petites Pyrenees
occurred. We also outlined the timing of the main faults: the NPFT activity is sealed by
the Plagne Formation whereas the PPF activity is sealed by the Aquitaine Group. This
shows that the deformation propagated northwards with time. Moreover, we were able
to calculate onlap propagation rate in the northern platform showing a slight migration
of the sediments northwards over pre-orogenic sequences. Thus the retro-foreland
basin is not static, by contrast with the proposition of Sinclair & Naylor (2008).

46
9. References
Allen PA, Allen JR (2009) Basin Analysis. Principles and Applications. Blackwell
Publishing. London, 549p
Baby P, Crouzet G, Specht M, Deramond J, Bilotte M, Debroas EJ (1988) Rôle des paléo-
structures albo-cénomaniennes dans la géométrie des chevauchements frontaux nord-
pyrénéens. C.R Acad. Sci. Paris, 306(II) 307-313
Barnolas A, Guérangé B, Chiron JC, Courbouleix S, coord. (unpublished) Synthèse
Géologique et Géophysique des Pyrénées. Cycle alpin. Volume 2, 946p
Beaumont C, Munoz JA, Hamilton J, Fullsack P (2000) Factors controlling the Alpine
evolution of the central Pyrenees inferred from a comparison of observations and
geodynamical models. Journal of Geophysical Research. 105:8121-8145
Biteau JJ, Le Marrec A, Le Vot M, Masset JM (2006) The Aquitaine Basin. Petroleum
Geosciences, Vol. 12, pp 247–273
Bourrouilh R, Richert JP, Zolnai G (1995) The North Pyrenean Aquitaine Basin, France.
American Association of Petroleum Geologists Bulletin. 79 (6), pp 831-853
BRGM, Elf-Re, ESSO-REP, SNPA (1974) Géologie du Bassin d’Aquitaine. Atlas, 27 pl.
Editions du Bureau de Recherches Géologiques et Minières, Orléans
Brunet MF (1991) Subsidence et géodynamique du Bassin d’Aquitaine ; relations avec
l’ouverture de l’Atlantique. Thèse de doctorat d’état, Université Pierre et Marie Curie,
Paris, 91-8 :288p
Cahuzac B, Janin MC, Steurbaut E (1995) Biostratigraphie de l’Oligo-Miocène du bassin
d’Aquitaine fondée sur les nannofossiles calcaires. Implications paléogéographiques.
Géologie de la France, 2 :57-82
Cavaillé A (1968) Notice explicative. Carte géologique de la France (1/50 000). Feuille
Beaumont-de-Lomagne (955), 8p
Cavaillé A (1969) Notice explicative. Carte géologique de la France (1/50 000). Feuille
Gimont (982), 7p
Cavaillé A (1970) Notice explicative. Carte géologique de la France (1/50 000). Feuille
Lombez (1008), 7p
Cavaillé A, Paris JP (1975) Notice explicative. Carte géologique de la France (1/50 000).
Feuille Fousseret (1033), 25 p

47
Choukroune P (1976) Structure et évolution tectonique de la zone nord-pyrénéenne.
Analyse de la déformation dans une portion de chaîne à schistosité sub-verticale. Mém.
Soc. Géol. Fr, 127:116 p
Debroas EJ (1990) Le flysch noir albo-cénomanien témoin de la structuration albienne à
sénonienne de la Zone nord-pyrénéenne en Bigorre (Hautes-Pyrénées, France). Bull. Soc.
Géol. France, (8), VI, n°2, pp 273-285
Desegaulx P, Brunet MF (1990) Tectonic subsidence of the Aquitaine basin since
Cretaceous times. Bull. Soc. Géol. France, (8), VI, 2:295-306
Ferrer O, Jackson MPA, Roca E, Rubinat M (2012) Evolution of salt structures during
extension and inversion of the Offshore Parentis Basin (Easter Bay of Biscay). Salt
Tectonics, Sediments and Prospectivity. Ed. ALSOP. Geological Society, London Special
Publications, 363:361–379. doi: 10.1144/SP363.16
Fossen H (2010) Structural geology. Cambridge University Press, United Kingdom, p463
Haq BU, Hardenbol J, Vail PR (1987) Chronology of fluctuating sea levels since the
Triassic (250 million years ago to present). Science, 235:1156-1167
Hardenbol J, Thierry J, Farley MB, Jacquin T, de Graciansky PC, Vail PR (1998) Mesozoic
and Cenozoic Sequence Chronostratigraphic Framework of European Basins. Mesozoic
ans Cenozoic Sequence Stratigraphy of European Basins, SEPM Special Publication 6
Heritier F, Nicolai R, Ricateau R, Villemin J (1972) Les chevauchements frontaux nord-
pyrénéens entre l’Ariège et l’Adour (Pyrénées centrales). C. R. Ac. Sc. Paris. Série D, t.275,
pp1533-1736
Jammes S, Manatschal G, Lavier L (2010) Interaction between prerift salt and
detachment faulting in hyperextended rift systems: the example of the Parentis and
Mauléon basins (Bay of Biscay and western Pyrenees). AAPG Bulletin, 94, n°7, pp 957-
975. doi :10.1306/12090909116
Lagabrielle Y, Labaume P, de Saint Blanquat M (2010) Mantle exhumation, crustal
denudation, and gravity tectonics during Cretaceous rifting in the Pyrenean realm (SW
Europe): Insights from the geological setting of the lherzolite bodies. Tectonics, 29,
tc4012, doi:10.1029/2009tc002588
Munoz JA (1992) Evolution of a continental collision belt: ECORS-Pyrenees crustal
balanced cross-section. In McClay K: Thrust tectonics. London. Chapman and Hall, pp
235-246
Naylor M, Sinclair HD (2008) Pro- vs. retro-foreland basin. Basin Research 20:285–303.
doi: 10.1111/j.1365-2117.2008.00366.x

48
Paris JP, Appert G, Bugnicourt D, Carbonnier A, Dumon E, Gorce P, de Jekhowski B,
Michel P, Nougarède G, Ricateau R, Saint-Martin L, Thibaut P, Thyssen B (1971) Notice
explicative. Carte géologique de la France (1/50 000). Feuille Saint-Gaudens (1055) 23p
Paris JP, Icole M, Tegyey A, Monciardini C, Andreieff P (1976) Notice explicative. Carte
géologique de la France (1/50 000). Feuille Montréjeau (1056). Ed. BRGM, 25 p
Plaziat JC (1981) Late Cretaceous to Late Eocene Paleogeographic evolution of
Southwest Europe. Palaeoclimatol., Palaeoecol., 36:263-320
Serra-Kiel J, Hottinger L, Caus E, Drobne K, Ferrandez C, Jauhri AK, Less G, Pavlovec R,
Pignatti J, Samso JM, Schaub H, Sirel E, Strougo A, Tambareau Y, Tosquella J, Zakrevskaya
E (1998) Larger foraminiferal biostratigraphy of the Tethyan Paleocene and Eocene.
Bull. Soc. Géol. France. 169(2) :281-299
Serrano O, Delmas J, Hanot F, Vially R, Herbin JP, Houel P, Tourliere B (2006) Le Bassin
d’Aquitaine : valorisation des données sismiques, cartographie structurale et potentiel
pétrolier. Ed. BRGM, 245 p
Sinclair HD, Gibson M, Naylor M, Morris RG (2005) Asymmetric growth of the Pyrenees
revealed through measurement and modeling of orogenic fluxes. American Journal of
Science, 305:369–406
Sinclair HD, Naylor M (2012) Foreland basin subsidence driven by topographic growth
versus plate subduction. Geological Society of America Bulletin 124(3-4):368-379. doi:
10.1130/B30383.1
Sztrakos K, Gély JP, Blondeau A, Muller C (1998) L’Eocène du Bassin sud-aquitain :
lithostratigraphie, biostratigraphie et analyse séquentielle. Géologie de la France, 4 :57-
105
Tambareau Y, Crochet B, Villatte J, Deramond J (1995) Evolution tectono-sédimentaire
du versant nord des Pyrenees centre-orientales au Paléocène et à l'Eocène inférieur.
Bull. Soc. Géol. France, 166(4):375-387.
Tchimichkian G (1974) L’activité magmatique dans le Crétacé traversé en sondages au
Nord de Saint-Gaudens. C. R. Congrès National des Sociétés Savantes. Section des
Sciences. Géologie, minéralogie 96(2):171-178
Verges J (1998) Quantified vertical motions and tectonic volution of th SE Pyrenean
foreland basin. Geological Society Special Publications 134:107-134
Verges J, Fernandez M (2012) Tethys-Atlantic interaction along the Iberia-Africa plate
boundary: The Betic-Rif orogenic system. Tectonophysics 579:144-172

49
Whitchurch AL, Carter A, Sinclair HD, Duller RA, Whittaker AC, Allen PA (2011)
Sediment routing system evolution within a diachronously uplifting orogen : Insights
from detrital zircon thermochronological analyses from the south-central Pyrenees.
American Journal of Earth Science 311:442-442

50
10. Appendices
List of Appendices
1- Boreholes listed according to their locality (number and name of the geological maps
(1/50 000)
2- Lexicon
3- Location of the 6 cross-sections of the PYRAMID team
4- Legend & Lithostratigraphic log and detailed summary table for the borehole LF-1
5- Lithostratigraphic log and detailed summary table for the borehole CS-101
6- Lithostratigraphic log and detailed summary table for the borehole CS-102
7- Lithostratigraphic log and detailed summary table for the borehole AV-101
8- Lithostratigraphic log and detailed summary table for the borehole CDR-101
9- Lithostratigraphic log and detailed summary table for the borehole 0982-4-2
10- Lithostratigraphic log and detailed summary table for the borehole PO-101
11- Lithostratigraphic log and detailed summary table for the borehole MTG-1
12- Lithostratigraphic log and detailed summary table for the borehole AG-1
13- Lithostratigraphic log and detailed summary table for the borehole SA-1
14- Lithostratigraphic log and detailed summary table for the borehole A-101
15- Lithostratigraphic log and detailed summary table for the borehole A-2
16- Lithostratigraphic log and detailed summary table for the borehole A-4
17- Lithostratigraphic log and detailed summary table for the borehole PR-3
18- Lithostratigraphic log and detailed summary table for the borehole PR-4
19- Lithostratigraphic log and detailed summary table for the borehole PR-1
20- Lithostratigraphic log and detailed summary table for the borehole PR-2
21- Lithostratigraphic log and detailed summary table for the borehole C-1
22- Lithostratigraphic log and detailed summary table for the borehole LA-2
23- Lithostratigraphic log and detailed summary table for the borehole PSI-1

51
24- Lithostratigraphic log and detailed summary table for the borehole LOO-1
25- Structural cross-section of the south of the Petites Pyrenees and the northern part of
the NPZ (Paris et al., 1971)
26- Structural cross-section of the NPZ (Debroas 1990)
27- Interpreted seismic cross-section (Serrano et al. 2006)
28- Structural cross-section of the NPZ, the Petites Pyrenees and the south of the
platform (Total, 1998, n°13)
29- Structural cross-section of the NPZ, the Petites Pyrenees and the south of the
platform (Total, 1998, n°14)
30- Structural cross-section of the Petites Pyrenees (Bourrouilh 1995)
31- Structural cross-section of the Aurignac anticline (Heritier et al. 1972)
32- Eustatic chart used for the calculation of subsidence (Hardenbol et al., 1998)
33- Coefficients used for the calculation of subsidence (from Vergès (1998) and Allen &
Allen (2009))
34- Calculation table used for the construction of the subsidence curves for the borehole
AV-101
35- Calculation table used for the construction of the subsidence curves for the borehole
MTG-1
36- Calculation table used for the construction of the subsidence curves for the borehole
SA-1
37- Calculation table used for the construction of the subsidence curves for the borehole
PSI-1
38- Summarizing plot of the tectonic subsidence realized for the boreholes AV-101,
MTG-1, SA-1 and PSI-1 with the software subsidence.exe
39- Subsidence curves pour the boreholes AV-101 and SA-1
40- Subsidence curves pour the boreholes PSI-1 and MTG-1
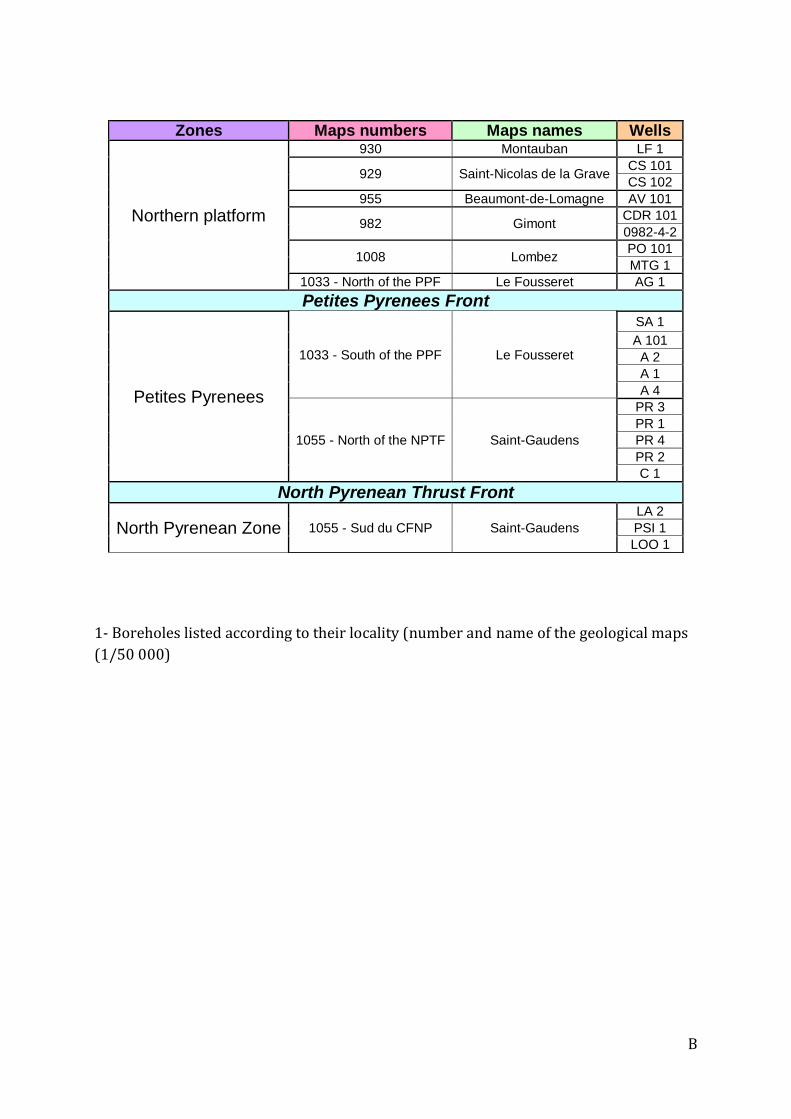
B
1- Boreholes listed according to their locality (number and name of the geological maps
(1/50 000)
Zones Maps numbers Maps names Wells
Northern platform
930 Montauban LF 1
929 Saint-Nicolas de la Grave CS 101
CS 102
955 Beaumont-de-Lomagne AV 101
982 Gimont CDR 101
0982-4-2
1008 Lombez PO 101
MTG 1
1033 - North of the PPF Le Fousseret AG 1
Petites Pyrenees Front
Petites Pyrenees
1033 - South of the PPF Le Fousseret
SA 1
A 101
A 2
A 1
A 4
1055 - North of the NPTF Saint-Gaudens
PR 3
PR 1
PR 4
PR 2
C 1
North Pyrenean Thrust Front
North Pyrenean Zone 1055 - Sud du CFNP Saint-Gaudens
LA 2
PSI 1
LOO 1

C
3- Location of the 6 cross-sections of the PYRAMID team

D
4- Legend & Lithostratigraphic log and detailed summary table for the borehole LF-1

E
4- Legend & Lithostratigraphic log and detailed summary table for the borehole LF-1

F
5- Lithostratigraphic log and detailed summary table for the borehole CS-101

G
6- Lithostratigraphic log and detailed summary table for the borehole CS-102

H
7- Lithostratigraphic log and detailed summary table for the borehole AV-101

I
8- Lithostratigraphic log and detailed summary table for the borehole CDR-101

J
9- Lithostratigraphic log and detailed summary table for the borehole 0982-4-2
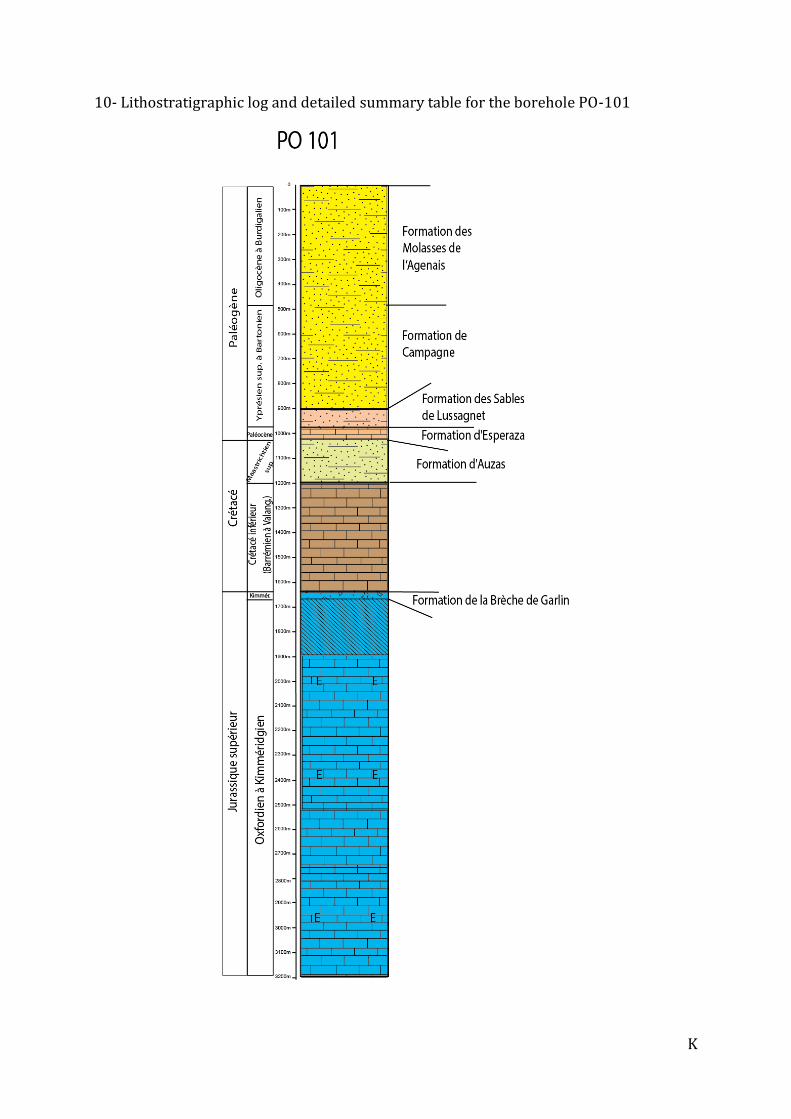
K
10- Lithostratigraphic log and detailed summary table for the borehole PO-101
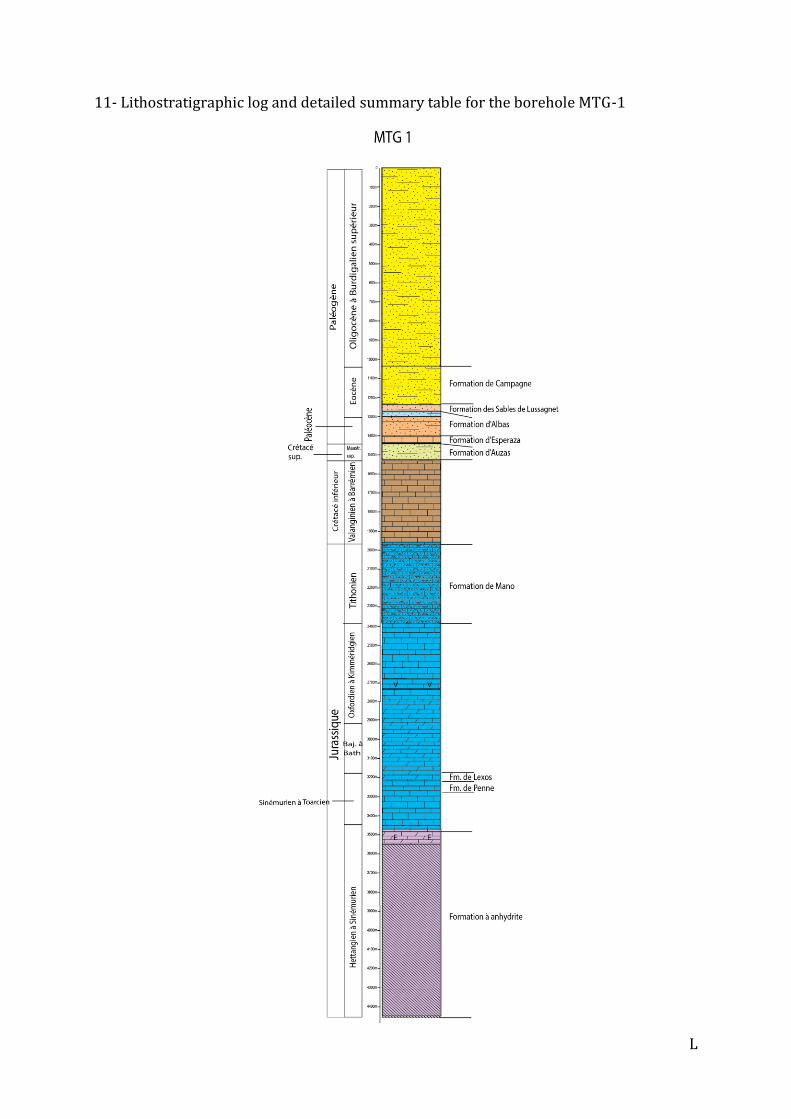
L
11- Lithostratigraphic log and detailed summary table for the borehole MTG-1

M
12- Lithostratigraphic log and detailed summary table for the borehole AG-1

N
13- Lithostratigraphic log and detailed summary table for the borehole SA-1

O
14- Lithostratigraphic log and detailed summary table for the borehole A-101

P
16- Lithostratigraphic log and detailed summary table for the borehole A-4

Q
17- Lithostratigraphic log and detailed summary table for the borehole PR-3

R
20- Lithostratigraphic log and detailed summary table for the borehole PR-2
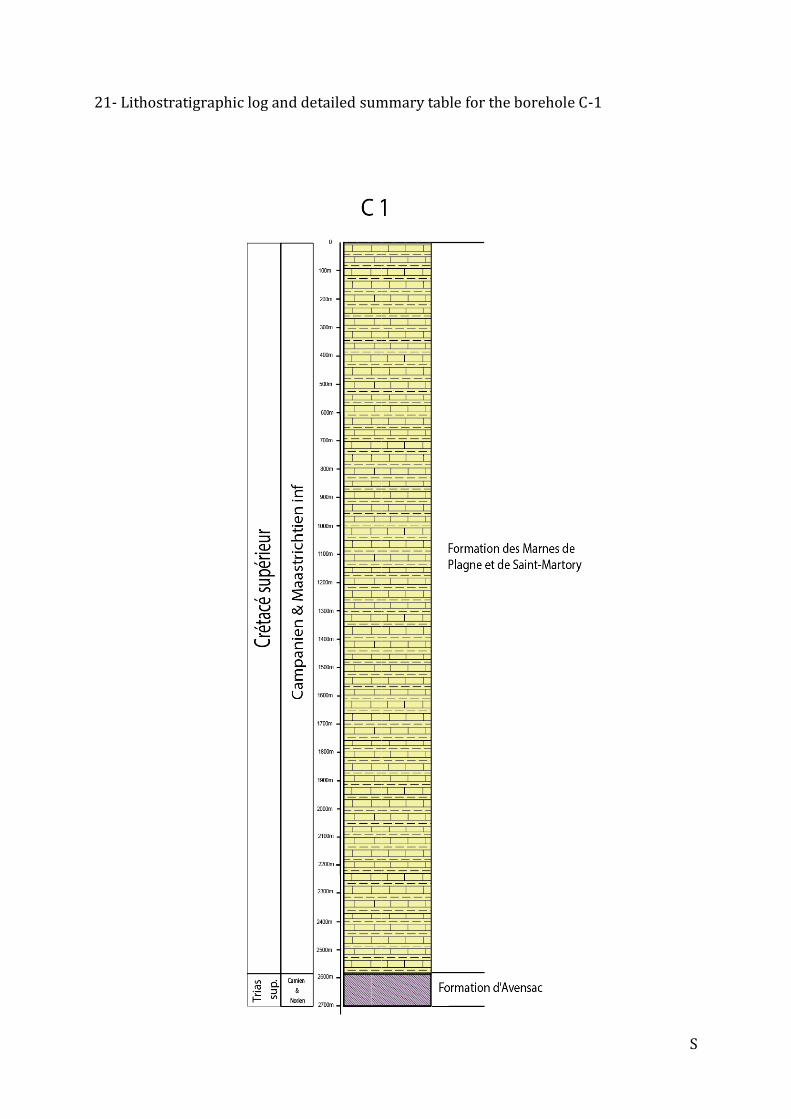
S
21- Lithostratigraphic log and detailed summary table for the borehole C-1

T
22- Lithostratigraphic log and detailed summary table for the borehole LA-2

U
23- Lithostratigraphic log and detailed summary table for the borehole PSI-1

V
24- Lithostratigraphic log and detailed summary table for the borehole LOO-1
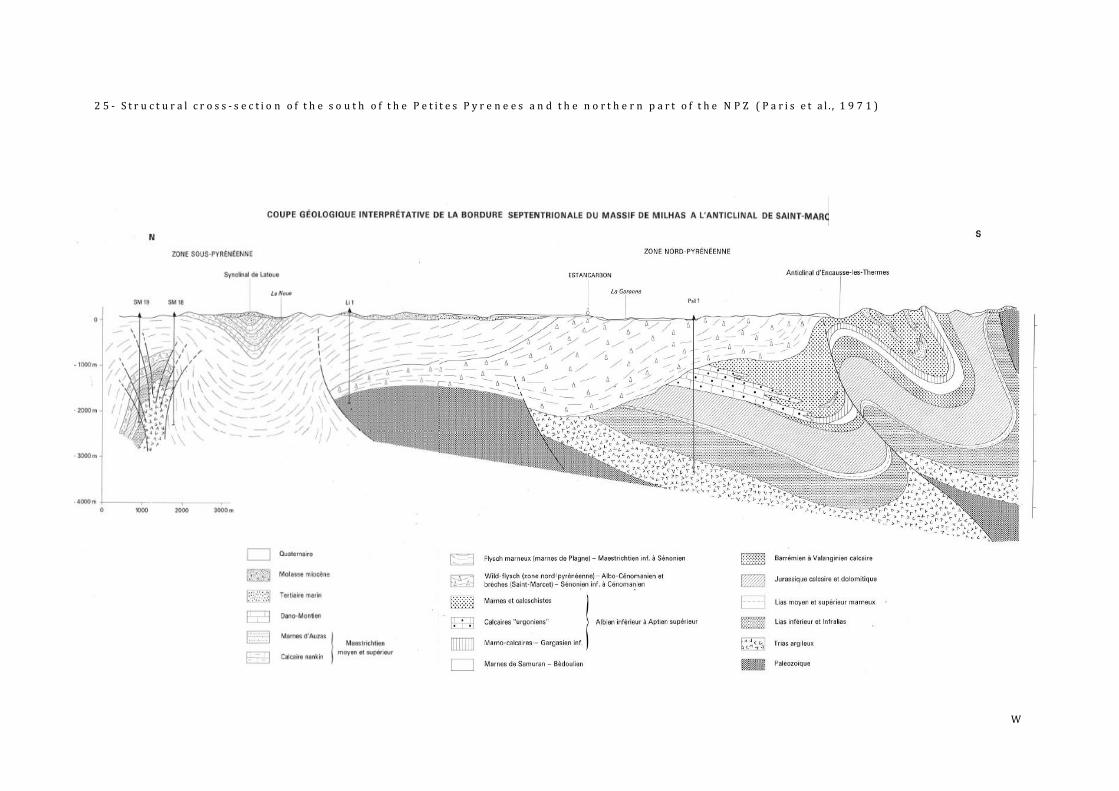
W
2 5 - S t r u c t u r a l c r o s s - s e c t i o n o f t h e s o u t h o f t h e P e t i t e s P y r e n e e s a n d t h e n o r t h e r n p a r t o f t h e N P Z ( P a r i s e t a l . , 1 9 7 1 )

X
2 6 - S t r u c t u r a l c r o s s - s e c t i o n o f t h e N P Z ( D e b r o a s 1 9 9 0 )

Y
2 7 - I n t e r p r e t e d s e i s m i c c r o s s - s e c t i o n ( S e r r a n o e t a l . 2 0 0 6 )

Z
2 8 - S t r u c t u r a l c r o s s - s e c t i o n o f t h e N P Z , t h e P e t i t e s P y r e n e e s a n d t h e s o u t h o f t h e p l a t f o r m ( T o t a l , 1 9 9 8 , n ° 1 3 )
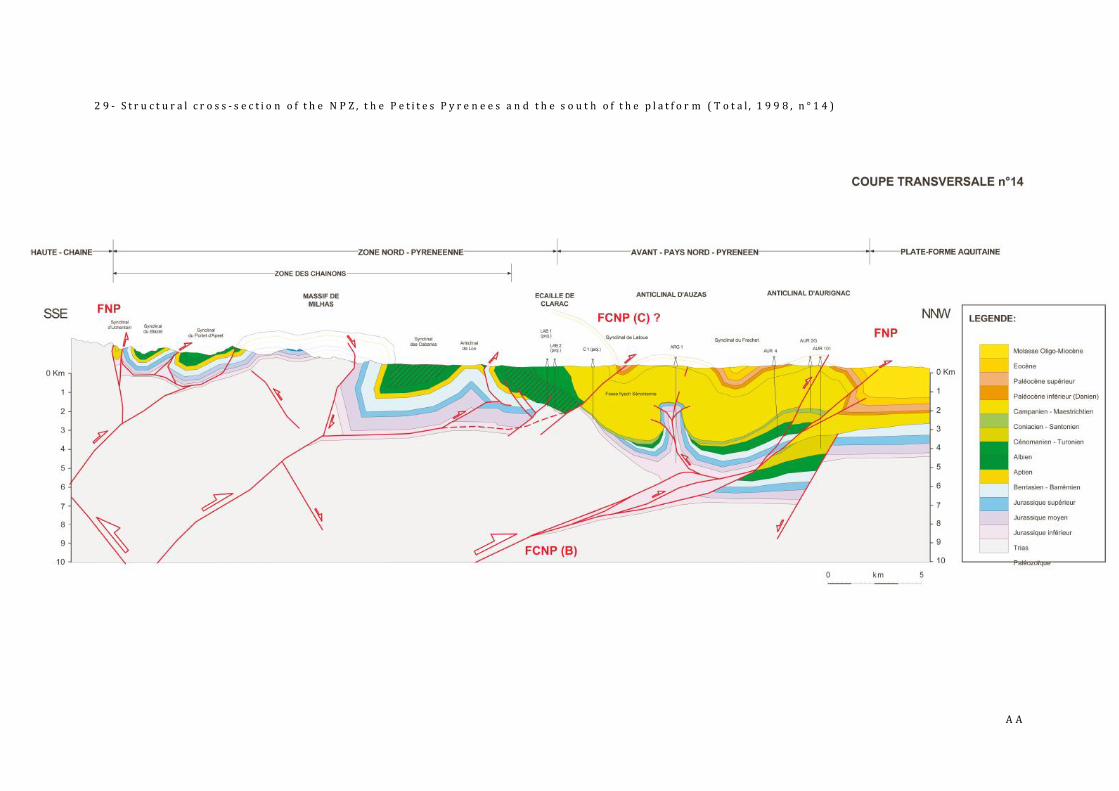
A A
2 9 - S t r u c t u r a l c r o s s - s e c t i o n o f t h e N P Z , t h e P e t i t e s P y r e n e e s a n d t h e s o u t h o f t h e p l a t f o r m ( T o t a l , 1 9 9 8 , n ° 1 4 )

B B
3 0 - S t r u c t u r a l c r o s s - s e c t i o n o f t h e P e t i t e s P y r e n e e s ( B o u r r o u i l h 1 9 9 5 )

C C
3 1 - S t r u c t u r a l c r o s s - s e c t i o n o f t h e A u r i g n a c a n t i c l i n e ( H e r i t i e r e t a l . 1 9 7 2 )

D D
3 2 - E u s t a t i c c h a r t u s e d f o r t h e c a l c u l a t i o n o f s u b s i d e n c e ( H a r d e n b o l e t a l . , 1 9 9 8 )
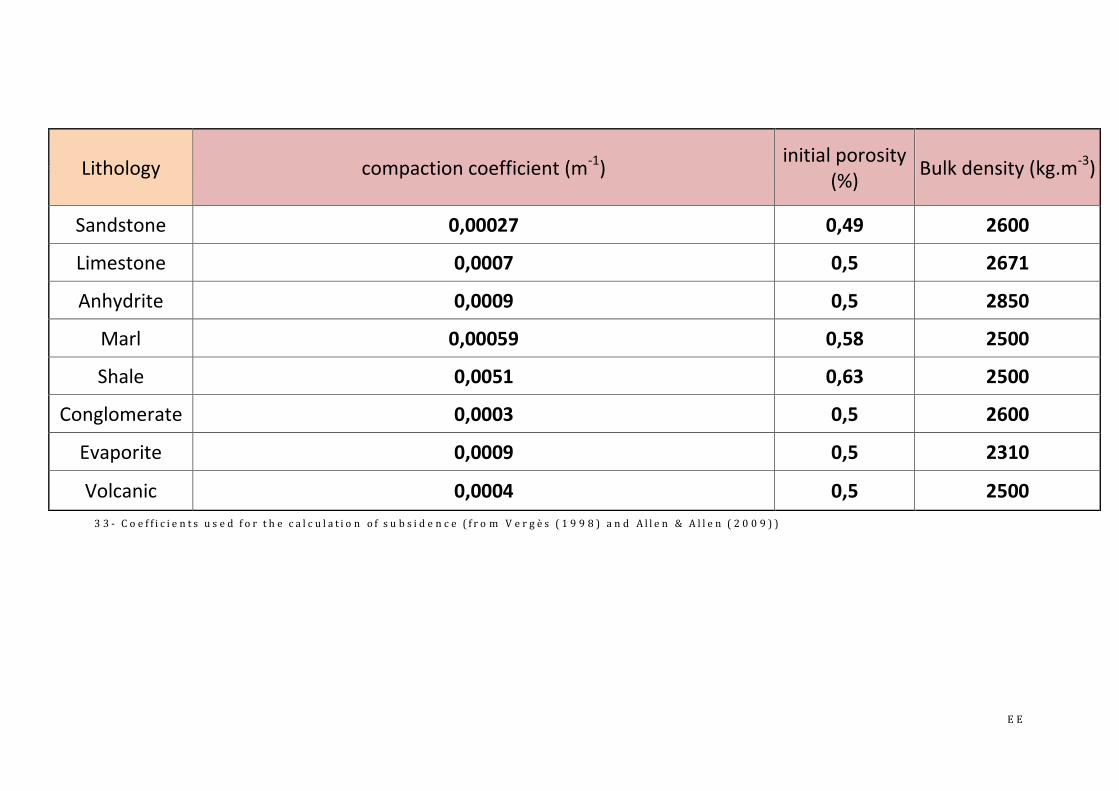
E E
Lithology compaction coefficient (m-1) initial porosity
(%) Bulk density (kg.m-3)
Sandstone 0,00027 0,49 2600
Limestone 0,0007 0,5 2671
Anhydrite 0,0009 0,5 2850
Marl 0,00059 0,58 2500
Shale 0,0051 0,63 2500
Conglomerate 0,0003 0,5 2600
Evaporite 0,0009 0,5 2310
Volcanic 0,0004 0,5 2500
3 3 - C o e f f i c i e n t s u s e d f o r t h e c a l c u l a t i o n o f s u b s i d e n c e ( f r o m V e r g è s ( 1 9 9 8 ) a n d A l l e n & A l l e n ( 2 0 0 9 ) )

F F
3 4 - C a l c u l a t i o n t a b l e u s e d f o r t h e c o n s t r u c t i o n o f t h e s u b s i d e n c e c u r v e s f o r t h e b o r e h o l e A V - 1 0 1
Number of series
Series Age top Base m Top m compaction coefficient
(m-1)
initial porosity
(%)
volumic masse
(kg m^-3)
Paleobathymetry Eustatism
1 S90A5Do5 237 2147 1850 0,000533 0,4975 2598,55 0 50
2 A55Anh10S5Ophite30 201,3 1850 1579 0,0030285 0,571 2540 0 0 3 C40Do50A10 195,05 1579 994 0,00114 0,513 2653,9 10 25 4 Do50Cs50 190,8 994 812 0,0007 0,5 2671 5 25 5 Cbio70M30 68,04 812 677 0,000667 0,524 2619,7 5 225 6 M50Cs45As5 66 677 641 0,0008435 0,546 2573,4 5 225
7 Do90S5C5 51,9 641 631 0,0006785 0,4995 2667,45 0 250 8 S90A5Gyp5 38 631 528 0,0005115 0,497 2595 0 215 9 M90S10 0 528 0 0,000558 0,571 2510 0 70

G G
3 5 - C a l c u l a t i o n t a b l e u s e d f o r t h e c o n s t r u c t i o n o f t h e s u b s i d e n c e c u r v e s f o r t h e b o r e h o l e M T G - 1
Number of
series
Series Age top Base m Top m compaction coefficient
(m-1)
initial porosity
(%)
volumic masse
(kg m^-3)
Paleobathymetry Eustatism
1 Anhydrite100 200 5070 4470 0,0009 0,5 2850 0 0 2 Anh90Do5C2A3 190,8 4470 3482 0,001012 0,5039 2826,97 0 40 3 Cbio50M50 180 3482 3288 0,000645 0,54 2585,5 10 50
4 M90Do5Ca5 177 3288 3206 0,000601 0,572 2517,1 10 50 5 C60A10Do10Cbio10M10 174,1 3206 3187 0,000689 0,508 2653,9 10 60
6 Cbio70Do20A7Anh3 157,3 3187 2790 0,001014 0,5091 2664,4 5 140 7 C75Do10V10A5 152,1 2790 2393 0,00089 0,5065 2645,35 5 140 8 C75Do10Cbio10A5 145 2393 1963 0,00092 0,5065 2662,45 10 155
9 Cbio90S5A5 125 1963 1720 0,0008985 0,506 2658,9 10 215 10 Cbio90S5A2Do3 119 1720 1517 0,0007665 0,5021 2664,03 10 210 11 As95Do4Pyr1 66 1517 1438 0,004924 0,6248 2506,84 0 225 12 Dobio95A5 59,2 1438 1406 0,00092 0,5065 2662,45 0 215 13 S85Grv5M10 56 1406 1304 0,0003035 0,4995 2590 10 250
14 As100 51,9 1304 1289 0,0048585 0,623 2505 0 260 15 S80Cong15Grv5 38 1289 1247 0,000276 0,492 2600 5 230 16 M95Grv5 33,9 1247 1030 0,0005755 0,576 2505 0 175 17 M95Grv5 15,97 1030 0 0,0005755 0,576 2505 0 125

H H
3 6 - C a l c u l a t i o n t a b l e u s e d f o r t h e c o n s t r u c t i o n o f t h e s u b s i d e n c e c u r v e s f o r t h e b o r e h o l e S A - 1
Number of
series
Series compaction coefficient
(m-1)
initial porosity
(%)
volumic masse
(kg m^-3)
Paleobathymetry Eustatism Age top Base m Top m
1 Anhydrite 0,0009 0,5 2850 5 0 200 5202 4202 2 Cs25Ca25Cm25Cbio10Calcite5 0,000893 0,51 2650,35 10 190 119 4202 3793 3 basalte 0,0004 0,5 2500 0 210 109,5 3793 3615 4 Cs30Ca30C5M5G20Ciment5Anh5 0,0010255 0,514 2641,95 150 210 106,75 3615 3583 5 Cs40Ca40C10M10 0,0008875 0,514 2641,8 10 275 103,6 3583 3465 6 basalte 0,0004 0,5 2500 0 290 100,5 3465 3398 7 basalte 0,0004 0,5 2500 0 275 89 3398 1954 8 M70G10Cog10A5V5 0,000745 0,5615 2500 150 260 70 1954 1914 9 Mc80Ms10Cs5Ca5 0,0008215 0,562 2539,2 100 260 69 1914 886
10 M60Cs30Ms10 0,000564 0,5505 2549,2 0 225 66 886 611 11 C70Do20A10 0,00114 0,513 2653,9 0 220 59,2 611 486 12 G50Cs40A10 0,000925 0,508 2618,4 0 220 56 486 231 13 C40G10Cm50 0,000646 0,507 2646,8 5 250 51 231 182 14 A60Grv10Ms15Mc15 0,0032565 0,5935 2523,55 0 225 38 182 132 15 A60Grv10Ms15Mc15 0,0032565 0,5935 2523,55 0 150 15 132 0

I I
3 7 - C a l c u l a t i o n t a b l e u s e d f o r t h e c o n s t r u c t i o n o f t h e s u b s i d e n c e c u r v e s f o r t h e b o r e h o l e P S I - 1
Number of series
Series Age top Base m Top m compaction coefficient (m-
1)
initial porosity
(%)
volumic masse (kg
m^-3)
Paleobathymetry Eustatism
1 D010Anh80C5Ophite5 208,5 3290 2313 0,000845 0,5 2805,65 5 0 2 D010Anh80C5Ophite5 195,05 2313 2268 0,000845 0,5 2805,65 5 25 3 C70A30 174,1 2268 2109 0,00202 0,539 2619,7 10 75 4 Do90anh2C3As2Ablack3 166,1 2109 1873 0,000924 0,5065 2666,03 10 50 5 Do100 163,5 1873 1798 0,0007 0,5 2671 10 50
6 Anh90C5Do5 157,3 1798 1798 0,00088 0,5 2832,1 5 105 7 Cbio50Do50 154,7 1798 1769 0,0007 0,5 2671 5 105 8 Do60Cbio40 152,1 1769 1532 0,0007 0,5 2671 5 105 9 Do50Cbio50 145 1532 1332 0,0007 0,5 2671 5 155
10 C90A5Calcite2Anh3 106,75 1332 758 0,00093 0,5065 2671,4 5 275
11 A33M33S34 83,6 758 0 0,0019695 0,5659 2534 100 225

J J
3 8 - S u m m a r i z i n g p l o t o f t h e t e c t o n i c s u b s i d e n c e r e a l i z e d f o r t h e b o r e h o l e s A V - 1 0 1 , M T G - 1 , S A - 1 a n d P S I - 1 w i t h t h e s o f t w a r e
subsidence.exe
-2500
-2000
-1500
-1000
-500
0
500
-280 -260 -240 -220 -200 -180 -160 -140 -120 -100 -80 -60 -40 -20 0
Tectonic subsidence
av101
sa1
psi1
mtg1

KK
39- Subsidence curves pour the boreholes AV-101 and SA-1
-2500
-2000
-1500
-1000
-500
0
-300 -200 -100 0 AV-101
Total subsidence
Tectonic subsidence
-6000
-5000
-4000
-3000
-2000
-1000
0
1000
-250 -200 -150 -100 -50 0
SA-1
Total subsidence
Tectonic subsidence

LL
40- Subsidence curves pour the boreholes PSI-1 and MTG-1
-3500
-3000
-2500
-2000
-1500
-1000
-500
0
500
-250 -200 -150 -100 -50 0
PSI-1
total subsidence
Tectonic subsidence
-5000
-4500
-4000
-3500
-3000
-2500
-2000
-1500
-1000
-500
0
500
-250 -200 -150 -100 -50 0
MTG-1
Totale subsidence
Tectonic subsidence