Embed Size (px)
Citation preview

REPORT OF INVESTIGATION 108
Sedimentation in Quincy Bay and Potential Remedial Measures
by J. RODGER ADAMS, NANI G. BHOWMIK, WILLIAM C. BOGIMER, and FRANK S. DILLON
Title: Sedimentation in Quincy Bay and Potential Remedial Measures. Abstract: A lake sedimentation survey determined that about 72% of the volume of Quincy Bay has been filled with sediment deposits. Remaining water depths range from 0.5 foot in Long Lake and Triangle Lake to 5.6 feet in the lower main bay. Measurements of water and sediment fluxes into the bay showed that tributaries contribute 1% of the water and 8% of the sediment, the access channel contributes 52% of the water and 22% of the sediment, and flood overflows from the Mississippi River contribute 47% of the water and 70% of the sediment The average annual sediment inflow is 1,096,000 tons, of which about 245,000 tons, or 22.4%, is deposited in the bay. A number of possible remedial measures, and comments on them from interested agencies and individuals, are presented and discussed in the report. Recommended actions include: 1) rehabilitation of Triangle Lake, 2) selective dredging for boating and fish habitat, 3) implementation of soil conservation practices on tributary watersheds, and 4) further analysis of closing the access channel and diverting all but the largest floods from most of the bay area. Reference: Adams, J. Rodger, Nani G. Bhowmik, William C. Bogner, and Frank S. Dillon. Sedimentation in Quincy Bay and Potential Remedial Measures. Illinois State Water Survey, Champaign, Report of Investigation 108, 1987. Indexing Terms: Floods, Mississippi River, Quincy Bay, rehabilitation, sediment budgets, sediment transport, sedimentation, suspended sediment.

STATE OF ILLINOIS HON. JAMES R. THOMPSON, Governor
DEPARTMENT OF ENERGY AND NATURAL RESOURCES DON ETCHISON, Ph.D., Director
BOARD OF NATURAL RESOURCES AND CONSERVATION
Don Etchison, Ph.D., Chairman
Walter E. Hanson, M.S., Engineering
Seymour O. Schlanger, Ph.D., Geology
H. S. Gutowsky, Ph.D., Chemistry
Robert L. Metcalf, Ph.D., Biology
Judith Liebman, Ph.D. University of Illinois
John C. Guyon, Ph.D. Southern Illinois University
Funds derived from University of Illinois administered grants and contracts were used to produce this report.
STATE WATER SURVEY DIVISION RICHARD G. SEMONIN, B.S., Chief
CHAMPAIGN 1987
Printed by authority of the State of Illinois
(4-87-300)

CONTENTS PAGE
Abstract 1 Introduction 2
Quincy Bay area 2 History 5 Hydrology and hydraulics 6
Plan of study 8 Acknowledgments 9
Lake sedimentation survey 10 Methods 10 Water and sediment volumes 11
Total bay volume 11 Sediment distribution 15
Sedimentation patterns 16 Simulations of flood period sedimentation 26
HEC-6 mathematical model 26 Input data for Quincy Bay 28 Simulation results 32
Sediment load measurements 35 Methods 36 Sediment inputs from the Mississippi River 36 Sediment inputs from upland drainage 41
Water and sediment budgets 43
Remedial measures 48 Proposed remedial actions 49
Access channel.. 50 Triangle Lake 50 Selective dredging 53 Whole bay 53
Advantages and disadvantages of remedial actions 56 Access channel 56 Triangle Lake 57 Selective dredging 58 Whole bay 58
Conclusions and recommendations 60 Conclusions 60 Recommendations 60
References 62

Quinay Bay (Photograph courtesy of Quinay Herald-Whig)

SEDIMENTATION IN QUINCY BAY AND POTENTIAL REMEDIAL MEASURES
by J. Rodger Adams, Nani G. Bhowmik, William C. Bogner, and Frank S. Dillon
ABSTRACT
Quincy Bay sedimentation patterns and rates, sediment sources, and possible remedial measures were studied for two years at the request of the Illinois Department of Conservation. Human activities have modified the hydraulics and sediment transport in Quincy Bay several times in the past century. The most recent changes are the result of opening a small-boat access channel at mile 329 on the Mississippi River in 1969. Rapid sediment deposition in Broad Lake and connecting sloughs has restricted boating access and limited fish habitats. Continued sedimentation in the middle and upper main bay is also restricting boating and water-based recreation.
The sedimentation survey determined that the water volume of the bay is only 28% of the original. Annual sedimentation rates between 1975 and 1985 varied from nearly 5% in upper Broad Lake to 0.2% in the lower main bay. Average depths in the middle and upper main bay are about 2.5 feet, which is marginal for power boating. Upper Broad Lake, Long Lake, and Triangle Lake all have depths under 1 foot at normal pool level. Suspended sediment load measurements on the tributaries and at key locations in the bay were combined with mathematical modeling of the 1973 flood and sedimentation survey results to develop a sediment budget for Quincy Bay. The average annual sediment flux into the bay is 1,096,000 tons. Of this sediment input, 22.2% enters through the access channel, 8.1% is carried by the tributaries, and 69.7% enters during flood overflow of the bay. About 245,000 tons, or 22.4%, of the sediment is deposited in the bay. The budget calculations revealed the complexity of the flow patterns in the bay and the impact of varying stage on flow rates and even on direction of flow in connection sloughs and channels.
A number of actions were considered as possible remedial measures. Several are expensive and have minimal chance of improving the bay, but several others have real potential and are acceptable to the agencies and individuals who reviewed and commented on the remedial measures. Final recommendations include: 1) rehabilitate Triangle Lake for waterfowl and as a sediment trap for Frazier-Homan Creeks, 2) selectively dredge the upper, middle, and lower bay for boating, and parts of the Broad-Long Lake complex for fish habitat, 3) encourage implementation of soil conservation practices on the tributary watersheds, and 4) conduct detailed studies on closing the access channel and building a long dike to prevent flood overflow by all but the most extreme floods.
1

INTRODUCTION Quincy Bay is a complex backwater along the Mississippi River
adjacent to the city of Quincy, Illinois. Hunting, fishing, and boating are common in the bay. Sediment accumulation in Quincy Bay has been a concern for many years. The change in water flow patterns and sediment deposition following the opening of a small-boat access channel in the late 1960s has increased the concern, and since 1975 local residents have requested corrective action. The local concern prompted this study, which has been conducted by the State Water Survey Division, Illinois Department of Energy and Natural Resources, with financial support from the Illinois Department of Conservation.
Quincy Bay Area
On most maps (USGS, 1971; U.S. Army Corps of Engineers, 1978) Quincy Bay is a body of water 3 miles long and 400 to 2000 feet wide, extending north along the bluff line in Illinois from river mile 327 on the Upper Mississippi River (as measured from Cairo, Illinois). The city of Quincy is located near the bay outlet. An associated complex of interconnected channels and small bays lies to the west of Quincy Bay proper. In this report, Quincy Bay refers to the entire area. The bay area is located in Adams County, Illinois, and occupies all or portions of several sections in Township 1 south and Range 9 west. The bay outlet is at latitude 39°56'9" north and longitude 91°25' west.
Figure 1 is a general location map of the vicinity of Quincy, Illinois. The overall bay area is about 4 miles long and 2 miles wide, as shown in figure 2. The land areas are less than 10 feet above normal pool level and are covered with willows and other moist-soil trees. The total water surface area is about 500 acres. Triangle Lake (figure 2) contains 210 acres, of which about half is water and the rest is brush-covered dry land. Figure 2 was traced from plates in Soil Survey of Adams County. Illinois (Bushue, 1979). This publication identifies soil types by drainage characteristics, parent rock, slope, and agricultural productivity. Erosion potential on the tributary watersheds can be estimated from this information.
Major tributaries of Quincy Bay include Cedar Creek, Frazier Creek, and Bear Creek, which is the main ditch in the Indian Grave Drainage District. Drainage areas in square miles are: Cedar Creek, 8.0; Frazier Creek, 17.1; Indian Grave Drainage District, 27.7; and direct drainage, 1.8. The direct runoff areas, Cedar Creek, and Homan Creek (a tributary of Frazier Creek with a drainage area of 7.7 square miles) are in Quincy or residential areas north of Quincy. The remainder of the Frazier Creek watershed is rural. Most of the area in these watersheds is on top of bluffs which are about 100 to 150 feet high. A portion of the area is on steep bluffs. The drainage district is entirely level, agricultural bottomland and is leveed for flood protection. The outflow from the drainage district is pumped into Triangle Lake.
2

Figure 1. Location map of Quincy Bay
3

Figure 2. Map of the Quincy Bay area (after Bushue, 1979)
4

History Prior to the formation of the Indian Grave Drainage District in the
1880s, Quincy Bay was the outlet channel for Bear, Rock, Ursa, Frazier, and Homan Creeks. The total drainage area was about 400 square miles and the average water discharge was about 240 cubic feet per second (cfs). Cedar Creek, with a drainage area of 8 square miles and local drainage of about 2 square miles, also entered Quincy Bay. By 1886, the drainage district had constructed its levees and diverted Bear Creek directly to the Mississippi River. The old channel of Bear Creek served (and continues to serve) as the main drainage ditch within the leveed area of 28 square miles.
Other activities that had taken place by this time were the construction of a railroad crossing of the Mississippi River at mile 327.9. The swing span on the Missouri side of the river had a low steel elevation of 486 feet above mean sea level (msl). The fill on Quinsippi Island between Quincy Bay and the Mississippi River was at an elevation of about 489 feet msl. This fill is now the roadway in the city park on the island. The old railroad bridge across Quincy Bay is now used for vehicle access to the park.
As early as 1824, the Corps of Engineers began removal of snags from the river to assist navigation. In 1878 the 4.5-foot-deep navigation channel project was authorized, and construction of wing and closing dams was begun to direct more of the river discharge into the navigation channel during moderate and low flow conditions. In 1907 a 6-foot navigation channel depth was authorized by congress, and more structures were built to further constrict the flow area.
The lower end of the drainage district did not drain well, and in 1918, under court order, the 17.1-square-mile Frazier-Homan Creek basin was diverted directly to the upper end of Quincy Bay and an electric pumping station was constructed to empty the drainage water into the bay. Because of excessive pumping costs and difficulty in dewatering, the Triangle Lake area was cut off from the drainage district by a levee constructed about 1928 with aid from the Mississippi River Commission.
In 1930 congress authorized the present navigation project with a 9-foot channel depth which depends on lock and dam structures as well as wing and closing dams to maintain the design depth of water. Lock and Dam 21 at mile 324.9 was put into operation in 1938 and established a low water pool elevation of 470 feet msl (U.S. Army Corps of Engineers, 1980). This is up to 15 feet above the extreme low water level during the drought in the 1930s. Quincy Bay now became a backwater and not a tributary outlet channel.
At this time some of the area west of the original, or main, bay became permanently flooded as part of the Quincy Bay backwater. Sedimentation became a serious problem in the main bay above the Cedar Creek delta, with average depths reduced from 8 feet to 3 feet between 1938 and 1956. In 1952, the Indian Grave Drainage District installed a new diesel pumping station next to the original one, which was retired. To reduce the sedimentation in the upper part of the bay, the drainage
5

district discharge and Frazier-Homan Creeks were diverted into Triangle Lake in 1956.
Between 1958 and 1960 the Chicago, Burlington, and Quincy Railroad constructed a new fixed channel span river crossing. The new bridge across the bay (figure 2) is 1500 feet north of the old bridge, which was retained for vehicle access to the park on Quinsippi Island. The new Mississippi River bridge is 500 feet north of the old bridge, which was removed. The navigation channel was moved from the Missouri shore to the Illinois shore, which required dredging 902,000 cubic yards of sand from the river. Low steel elevations on the new bridges are above elevation 530. This required a high embankment on Quinsippi Island, and the sand was dredged from the lower part of Broad Lake for fill. This left an area 25- to 30-feet deep, which was used for power boating.
In the early 1960s the lower bay, including some of the Cedar Creek delta, was dredged to provide boat access to what is now Bangert Park. Squaw Chute Marina was constructed in 1966. After several years of discussion, the Quincy Bay access channel was constructed by dredging in 1969. From 1971 through 1973 the Corps of Engineers reported that annual dredging was required to keep the access channel open to its design depth of 6 feet (GREAT II, 1980). Since then the channel has scoured its bed to several times the design cross-sectional area.
By 1975, local boaters, fishermen, and duck hunters were sufficiently concerned about the readily apparent shoaling in many chutes, sloughs, and lakes within the Quincy Bay complex that some of them conducted a hydrographic survey of the bay (Lymenstull, 1975). Efforts were begun to obtain federal or state funds to determine the causes of the problem and to propose remedial measures to prevent future sedimentation and to rehabilitate some parts of the bay. In the spring of 1982, Water Survey personnel were briefed on the problem, and a report was prepared by J. Rodger Adams (1982) which outlined a project scope to accomplish these goals. In 1984, the Illinois Department of Conservation sponsored two projects: a recreational study and the study reported here. The Rock Island District, U.S. Army Corps of Engineers, also obtained some funding to do a feasibility study on Quincy Bay.
Hydrology and Hydraulics
The Mississippi River has a drainage area of 135,000 square miles at Lock and Dam 21. The average discharge is 68,400 cfs. The 1973 flood, which has a recurrence interval of at least 100 years, set the record daily discharge of 408,000 cfs at Lock and Dam 21. Major tributaries to the Mississippi in Pool 21 (figure 1) are the Wyaconda River in Missouri (drainage area 458 square miles) and Bear Creek in Illinois (drainage area 349 square miles). The average flow in these two rivers totals about 450 cfs.
Quincy Bay receives water from 55 square miles of drainage area. Prior to the opening of the small-boat access channel, this water flowed into the Mississippi through the bay outlet channel at low or normal
6

stages. The access channel allows water to enter the bay complex two miles upstream of the outlet. This influx of Mississippi River water carries sediment into the bay, which is deposited in various locations as the water flows through the complex of interconnected channels. For stages over 474 feet msl at mile 332, river water flows into the Quincy Bay area near the Canton Chute Public Use Area, also called Knapheide Landing (figure 2). According to stage-duration information (U.S. Army Corps of Engineers, 1980), such conditions occur about 10% of the time. Thus during major floods on the Mississippi River the entire area is under water, and scour and deposition may occur throughout Quincy Bay. The most likely areas for sediment deposition during high river stages are Triangle Lake, the upper portion of Quincy Bay proper, and upstream of the railroad embankment in lower Broad Lake.
The tributary flows and amount of sediment transported into the bay were estimated from available data. The four nearby stream gage records in table 1 (USGS, 1981) were used to determine the following relation between mean annual discharge and drainage area:
in which Q is the discharge in cubic feet per second and A is the drainage area in square miles.
This equation yields average discharges of 13.0 cfs for Frazier Creek, 20.3 cfs for the Indian Grave Drainage District, and 6.6 cfs for Cedar Creek.
The sediment load has not been measured for many Illinois streams. A sediment budget study on the Mississippi River has been conducted by the Iowa Institute of Hydraulic Research (Nakato, 1981). Nakato gives an annual sediment discharge of 18,200 tons for Bear Creek near Marcelline. This is 521 tons per year per square mile. He discusses sediment yield ratios, and found that the average sediment load was about 7% of the Soil Conservation Service erosion estimate for the drainage basin. This delivery ratio is important if a detailed erosion estimate is made and used to determine the sediment load in a stream.
Since determining the soil erosion potential is well beyond the scope of this report, a regional estimate of sediment yield was used. The Upper
Table 1. Gaging Station Data
7

Mississippi River Comprehensive Basin Study Coordinating Committee (1970) presents a relationship between average annual sediment yield in tons per square mile and drainage area for areas with different erosion potential because of different soil types, slopes, covers, and precipitation amounts. From the information in this report, the estimated annual sediment yields are: 1100 tons per square mile for Frazier and Cedar Creeks, which totals 18,800 tons for Frazier Creek and 8800 tons for Cedar Creek; and 2200 tons per square mile for the Indian Grave Drainage District, which totals 60,940 tons.
The approximately 2 square miles draining directly to Quincy Bay probably contribute about 4 cfs on a yearly average. However, much of this area, as well as part of the Cedar Creek drainage area, is in the city of Quincy. Thus runoff and sediment yield estimates are affected by the storm sewer system and the amount of impervious area, and are extremely difficult to make. On the basis of the same sources as above, the annual sediment yield from this area is probably between 900 and 2200 tons per square mile, which totals between 1800 and 4400 tons.
These values, which are similar to those in the background report by Adams (1982), are of the correct magnitude and give a total tributary sediment input of between 90,340 and 92,940 tons per year. At an initial density of 40 pounds per cubic foot, 92,940 tons would be equivalent to 172,100 cubic yards of sediment entering the bay each year from the tributaries. Improving these estimates, and estimating the amount of sediment entering the bay from the Mississippi River and the amount leaving through the lower bay, or bay outlet channel, are among the goals of this investigation.
The small amount of data available makes it difficult to estimate the sources, quantities, and deposition of sediments in the bay. Hence it is also difficult to make specific recommendations to solve the problem. For example, dredging might be required every few years, or a change in flow pattern could move the problem to a new location. The choice of a permanent, hydraulically and ecologically sound solution depends on accurate data.
Plan of Study
The background report (Adams, 1982) proposed a three-component investigation: 1) a sedimentation survey, 2) suspended sediment transport measurements, and 3) determination of erosion potential of the local watersheds.
The scope of work outlined below was the result of discussions between staff members of the Water Survey, Illinois Department of Conservation, and Rock Island District, U.S. Army Corps of Engineers:
A. Sedimentation Survey of Quincy Bay and Determination of Sediment Characteristics 1. Locate and monument cross sections
8

2. Measure water and sediment depths at cross sections 3. Determine sediment particle size distributions and unit
weights 4. Collect core samples to determine sediment characteristics 5. Determine the present capacity of the bay and develop a
hydrographic map B. Inflow and Suspended Sediment Measurements at Four Locations:
Frazier Creek, Cedar Creek, access channel, and Quincy Bay outlet channel 1. Collect daily samples for sediment concentration during
flood and storm runoff events 2. Collect weekly samples during low flow periods 3. Analyze suspended sediment samples for particle size
distribution as appropriate 4. Measure water and sediment discharges monthly 5. Determine a sediment budget of the bay
C. Determination of Flood Period Sedimentation 1. Use mathematical model to estimate sediment transport and
deposition during typical floods 2. Conduct a reconnaissance survey of land areas in bay for
evidence of scour or deposition during annual floods
D. Report and Recommendations 1. Prepare and submit quarterly report 2. Assess and evaluate all the collected and existing data 3. Recommend conceptual solutions to the sedimentation problem 4. Prepare and submit a draft report in the fall of 1985 5. Submit the preliminary report in the winter of 1985 6. Submit final report at the end of project period
Progress reports included preliminary results of the sedimentation survey and a preliminary list of possible remedial measures. This report summarizes the project results and discusses the merits of various remedial measures in light of the sources and amounts of sediment entering Quincy Bay.
Acknowledements
This project was conducted under the administrative guidance of Richard J. Schicht, Acting Chief, and Michael L. Terstriep, Head of the Surface Water Section, Illinois State Water Survey. Financial support was provided by the Illinois Department of Conservation. William A. Jansen, Chief Engineer, was project manager for the Department of Conservation. Richard Watson and Roger Risser served as liaisons for the Rock Island District, U.S. Army Corps of Engineers.
The sedimentation survey was conducted by William C. Bogner with the assistance of John Rickets and Wei-Ji Chen. Frank S. Dillon was responsible for the suspended sediment sampling and analysis of that data.
9

Terry Willings and Blaine Eickelschulte collected weekly and runoff event sediment samples at the tributary and bay bridge sites. Wei-Ji Chen entered data and made the computer runs with the HEC-6 sediment transport model. Illustrations were prepared by John Brother, Jr., and Linda Riggin. Becky Howard and Patty Odencrantz typed the draft and camera-ready copies of the text, and Gail Taylor edited the report.
The measurements at the access channel and Mississippi River sites were made with the assistance of Jack Grubaugh, Natural History Survey, and David Day, Western Illinois University. The Natural History Survey River Research Laboratory at Havana and the Western Illinois University Division of Biology loaned boats and towing vehicles for use in data collection. Special thanks are due these organizations and personnel for this assistance.
The photograph facing page 1 was furnished by the Quincy Herald-Whig and is used with permission.
LAKE SEDIMENTATION SURVEY
Methods
A sedimentation survey is a 3-dimensional survey of a body of water and the sediment deposited in it. Measurements are made to determine both the present and original volumes of the basin. The difference between the present and original volumes is the volume of sediment accumulation over the life of the basin.
If the age of the basin is properly documented, the sediment volume can be used to calculate the average rate of accumulation in the basin. Successive surveys of a basin over time improve the definition of chronologic variability of the sedimentation rates.
The 1985 sedimentation survey of Quincy Bay was conducted by establishing a monumented system of survey lines in the major sections of the bay. These cross sections were field-located from aerial photographs with a scale of 1" = 660' (1:7920) and were surveyed.
Horizontal measurements were made either with a marked cable or with an electronic distance meter or stadia. Vertical measurements of the 1985 water depth and the original water depth (where possible) were made by either standard level survey or water depth measurement. All measurements of above-water-level deposits were made by leveling. In open water, an aluminum sounding pole was used to measure the present water depth and then was manually driven to a point of refusal, which was noted as the original water depth. In some cases, original depth measurements could not be made because of the density and/or depth of deposited materials. Other sources of data were used to determine original depth, as will be discussed later.
Where access permitted, the range ends were monumented with concrete posts. The concrete monument posts were either capped or crowned. Capped
10

markers have a brass cap embedded in the top identifying them as State Water Survey markers. Crowned markers have pointed concrete tops. At least one capped marker was placed on each survey line. Corresponding crowned markers were generally placed on the opposite end of the line.
As an aid in defining the sedimentation patterns in the bay, samples of the accumulated sediment were analyzed for unit weight and particle size distribution. Particle size results were used directly to interpret sedimentation patterns. Unit weight results were used in conjunction with the sediment volumes for bay segments to evaluate sediment tonnage in each segment.
Sediment samples were collected by using a 6-inch Ekman dredge for surface particle size samples and a hand-held core sampler with a 2-inch by 3-foot barrel for all other samples (all unit weight samples and the particle size samples from below the surface).
Water and Sediment Volumes
The complex physical and hydrologic character of the Quincy Bay system caused considerable difficulties in the collection, analysis, and interpretation of the field survey data. Shallow water and mudflat areas limited access in many areas of significant sedimentation; the complex shape of the bay and connecting channels complicated volume calculations; and man-made modifications to the system resulted in differing time intervals for analyzing sedimentation rates.
In order to simplify the presentation of results, this section and succeeding sections will be organized on the basis of the following segmental divisions as well as the total bay area. These divisions and the survey transects are shown in figure 3. The contour lines on figure 3 show the 1985 distribution of water depth in the bay.
1MB--lower main bay MMB--middle main bay UMB--upper main bay TO--Triple Oaks AC1,7--access channel lines 1 to 7 (lower access channel) AC7,8--access channel lines 7 to 8 (upper access channel) LBL--Lower Broad Lake UBL--Upper Broad Lake WS--Willow Slough TL--Triangle Lake TLA--Triangle Lake access LL--Long Lake
Total Bay Volume
The volumes determined for the total bay, including the main bay and all of the connecting bodies, were determined by summing all of the segmental volumes (see table 2).
11

Figure 3. Segmental divisions and sedimentation survey transects (Depth contours are in feet)

Table 2. Quincy Bay Segmental Volume Results
Note: MB - main bay; LKB, MMB, UMB - lower, aiddle, and upper main bay; TO - Triple Oaks; AC - access channel; AC1, 7, AC7,8 - access channel lines 1 Co 7 and 7 to 8; BL - Broad Lake; LBL, UBL - lower and upper Broad Lake; WS - Willow Slough; TL - Triangle Lake; LL - Long Lake; TLA - Triangle Lake access
The original volume of 4992 acre-feet determined for the Quincy Bay system never actually existed as a total at any given time. This sum represents segmental volumes that did not actually occur simultaneously, for dates ranging from 1938 to 1969. It represents a potential maximum water volume if all segments were returned to their maximum volumes.
The 1975 volume of 2215 acre-feet is the hybrid value determined from the data collected by Lymenstull (1975) and from 1985 data which were necessary to fill gaps in the 1975 data.
The 1985 volume of 1381 acre-feet is based on the 1985 survey and analysis for each of the segmental volumes. Sedimentation rates cannot be determined for the bay as a whole because of the variable dates of origin and the limitations of the 1975 data.
The segmental volume results for the 1985 survey of Quincy Bay (table 2) vary in accuracy according to the sources of data and the methods used to calculate the volumes. Table 3 summarizes the calculation methods used to determine the original, 1975, and 1985 volumes. The quality of the volume calculations is dependent on the source and quality of the depth measurements and the number and locations of these measurements. The overall quality of the calculations is good to poor for the original conditions, good to very poor for the 1975 volumes, and very good for the 1985 volumes.
The methods of calculation were selected on the basis of the available data and the general segment configuration. The following six
13

* Table 3. Volume Calculation Methods
Calculation methods: 1 — stage vs. area; 2 - unadjusted end area - width; 3 - adjusted end area - width; 4 - average of depth readings; 5 - estimated average depth (from other sources); 6 - based on field observations ** LMB, MMB, UMB — lower, middle, and upper main bay; TO - Triple Oaks; AC1,7, AC7,8 - access channel lines 1 to 7 and 7 to 8; LBL, UBL - lower and upper Broad Lake; WS - Willow Slough; TL - Triangle Lake; TLA - Triangle Lake access; LL — Long Lake
basic calculation methods were used. In all cases, volume was determined on the basis of a 470 feet msl flat pool elevation.
1. Stage vs. Area. Volume was calculated on the basis of contour areas as determined from the 1985 sedimentation survey. This method was used for the majority of the 1985 volume calculations.
2. Unadjusted End Area - Width. Average depth of the segment was determined by summing the end areas of all cross sections and dividing by the sum of the widths. The product of surface area and average depth determined segment volume. This method was used for the 1985 access channel volumes.
3. Adjusted End Area - Width. This method was used to adjust calculations for original volume based on method 2 to be consistent with 1985 volumes calculated by method 1. The adjustment consisted of dividing the 1985 volume obtained with method 1 by the same volume obtained with method 2.
14

4. All volumes calculated for 1975 were determined by averaging all depth readings in a segment and multiplying by the segment area.
5. Because of various circumstances, several volumes were calculated by using estimated average depth. For the original access channel and lower Broad Lake volumes, average depth was estimated from 1969 Corps of Engineers design plans and surveys. For the original Triangle Lake access and Long Lake volumes, average depth was estimated from other sources.
6. In two cases (the 1985 Triangle Lake access and Long Lake volumes), average depth was estimated from field observations.
For several portions of the bay area, no data were available for 1975 and no estimates could be made.
Sediment Distribution
Analyses of sediment distribution can be made on the basis of volume, weight, or particle size distribution. Analysis of volume distribution as presented in the last section is a measure of use impairment. This type of analysis, however, is ineffective for comparing sedimentation rates from one segment to another because of varying consolidation rates.
Analysis of sediment distribution by weight takes consolidation rates into account and provides a better comparison of segmental sedimentation conditions. Sediment tonnages are determined by applying the unit weights of field samples to the calculated segmental volumes of the accumulated sediment in the bay. The unit weights and sediment tonnages for each segment are given in table 4.
Table 4. Unit Weights and Tonnages of Quincy Bay Sediments
Note: LMB, MMB, UMB - lower, middle, and upper main bay; TO - Triple Oaks; WS - Willow Slough; TL - Triangle Lake; LBL, UBL - lower and upper Broad Lake; AC1,7 and AC7,8 - access channel lines 1 to 7 and 7 to 8
15

Table 5. Particle Size Characteristics of Quincy Bay Sediments
Samples of sediments from several locations in each segment were analyzed for particle size distribution. Table 5 summarizes average values of the median particle size and the percentages of sand, silt, and clay in each segment. These values are for the surface of the bay bottom. Segments with predominantly silt- and clay-sized sediments are experiencing lake-like sedimentation in quiescent water. The two segments with the highest percentages of sand have continuous flow of water and have beds typical of sand-bed streams.
Similar analyses were done for samples from a depth of about 2 feet. Very little difference in median diameters or in the sand, silt, and clay percentages was found between surface and at-depth samples. Unit weights of bottom sediments are considerably different with depth because the at-depth sediments have been in place longer than the surface sediments and have been compacted by the overlying sediments. Figure 4 shows the variation in unit weight along the center of the main bay. The sediments in the lower main bay have higher unit weights and a higher percentage of sand than those in the rest of the main bay. This is because of the continuous flow of water from the access channel. The higher unit weights at depth in Triple Oaks are at the far upper end of the bay where sedimentation was decreased after Frazier-Homan Creeks were diverted into Triangle Lake.
The sand in Triangle Lake is from Frazier-Homan Creeks and is indicative of its effectiveness as a sediment trap. The sand in Broad Lake is from the access channel. These segments are receiving sediment from flowing water as well as from quiescent settling of backwater.
Sedimentation Patterns
Sediment accumulation rates within a water body vary with inflow rates, distance from inflow points, sediment characteristics, and lake basin geometry. The impacts of these factors on the Quincy Bay system will be discussed segment by segment. The impacts of distance from inflow point
16

Figure 4. Quincy Bay sediment chavaetevist ics (TL = Triangle Lake; WS = Willow Slough; TO = Triple Oaks;
UMB, MMB, LMB = upper, middle, and lower main bay; BL = Broad Lake; AC1, 7 = access channel lines 1 to 7)
and sediment characteristics are analyzed on the basis of data collected for this survey. The impacts of inflow rates and lake basin geometry are discussed in a general way because of limited information. Figure 5 presents diagrams of flow patterns within the bay before and after construction of the access channel. These diagrams illustrate the importance of the access channel to the hydraulics and therefore the sedimentation patterns of the bay.
Prior to construction of the access channel, intra-bay flow was dominated by changes in stage in the Mississippi River. At low stages (470 to about 475 feet msl), a rising stage resulted in water backing up through the lower bay opening to equalize water levels within the bay segments. A falling stage resulted in flow from the bay to the river.
At river stages above 475 feet msl, overland flow from the river into Broad Lake and Willow Slough maintained a steady southerly flow during either rising or falling stages.
17

MSR (Mississippi Rivet)
b. After construction of access channel
Figure 5. Schematic circulation patterns in Quincy Bay
Since construction of the access channel in 1969, flow patterns in the bay have been very different for stages below 475 msl. The flow down the access channel results in constant flow through lower Broad Lake and the lower main bay. This flow is accelerated during periods of increasing stage on the Mississippi because of an increased slope into the bay.
This discussion begins with an evaluation of the hydraulics and sediment accumulation in the principal flow path (the access channel, lower
18

Broad Lake, and lower main bay). The backwater areas (Long Lake, upper Broad Lake, Triangle Lake, Willow Slough, Triple Oaks, upper main bay, and middle main bay) are then discussed. With the exception of Long Lake and upper Broad Lake, these backwater areas have not been heavily impacted by access channel flows.
Access Channel Lines 7 to 8 (AC7,8). This section of the bay system has been the most dynamic in terms of bed modification. Prior to construction of the access channel in 1969, this area ranged in elevation from 469 to 475 feet msl, 1 foot below to 5 feet above navigation pool. The design depth for the channel was 6 feet (bottom at elevation 464 msl). At flat pool, 470 feet msl, head differences between the upper end of the access channel and the lower main bay outlet are very small because of control by the dam below Quincy. Constant flow apparently passes through the system but has very little erosive power. When first built, the 6-foot channel probably handled low flows very well. This 6-foot channel could not have existed very long, because at high stages it would have been very dynamic and scoured its bed rapidly.
The years 1970 to 1972 were years of moderate spring flooding. River stages reached the 475-476 feet msl range but no higher. These stages may or may not have initiated channel bed and bank erosion in the new channel. This activity may have been reflected by the need for maintenance dredging in the area of the access channel during this period (GREAT II, 1980). Eroded materials that were pushed through the new channel may have choked the downstream channel, necessitating new dredging. W.H. Klingner, consulting engineer for the Quincy Park District, asserts (personal communication, 1986) that there never was any maintenance dredging in the access channel although the Corps of Engineers published the data (GREAT II, 1980).
Starting in the spring of 1973 with the highest river stage ever recorded at Quincy (487.5 feet msl, 4 feet above the previous record) through spring 1976, much higher flood stages than in the past occurred on the river. This period of high stages undoubtedly accelerated channel erosion in the new cut as well as high sediment deposition rates downstream in the lower Broad Lake area. It was during this period that Lymenstull (1975) conducted his survey of the bay.
There are indications that the channel either has stabilized or is refilling itself. Lymenstull noted a maximum depth of 29 feet at the south end of the channel in 1975. In 1985, depth sounder charts indicated a maximum depth of 22 feet in this area. Any filling of the channel might result from downstream channel restrictions in the lower Broad Lake area (next section).
Access Channel Lines 1 to 7 (AC1.7) and Lower Broad Lake (LBL). These two areas are considered together in this analysis because of their common origins and similar sedimentation patterns since 1969.
The history of Broad Lake is shown by the sequence of four aerial photographs in figure 6. Figure 6a was taken in July 1938, before Dam 21
19

a. July 1938
b. October 1957
Figure 6. History of changes in Broad Lake
20

c. July 1963
d. September 1969
Figure 6. Concluded
21

was put into operation, and Broad Lake was an interior slough with no direct connection to the main bay. By October 1957, when figure 6b was taken, Broad Lake was a large, interior area. Upper Broad Lake had most of the open water area. There was an access channel just upstream of the old railroad crossing, and there might have been a direct channel into the main bay although it appears that the best connection was by way of Long Lake. Figure 6c, taken in 1963, shows the enlargement of lower Broad Lake resulting from the dredging that was done to obtain fill for the new railroad crossing built in 1959-1960. Several areas in upper Broad Lake had become shallow enough to support aquatic plant beds, which are visible in figure 6c. The channel to the Mississippi River had been closed by the spur dike which protects the railroad embankment from scour by floods. Figure 6d shows the access channel under construction in September 1969. The direct flow path through the access channel, across the lower end of Broad Lake, through an opening used by the dredge for the railroad fill into the main bay, and out the lower main bay may be seen in figure 6d.
Following construction of the access channel and paralleling the growth of that channel, there was a sizable increase in the sedimentation rate in the lower Broad Lake area. At the time of Lymenstull's 1975 survey, the average depth in this area had been reduced to one-half the 1969 depth. In 1985, the average water depth of this area had been reduced to 3 feet. This does not include above-navigation-pool deposition, which has occurred on 39% of this area to a depth of up to 3.5 feet. The area referred to in this report as AC1,7 may be reaching a state of dynamic equilibrium. Bed elevation will vary from year to year within a range determined by discharge. The area referred to in this report as lower Broad Lake is likely to fill completely within a few years.
The distinct differences in the sedimentation characteristics of these two areas are obvious when their sediment particle size distributions are, compared. The sediments of AC1,7 are medium to coarse sands with less than 1% clay or silt. These particle sizes indicate a depositional environment with high flows which remove all fine materials. The sediments of the lower Broad Lake area are primarily silt-size materials with 20 to 35% clay content and 5 to 20% sand. These sediments are representative of deposition in areas where flow velocities decrease rapidly with distance from the main channel.
The sand bed of the active flow area (AC1,7) might be subject to transport and/or relocation during periods of high flow, but the finer sediments of lower Broad Lake are probably more stable and should not be subject to future scour.
Lower Main Bay (LMB). The impacts of sedimentation on the lower main bay section of Quincy Bay as well as the sources of these sediments are not clearly defined by the 1985 survey and other available information. The results of Lymenstull's survey indicate generally greater depths through this area in 1975 than were found in the 1985 survey.
In general, the volume of the lower bay has been reduced by 40-50% since 1938. Local citizens report that the lower bay has been more heavily
22

impacted by sediment in recent years. Particle size data from the 1985 survey support this opinion, but the Lymenstull survey does not support it. This may be because of the limited amount of data taken during the 1975 survey.
The original (1938) average depth of 9.47 feet in the lower main bay was determined from the maximum penetration of the sounding pole during the 1985 survey. The majority of the 1985 measurements were to the point of refusal rather than to hard bottom. It can be assumed that average depth was actually greater in 1938.
The 1985 average depth of 5.64 feet indicates that an average of 3.83 feet of sediment accumulated in 47 years. Because of inadequate data distribution during the 1975 survey, no intermediate depth data could be determined.
Analysis of the 1985 particle size data for the lower main bay indicates that significantly larger quantities of coarser sediments are accumulating in this segment now than in previous years. These sediments are in transition from a silt-clay to a sand-silt environment. The large fractions of silt and clay indicate slack water deposition of sediment.
As the access channel/lower Broad Lake area stabilizes and loses trap efficiency, the lower bay may feel more sediment impact from access channel flows, eventually adapting in cross-sectional area to these flows.
Long Lake (LL). Long Lake has been filled in a manner similar to that of lower Broad Lake and AC1,7. This high rate of sedimentation has resulted from its proximity to the access channel as well as its natural position as a high flow discharge path from lower Broad Lake. Future losses in Long Lake will be less significant because the majority of the lake volume is filled and the direct flow from the access channel into it is significantly reduced by sediment deposition in lower Broad Lake.
Upper Broad Lake (UBL). The southern half of upper Broad Lake has filled in a manner comparable to that of lower Broad Lake and Long Lake. The distinction between the two areas is that lower Broad Lake was dredged by the railroad in 1959, and upper Broad Lake was not. In 1985 this area could not be surveyed because of shallow water/mud flat conditions. The northern portions of upper Broad Lake seem to be less impacted by sediment inflow from the access channel than the southern portions. Sedimentation in this area may be more dependent on diffused overland flow from the Mississippi during high stages.
Particle size analyses in upper Broad Lake indicate silt and clay sediments with no sand. These sediment sizes are indicative of a slack-water area with limited through-flow. Sediment-laden water that circulates very slowly releases its sediment load over long periods of time. Resuspension of sediments is probably very limited because of low flow velocities.
23

Sediment accumulations vary from 4.5 feet in the southern half, where access channel impacts are more pronounced, to 2 to 3 feet in the northern half, where more natural conditions predominate. The average water depth in 1985 varied from 0.5 feet in the southern mud flat area to 2 feet in parts of the northern half.
Triangle Lake (TL). As recently as 1928 the Triangle Lake area was maintained as a part of the leveed drainage district. Sometime around 1928 this area was abandoned as agricultural land. It was subsequently flooded by the increased water levels resulting from the Lock and Dam 21 project.
Original depths ranged from 5 feet to over 12 feet in the old drainage channels. Sediment inflows prior to 1956 were limited to water backed up through the bay system from the Mississippi and entering through an unrepaired levee break. This water would already have deposited part of its sediment load, and sedimentation in Triangle Lake was probably slight.
The pumped outlet from the Indian Grave Drainage District and the natural drainage of Frazier-Homan Creeks were diverted into Triangle Lake in 1956. Periodic aerial photography since that time shows a steady increase in sediment accumulation.
The 1985 survey indicated a water depth of 1 foot or less through almost all of Triangle Lake. This indicates that between 4 and 10 feet of sediment have accumulated in Triangle Lake.
Particle size analyses for the Triangle Lake sediments indicate that the sediments are predominantly silt and clay. Sediments in the western lake (line 1TL) of Triangle Lake are considerably coarser than those in the eastern lake (line 2TL), indicating that the majority of the Indian Grave and Frazier-Homan Creeks sediments are settling in the west lake.
Willow Slough (WS). Willow Slough is subject to sedimentation from four sources: direct flow from the Mississippi in the Canton Chute area; Triangle Lake; Long Lake; and backflow from the main bay during periods of rising stage. The Canton Chute and main bay sources have changed little since at least the 1930s. The sediment input from Triangle Lake would have been insignificant prior to 1956, as would the Long Lake input prior to 1969.
Average water depth in Willow Slough decreased from 3.37 feet in 1969 to 1.84 feet in 1985. These values include the area known as the "Deep Hole," which was dredged for material to repair the Indian Grave levee in about 1969. This hole was originally over 27 feet deep. The 1985 survey indicated an average depth in this area of just over 19 feet.
The 1985 particle size analyses indicate that Willow Slough is subject to slack-water (silt and clay) sedimentation. Its sedimentation
24

rate is low, and this area has probably felt minimal impact from all changes except the Lock and Dam 21 construction.
The "deep hole" area of Willow Slough would be the only exception to this general analysis. The sedimentation rate of the hole is higher than that of Willow Slough in general. However, this higher rate is mostly dependent on the greater depth in the hole.
Triple Oaks (TO) and Upper Main Bay (UMB). These two areas were most heavily impacted by the sediment inputs of the drainage district and Frazier-Homan Creeks prior to 1956. The 4 to 6 feet of sediment that has accumulated in these segments probably dates from before the diversion of these tributaries into Triangle Lake. This hypothesis is based primarily on the significantly lower sedimentation rates from 1975 to 1985 than from 1938 to 1975. When the sedimentation rate for the 1938 to 1975 period is adjusted for the drainage district and creek diversions in 1956, it is seen that the sedimentation rates for the upper main bay and Triple Oaks prior to 1956 were about 3 times the present rate.
Lower sedimentation rates in recent years are also indicated by the particle size analyses for these segments. Sample sets taken in Triple Oaks and the northern half of the upper main bay are the only sets in the bay system which consistently indicate finer sediments in recent years. Finer sediments overlying coarser sediments generally indicate a reduction in sedimentation input.
Middle Main Bay (MMB). The middle main bay area is subject to sediment inputs from all of the backwater areas. Any remnant sediment content contained in waters from Willow Slough and the upper main bay reaches the middle main bay. Drainage diversions such as those of Frazier-Indian Grave have resulted in a change in point of input rather than a change in magnitude. This may be partly responsible for the growth of the shoal area at the mouth of Willow Slough.
The delta deposits of Cedar Creek have been a constant factor in sedimentation in the middle main bay. This area required dredging in the early 1950s to maintain a navigable connection between the lower and upper main bay. This tributary continues to be a major source of sediment to this part of the bay.
The sedimentation rate of this area shows a 50% increase during the 1975-1985 period. This increase may result from impacts of the access channel, Willow Slough/Triangle Lake, or Cedar Creek systems. This increase may also reflect the limited distribution of the data collected in 1975.
Particle size data indicate that more recent sediments are coarser at the outlet of Willow Slough as well as upstream of the access channel inlet and adjacent to Cedar Creek's outlet. These data further support the hypothesis of a slight increase in recent sedimentation rates.
25

SIMULATIONS OF FLOOD PERIOD SEDIMENTATION For areas along large rivers like the Mississippi, the river can be a
major source of sediment, since it transports large amounts of sediment. Water and sediment enter Quincy Bay from the Mississippi River through the access channel at all times, and by overflow during floods which inundate the low-lying land areas of the bay.
No measurements of flood flows were made; however, measurements were obtained for a range of stages from normal pool elevation of 470 feet msl (11.41 feet on the Quincy gage) to elevation 479 feet msl (20.8 feet on the Quincy gage), which is exceeded only 1% of the time (figure 7). Mathematical modeling was used to investigate sediment transport and deposition during flood flows.
Mathematical models are most useful in investigations of conditions which do not often occur or are impossible to measure. Flood period sediment transport in large rivers meets both of these criteria. Models also allow the investigation of several conditions, such as the effect of the railroad embankment on scour or deposition just upstream of the Quincy Bay area. The model selected for use in this study is the HEC-6 model developed by the Hydrologic Engineering Center of the Corps of Engineers to model sediment transport in rivers and reservoirs.
HEC-6 Mathematical Model
The HEC-6 program features are described in a user's manual (Hydrologic Engineering Center, 1977). Water surface profiles are computed by the standard step method with a program similar to the HEC-2 program for water surface profile computations. Sediment transport capacity is calculated by either Laursen's method (1958) or Toffaleti's method (1969). The model is one-dimensional; that is, only longitudinal changes are computed. This entails assumptions that the lateral and depth variations in velocity and sediment concentration are small compared to those along the stream.
The HEC-6 model requires four categories of input data:
1) The river reach to be modeled is divided into subreaches, and data on cross section coordinates, subreach length, movable bed width, and sediment depth are required at the cross sections between subreaches. Manning's n is needed at each cross section to define the resistance to flow.
2) Water discharges, temperatures, and durations are needed to describe the hydrologic event being modeled.
3) Sediment data that are needed include data on inflow load-discharge rating, bed material particle size distribution, and existence of a scour-resisting armor layer.
26

PERCENT OF TIME EQUALLED OR EXCEEDED
Figure 7. Stage-duration curve for the Quincy gage at mile 327.0
27

4) A stage-discharge operating rule is needed for the downstream boundary of the study reach where water surface calculations begin.
With all the input data entered into computer fields in the proper form, the model proceeds in three steps:
1) The water surface elevation and associated hydraulic information such as on water velocity, depth, width, and surface slope are computed at each cross section, progressing from the downstream boundary to the upstream boundary. The backward step method described in the HEC-2 manual (1979) is used for the hydraulic computations.
2) Starting from the upstream boundary, the inflowing sediment load, transport capacity, and armoring are computed for each subreach.
3) The sediment load at the next downstream cross section is computed and the change in bed material volume is computed for that subreach. Then a depth of scour or deposition is computed.
To simulate the sediment transport and changes in bed elevation during a particular flood, a sequence of water discharges of selected durations is modeled. The step-by-step discharge-duration graph replaces the continuous flood hydrograph. Changes in bed elevation and sediment transport rates are calculated at each cross section for each time identified in the discrete hydrograph.
Input Data for Quincy Bay
The reach of the Mississippi River modeled to determine the flood transport and deposition of sediment into Quincy Bay extended from Lock and Dam 21 at mile 324.9 to mile 342.0 some miles upstream of the bay. Cross-sectional data were obtained from the Rock Island District, U.S. Army Corps of Engineers, at 1-mile intervals from miles 325 through 337, and for mile 342. Typical cross-sectional plots are shown in figure 8. The normal flow channel was coded as movable bed, and floodways were coded as fixed bed sections. Manning's n was generally 0.03 for the normal channel and 0.06 for floodways.
Suspended sediment inflows shown in table 6 were furnished by Demissie et al. (1986) from another HEC-6 model for Pool 19 some 20 miles upstream from the reach modeled here. Bed material gradation data are taken from Bhowmik et al. (1981) and from other data on main channel locations in Pool 19. The median grain size is 0.45 mm, or medium sand. The bed material grain size distribution is shown in figure 9.
A set of discharges was selected for the hydraulic validation runs, in which water surface profiles are compared with data such as those presented in the regulation manual for Lock and Dam 21 (U.S. Army Corps of Engineers, 1980). The discharges chosen are given in table 7. At least seven model runs were made and the n values were changed to improve the match between the computed water surface profiles and those observed by the
28

DISTANCE FROM LEFT BANK IN THOUSANDS OF FEET
Figure 8. Cross sections in the Quincy Bay vicinity
29

Table 6. Sediment Discharge Rating Used for Pool 21
Figure 9. Mississippi River bed material particle size distribution
30

Table 7. Discharges Selected for HEC-6 Modeling
Figure 10. Comparisons of computed and observed water surface profiles
U.S. Army Corps of Engineers (1980). The final comparison is shown in figure 10 for each of the discharges in table 7. Upstream of mile 333, Manning's n was made a function of discharge to account for a difference in flow resistance with discharge.
31

After the hydraulics were well simulated, the sediment transport model was run. First it was run for the same set of discharges for periods of time from 10 to 90 days. These runs determined the effect of time and discharge on the sediment transport rates, and the scour or deposition at each cross section. Then three hydrographs were used as input for the discharges. A hypothetical 12-step 175-day flood (figure 11a) was run to learn how the model responded to step hydrographs. A separate run was made with this hydrograph to determine the effect of water temperatures between 40 F and 70 F on sediment transport. The differences in scour and deposition were small, so a temperature of 60 F was used in the rest of the model runs. Two hydrographs were based on the 1973 flood of record. The 25-step hydrograph (figure 11b) included initial and final periods with discharges of 70,000 cfs, and the 21-step hydrograph (figure 12) omitted these steps. The stage comparison between the 21-step hydrograph and the 1973 flood stage record is shown in figure 12.
Simulation Results
The results of the 1973 flood simulations are shown in figures 13a and 13b. Figure 13a shows the change in bed elevation from mile 325 to mile 337 at selected times during the flood. At 35 days the discharge is 130,500 cfs (see figure 11b) and there has been very little change in bed elevation. At 77 days the first peak of 310,000 cfs has passed and the discharge has dropped to 225,000 cfs. Mile 329 is at the center of Quincy
Figure 11. Hydrographs used in HEC-6 modeling
32

Figure 12. Comparison of the 21-step hydrograph for the model with the 197S flood stage record for Pool 21
Figure 13. Model bed elevation changes for the 1973 flood
33

Bay and will be used to illustrate the changes in the bay area. At this time 0.05 foot of sediment has been deposited at this section. The peak model discharge of 365,000 cfs occurs between days 79 and 83. By day 127 the discharge has dropped to 210,000 cfs and 0.11 foot of sediment has accumulated at mile 329. Day 177 is the last day of the model run of the 1973 flood and is at the end of a month with a discharge of 70,000 cfs. At this time the total deposition at mile 329 is 0.12 foot. The variation in elevation of the thalweg (deepest point in the channel) over time for miles 327 through 331 is shown in figure 13b. The section at mile 328 corresponds with the railroad embankment, so the restricted channnel width results in a lower thalweg than at mile 327. The narrow channel also causes greater change in elevation than at the other cross sections.
The amount of change in bed elevation as determined by the HEC-6 model run is an average over the width of the channel. In this discussion the Quincy Bay area is defined as extending from river mile 330 downstream to mile 328. In this two-mile reach the main channel is quite uniform, with a width between 2200 and 3000 feet and a surface area of 727 acres. The bay area varies in width from 4300 to 8300 feet and has a surface area of 1230 acres. If the deposition of 0.12 foot at mile 329 is applied to this area, the total volume of sediment deposited in the bay area by the simulated 1973 flood is 147 acre-feet or 161,000 tons of sediment with a unit weight of 50 pounds per cubic foot. The section at mile 330 shows a net scour of 0.15 foot, from which the channel at mile 329 may be estimated to scour about 0.09 foot. For the average deposition to equal 0.12 foot, the deposition in the bay would have to be 0.24 foot. This is equivalent to 300 acre-feet or 327,000 tons of sediment deposition in the bay during the 1973 flood.
The average depth of sediment deposited in Quincy Bay during a flood like the 1973 flood, which was approximately a 100-year event, is between 0.12 and 0.24 foot on the basis of the HEC-6 modeling. Less sediment will be deposited during floods of lesser magnitude, but how much less is not clear. The discharges from table 7 and a 30-day duration provide an estimate of the effect of floods of various return periods from 1 to 100 years. The rise and fall of any particular flood will change the sediment transport and scour and deposition amounts, but the impact will be similar for similar maximum discharges.
The 30-day HEC-6 model runs gave deposition depths at mile 329 of 0.01 foot for 130,500 and 200,000 cfs; 0.02 foot for 300,000 cfs; 0.03 foot for 349,000 cfs; and 0.04 foot for 374,000 cfs. If these seem small compared to the 1973 flood modeling, recall that the flood hydrograph lasted almost 6 months with the discharge over 200,000 cfs for 3 months. If the three largest discharges were run for 90 days, the deposition would be about three times greater, or 0.06, 0.09, and 0.12 foot for 300,000, 349,000, and 374,000 cfs, respectively. These amounts of deposition are equivalent to approximately 82,000, 123,000, and 164,000 tons of sediment.
34

SEDIMENT LOAD MEASUREMENTS Local drainage areas contribute large amounts of sediment per square
mile of watershed, or drainage basin area, and may account for a surprisingly large proportion of the sediment entering a lake or reach of a river (Bogner et al., 1984; Demissie and Bhowmik, 1985; Bhowmik and Adams, 1986).
To evaluate the current status of sediment transport in Quincy Bay, two input sources -- the upland drainage and the Mississippi River -- were examined. Sampling started on April 29, 1985 and was completed on June 10, 1986. Sediment loads from upland drainage areas were measured by sampling four sites on the major tributaries.
The sites and site codes were as follows: 1. Cedar Creek at the 5th Street bridge, CDC 2. Homan Creek at Spring Lake Country Club Road, HCC 3. Frazier Creek about 500 meters upstream of the bluff road, FCU 4. Frazier Creek at Indian Grave Road, FCD
The Quincy Bay outlet channel at the Quinsippi Island Bridge (QBB) was sampled by following the same regime as at the tributary sites.
The following types of data were collected at these sites: 1. Weekly or daily suspended sediment concentration samples during
storm or flood events. The Quincy Bay Bridge site was sampled daily up to the time of summer low flows.
2. Stage records. 3. Detailed water and sediment discharge records at 6-week
intervals (this varied' depending on the intermittent nature of the flow in these small streams).
Sediment flow from the Mississippi River through the bay was measured at three sites. Sediment flow in the river was determined by sampling at the railroad bridge. The sites and site codes were as follows:
1. Bay access channel 100 meters from mouth, ACC 2. Bay access channel at outlet to lower main bay, ACB 3. Quincy Bay outlet channel at the Quinsippi Island Bridge, QBB 4. Mississippi River at the railroad bridge, MSR
The following types of data were collected at each site: 1. Detailed water discharge and sediment load measurements. 2. Detailed sediment concentration samples.'from the river. These
were used along with discharge data supplied by the Corps of Engineers to determine sediment loads in the river.
3. Suspended sediment samples for particle size analysis. 4. Bed load.
Intensive sampling of water and sediment discharge in the Broad Lake/Long Lake complex was conducted during a flood event in spring 1986.
35

Methods
A single suspended sediment concentration sample was taken at a fixed location at each upland drainage site. Samples were taken by using a DH-59 sampler in the manner described by Guy and Norman (1970). River stage was also taken at this time by measuring down from the bridge railing to the water surface. To determine water discharge and sediment loads, detailed samples were taken periodically at 10 to 20 points along a cross section of the river close to the fixed sample site. The discharge was measured by summing the products of the partial areas of the stream cross section and their respective average water velocities. The formula
represents the computation where Q is total discharge, a is an individual partial cross-sectional area, and v is the corresponding mean velocity of the flow in the partial area (Buchanan and Somers, 1969). The water velocity was measured with a standard Price-type meter.
Suspended sediment concentration samples were taken at the discharge measurement points by using standard methods (Guy and Norman, 1970). Sediment load was computed as the product of the suspended sediment concentration and the discharge for a given cross section. These data along with stage data were used to develop a mathematical relationship that allowed calculation of sediment load from the single sediment samples. This was done for each upland site as well as the Quincy Bay Bridge site.
In Quincy Bay, detailed measurements were made at five points along a cross section at sites ACC and ACB. These measurements were used to determine water discharge and sediment load. The methodology was similar in principle to the methods used for the upland sites but was modified for boat sampling. Suspended sediment samples were taken at the MSR site by using the bridge spans for reference. Suspended sediment samples for the purpose of particle size analysis were taken by compositing samples from each point along a sample cross section.
Bed load is that portion of the total sediment load that is transported in contact with or very close to the bed of a stream. The bed load was sampled by using a Helley-Smith Bed Load Sampler (Helley and Smith, 1971). A point was selected in the area of highest flow. The sampler was lowered to the bed for 5 minutes and then raised. The sample was then removed for analysis.
Sediment Inputs from the Mississippi River
The peak inputs of water and sediment from the Mississippi River occurred during spring flood periods. Seasonal trends in measured discharge and sediment load were similar for all sample sites (figure 14); measured values are given in table 8. Sediment loads in the river (site
36

SAMPLE DATES Figure 14. Measured water and sediment fluxes in Quincy Bay
(ACC = bay access channel 100 meters from mouth; ACB = bay access channel at outlet to lower main bay; QBB = Quincy Bay outlet channel
at Quinsippi Island Bridge)
37

Table 8. Measured Water Discharges and Sediment Loads in Quincy Bay and the Mississippi River
ACC - bay access channel 100 meters from mouth; ACB - access channel at outlet to lower main bay; QBB - Quincy Bay outlet channel at Quinsippi Island Bridge; MSR - Mississippi River at railroad bridge
MSR) ranged from a high of 246,768 tons/day on May 22, 1986 to a low of 10,338 tons/day on September 12, 1985. Sediment loads at the upstream access channel site (ACC) ranged from a high of 5086 tons/day on April 1, 1986 to a low of 262 tons/day on June 28, 1985. Loads at the downstream access channel site (ACB) ranged from a high of 6404 tons/day on May 16, 1985 to a low of 386 tons/day on June 28, 1985. The sediment load measured at the Quinsippi Island Bridge (QBB) ranged from a high of 10,650 tons/day on May 22, 1986 to a low of 266 tons/day on September 12, 1985.
During a flood on April 23, 1986, two sites in the upper bay (Willow Slough) were sampled for discharge and sediment loads. At the upper end of Willow Slough, discharge was 1412 cfs and sediment load was 258 tons/day. The discharge and sediment load from the lower end of Willow Slough were 1543 cfs and 261 tons per day, respectively.
An unusual trend in the stage-discharge relationships occurred at the access channel sites. In the normal relationship between river stage and discharge, the discharge increases as river stage increases. In the case of the access channel, discharge increased with river stage at low to moderate levels; at high stages, however, discharge in the access channel decreased significantly (figure 15). At site ACC the highest discharge (8566 cfs) occurred at a stage of 16.04; however, the lowest discharge (1790 cfs) occurred at a stage of 20.83.
The stage-discharge relationship at the QBB site does not show this pattern (figure 15). These data indicate the following overall stage-discharge relationship based on the gage at Quincy: At stages of 11.5 feet (470.1 feet msl) and below, which occur 80% of the time, the access channel provides all the flow into the bay with no upper bay flow. As stages approach 11.9 feet (470.6 feet msl) some upper bay flow occurs. By a stage of 12.8 feet (471.4 feet msl), which occurs 10% of the time, flow occurs in both the access channel and upper bay. As river stage reaches 16.5 feet (475.1 feet msl), which occurs 6% of the time, the flows in the upper bay and access channel are about equal. At stages above 475.1 feet msl, upper bay flow is much greater than flow from the access channel. Under these conditions the flow in the access channel is actually reduced. Therefore, at low to moderate stages the main input of water and sediment from the
38

DISCHARGE IN THOUSANDS OF cfs Figure 15. Stage-discharge relationships for Quincy Bay gaging sites
(ACC = bay access channel 100 meters from mouths ACB = bay access channel at outlet to loiter main bays QBB = Quincy Bay outlet channel
at Quinsippi Island Bridge)
river to the bay is through the access channel. At high stages during floods the main input of water and sediment from the river is from overland flow through the upper bay.
Prior to the construction of the access channel, the flow into the bay was through two sources (figure 5a). At low to moderate stages flow came in through the main bay outlet channel, with the direction of flow dependent on the river stage. During rising stages water would back up into the bay through the bay outlet. Flow during falling stages was out to the river. The second pattern occurred during high stages (e.g., floods) when overland flow occurred. As the river topped, overland flow from upstream would move through the bay and out the main bay outlet channel. Under these conditions transport of sediment to the upper bay and Broad Lake-Long Lake occurred mostly during flood events.
After construction of the access channel, the flow pattern changed. Under present conditions, during low to moderate stages the flow into the bay is from the access channel (figure 5b). Comparisons of discharge, sediment loads, and stage from the access channel sites show that the following patterns occur: Under conditions of rising stage some flow from the access channel circulates up through Broad Lake-Long Lake, and some
39
flows directly out to the lower main bay. At stable stages most of the flow will be through the access channel and out to the lower main bay. At high stages (e.g., floods) overland flow occurs, directing flow down through the bay and Broad Lake, and out the main bay outlet channel. This in effect greatly reduces flow to the access channel. Under current conditions flow, along with its associated sediment loads, enters from the river at all times. In contrast, before the access channel construction, sediment input occurred for the most part only during flood conditions.
The particle size characteristics of the suspended sediment are given in table 9. In all but two samples, more than 90% of the particles were smaller than sand (63 microns). The percentages of particles smaller than sand in those two samples were 73% (Mississippi River site on April 22, 1986) and 70% (Quincy Bay outlet channel site on May 22, 1986).
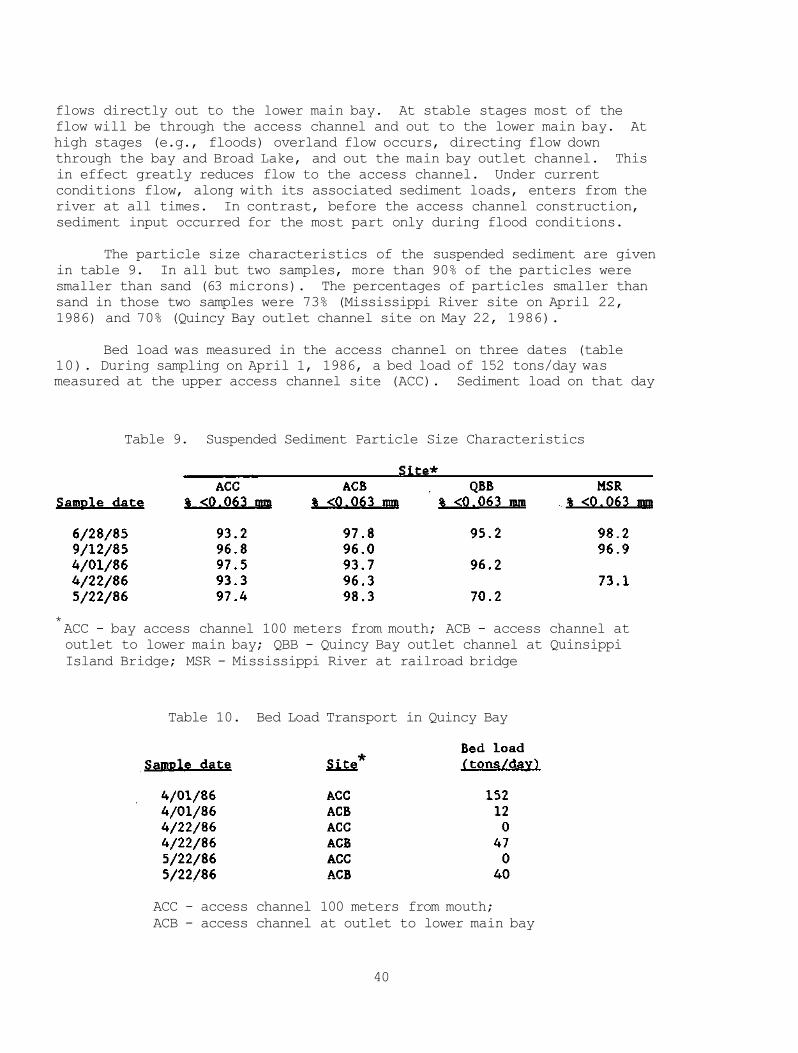
Bed load was measured in the access channel on three dates (table 10). During sampling on April 1, 1986, a bed load of 152 tons/day was measured at the upper access channel site (ACC). Sediment load on that day
Table 9. Suspended Sediment Particle Size Characteristics
* ACC - bay access channel 100 meters from mouth; ACB - access channel at outlet to lower main bay; QBB - Quincy Bay outlet channel at Quinsippi Island Bridge; MSR - Mississippi River at railroad bridge
Table 10. Bed Load Transport in Quincy Bay
ACC - access channel 100 meters from mouth; ACB - access channel at outlet to lower main bay
40

was 5086 tons/day, giving a total load of 5238 tons/day. Total load is simply the sum of the suspended sediment load and the bed load. At the lower access channel site (ACB), bed load was measured at 12 tons/day. Suspended load was 3971 tons/day, yielding a total load of 3983 tons/day. Sampling on April 22 and May 22, 1986 yielded no measurable bed load at the upper access channel site (ACC). Bed loads at the lower access channel site (ACB) on April 22 and May 22, 1986 were 47 tons/day and 40 tons/day, respectively. These contributed to total loads of 1544 tons/day on April 22 and 2466 tons/day on May 22. In all cases the bed load made up less than 3% of the total sediment load.
Sediment Inputs from Upland Drainage
The discharges and sediment loads at the upland sites are shown in figures 16 to 19. Day 1 in these figures is the first day samples were collected: April 29, 1985. The final sampling date was June 10, 1986. A peak discharge of 8.3 cfs for the Frazier Creek upland site (FCU) occurred on August 15, 1985; however, a peak sediment load of 28.8 tons/day was measured on July 14, 1985 following a heavy rain (figure 16). For Homan Creek (HCC) peak discharge and sediment load values of 37.7 cfs and 153.4 tons/day, respectively, occurred on July 14, 1985 (figure 17). The peak values for Frazier Creek drainage (FCD) were 59.4 cfs and 346.4 tons/day, both occurring on July 14, 1985 (figure 18). For Cedar Creek (CDC) the
DAY OF SAMPLE PERIOD
Figure 16. Measured water and sediment fluxes in Frazier Creek
41

DAY OF SAMPLE PERIOD
Figure 17. Measured water and sediment fluxes in Homan Creek
DAY OF SAMPLE PERIOD
Figure 18. Measured water and sediment fluxes at Frazier Creek mouth
42

DAY OF SAMPLE PERIOD
Figure 19. Measured water and sediment fluxes in Cedar Creek
peak discharge and sediment loads were measured during a complete stream sampling on October 10, 1985 (figure 19). Discharge and sediment load were 36.6 cfs and 31.1 tons/day, respectively.
The highest measured discharge and sediment load for the Quincy Bay outlet channel (QBB) occurred on different days (figure 20). The largest discharge, 42,018 cfs, was measured on May 19, 1986, and the largest sediment load, 66,596 tons/day, was measured on July 15, 1985 (figure 20). Discharge and sediment load peaks were of short duration and were associated with storm runoff events. The main inputs of sediment from the upland drainage sources occurred over short durations during spring floods and storm events throughout the year.
WATER AND SEDIMENT BUDGETS
Water and sediment budgets for Quincy Bay were computed for the year of this study (to make maximum use of the field measurements) and also for an average year. The average annual budget can be compared with the results of the sedimentation survey which define sedimentation over a number of years.
The water volumes in acre-feet and the sediment loads in tons for a one-year period during this project are given in table 11. The flood
43

DAY OF SAMPLE PERIOD
Figure 20. Measured water and sediment fluxes at the Quinoy Bay Bridge
Table 11. Quincy Bay Water and Sediment Budgets, 1985-1986
overflow and part of the tributary amounts are calculated, and the other values are based on the field data collected during this project.
The normal annual precipitation for Quincy is 37.65 inches, which is equal to 6200 acre-feet of water. Lake evaporation for this part of Illinois is 35.87 inches per year (Roberts and Stall, 1967), or 5900 acre-feet of water. The net excess of precipitation over evaporation is about 300 acre-feet per year which is less than 0.1% of the 4 million acre-feet of water that flow into the bay in one year. Thus evaporation, transpira-
44

tion, and precipitation have negligible effects on the water budget and are not included in tables 11 or 12.
Discharge measurements are rated as fairly good if they are accurate within 10%. The outflow in table 11 exceeds the inflow by 11.8%. The access channel and bay outlet channel flows are based on six actual measurements and a relation between discharge and river stage at Quincy for these measurements. The flood inflows are based entirely on river stage-duration data. If any or all of these is assumed to be accurate within 10%, the range of inflows is between 3,600,000 and 4,400,000 acre-feet and the range of outflows is between 4,100,000 and 5,000,000 acre-feet. It is likely that the flood inflows are underestimated and that there is flow into the bay along the Indian Grave Drainage District levee and into Willow Slough at intermediate stages. The latter flows are not included and would be very hard to estimate.
The sediment budget shows a net deposition of 303,000 tons, or 21.6% of the sediment which entered the bay. Concerns similar to those above about accuracy apply to sediment measurements. If the water inflows were adjusted upward to balance the water budget, the estimated amount of sediment entering the bay would increase, which would increase the estimated amount of sediment deposited in the bay.
Sediment also enters the bay as bed load during high flows in the Mississippi River. A few measurements verified bed load movement in the access channel at rates up to 152 tons per day on a day when the suspended sediment load was 5086 tons per day. The bed load was 3% of the suspended load that day. Nakato (1981) suggests a bed load to suspended load ratio of 15% for this part of the Upper Mississippi River Basin. At 15%, bed load would add 47,000 tons per year to the sediment inflow and to the sediment deposited in the bay.
Thus the sources of sediment during the project period were as follows: flood overflow from the Mississippi, 985,000 tons, 70.3%; access channel, 314,000 tons, 22.4%; and tributaries, 102,000 tons, 7.3%. Bed load through the access channel would add 47,000 tons or 3.4% to the total sediment entering the bay and 15.6% to the sediment deposited in the bay.
The values in table 12 are a best estimate of the average annual water and sediment budgets based on our measurements and other available data. The 384,100 acre-feet excess of water outflow is an imbalance of 12.3%, which is similar to the imbalance in table 11. The bay outlet and access channel water volumes are based on data collected during this project. The other water volumes are calculated from project data and recorded flows. The water volumes and sediment loads for inputs associated with the Mississippi River are adjusted for the fact that Water Year 1985 exceeded the long-term average discharge at Keokuk by 29%.
Sediment inflow by source is shown in figure 21a. The sediment budget (figure 21b) shows that 22.4% of the sediment entering the bay area accumulates there. The sediment budget needs to be carefully interpreted because neither sediment inputs to the bay from the several sources nor
45

Table 12. Average Annual Quincy Bay Water and Sediment Budgets
likely places of sediment deposition are uniformly distributed throughout the bay. The following discussion deals with sources and their likely contribution to sediment accumulation in various parts of the bay.
Flood overflows bring an average of 764,000 tons of sediment into the bay each year. This is assumed to be distributed uniformly over the total bay area excluding Triangle Lake and the upper main bay. This is 70% of the total sediment entering the bay and is equal to 389 tons per acre per year. Table 12 shows that 22.4% of the sediment entering the bay is deposited in it. Deposition of 22.4% of 389 tons is 87 tons per acre per year. This value will be used for all land and water areas in the bay area except for the areas excluded above. Assuming a unit weight of 50 pounds per cubic foot for newly deposited sediment, this is an annual accumulation rate of 0.08 foot.
A particular issue is the trap efficiency of Triangle Lake and the amount of sediment from Frazier Creek and the drainage district that enters the bay. At normal pool, the trap efficiency of Triangle Lake is zero. However, during flood stages its trap efficiency could be as high as 50% and originally was nearly 70%. If 50% of the Frazier-Homan Creeks sediment load of 54,000 tons is deposited in Triangle Lake, the amount of sediment entering the rest of the bay is reduced by 27,000 tons. The drainage district pumpage is estimated to carry about 13,000 tons of sediment, and half of this would also be deposited in Triangle Lake.
The sediment that enters the main bay through Triangle Lake will primarily affect the areas called the Triangle Lake access area and the middle main bay. These two areas have a surface area of 76 acres. If 22.4% of the 33,700 tons of sediment which enter the bay from Triangle Lake is deposited in this area, it will amount to 7500 tons, which is equal to 0.09 foot. This plus the flood overflow sedimentation rate add up to 0.17 foot per year, which is nearly equal to the rate for the middle main bay that was determined by the sedimentation survey. Nonuniform distribution of flood deposition or lower than average trap efficiency for this area can account for this difference. Also the trap efficiency of Triangle Lake was higher in earlier years.
46

Total = 1,096,000 tons per year
a. Sediment inflows
Total = 1,096,000 tons per year
b. Sediment budget
Figure 21. Sediment inflows by source, and sediment budget
47

The area of next greatest interest is the lower Broad Lake/lower access channel area. This area was created by the dredging of sand for the railroad embankment in the late 1950s and was initially about 20 feet deep. The sedimentation survey results for this area gave very high rates of 0.72 to 1.55 feet per year. In addition to flood overflow, since 1969 the material delivered to this area has included the suspended sediment which enters through the access channel, some bed load from the Mississippi, and the material scoured from the access channel. The greatly enlarged cross-sectional area at this location has caused much of this sediment to be deposited here. Annually some 243,000 tons, or 22.2% of the total, of suspended sediment enters the bay through the access channel.
General estimates of bed load are between 5 and 25% of the suspended load. As stated previously, Nakato (1981) suggests 15% as a good value for this portion of the Mississippi River basin. This would add about 37,000 tons of sediment, which could all be deposited in the area under discussion. Between 1969 and 1975 about 100 acre-feet of material were scoured from the access channel, and this material would also have been deposited in this area. Assuming that flooding was the only source of sediment deposited in lower Broad Lake between 1959 and 1969, about 0.8 foot of sediment would have accumulated. The material scoured from the access channel would have added about 2.5 feet between 1969 and 1975. Flood deposition would have added another 0.5 foot, and the bed load at 37,000 tons per year would have added 5.0 feet. Without considering the suspended load entering through the access channel, the depth of lower Broad Lake would have been 19.2 feet in 1969 and 11.2 feet in 1975. The 1975 survey found an average depth of about 8.5 feet, which suggests that about 3 feet probably was filled with deposited suspended sediment from the access channel.
If the average trap efficiency of 23% is applied to the suspended sediment entering through the access channel, an additional 56,000 tons of sediment would be deposited in the lower part of Broad Lake each year. This would be 1.2 feet per year. However, our field data show that about the same amount of suspended sediment flows into the main bay from the lower access channel as enters through the access channel. So the approximately 0.5 foot of sediment per year needed to complete the filling of lower Broad Lake to a depth of 8.5 feet by 1975 could easily have been made up of suspended sediment from the access channel. The recent measurements, which indicate transport through the lower access channel with moderate amounts of deposition or scour, are affected by the nearly complete separation of lower Broad Lake from the lower access channel by sediment. At normal water stages the flow through the access channel and out the bay outlet is channelized, and little net change in depth will occur over the course of a year.
REMEDIAL MEASURES
Any remedial measure or change in the physical characteristics of the bay must be placed in the context of the continuing processes of erosion,
48

sediment transport, and sediment deposition. Human activities such as building navigation dams and railroad embankments or opening access channels and closing side channels do change the location of scour and deposition within the river and its backwaters. However, natural processes go on despite human intervention. The Mississippi River carries over 10 million tons of sediment per year. Sediment carried by tributaries is deposited wherever the stream velocity is reduced below that needed to transport the sediment. The upper end of the bay and Triangle Lake are good examples of such places. This section presents a number of possible actions, discusses the merits of each, and establishes some recommendations and priorities.
Proposed Remedial Actions
A list of possible remedial measures is presented below without any indication of ranking, feasibility, or priority. Costs and benefits will be determined by the Rock Island District, Corps of Engineers. Recommendations have been developed on the basis of comments by the Corps of Engineers, U.S. Fish and Wildlife Service, Illinois Department of Conservation, and William Klingner, consultant to the Quincy Park District. The sediment budget and source analyses in this report also were used in developing the recommendations.
Potential Remedial Measures A. Access Channel
1. Close access channel 2. Control flow with weir or rigid channel 3. Bypass sand around entrance
B. Triangle Lake 1. Dredge 2. Repair levee and install outlet control 3. Divert Frazier-Homan Creeks to Mississippi River
C. Selective Dredging 1. Lower Broad Lake 2. Upper and middle bay 3. Bay outlet shoreline
D. Whole Bay 1. Implement "Best Management Practices" on agricultural land in
the tributary watersheds 2. Build dike across bay from corner of levee to spur dike
upstream of railroad embankment; at elevation 482 flow would be diverted 95% of time
3. Open new channel from Canton Chute into Willow Slough 4. Dredge entire bay to some "original" condition 5. Take no action
Except for D1, D4, and D5, all the remedial measures listed above are located by shading and by code number on figures 22, 23, and 24. Items D4 and D5 are included in the above list for completeness.
49

Access Channel
Figure 22 shows the locations of the remedial measures for the access channel. The first remedial measure, A1, suggested by local residents, would stop the influx of water and sediment into Quincy Bay at mile 329. The circulation pattern in the bay would return to what it was before the opening of the access channel, with flow through the bay outlet channel controlled by river stage at mile 327. Sedimentation rates in Broad Lake would decrease from those of the recent past, but the accumulated sediment would remain in place in Broad Lake and its connecting sloughs and channels.
The constriction of the access channel to its original design cross section (A2), with a bottom width of 50 feet and a depth of 6 feet with the water surface at elevation 470, would allow recreational boaters to pass through while limiting the water and sediment flow through the channel. This would require a rigid channel, which would be difficult to build on the sand in the existing channel, which has scoured to a much larger size than this and which carries a large water and sediment load into the bay. A short submerged weir section would be less expensive, but would probably cause extremely turbulent flow and danger to boats attempting to pass through the control structure.
Sand bypassing (A3) has been used at coastal inlets where protective jetties have blocked the movement of sand past the inlet by the long-shore currents. The usual goals are to prevent formation of a shallow bar across the mouth of the inlet and to prevent beach erosion on the down-drift side of the inlet. Here the intent would be to prevent bed load from entering the access channel by bypassing. Intermittent or continuous dredging is the common means of bypassing and requires equipment and operators.
Triangle Lake
Triangle Lake has been used for years by duck hunters, and the Illinois Department of Conservation has considered repairing the levees and installing a controlled outlet structure to enhance the lake for migrating waterfowl. Locations of the potential remedial measures for this area are shown in figure 23.
Much of the lake is now above normal pool level, and the rest is too shallow for motor boats at normal pool level. Dredging (B1) would return the lake to a useful depth and provide volume to allow for future sedimentation. Dredged material could be retained in the lake in selected areas that would be raised, perhaps to near-levee elevation.
whether or not Triangle Lake water levels are controlled for waterfowl, repair of the levees and installation of a controlled outlet (B2) would provide more space to trap sediment from Frazier-Homan Creeks and the drainage district. One concern about higher water levels in the lake is the effect on the cost and efficiency of pumping from the drainage district into the lake. W.H. Klingner, consulting engineer for the Quincy Park District, recommends that a levee be built to divert the drainage
50

Figure 22. Locations of remedial measures for the access channel
51

Figure 23. Locations of remedial measures for Triangle Lake and of selective dredging measures
52

district outlet to Willow Slough so that water level control of Triangle Lake will not increase the pumping head for the drainage district. The levee could be made of material dredged from the lake. The sediment load from the drainage district is small and consists of fine-grained material, so this should not cause a problem in Willow Slough or the middle main bay.
Both dredging and levee repair would enable Triangle Lake to trap and store sediment from Frazier Creek for some time, perhaps 15 to 30 years, before additional dredging would be required. Another suggestion (B3) is to divert the flow from Frazier-Homan Creeks and the drainage district directly to the Mississippi River. This would require construction of a channel across Quincy Bay for a distance of about 6500 feet. Sediment transport in the channel and backwater from river mile 330 would make scour or deposition in the channel very likely. A breach in the down-river berm forming the channel would allow this sediment to enter the bay area in Willow Slough or upper Broad Lake.
Selective Dredging
Dredging one or more of several popular parts of the bay identified in figure 23 would restore adequate depths for boats and fish movement. Table 13 presents the results of elutriation tests of Quincy Bay bed material, furnished by Richard Watson of the USCOE, Rock Island District. No detrimental impacts on water quality are indicated by these analyses. The areas most likely to be restored by dredging are lower Broad Lake (C1) and the main bay (C2, C3). The upper and middle main bay would be dredged to a depth adequate for power boating and water skiing. In the lower main bay (or bay outlet) area, where sediment deposition on ramps and near the shore makes boat access difficult, the purpose for dredging would be to permit boat access to the boat ramp, boat house, and marina.
Lower Broad Lake was formed by dredging for the railroad fill and could be restored by dredging, though there is probably no reason to make it as deep as it was in 1960. Bay bottom materials appear to be suitable for dredging and disposal. However, locations for placement of dredged material must be selected with care to avoid impacts on other aquatic or terrestrial habitats and to assure that the material is not carried back into the bay by storms or floods.
Whole Bay
Five actions (D1-D5) are grouped in this section for lack of more specific locations. Figure 24 shows the locations of actions D2 and D3. The first action, D1, which is recommended apart from its effect on Quincy Bay, is the implementation of Best Management Practices (BMP's) on the agricultural land in the tributary watersheds. This is important for the upland watersheds of Frazier, Homan, and Cedar Creeks, where erosion potential is as high as 10 to 12 tons per acre per year, according to the Adams County Soil and Water Conservation District. Preservation of fields and good soil productivity are sufficient reasons for implementing BMP's on these watersheds. In addition, any reduction in instream sediment loads
53

Table 13. Elutriation Test Results for Quincy Bay Bed Material (Concentrations in mg/1)
Illinois General Use Water Quality Standard If ammonia nitrogen is less than 15 mg/1 and greater than or equal to 1.5 mg/1, then un-ionized ammonia nitrogen shall not exceed 0.04 mg/1
Note: LBL - lower Broad Lake; LMB - lower main bay; LAC - lower access channel; MMB = middle main bay; UBL - upper Broad Lake
will extend the life of Triangle Lake and the middle portion of the main bay.
A dike across the bay from the corner of the drainage district levee to the spur dike upstream of the railroad bridge (D2) would protect the important parts of the bay from all but extreme floods. If the levee top is at elevation 482, flow into the bay from the Mississippi would be diverted 95% of the time. At elevation 482, the levee top would be about 8 feet below the top of the drainage district levee, and flood stages should not be increased much because the higher railroad embankment already blocks much of the bay area floodway for all flood events. This dike is intended to keep sediment and water from the Mississippi from entering the bay except through the outlet channel for all flows except the largest floods. The dike would be about 7000 feet long and would close the access channel.
A channel from Canton Chute into Willow Slough (D3) would bring Mississippi River fluxes into the upper reaches of the bay and would increase water velocities through much of the bay. It would also introduce sediment into the upper end of the bay and could cause additional sedimentation in areas that now have moderate sedimentation rates. Depending on the design, such a channel would have to be dug for 2500 to 5000 feet, and would be subject to scour and deposition.
54

Figure 24. Locations of remedial measures for the whole bay
55

All of the dredging proposed for Triangle Lake and the bay itself could be done with some additional areas included to restore the bay to some "original" condition (D4). Since the bay has been formed by a succession of human activities, the definition of original would be determined by those who choose the shape of the newly dredged Quincy Bay. Questions regarding cost effectiveness and dredged material disposal sites may make this a difficult option to implement.
The last option, D5, is the "no action" one. Under this option nothing would be done to change the existing processes of water circulation and sediment scour or deposition. Recreational boating, hunting, and fishing would decrease with the continued sedimentation. The bay area would shift toward terrestrial and wetland habitats and away from aquatic habitat. The access channel and bay outlet would continue to have significant water and sediment discharges passing through them and would attain a relatively stable condition, or dynamic equilibrium, in the near future.
This completes the introduction of possible remedial measures. Not all may be technically or economically feasible, but some of them or some combination should be feasible. The next section presents comments on each measure and discusses the merits of the best actions.
Advantages and Disadvantages of Remedial Actions
Several agencies and individuals reviewed a preliminary list of remedial measures and commented on them. These comments are summarized here along with some of the advantages and disadvantages of each action. The commentators and an abbreviated code for each one are: Rock Island District, U.S. Army Corps of Engineers (RID); Rock Island Field Office, U.S. Fish and Wildlife Service (FWS); Illinois Department of Conservation (DOC); W. H. Klingner, P.E., consulting engineer for the Quincy Park District (WHK); Adams County Soil and Water Conservation District (SWCD); and Allie J. Lymenstull, a local resident who reviewed the proposed measures for State Representative Jeff Mays (AJL). The measures are discussed in the order in which they were previously listed.
Access Channel
Closing the access channel is recommended by AJL and WHK, whether as measure A1 or as a result of measure D2. The RID questioned this because it would block recreational boat traffic between the Mississippi River and the middle and upper main bay, the original purpose of the access channel. They propose a new access channel at mile 328 facing downstream so as not to funnel as much water and sediment into the bay. As mentioned above, closing the access channel would stop the flow of sediment into the bay from the river during stages below 475 at Quincy, and would cause the circulation pattern in the bay to return to what it was before the access channel was opened. Closing the access channel would not prevent sediment from entering the entire bay from the river during stages over about 475, which occur 5% of the time at Quincy. However, this measure would reduce
56

the sediment entering the. bay by 22% and the sediment entering from the Mississippi by 24%.
Option A2 is acceptable to RID and FWS. The purpose of building a channel or control weir is to stop the scour in the access channel, which has increased the flow capacity of the channel. A lined channel would be about 2000 feet long and would reduce the water discharge by about 90% at normal pool and by about 85% at a stage of 16 feet at Quincy. The reduction in sediment loads is harder to estimate, but would be in proportion to the reduction in water discharge. Such a channel would be expensive and might be difficult to build and maintain. A control weir would be less expensive and would also reduce the flow of water and sediment through the access channel. However, the hydraulics of weir flow depend on head loss, so there would be turbulence which could make boat passage dangerous. If the weir developed critical flow with a large difference in water surface elevation, it would be impassable. Careful design would be needed and a notched closing dam with the notch at elevation 464 and the rest of the weir at elevation 472 might be a starting point for design. The channel banks would have to be protected to prevent scouring which could undermine or bypass the weir structure. Proper design can provide for safe boat passage.
The third access channel action is sand bypassing at the mouth, and RID considers this not to be feasible. Some of the conditions that are typical of the coastal inlet bypassing situation are not present. This has not been tried in a riverine setting; there is no structure to mount a bypass pipe on; and it would be expensive to provide bypassing capability. The system would be needed during high discharge conditions when dredge mooring would be difficult and changing shifts could be dangerous. Only bed load would be bypassed, and all the suspended load would continue to enter the bay through the access channel. Thus it is not likely that this will be a feasible solution.
Triangle Lake
Dredging of Triangle Lake (measure B1) is acceptable to the RID, but FWS objected to dredging or dredged material placement there since it is a state waterfowl refuge. Repairing the levee and providing a controlled outlet (B2) is accepted by RID, AJL, and WHK. WHK recommended a new levee top elevation of 482, which is considerably above the existing levee at approximately 474. In 1982 DOC asked the Water Survey to estimate the sedimentation rate in Triangle Lake because they were considering implementing a plan similar to A2 to provide duck food and an adequate depth of water for duck hunters in the fall. Dredging was not part of this plan, but it would be necessary if a permanently useful water depth is to be provided. This option would retain sediments from Frazier-Homan Creeks and the drainage district in Triangle Lake, which would benefit the middle main bay significantly. A good plan for sediment control and waterfowl habitat could be developed and implemented. WHK also recommends diverting the pump station outflow into Willow Slough so that water level control in Triangle Lake would not increase the pumping head and cost for the drainage district.
57

Diverting Triangle Lake inflows to the Mississippi (B3) would extend the useful life of the lake. Diversion to the Mississippi would require a 6500-foot-long channel across the bay area. This would be costly and would be susceptible to scour and sedimentation problems. The RID does not consider diversion to the river to be feasible. This measure is unlikely to be technically or economically feasible.
Selective Dredging
Several commentators favored various dredging schemes but called attention to the habitat disruption caused by dredging and dredged material placement. Lower Broad Lake dredging (measure C1) is approved by RID, AJL, and WHK; and WHK suggests obtaining material for the dike in measure D2 from Broad Lake. Upper and middle bay dredging (C2) is approved by RID and by FWS, who recommends deep (10-foot) holes in some of the sloughs for fish wintering. FWS has a primary concern about habitat preservation, development, and rehabilitation. Loss of quality backwater habitat is a primary concern, along with endangered species use. Endangered species using Quincy Bay include bald eagles, river otters, and recently established wild turkeys (not endangered, but being restored). Dredged material could be used to provide refuge from floods for birds and mammals in the bay area. Also concerned about dredged material placement, DOC suggests several disposal sites. Dredging in the bay outlet channel (C3) is considered a Park District responsibility by RID.
All comments support selective dredging to restore or improve water depths for boating and fisheries. Careful planning is needed so as not to impair one habitat while improving another. Because of various fish and wildlife considerations, dredging would be approved only with the full involvement of DOC and FWS. If additional tests beyond the elutriation tests reported above raise more serious sediment quality concerns, the Illinois Environmental Protection Agency would also be involved, and indeed is one of the permitting agencies. The extent of dredging would also be affected by the availability of funds since it is an expensive operation. If proper habitat restoration and development is demonstrated as the purpose of dredging, the rehabilitative measures might qualify for funding under the Environmental Management Plan for the Upper Mississippi River.
Whole Bay
A variety of proposals are lumped under this heading. The first action (D1) encourages implementation of "Best Management Practices" on agricultural land in the tributary watersheds. This is not a direct action in the bay area, but any reduction in erosion and soil particle transport into the bay would be beneficial. On the lands on the bluffs, conservation practices and proper land use would have direct benefits for the land and farmers. In recent years, cooperative agreements between lake owners and watershed landowners have been developed to control erosion and sedimentation. The Quincy Park District and the SWCD should explore such a possibility to expedite the implementation of BMP's on the agricultural lands in the Frazier, Homan, and Cedar Creek watersheds and in the Indian Grave Drainage District.
58

Measure D2, proposed by WHK, is the construction of a dike to keep most floodwaters from entering the bay area from the Mississippi River except by backwater through the bay outlet channel. We. suggest an elevation of 482 to block flows for all but 5% of the time and to provide 6 to 8 feet of freeboard on the Indian Grave Drainage District levee. This dike would extend 7000 feet from the corner of the drainage district levee to the upstream end of the spur dike which protects the railroad embankment. An alternate plan suggested by AJL would enclose even more of the bay, with the levee running nearly 5000 feet south-southwest from the levee at Canton Chute to the river's edge and then along the river bank for 9500 feet to the upstream end of the spur dike.
The RID raised the question of cost and considers this option unfeasible. The FWS has mixed comments. They,see some benefits to reducing sedimentation in Quincy Bay, but have concerns about the impact of extensive construction on wildlife. The dike would form some isolated backwaters on the upstream side which would be subject to sedimentation by flooding. The circulation pattern in the bay would be returned to what it was before the access channel was opened for stages below 475. A similar flow pattern, with floodwaters entering the bay through the outlet channel, would continue for stages up to 482 at mile 329 or 330. As WHK mentions, the dike would have to be armored against overtopping flows or would need to have a shallow spillway notch to let extreme floods enter the bay over the dike. The amount of habitat assessment that might be required and the cost of construction make this an unlikely choice.
Item D3 assumes some benefit from an upstream to downstream flushing flow through the bay from Canton Chute. Both RID and AJL object to this because more sediment would enter the bay and, although the actual flow path might remain usable, adjacent parts of the bay would experience increased sediment deposition. The cost of dredging a 2500- to 5000-foot-long channel would be high. The channel would be subject to scour and deposition of sediment and might have a short life and be detrimental to the bay habitat. This is therefore one of the least likely options.
More extensive dredging than described in the "C" options would restore more of the bay to greater depths. However, this would be another change for the bay and not a return to some previous condition. Dredged material placement is a large question, as is the impact on fish and wildlife habitats. Both RID and DOC (William Jansen, chief engineer) express doubts about this option because of the cost of dredging. For these reasons any dredging will almost certainly be done on a selective basis with careful consideration of habitat impacts and cost constraints.
The final option is to take no action and let natural processes continue to change the character of Quincy Bay. The RID requested that this be among the options considered, and FWS raised concerns about the loss of backwater habitat under this option. Immediate costs are obviously least if nothing is done. However, the nearly complete future loss of backwater aquatic habitat suitable for fish and perhaps for waterfowl is not acceptable to Quincy area boaters and sportsmen nor to DOC or FWS. Up to this time, each human action that has modified the hydraulic and
59

sedimentation regime of Quincy Bay has been followed by the no-action option until the next intervention has taken place. Only the diversion of drainage into Triangle Lake, the dredging of part of the Cedar Creek delta and the middle main bay, and the park district's clearing of sediment on boat ramps have been in response to sedimentation.
CONCLUSIONS AND RECOMMENDATIONS
Conclusions
The sedimentation survey of Quincy Bay quantified the present water volume of the bay and measured the amount of sediment in various portions of the bay. The present water volume of 1381 acre-feet is only 28% of the original. The rate of sedimentation between 1975 and 1985 was 4.9% per year in upper Broad Lake and 0.2% per year in the lower main bay. Average depths in the middle and upper main bay are about 2.5 feet, which is marginal for power boating. Upper Broad Lake, Long Lake, and Triangle Lake all have depths less than 1 foot at normal pool level. Lower Broad Lake has nearly been cut off from the access channel by deposition of a bar across its mouth.
Measurements of suspended sediment loads in Frazier, Homan, and Cedar Creeks and at three locations in the bay were combined with mathematical modeling of the 1973 flood and with the sedimentation survey results to determine the amount of sediment entering the bay from each of these sources. On the average, the annual amount of sediment which enters Quincy Bay is 1,096,000 tons. Of this sediment 243,000 tons (22.2%) enters through the access channel, 764,000 tons (69.7%) enters during flooding by the Mississippi River, and 89,000 tons (8.1%) is delivered by tributaries. About 245,000 tons, or 22.4%, of the sediment entering the bay is deposited within the bay. The tributary sediment loads impact Triangle Lake and the middle main bay much more than the rest of the bay, so their reduction will be important to boaters with docks and homes along the upper and middle main bay. Bed load enters the bay through the access channel during floods on the Mississippi River and may add 37,000 tons (3.4%) to the total. However, all of the bed load is most likely deposited in the lower access channel and lower Broad Lake.
Recommendations
The following recommendations are based on the information contained in this report and the comments from various reviewers and reviewing agencies.
A. Triangle Lake should be dredged, the levees repaired, and a controlled outlet structure installed to trap sediments from Frazier-Homan Creeks. The Indian Grave Drainage District pumped discharge should be channeled directly to Willow Slough. This will benefit waterfowl in the lake and will also reduce the amount of sediment entering the middle main bay.
60

B. Selective dredging should be done to benefit boaters in the upper, middle, and lower main bay areas. Selective dredging in upper Broad Lake, Long Lake, and Willow Slough can provide improved habitat for fish, otters, and waterfowl as well as islands for flood refuge within the bay. Lower Broad Lake will need to be dredged to provide access and flow to upper Broad Lake and Long Lake and may be dredged to a depth suitable for fish habitat.
C. Careful study of several other potential measures is recommended. First, the reduction of flow through the access channel needs to be subjected to careful hydraulic analysis. The long dike to keep all but the largest floods from overflowing the entire bay should be considered in conjunction with selective dredging after the likely reduction in sediment input to Quincy Bay is determined.
D. Implementation of conservation practices on the tributary watersheds should be done as quickly as possible. The Quincy Park District and Adams County Soil and Water Conservation District should cooperate on this action. Even moderate reductions in sediment delivery will extend the intervals between dredging in Triangle Lake and the middle main bay.
E. Natural habitat improvement and preservation must be incorporated in each planned action. Monitoring of sedimentation and other changes subsequent to any remedial measure is recommended to determine the effectiveness of the action and to document its results.
F. With this emphasis on natural habitat rehabilitation, each proposed action should be evaluated for inclusion as a project under the Environmental Management Plan for the Upper Mississippi River. Well-planned projects in Quincy Bay should qualify, and would benefit from project monitoring requirements in this plan.
These recommendations provide the directions in which action can be taken with the concurrence and cooperation of all the agencies with interests and responsibilities in the proper management of Quincy Bay. Some recommendations, selective dredging for example, can be undertaken as soon as agreement is reached on the dredged areas and the dredged material disposal, and funding is available. Others, such as construction of a long dike, are in an early preliminary stage of development, and will require detailed engineering analysis.
61

REFERENCES
Adams, J. Rodger, 1982. Quincy Bay: background analysis and a proposed plan of action. Illinois State Water Survey Miscellaneous Publication 69.
Bhowmik, N.G., J.R. Adams, A.P. Bonini, C.-Y. Guo, D.J. Kisser, and M.A. Sexton, 1981. Resuspension and lateral movement of sediment by tow traffic on the upper Mississippi and Illinois Rivers. Illinois State Water Survey Contract Report 269.
Bhowmik, Nani G., and J. Rodger Adams, 1986. The hydrologic environment of Pool 19 of the Mississippi River. Hydrobiologica, Vol. 136, pp. 21-30.
Bogner W.C, W.P. Fitzpatrick, and N.G. Bhowmik, 1984. Sedimentation survey of Lake Decatur. Illinois State Water Survey Contract Report 342.
Buchanan, Thomas J., and William P. Somers, 1969. Discharge measurements at gaging stations. Book 3, Chapter A8 in Techniques of Water Resources Investigations of the U.S. Geological Survey.
Bushue, L.J., 1979. Soil survey of Adams County. Illinois. U.S. Department of Agriculture, Soil Conservation Service, and Illinois Agricultural Experiment Station.
Demissie, Misganaw, and Nani G. Bhowmik, 1985. Peoria Lake sedimentation investigation. Illinois State Water Survey Contract Report 371.
Demissie, Misganaw, Basilis Stephanatos, and Nani G. Bhowmik, 1986. Hydraulic modeling for ecological research. In Water Forum '86, World Water Issues in Development, M. Karamouz, G.R. Baumli, and W.J. Brick, editors, ASCE, New York.
GREAT II, 1980. Dredging requirements work group appendix: draft. Great River Environmental Action Team.
Guy, Harold P., and Vernon W. Norman, 1970. Field method for measurement of fluvial sediment. Book 3, Chapter C2 in Techniques of Water Resources Investigations of the U.S. Geological Survey.
Helley, E.J., and W. Smith, 1971. Development and calibration of a pressure-difference bed load sampler. U.S. Geological Survey, Water Resources Division.
Hydrologic Engineering Center, U.S. Army Corps of Engineers, 1977. HEC-6 scour and deposition in rivers and reservoirs. Users Manual.
Hydrologic Engineering Center, U.S. Army Corps of Engineers, 1979. HEC-2 water surface profiles. Users Manual.
62

Laursen, E.M., 1958. The total sediment load of streams. Proceedings ASCE, Journal of the Hydraulics Division, Volume 84(HY1).
Lymenstull, A.J., 1975. Priorities on Quincy Bay area. Notes prepared for a meeting on June 17, 1975.
Nakato, Tatsuaki, 1981. Sediment-budget study of the Upper Mississippi River. Great II reach. Iowa Institute of Hydraulic Research, Report 227.
Roberts, Wyndham J., and John B. Stall, 1967. Lake evaporation in Illinois. Illinois State Water Survey Report of Investigation 57.
Toffaleti, F.B., 1969. Definitive computations of sand discharge in rivers. Proceedings ASCE, Journal of the Hydraulics Division, Volume 95(HY1).
Upper Mississippi River Comprehensive Basin Study Coordinating Committee, 1970. Fluvial sediment. Volume III, Appendix 6.
U.S. Army Corps of Engineers, Rock Island District, 1978. Map sheets 12 and J2, 1 inch = 400 feet, 2 foot contour interval.
U.S. Army Corps of Engineers, Rock Island District, 1980. Lock and Dam No. 21. Appendix 21, Master Reservoir Regulation Manual.
U.S. Geological Survey, 1971. Quincy West Quadrangle. 7.5 minute Topographic Map.
U.S. Geological Survey, 1981. Water resources data for Illinois. Volume 1.- Illinois except Illinois River basin. Water Data Report IL-80-1.
63