Embed Size (px)
Citation preview

Department of Natural Resourcesand Environmental Control
Sediment Management Strategy for Rehoboth Bay
Sediment Management PlanRehoboth Bay
STAC MeetingNovember 16, 2007
Sediment Management PlanRehoboth Bay
STAC MeetingNovember 16, 2007
Department of Natural Resourcesand Environmental Control
Sediment Management Strategy for Rehoboth Bay
• Improve planning for future dredging needs• Reduce the dependency on dredging
Goals of the StudyGoals of the Study
• Environmental data• Historical dredge records• Sediment characteristics• Hydrodynamics• Sediment deposition and erosion characteristics• Developing ways to strategize a long term
sediment management plan.
Study TasksStudy Tasks

Department of Natural Resourcesand Environmental Control
Sediment Management Strategy for Rehoboth Bay
1. Existing Conditions Assessment
2. Review of Historical Dredging and Disposal
3. Hydrodynamic Modeling
4. Shoaling Estimates
5. Sediment Management Alternatives
M&N’s Scope of WorkM&N’s Scope of Work

Department of Natural Resourcesand Environmental Control
Sediment Management Strategy for Rehoboth Bay
Task 1. Existing ConditionsTask 1. Existing Conditions

Department of Natural Resourcesand Environmental Control
Sediment Management Strategy for Rehoboth Bay
Study AreaStudy AreaRehoboth Bay is a shallow bar-built estuary with depths less than 6 to 7 ft (MLLW).
Rehoboth Bay has tidal exchange through the southern link to Indian River Bay and through the Lewes Rehoboth Canal. It also receives freshwater inflow from the many tidal creeks.
Six primary channel dredging projects within Rehoboth Bay:
•Lewes-Rehoboth Canal
•Love Creek
•Herring Creek
•Guinea Creek
•Wilson Creek
•Massey’s Ditch

Department of Natural Resourcesand Environmental Control
Sediment Management Strategy for Rehoboth Bay
Shoreline ChangeShoreline Change

Department of Natural Resourcesand Environmental Control
Sediment Management Strategy for Rehoboth Bay
Western ShorelineWestern Shoreline

Department of Natural Resourcesand Environmental Control
Sediment Management Strategy for Rehoboth Bay
Herring CreekHerring Creek

Department of Natural Resourcesand Environmental Control
Sediment Management Strategy for Rehoboth Bay
Lewes-Rehoboth CanalLewes-Rehoboth Canal

Department of Natural Resourcesand Environmental Control
Sediment Management Strategy for Rehoboth Bay
Task 2. Historical Dredging and Disposal
Task 2. Historical Dredging and Disposal

Department of Natural Resourcesand Environmental Control
Sediment Management Strategy for Rehoboth Bay
Fiscal Year Job Name Dredge
TypeDisposal
TypeArrival
DateDeparture
Date
Volume Removed
(CY)
1990 L & R CANAL -ROOSEV.INLET Pipeline Beach
Nourishment not avail not avail not avail
1994ROOSEVELT,
MURDERKILL, MISPILLION
PipelineMixed
(More than one type)
10/23/1994 12/15/1994 94,873
1998 IWW, REH. BAY TO DEL. BAY Pipeline Beach
Nourishment 10/28/1998 11/30/1998 29,557
2001 IWW, REH. BAY TO DEL. BAY Pipeline
Beach Nourishment and Upland
10/22/2001 3/1/2002 46,102
2004 ROOSEVELT INLET,DE. Pipeline Beach
Nourishment 8/25/2004 10/30/2004 180,745
USACE DredgingUSACE Dredging
In recent years USACE has only maintained the L-R Canal north of the Savannah Ave Bridge
Department of Natural Resourcesand Environmental Control
Sediment Management Strategy for Rehoboth Bay
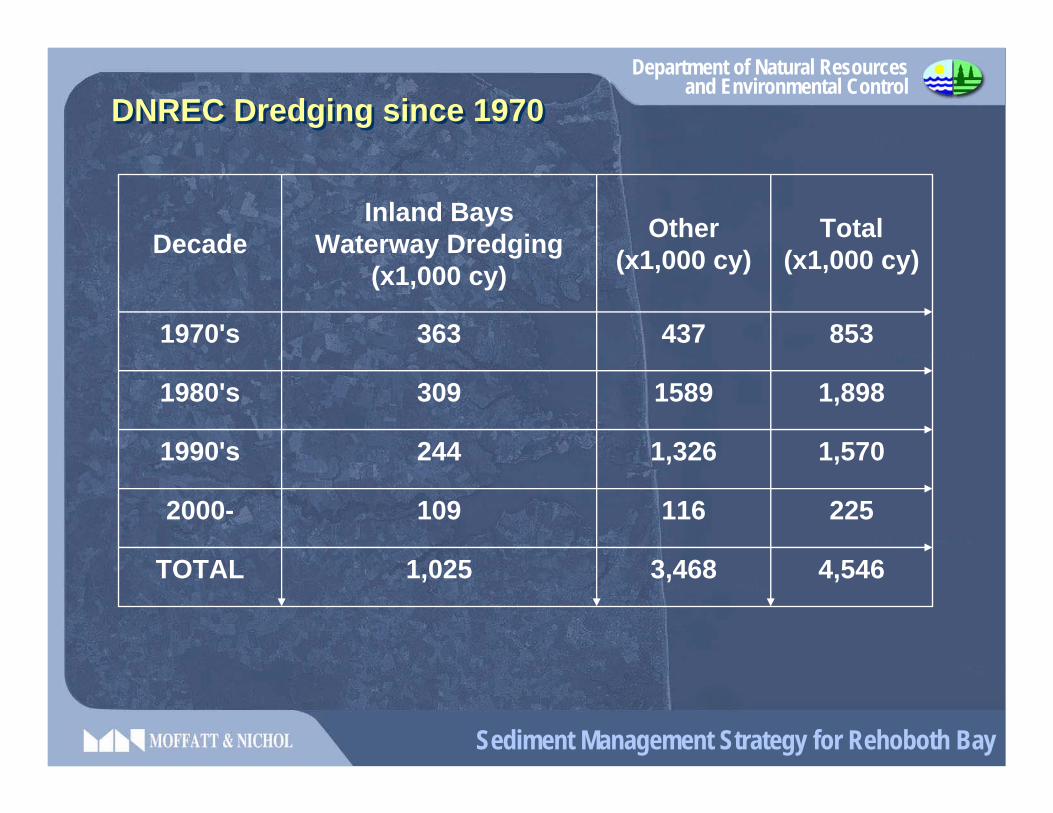
4,5463,4681,025TOTAL
2251161092000-
1,5701,3262441990's
1,89815893091980's
8534373631970's
Total(x1,000 cy)
Other(x1,000 cy)
Inland BaysWaterway Dredging
(x1,000 cy)Decade
DNREC Dredging since 1970DNREC Dredging since 1970

Department of Natural Resourcesand Environmental Control
Sediment Management Strategy for Rehoboth Bay
WATERWAY YEAR TOTAL Initial Maint.Lewes-Rehoboth Canal 1989 TO 1991 40 40Love Creek 1970 TO 1971 115 115Herring Creek 1978 TO 1983 85 85Guinea Creek 1977 75 75Wilson Creek 1983 27 27Cozy Cove 1978 TO 1979 18 18Massey’s Ditch 1987, 1990 TO 1991 62 62
Indian River Bay 91 TO 1992, 1995 TO 1996, 2001 147 147
Pepper Creek 1986 TO 1988, 1991 TO 1993 220 220Vines Creek 1993 7 7White Creek 970 TO 1971, 1997, 1999 TO 200 195 135 60Assawoman Canal 2006 34 34
Grand Total Navigation 1,025 682 343Average Annual Maintenance 9.3
DNREC Dredging in Inland BaysDNREC Dredging in Inland Bays

Department of Natural Resourcesand Environmental Control
Sediment Management Strategy for Rehoboth Bay
Task 3. Hydrodynamic ModelingTask 3. Hydrodynamic Modeling

Department of Natural Resourcesand Environmental Control
Sediment Management Strategy for Rehoboth Bay
DELFT 3D Modeling SystemDELFT 3D Modeling System
An integrated surface water modeling system developed by WL | Delft Hydraulics
Two and three-dimensional flow, waves, water quality, ecology, sediment transport and bottom morphology

Department of Natural Resourcesand Environmental Control
Sediment Management Strategy for Rehoboth Bay
Model GridModel Grid

Department of Natural Resourcesand Environmental Control
Sediment Management Strategy for Rehoboth Bay
Bathymetry DataBathymetry Data
USACERoosevelt Inlet (Lewes Rehoboth Canal)
2005
DNRECBald Eagle Creek2000
DNRECGuinea Creek1998
DNRECHerring Creek2004
DNRECLove Creek2004
NGDC (GEODAS)Offshore1963,1970,1977, 1984
DNRECInland Bays2004
USACEIR Inlet and Surrounding areas2004
SourceCoverageDate

Department of Natural Resourcesand Environmental Control
Sediment Management Strategy for Rehoboth Bay
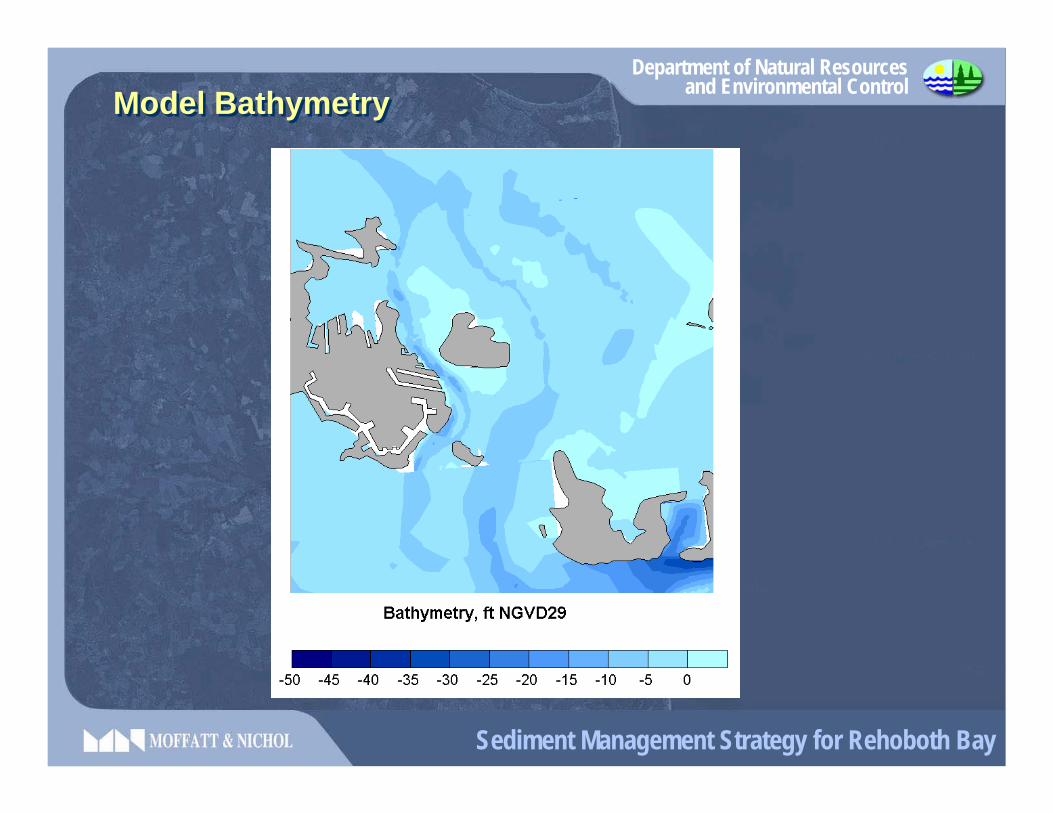
Model BathymetryModel Bathymetry
Department of Natural Resourcesand Environmental Control
Sediment Management Strategy for Rehoboth Bay
Model BathymetryModel Bathymetry
Department of Natural Resourcesand Environmental Control
Sediment Management Strategy for Rehoboth Bay
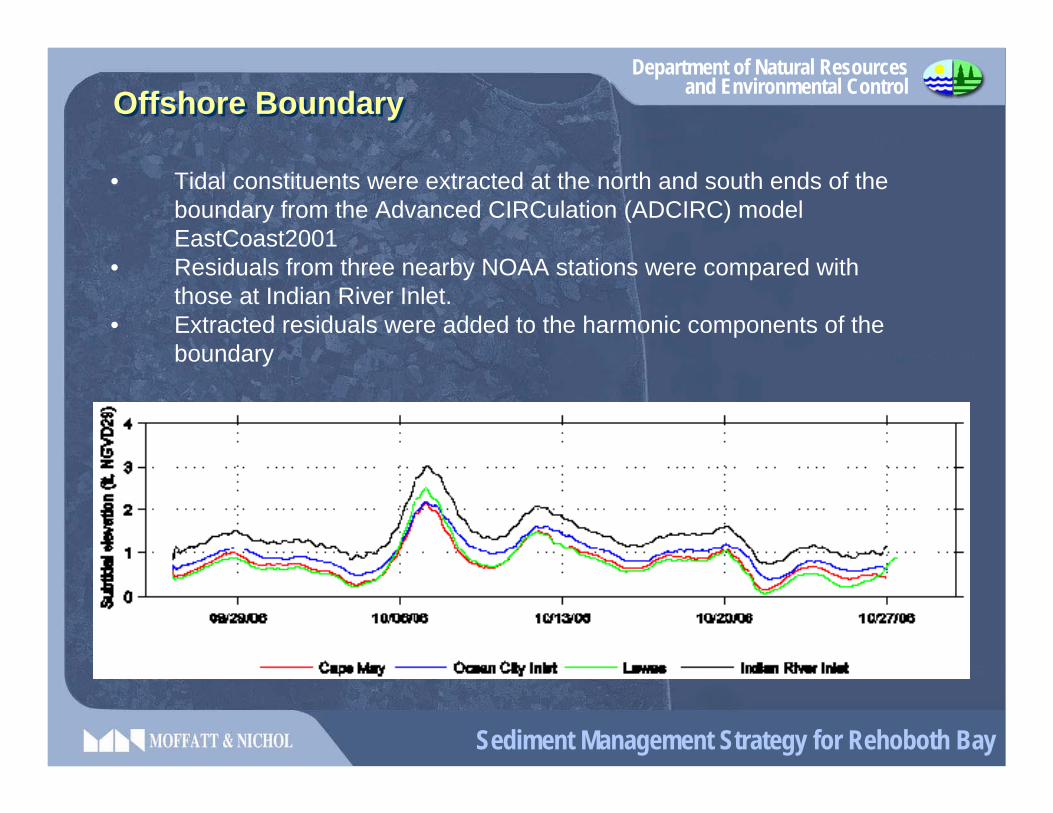
Offshore BoundaryOffshore Boundary
• Tidal constituents were extracted at the north and south ends of the boundary from the Advanced CIRCulation (ADCIRC) model EastCoast2001
• Residuals from three nearby NOAA stations were compared with those at Indian River Inlet.
• Extracted residuals were added to the harmonic components of theboundary

Department of Natural Resourcesand Environmental Control
Sediment Management Strategy for Rehoboth Bay
Additional ForcingAdditional Forcing
• River Discharge was found to have negligible effects on hydrodynamic conditions with the exception of Indian River.
• Wind forcing has the greatest impact in Rehoboth Bay. The closest available source for the tested time periods was at Georgetown-Sussex Airport

Department of Natural Resourcesand Environmental Control
Sediment Management Strategy for Rehoboth Bay
CalibrationCalibration

Department of Natural Resourcesand Environmental Control
Sediment Management Strategy for Rehoboth Bay
Harmonic CalibrationHarmonic Calibration
05/01/02 05/08/02 05/15/02 05/22/02 05/29/02
−1
−0.5
0
0.5
1
Ele
vatio
n (f
t)
Station Correlation RMS error (ft) Percent error Indian River Inlet (Coast Guard Station)
0.99 0.20 5.8%
Indian River Bay (Rosedale Beach) 0.99 0.13 4.3%
Rehoboth Bay (Dewey Beach) 0.98 0.08 5.3%

Department of Natural Resourcesand Environmental Control
Sediment Management Strategy for Rehoboth Bay
Water Level CalibrationWater Level Calibration
05/01/02 05/08/02 05/15/02 05/22/02 05/29/02
−2
−1
0
1
2
3
4
Ele
vatio
n (f
t, N
GV
D29
)
Station Correlation RMS error (ft) Percent error IRI (Coast Guard Station)
0.98 0.22 4.5%
Indian River Bay (Rosedale Beach)
0.98 0.25 5.2%
Rehoboth Bay (Dewey Beach)
0.95 0.27 8.4%
Department of Natural Resourcesand Environmental Control
Sediment Management Strategy for Rehoboth Bay
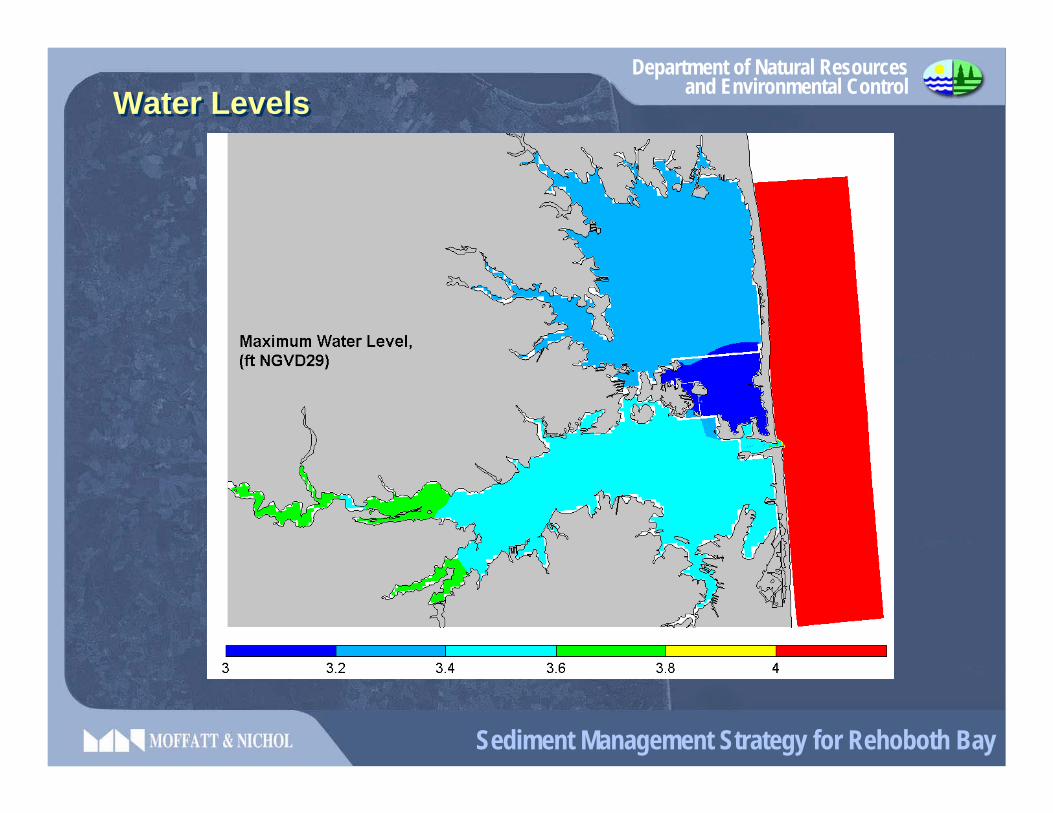
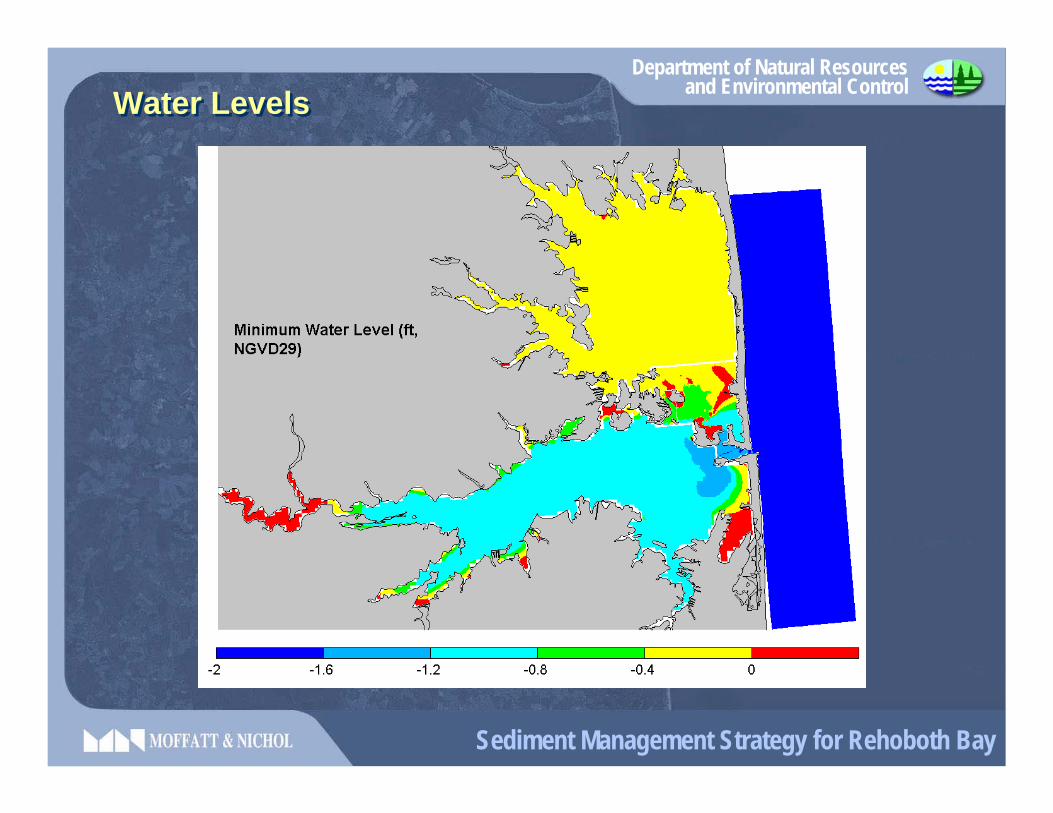
Water LevelsWater Levels
Department of Natural Resourcesand Environmental Control
Sediment Management Strategy for Rehoboth Bay
Water LevelsWater Levels

Department of Natural Resourcesand Environmental Control
Sediment Management Strategy for Rehoboth Bay
Maximum velocitiesMaximum velocities

Department of Natural Resourcesand Environmental Control
Sediment Management Strategy for Rehoboth Bay
Task 4. Shoaling CalculationsTask 4. Shoaling Calculations

Department of Natural Resourcesand Environmental Control
Sediment Management Strategy for Rehoboth Bay
Lewes-Rehoboth Canal –Lewes ReachLewes-Rehoboth Canal –Lewes Reach
5,000 to 10,000 cy/year (excluding RI inlet) >90% sand
2-4 yr cycle
Most sedimentation occurs in the turning basin and bend immediately north of this area
Department of Natural Resourcesand Environmental Control
Sediment Management Strategy for Rehoboth Bay
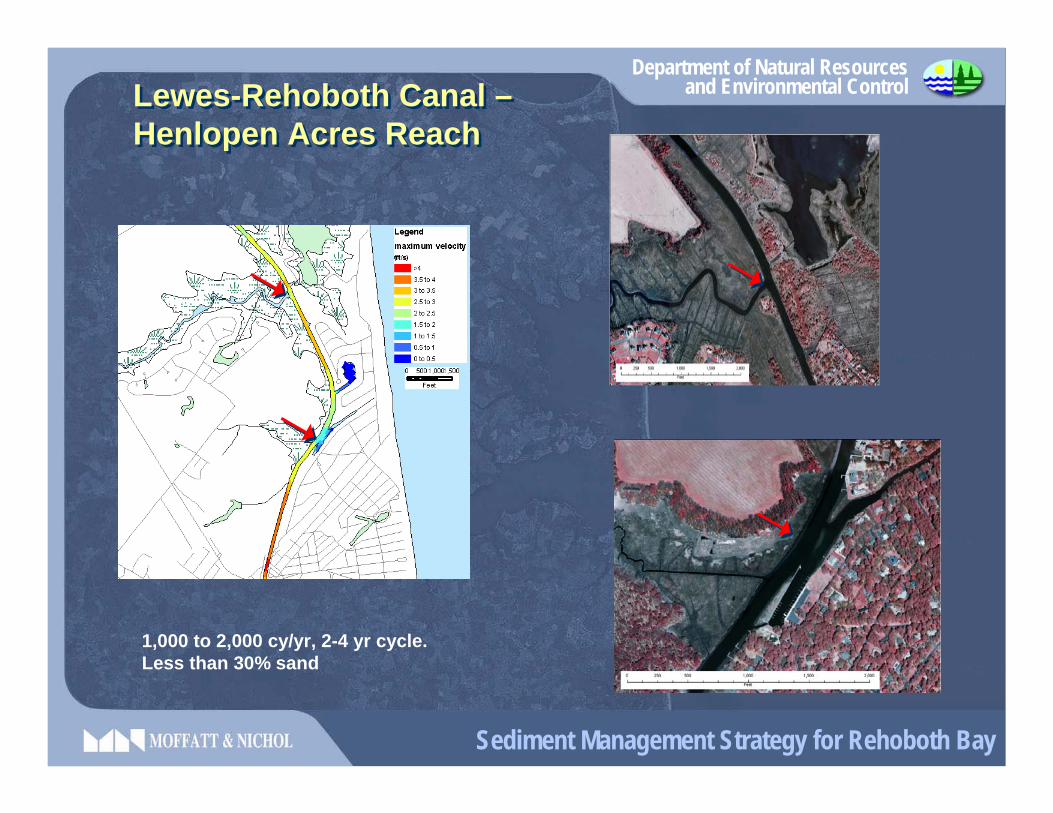
Lewes-Rehoboth Canal –Henlopen Acres ReachLewes-Rehoboth Canal –Henlopen Acres Reach
1,000 to 2,000 cy/yr, 2-4 yr cycle. Less than 30% sand

Department of Natural Resourcesand Environmental Control
Sediment Management Strategy for Rehoboth Bay
Lewes-Rehoboth Canal –Rehoboth BridgeLewes-Rehoboth Canal –Rehoboth Bridge
2,000 cy/yr, 2-4 yr cycle. More than 90% sand

Department of Natural Resourcesand Environmental Control
Sediment Management Strategy for Rehoboth Bay
Lewes-Rehoboth Canal –Rehoboth Bay JettiesLewes-Rehoboth Canal –Rehoboth Bay Jetties
4,000 cy/yr, 1-2 yr cycle. 50% sand 50% silt/clay
Total initial volume for L-R Canal: 40,000 cy

Department of Natural Resourcesand Environmental Control
Sediment Management Strategy for Rehoboth Bay
Love CreekLove Creek
3-5,000 cy/yr. Mostly silt/clay
Total initial volume for -4 ft MLW channel: 60,000 cy

Department of Natural Resourcesand Environmental Control
Sediment Management Strategy for Rehoboth Bay
Herring and Guinea CreekHerring and Guinea Creek
4-8,000 cy/yr for a channel at -4ft MLW. Mostly silt/clay

Department of Natural Resourcesand Environmental Control
Sediment Management Strategy for Rehoboth Bay
Massey’s DitchMassey’s Ditch
Problem Areas:
A. North of Bluff Point
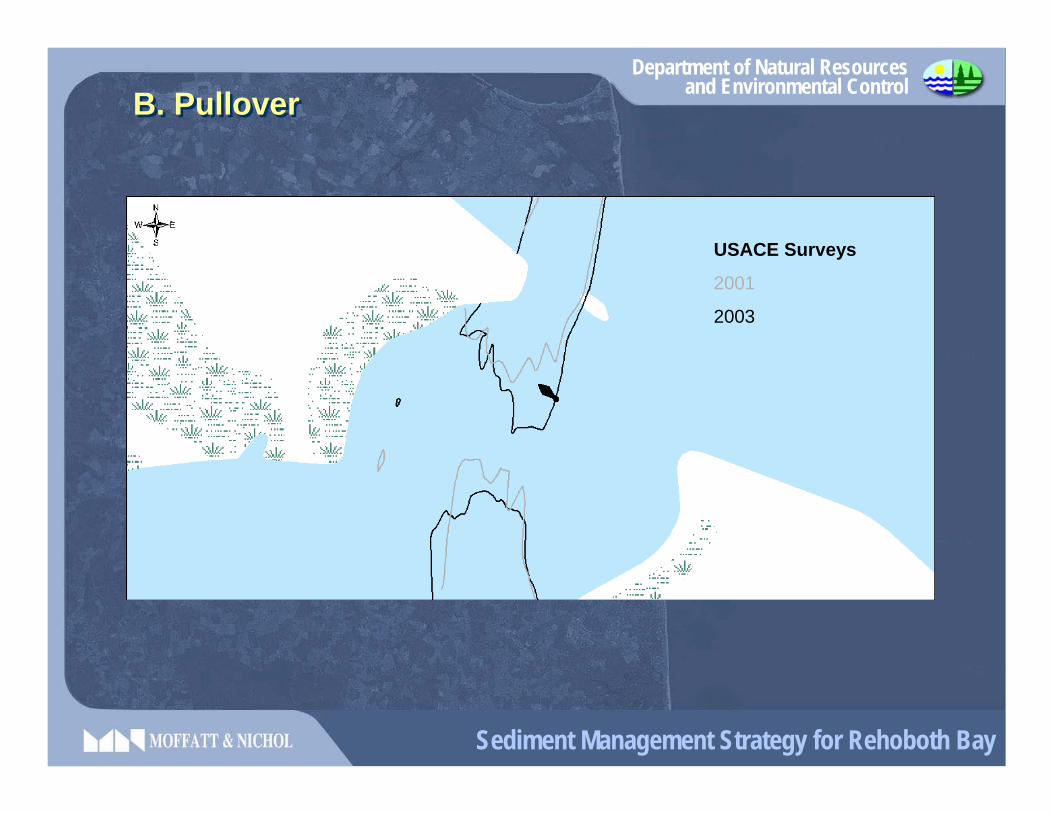
B. Pullover
C. Massey’s Ditch
D. Middle Island shoal
E. Channel from Big Ditch to Little Ditch

Department of Natural Resourcesand Environmental Control
Sediment Management Strategy for Rehoboth Bay
Analytical methodology originally developed by Eysink and Vermaas (1983) which accounts for:
•Channel dimensions
•Natural water depth
•Settling velocity of sediment
•Estimated wave conditions
Hydrodynamic model was modified to represent post-dredge conditions.
Analytical Sedimentation ModelAnalytical Sedimentation Model

Department of Natural Resourcesand Environmental Control
Sediment Management Strategy for Rehoboth Bay
USACE Surveys
2001
2003
2004
A. Bluff PointA. Bluff Point

Department of Natural Resourcesand Environmental Control
Sediment Management Strategy for Rehoboth Bay
Maximum Velocity (ft/s)
A. Bluff PointA. Bluff Point
Department of Natural Resourcesand Environmental Control
Sediment Management Strategy for Rehoboth Bay
B. PulloverB. Pullover
USACE Surveys
2001
2003

Department of Natural Resourcesand Environmental Control
Sediment Management Strategy for Rehoboth Bay
B. PulloverB. Pullover
Velocity (ft/s)
Department of Natural Resourcesand Environmental Control
Sediment Management Strategy for Rehoboth Bay
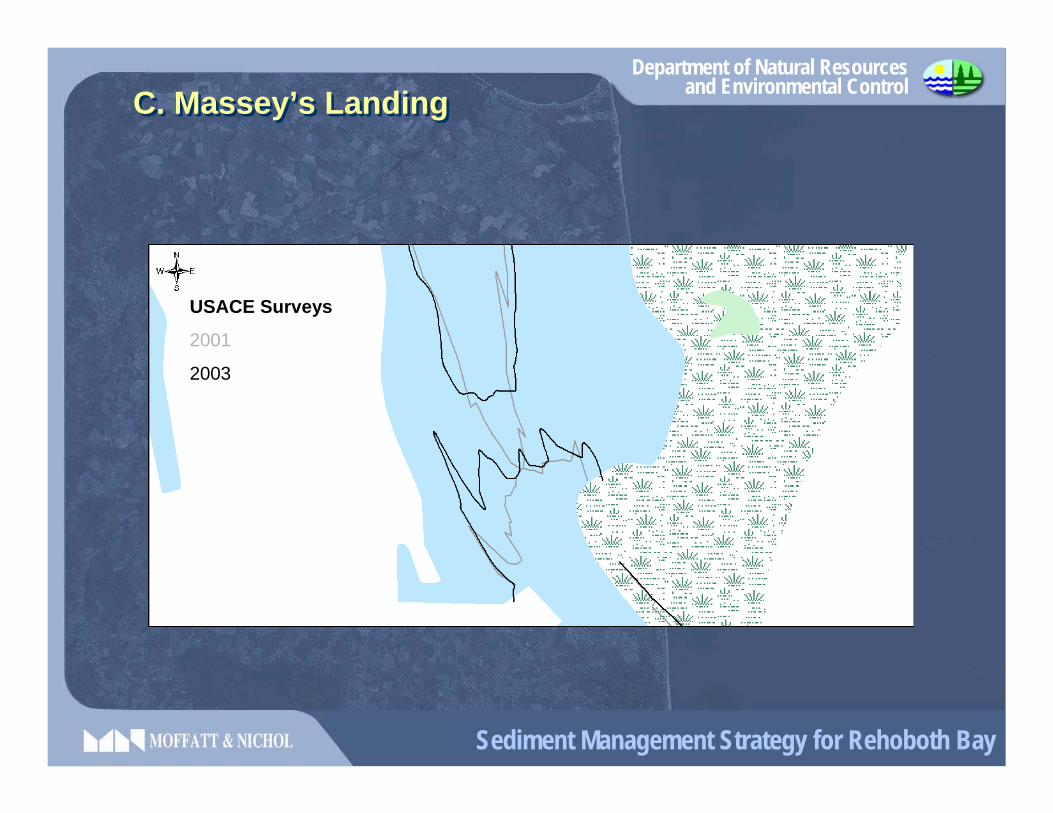
C. Massey’s LandingC. Massey’s Landing
USACE Surveys
2001
2003

Department of Natural Resourcesand Environmental Control
Sediment Management Strategy for Rehoboth Bay
Velocity (ft/s)
C. Massey’s LandingC. Massey’s Landing

Department of Natural Resourcesand Environmental Control
Sediment Management Strategy for Rehoboth Bay
D. Middle IslandD. Middle Island
USACE Surveys
2001
2004

Department of Natural Resourcesand Environmental Control
Sediment Management Strategy for Rehoboth Bay
Velocity (ft/s)
D. Middle IslandD. Middle Island

Department of Natural Resourcesand Environmental Control
Sediment Management Strategy for Rehoboth Bay
E. Big Ditch to Little Ditch ChannelE. Big Ditch to Little Ditch Channel

Department of Natural Resourcesand Environmental Control
Sediment Management Strategy for Rehoboth Bay
Velocity (ft/s)
E. Big Ditch to Little Ditch ChannelE. Big Ditch to Little Ditch Channel
Department of Natural Resourcesand Environmental Control
Sediment Management Strategy for Rehoboth Bay
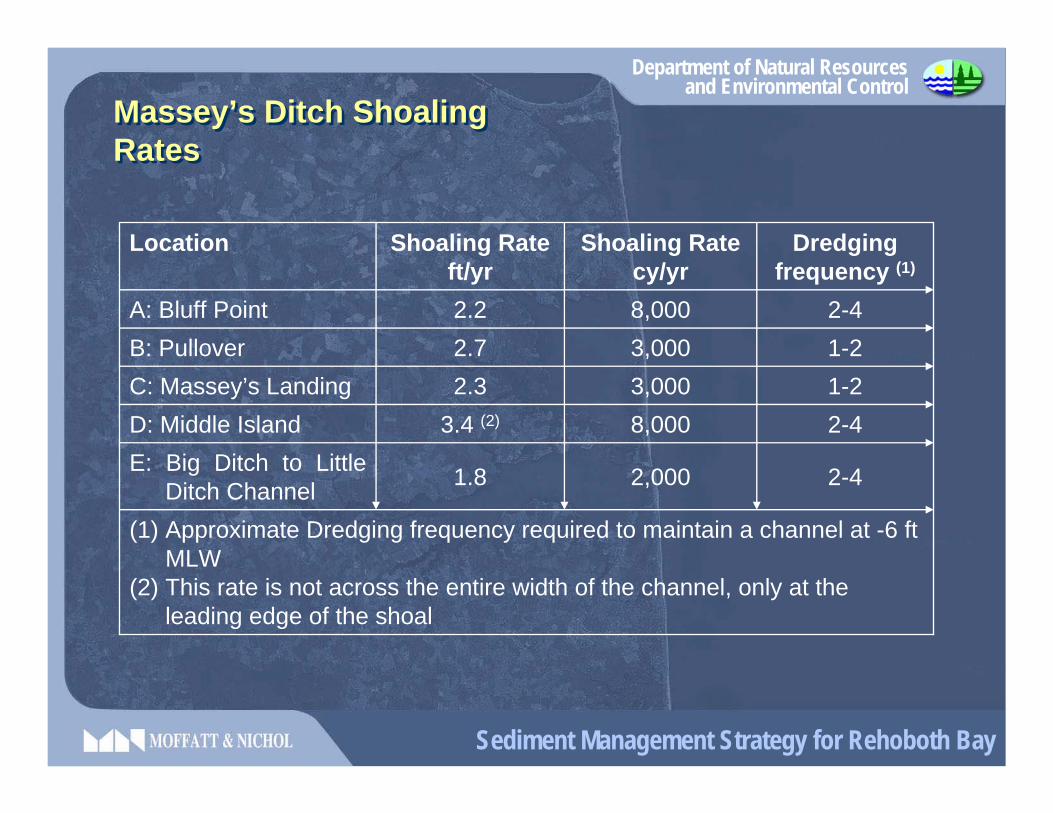
(1) Approximate Dredging frequency required to maintain a channel at -6 ft MLW
(2) This rate is not across the entire width of the channel, only at the leading edge of the shoal
2-42,0001.8E: Big Ditch to Little Ditch Channel
2-48,0003.4 (2)D: Middle Island1-23,0002.3C: Massey’s Landing1-23,0002.7B: Pullover2-48,0002.2A: Bluff Point
Dredgingfrequency (1)
Shoaling Ratecy/yr
Shoaling Rateft/yr
Location
Massey’s Ditch Shoaling RatesMassey’s Ditch Shoaling Rates
Department of Natural Resourcesand Environmental Control
Sediment Management Strategy for Rehoboth Bay
Task 5. Sediment Management AlternativesTask 5. Sediment Management Alternatives
Department of Natural Resourcesand Environmental Control
Sediment Management Strategy for Rehoboth Bay
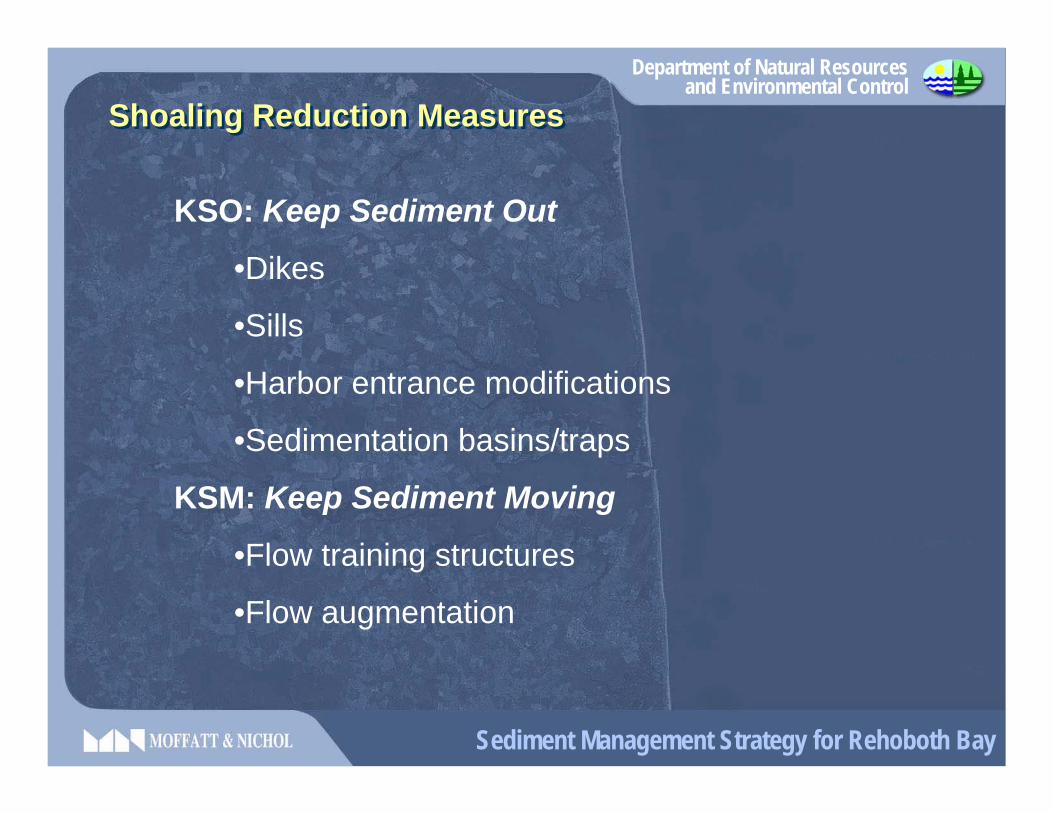
KSO: Keep Sediment Out
•Dikes
•Sills
•Harbor entrance modifications
•Sedimentation basins/traps
KSM: Keep Sediment Moving
•Flow training structures
•Flow augmentation
Shoaling Reduction MeasuresShoaling Reduction Measures
Department of Natural Resourcesand Environmental Control
Sediment Management Strategy for Rehoboth Bay
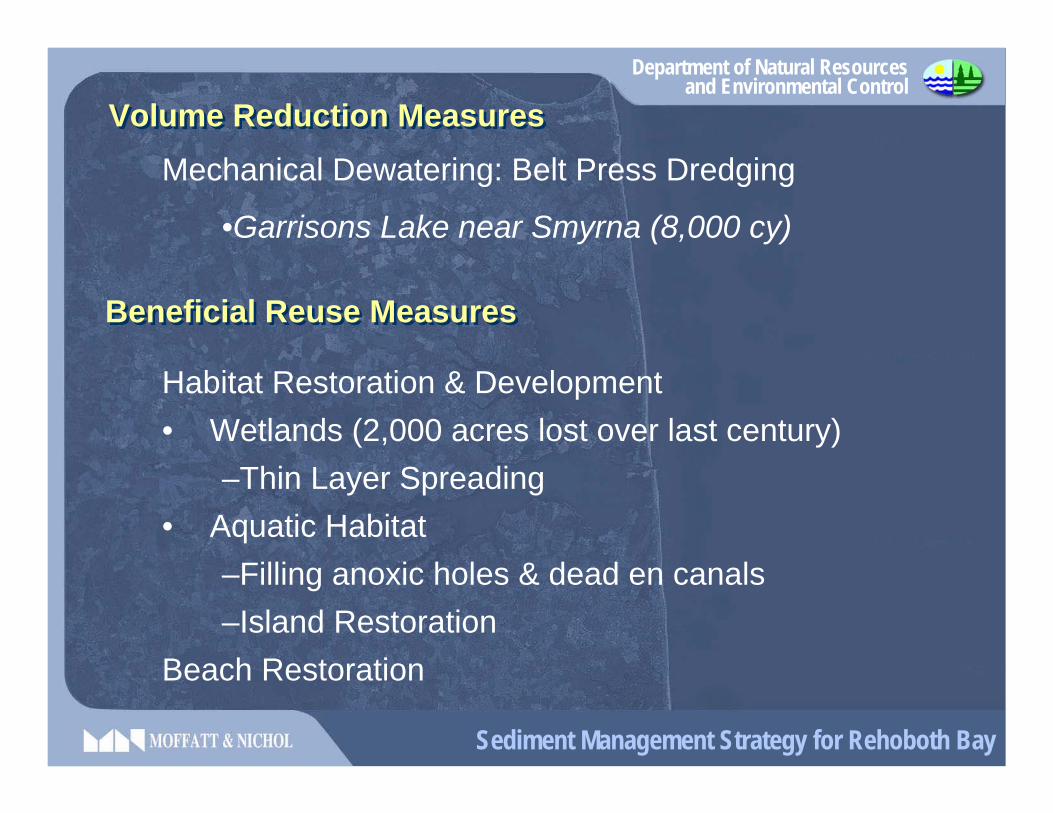
Mechanical Dewatering: Belt Press Dredging
•Garrisons Lake near Smyrna (8,000 cy)
Volume Reduction MeasuresVolume Reduction Measures
Beneficial Reuse MeasuresBeneficial Reuse Measures
Habitat Restoration & Development• Wetlands (2,000 acres lost over last century)
–Thin Layer Spreading• Aquatic Habitat
–Filling anoxic holes & dead en canals–Island Restoration
Beach Restoration

Department of Natural Resourcesand Environmental Control
Sediment Management Strategy for Rehoboth Bay
Camp Arrowhead Camp Arrowhead

Department of Natural Resourcesand Environmental Control
Sediment Management Strategy for Rehoboth Bay
Lewes-Rehoboth CanalLewes-Rehoboth Canal

Department of Natural Resourcesand Environmental Control
Sediment Management Strategy for Rehoboth Bay
Projected Maintenance Dredging Volumes & Frequency• Estimates are based on authorized project dimensions, including a channel depth of -
6 ft MLW.• Lewes Reach: 5,000 to 10,000 cy/yr (RI not included). 2-4 year cycle. > 90% sand. • Cape Henlopen State Park Reach: no dredging required.• Henlopen Acres Reach: 1,000 to 2,000 cy/yr. 2-4 year cycle. < 30% sand. • Rehoboth Beach Reach: 2,000 cy/yr. 2-4 year cycle. > 90% sand.• Thompson Island Reach: 4,000 cy/yr. 1-2 year cycle. 50% sand and 50% silt/clay.• Initial dredging volume likely to exceed 40,000 cy.
Current Management & Issues• Canal north of Savannah Ave Bridge last dredged by USACE in 2002. Disposal to
Lewes CDF.• The State dredged between Lewes and Henlopen Acres Marina in 1989-91. Disposal
to two CDFs: City of Lewes’ and Mr. Andersen’s Property across from HenlopenAcres.
• From Rehoboth Beach to the confluence with Rehoboth Bay the canal has not been dredged since the 1960’s. The State planned to dredge in this area but did not for lack of practical disposal options.
• Very limited federal funding available. USACE dredging unlikely south of RI
Lewes-Rehoboth CanalLewes-Rehoboth Canal
Department of Natural Resourcesand Environmental Control
Sediment Management Strategy for Rehoboth Bay
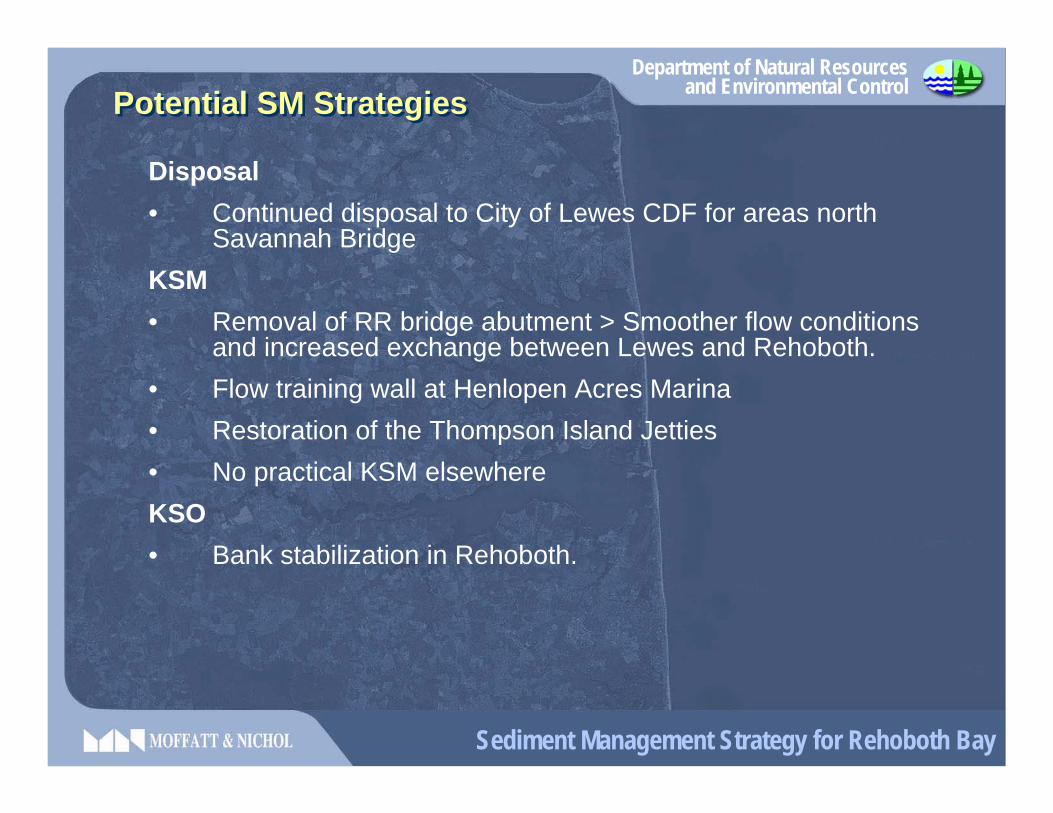
Disposal• Continued disposal to City of Lewes CDF for areas north
Savannah BridgeKSM• Removal of RR bridge abutment > Smoother flow conditions
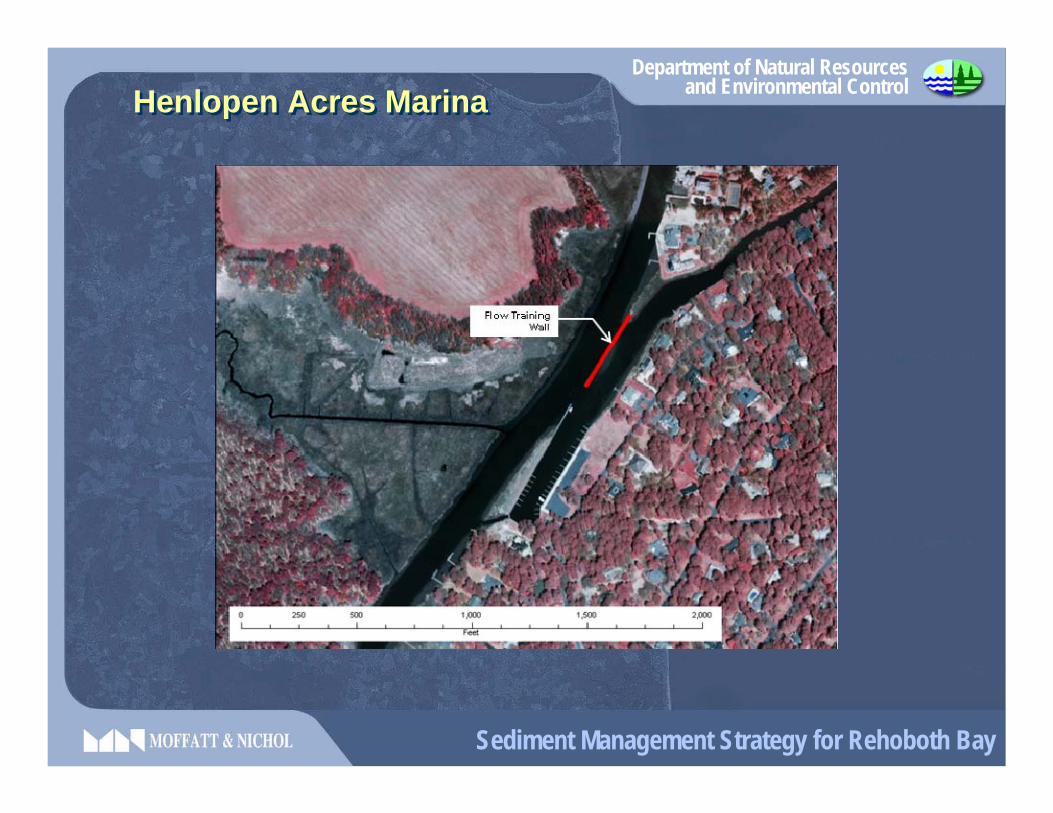
and increased exchange between Lewes and Rehoboth.• Flow training wall at Henlopen Acres Marina• Restoration of the Thompson Island Jetties• No practical KSM elsewhereKSO• Bank stabilization in Rehoboth.
Potential SM StrategiesPotential SM Strategies
Department of Natural Resourcesand Environmental Control
Sediment Management Strategy for Rehoboth Bay
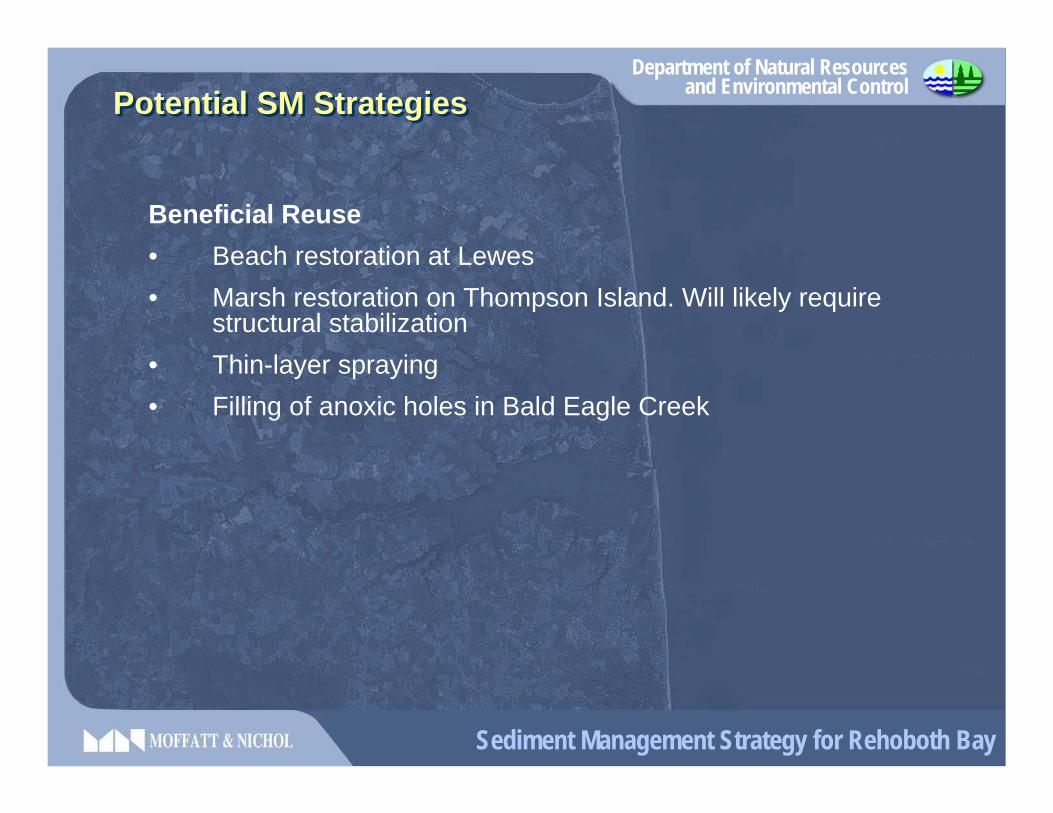
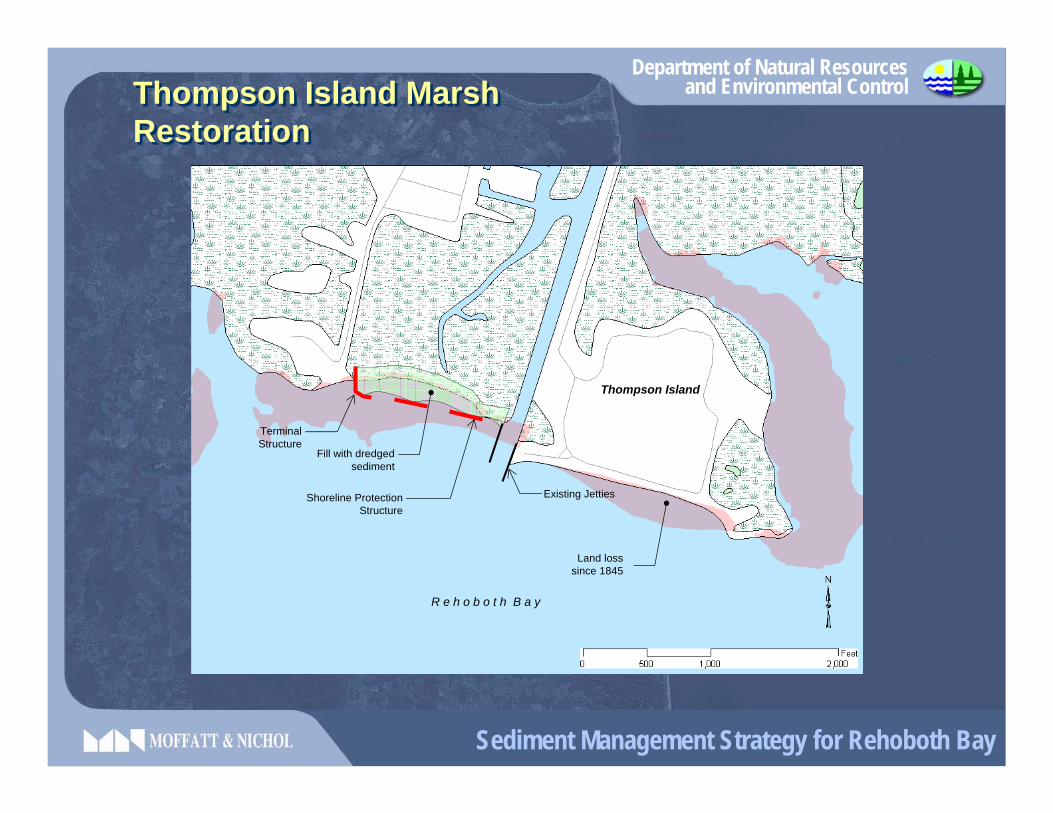
Beneficial Reuse• Beach restoration at Lewes• Marsh restoration on Thompson Island. Will likely require
structural stabilization • Thin-layer spraying• Filling of anoxic holes in Bald Eagle Creek
Potential SM StrategiesPotential SM Strategies

Department of Natural Resourcesand Environmental Control
Sediment Management Strategy for Rehoboth Bay
Savannah BridgeSavannah Bridge
Department of Natural Resourcesand Environmental Control
Sediment Management Strategy for Rehoboth Bay
Henlopen Acres MarinaHenlopen Acres Marina
Department of Natural Resourcesand Environmental Control
Sediment Management Strategy for Rehoboth Bay
Existing Jetties
Terminal Structure
Fill with dredged sediment
R e h o b o t h B a y
Shoreline Protection Structure
Thompson Island
Land loss since 1845
Thompson Island Marsh RestorationThompson Island Marsh Restoration

Department of Natural Resourcesand Environmental Control
Sediment Management Strategy for Rehoboth Bay
Low relief protection wallLow relief protection wall

Department of Natural Resourcesand Environmental Control
Sediment Management Strategy for Rehoboth Bay
Holt’s LandingHolt’s Landing
Department of Natural Resourcesand Environmental Control
Sediment Management Strategy for Rehoboth Bay
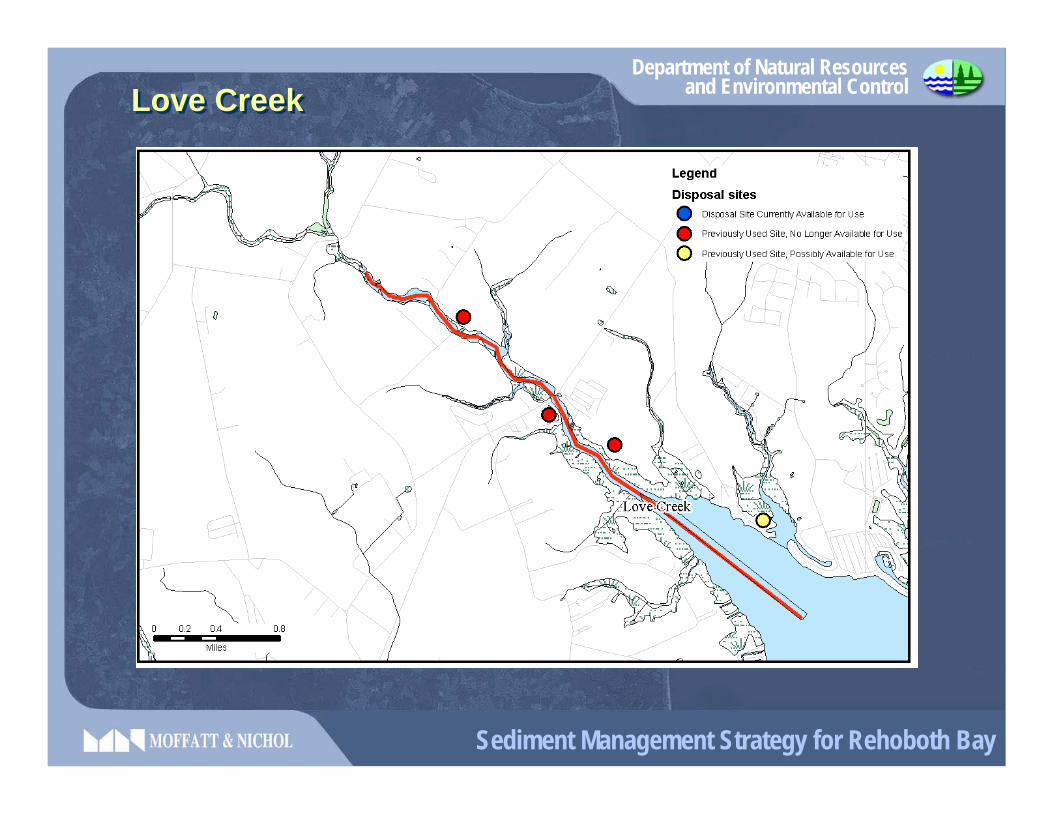
Love CreekLove Creek
Department of Natural Resourcesand Environmental Control
Sediment Management Strategy for Rehoboth Bay
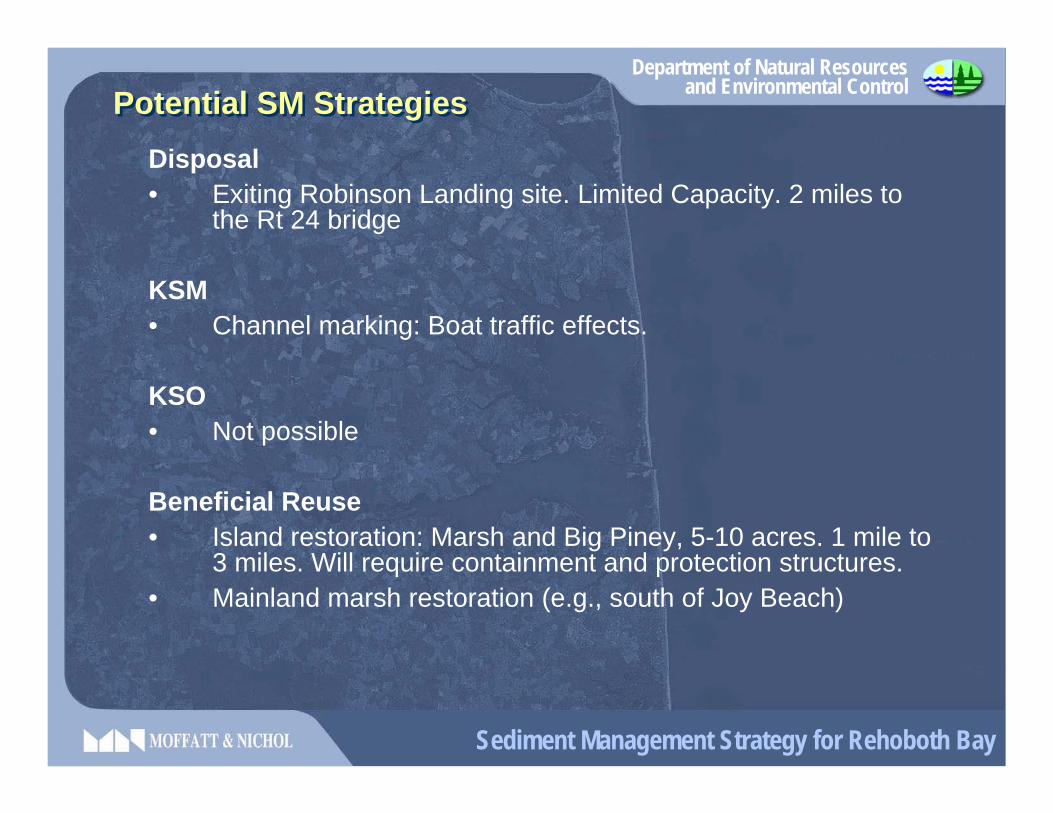
Disposal• Exiting Robinson Landing site. Limited Capacity. 2 miles to
the Rt 24 bridge
KSM• Channel marking: Boat traffic effects.
KSO• Not possible
Beneficial Reuse• Island restoration: Marsh and Big Piney, 5-10 acres. 1 mile to
3 miles. Will require containment and protection structures.• Mainland marsh restoration (e.g., south of Joy Beach)
Potential SM StrategiesPotential SM Strategies

Department of Natural Resourcesand Environmental Control
Sediment Management Strategy for Rehoboth Bay
Shoreline Protection Structure
Unprotected containment Fill with dredged
sediment
Shoreline Protection Structure
Fill with dredged sediment
Marsh Island
Big Piney Island
Horse Island
R E H O B O T H B A Y

Department of Natural Resourcesand Environmental Control
Sediment Management Strategy for Rehoboth Bay
Herring & Guinea CreekHerring & Guinea Creek
Department of Natural Resourcesand Environmental Control
Sediment Management Strategy for Rehoboth Bay
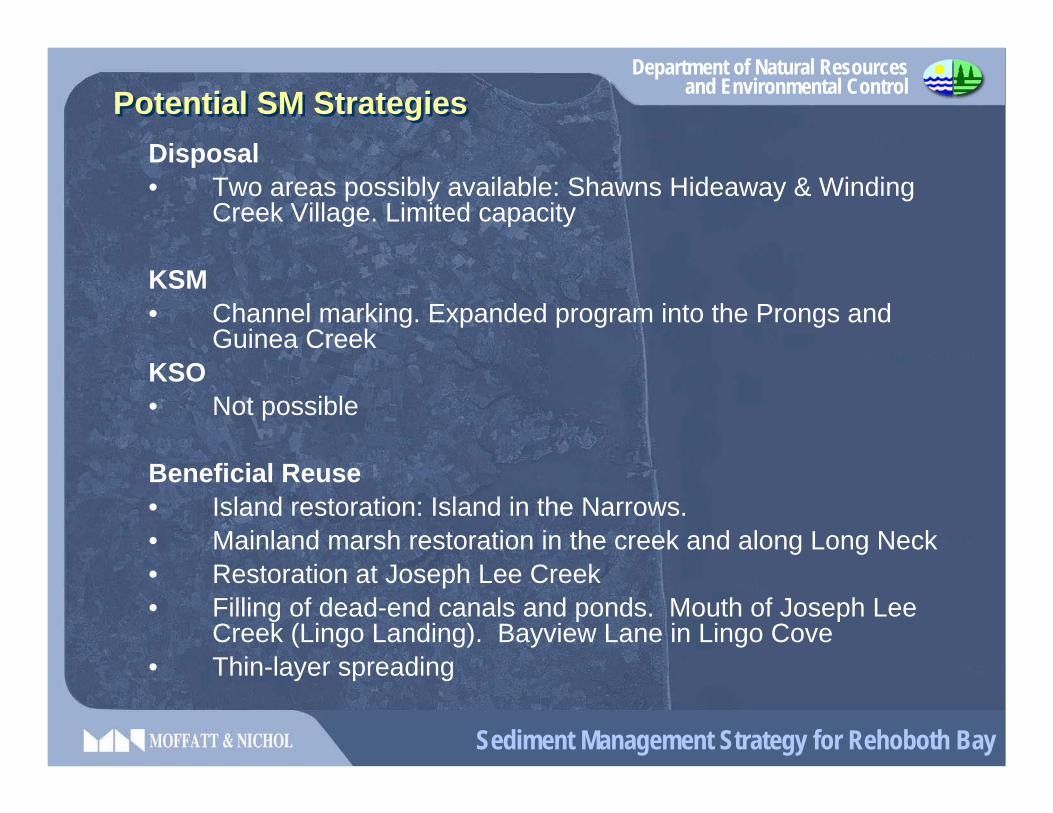
Disposal• Two areas possibly available: Shawns Hideaway & Winding
Creek Village. Limited capacity
KSM• Channel marking. Expanded program into the Prongs and
Guinea CreekKSO• Not possible
Beneficial Reuse• Island restoration: Island in the Narrows.• Mainland marsh restoration in the creek and along Long Neck• Restoration at Joseph Lee Creek• Filling of dead-end canals and ponds. Mouth of Joseph Lee
Creek (Lingo Landing). Bayview Lane in Lingo Cove• Thin-layer spreading
Potential SM StrategiesPotential SM Strategies

Department of Natural Resourcesand Environmental Control
Sediment Management Strategy for Rehoboth Bay
Shoreline Protection Structure
Unprotected containment
Fill with dredged sediment
Wolfpit Marsh
Angola Landing
Herring Creek
Guinea Creek
Rehoboth Bay
Wilson Marsh

Department of Natural Resourcesand Environmental Control
Sediment Management Strategy for Rehoboth Bay
Potential Marsh Restoration Area at Joseph Lee Creek Potential Marsh Restoration Area at Joseph Lee Creek

Department of Natural Resourcesand Environmental Control
Sediment Management Strategy for Rehoboth Bay
Lingo CoveLingo Cove

Department of Natural Resourcesand Environmental Control
Sediment Management Strategy for Rehoboth Bay
Massey’s DitchMassey’s Ditch
Department of Natural Resourcesand Environmental Control
Sediment Management Strategy for Rehoboth Bay
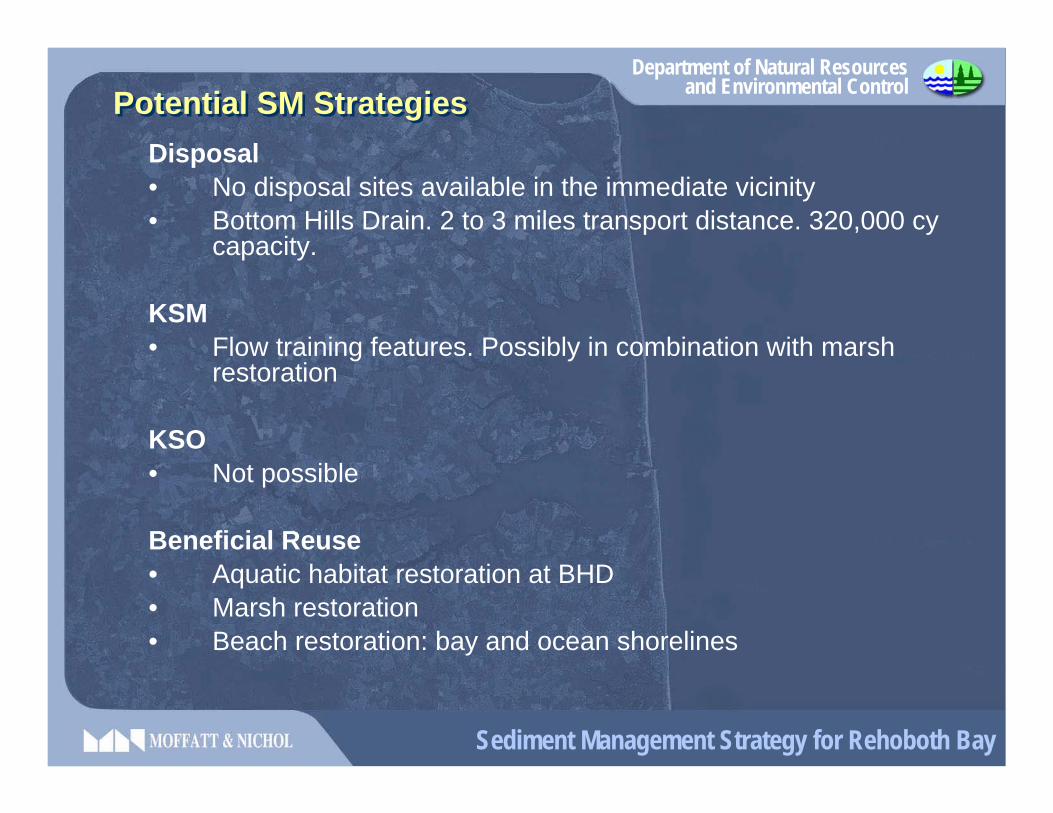
Disposal• No disposal sites available in the immediate vicinity• Bottom Hills Drain. 2 to 3 miles transport distance. 320,000 cy
capacity.
KSM• Flow training features. Possibly in combination with marsh
restoration
KSO• Not possible
Beneficial Reuse• Aquatic habitat restoration at BHD• Marsh restoration• Beach restoration: bay and ocean shorelines
Potential SM StrategiesPotential SM Strategies

Department of Natural Resourcesand Environmental Control
Sediment Management Strategy for Rehoboth Bay
Shoreline Protection Structure
Fill with dredged sediment (typ.)
Low relief containment
structure (sill)
Flow Training and fill containment structure

Department of Natural Resourcesand Environmental Control
Sediment Management Strategy for Rehoboth Bay
Shoreline Protection Structure
Fill with dredged sediment (typ.)
Rock groins
Flow Training and fill containment structure

Department of Natural Resourcesand Environmental Control
Sediment Management Strategy for Rehoboth Bay
Angola Landing RestorationAngola Landing Restoration

Department of Natural Resourcesand Environmental Control
Sediment Management Strategy for Rehoboth Bay
Massey’s to Middle IslandMassey’s to Middle Island
Flow Training Wall
Middle Island
Little DitchBig Ditch
Massey's’ Ditch

Department of Natural Resourcesand Environmental Control
Sediment Management Strategy for Rehoboth Bay
THANK YOU !THANK YOU !