Embed Size (px)
Citation preview
SEDIMENT CHARACTERISTICS OF THE M-9 TSUNAMI EVENT BETWEEN RAMESWARAM AND THOOTHUKUDI, GULF OF
MANNAR, SOUTHEAST COAST OF INDIA
S.R.Singarasubramanian, M.V.Mukesh, K.Manoharan S.Murugan, D.Bakkiaraj, A.John Peter
Department of Earth Sciences, Annamalai University,
Annamalainagar-608002, Tamilnadu, India
e-mail: [email protected]
P.Seralathan Department of Marine Geology & Geophysics, Cochin University of Science and Technology,
Fine Arts Avenue, Cochin,
Kerala, India
ABSTRACT On 26th December, 2004, a massive earthquake occurred NW of Sumatra in the seismically active zone close to Sunda Trench at a water depth of about 1300m and with an epicenter located at a shallow depth of 10km below the ocean floor. This earthquake triggered tsunami waves in the Indian Ocean and hit most of the Tamilnadu coast, with wave height varying from 3 to 10m. In the study area dunes were breached. Erosional channels were created. Inundation in the study area ranges between 10 and 600m from the shoreline. The inundated sediment thickness varies from 1 to 30cm and was well preserved. Sediments thickness gets reduced landwards and occurs as set of layers. The sediments were fresh, grey to dark grey in color.
Science of Tsunami Hazards, Vol. 25, No. 3, page 160 (2006)
INTRODUCTION :
Tsunamis transport sediments from the offshore and beach, subsequently deposit them over the coastal low lands. Tsunami deposits fine landward, while river deposits generally fine seaward (Nelson et. al. 1996b). Multiple normal graded beds within the deposit suggest deposition by successive tsunami waves rather than a storm surge (Nelson et. al. 1996b). Tsunamis have the potential to deposit sand farther inland or at a higher elevation than storms (Dawson and Shi, 2000). Tsunami deposits may be of three categories (Whelan and Kelletat, 2003) as large clasts, coarse to fine sand and other fairly obscure deposits such as wash over fans. The composition and texture of sand grains can be used to determine a coastal source (Peterson and Darienzo, 1996). Ancient tsunamis have also been inferred based on sand sheets found in coastal low lands, including those found in Scotland (Dawson et. al., 1988; Long et. al., 1989), Japan (Minoura and Nakaya, 1991), New Zealand (Clague-Goff and Goff, 1999), the Mediterranean (Dominey- Howes et. al, 1999; Minoura, et. al., 2000) and the Pacific Coast of North America (Clague et. al., 2000). Sand sheets are important markers of ancient tsunamis, especially serve as the only record of some prehistoric tsunamis. The impact of tsunami waves on coastline will be very severe due to their greater wavelengths and wave periods. If there is sufficient sediment supply, tsunami waves are constructive as they move inland, and transport a variety of grain sizes ranging from silt to large boulders. The retreating waves can remobilize and erode sediments (Barbara Keating et al., 2004). The most common tsunami deposits are fine sediments that most frequently occur as sediment sheets. An attempt has been made to decipher the tsunami sediment deposits and its characteristics between Rameswaram and Thoothukudi, Gulf of Mannar, Tamilnadu, India. STUDY AREA The present study area forms the part of east coast of India and southern part of Tamilnadu. The study area is located between Rameswaram (Lat. 9.28345 and Long. 79.32142) in the north and Thoothukudi (Lat. 8.44593 and Long. 78.10071) in the south. The study area includes the coastal villages of Ramanathapuram and Thoothukudi districts. (Map No. 1). The shelf width off Pamban in the Gulf of Mannar is about 25 km and the shelf break occurs more or less at about 200m depth. The shelf is very wide off the coast between Sippikulam and Tuticorin. The 20m depth contour lies at distance of 30 km between Rameswaram island and Valinokkam and about 40-45 km between Valinokkam and Tuticorin. The Rameswaram and Tuticorin coast is characterized by the presence of 21 coral islands with varying sizes and arranged in an en echelon manner within the 20m depth contour. These features have effectively altered by the tsunami waves. Along the coast several morphological features have induced in the inundation levels. A prominent spit is occurring near Thoothukudi, running few kilometers in length. It joins with main land and forming Tombolo. Beach ridges are found to be
Science of Tsunami Hazards, Vol. 25, No. 3, page 161 (2006)
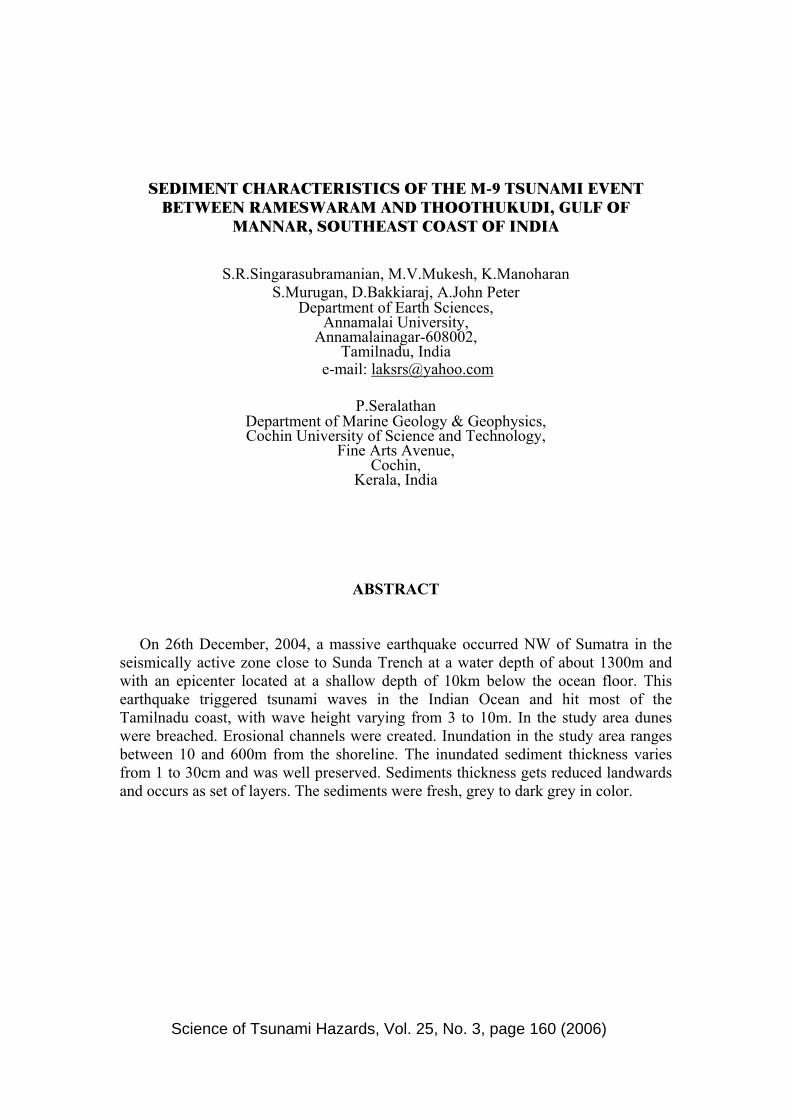
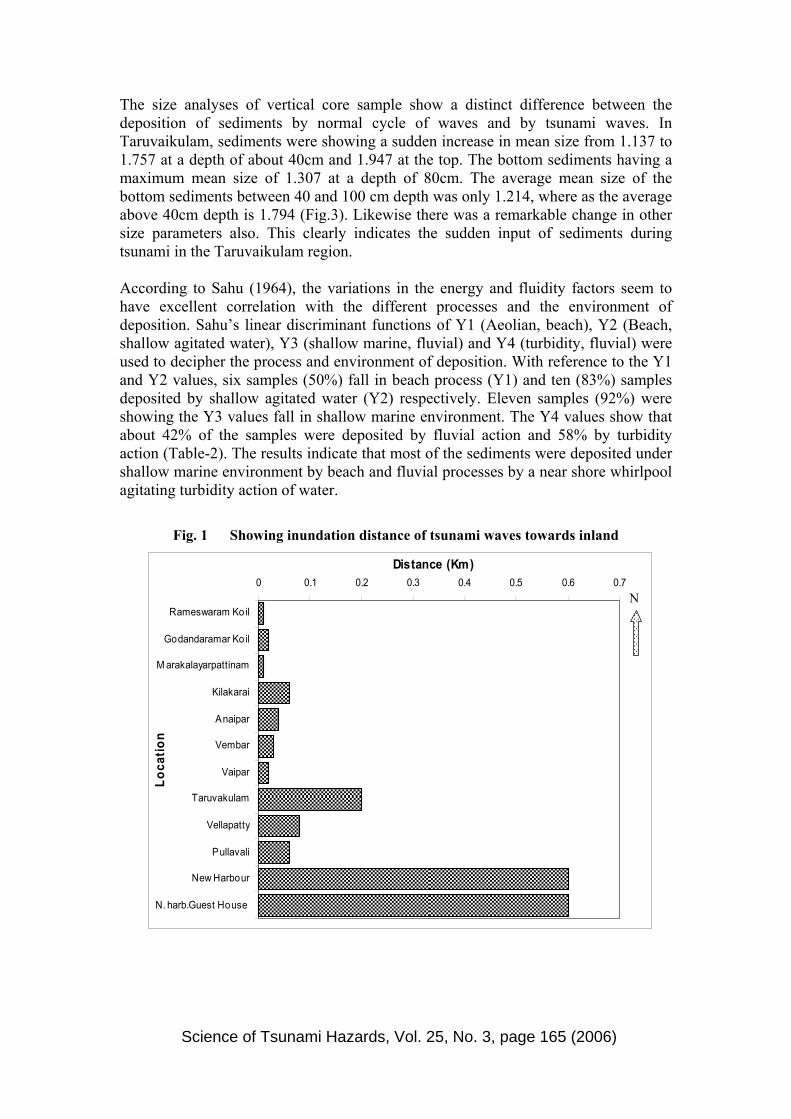
discontinuous. They are varying in length and width. These are distributed for a few kilometers away from the coastline, but lying parallel to the shoreline. These ridges are separated by salt pans and in some places by swales. Beach ridges are compact and almost covered by vegetation. Sand dunes are formed at interface between sea and land. They bordered the high tide mark and extend inland up to 2 to 5 km. They run parallel to the shoreline separated from each other by marked troughs. The crests are flat and range in height from 0.5 to 2m. They are stabilized by the vegetation. After the mega tsunami event the sand dunes were breached in many places and the coastal geomorphology has changed. In many places the channels were diverted or filled with sediments or new formations of erosional structures were observed. The coastal regions become steep in some places and shallow in some places due to the differential erosion and accretion of sediments by tsunami waves. METHODOLOGY : The inundation distance of tsunami waves were marked using Garmin-12 GPS. The distance and height of the waves were noted by observing the water level marks in the walls of houses. Sediment samples were collected along several coastal settings like beaches, intertidal environments, and coastal plains by penetrating 8cm diameter PVC pipes up to 1m depth. Before that a pit was made to study layering and for photography. The collected samples were washed and sieved at ¼ phi interval ASTM sieve sets for 20 minutes. The grain size distribution was studied to determine sedimentary environment with the help of log-probability studies. SURFICIAL IDENTIFICATION: Identification of tsunami deposits was based on several criteria, including differences in grain size and color. Sedimentary deposits from the tsunami were found in most places where significant inundation occurred. Tsunami deposits were overlying a known preexisting surface that was texturally distinct, such as from soils identification was fairly simple, where as if the underlying material was beach sand that was similar both texturally and visually, identification was more difficult. In tsunami deposits, grain size generally fines upwards and rip-up clasts may be present. The base of the deposits erodes underlying structures and a heavy mineral layer may be present at the base. Underlying sands were often trampled while tsunami sands were relatively undisturbed. Many of the deposits had multiple layers. GEOMORPHIC CHANGES: There are many changes in the geomorphic features after tsunami. It was observed that tsunami sediments were deposited as layers with fining up sequences, indicating repeated wave attack with different wave velocities which brought considerable sediments from near/offshore to land. The thickness of sediments varies from place to place. Tsunamigenic sediment thickness steadily thins landward. Certain coastal segments of the study area (stations 1 to 6) were not affected much by the tsunami waves- only uprush were witnessed by the local communities. Hence inundation level and sedimentation was very less in these segments when compared to the southern sector (Fig.1). Station 7, encountered only erosion but no sedimentation by tsunami.
Science of Tsunami Hazards, Vol. 25, No. 3, page 162 (2006)
The southern 5 stations (8-14) were affected by tsunami waves. In station-8, 9 &10) the very thick sedimentation took place along the coast. The shoreline was filled with sediments to an extent of about 120cm thick with 150m length and 20m width along the coast. Tsunami waves entered up to 150m inland. Coastal morphology was completely altered. Thick sedimentation in the northern part of station 8 leads to the extent of beach towards the sea. The sediments were fresh, fine to medium, loosely packed and layered. Here rich heavy minerals were deposited as bands on the surface by tsunami waves. The segregation of heavy minerals into fine and coarse was observed. The coarser heavy minerals were deposited away from the coast and fine near the coast (5 to 20m from the coast). Stations 11&12 were also affected by the sedimentation due to the tsunami waves. The inundation is up to 75m inland. The sediments were deposited over the normal coarser beach sediments as thin layers. The layering was prominent with thin dark colored bands of sediments. The thickness is about 10 to 15cm only. The fresh sediments brought by tsunami were identified based on their freshness, color and textural difference from the older sediments. Oxidation of fresh sediments was observed. Behind the Harbor Guest House in station 14, the sedimentation was up to 500m inland from the shore. Tsunami waves enter into the inland by eroding a channel of 15m width near the coast and become narrow in inland. The sediments entered through the channel to the inland. Sedimentation took place in and around the channel. Fresh fine and loose, layering of sediments was noticed in the inland. The thickness is about 50cm. Dark banding of sediments is prominent. In station 15, near the AMD plant, the tsunami waves enter inland into the dense scrubs. The inundation is up to 60m inland. Erosion along the shore line is prominent. Fine sediments with layering were deposited over the eroded surface along the coast. The thin dark colored bands of sediments were observed. The thickness of fresh fine sediments deposited over the coarser fragments is about 30cm. The Gulf of Mannar coast was affected by the diffracted tsunami waves from the southern Sri Lankan coast. Tsunami inundation along the southern Mannar coast is moderate. Tsunami impact along the northern Gulf of Mannar coast between Thanushkodi and Tuticorin is rather very meager due to the presence of 21 coral islands. The coast is considered as raised coast consisting of coralline terraces. In general, the study area encountered good sedimentation in some locations depending upon their geomorphological setup. From the study, it was observed that the tsunami waves propagation was almost from south east and flowed to north west. These waves are diffracted, since the region is located in and near the shadows of Sri Lanka. The wave velocity is also less due to the shallow nature of the coasts. GRANULOMETRIC STUDIES: The grain size distribution is believed to be considered of several normal subpopulations representing the sediments transported by the process of rolling, suspension and saltation (Inman, 1949). The combination of two or more of these processes produces characteristics log probability curve shapes. The mentioned characteristics of the sediments and the mechanisms were utilized to study the size analysis. Textural attributes of sediments and sedimentary rocks viz. mean (Mz),
Science of Tsunami Hazards, Vol. 25, No. 3, page 163 (2006)

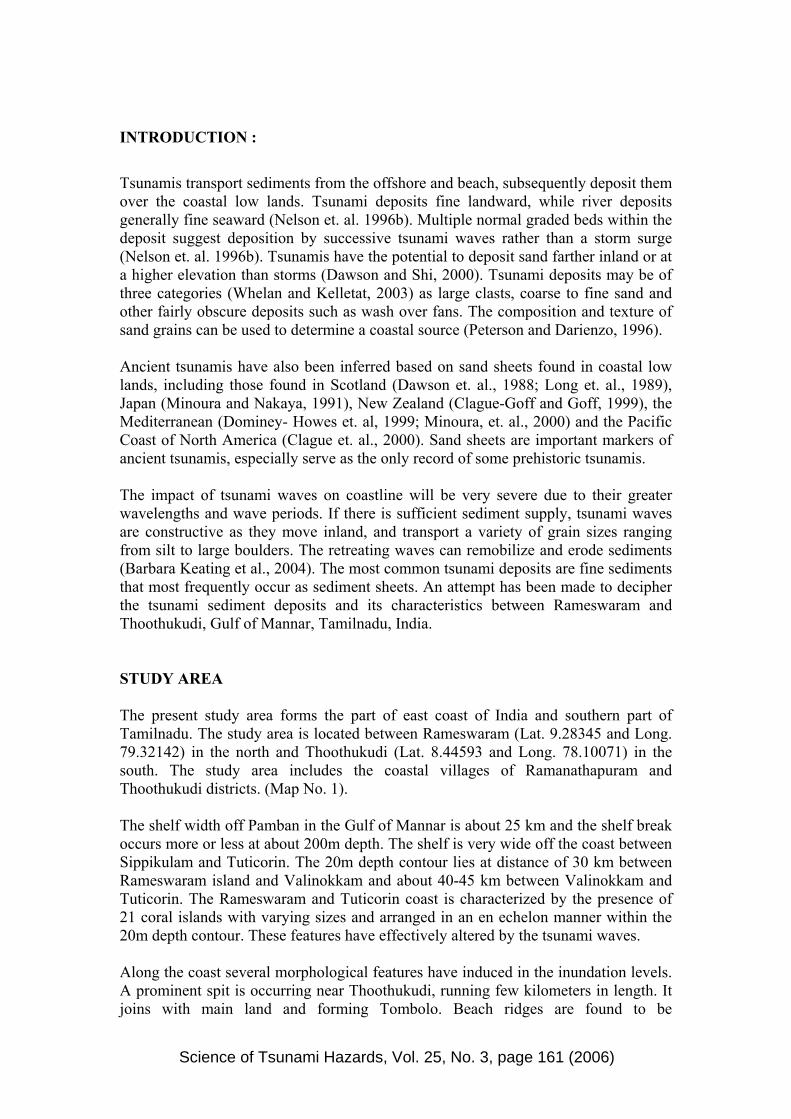
standard deviation (σ1), skewness (SkI) and kurtosis (KG) are widely used to reconstruct the depositional environments of sediments and sedimentary rocks (Amaral, 1977). Correlation between size parameters and transport processes/depositional mechanisms of sediments has been established by exhaustive studies from many modern and ancient sedimentary environments (Folk and Ward, 1957; Mason and Folk, 1958; Friedman, 1961, 1967; Visher, 1969; Valia and Cameron, 1977; Wang et. al, 1998; Asselman, 1999; Malvarez et.al., 2001). Mean size is the average size of the sediments influenced by the source of supply, transporting medium and the energy conditions of the depositing environment. The phi mean size of the samples varies from 0.830 to 3.153 Ф with an average mean of 2.143Ф (Fig.2) (Table 1). The majority of the sediments (67%) samples fall in fine sand category and the rest in medium sand category. The mean size indicates that the fine sands were deposited at a moderately low energy conditions and the medium sand were deposited at a moderate energy conditions. The variation in phi mean size, therefore, reveals the differential energy conditions leads to the deposition of these kinds of sediments in different locations.
Standard deviation (1) measures the sorting of sediments and indicates the fluctuations in the kinetic energy or velocity conditions of the depositing agent (Sahu, 1964). The standard deviation values of the sediments range between 0.463 and 0.717 Ф with an average value of 0.630 Ф (Fig.2). The sorting of sediments range from well sorted to moderately sorted character. About 50% of the samples fall under moderately well sorted nature. Well sorted nature was represented by rest of the samples. This kind of sorting nature of the sediments may be due to the intermixing and influx of the sediments from sea as well as the river. The presence of fine sand and well sorted nature suggests effective wave action to scour the sediments from the shelf region during the break of tsunami waves. Skewness (Ski) measures the asymmetry of a frequency distribution. The skewness values range between -0.159 (Station -11) and 1.145 (Station-1) with an average value of 0.029 (Fig.2). The symmetry of the samples varies from strongly fine skewed to strongly coarse skewed nature. The strongly fine skewed and fine skewed sediments generally imply the introduction of fine material or removal of coarser fraction (Friedman, 1961) or winnowing of sediments (Duane, 1964). The predominant fine skewed nature of sediments indicates excessive riverine input. The positive skewness (50%) of sediments indicates the unidirectional transport (channel) or the deposition of sediments in sheltered low energy environment (Brambati, 1969). Values of the fourth moment kurtosis(KG) ranging between 0.871 (Station-9) and 1.949 (Station-4) with an average of 1.276 (Fig.2). Majority (75%) of the samples falls under leptokurtic to very leptokurtic nature of distributions. Friedman (1962) suggested that extreme high or low values of kurtosis imply that part of the sediment achieved its sorting elsewhere in a high energy environment. The variation in the kurtosis values is a reflection of the flow characteristics of the depositing medium (Seralathan and Padmalal, 1994; Baruah et. al., 1997). Finer in size and dominant leptokurtic nature of sediments reflect maturity of the sand and variation in the sorting values are likely due to continuous addition of finer/ coarser materials in varying proportions (Prabhakara Rao et. al., 2001).
Science of Tsunami Hazards, Vol. 25, No. 3, page 164 (2006)
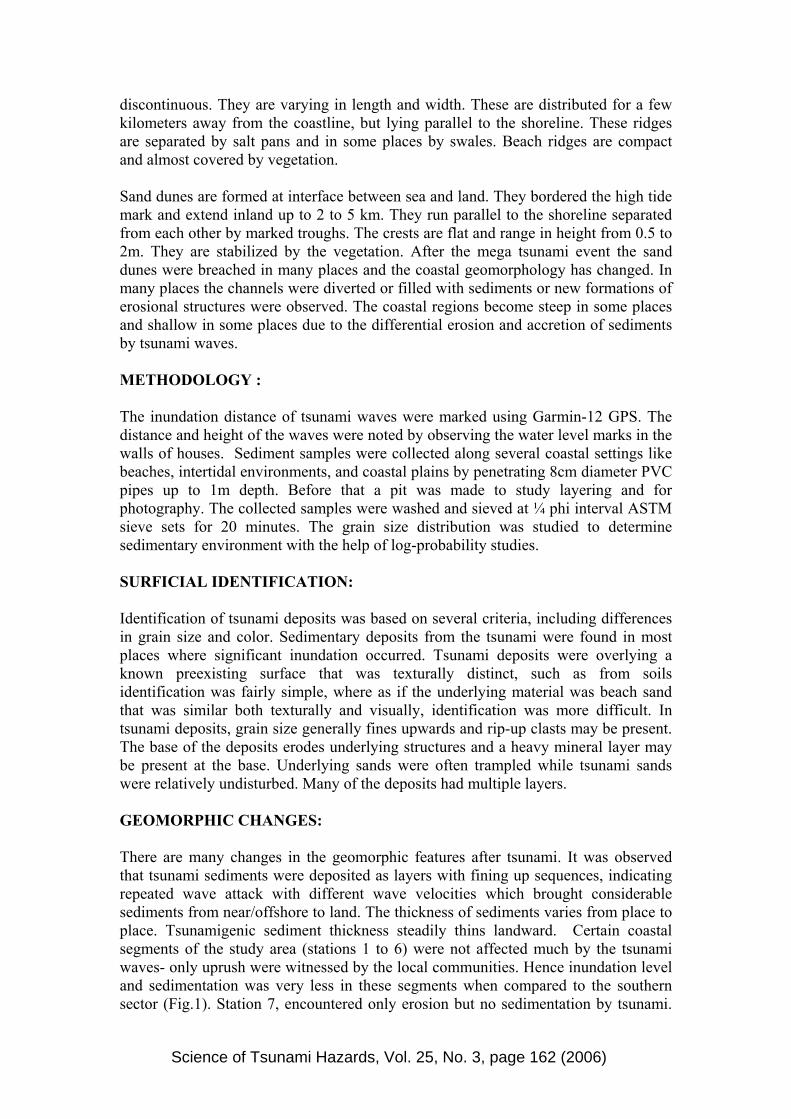
The size analyses of vertical core sample show a distinct difference between the deposition of sediments by normal cycle of waves and by tsunami waves. In Taruvaikulam, sediments were showing a sudden increase in mean size from 1.137 to 1.757 at a depth of about 40cm and 1.947 at the top. The bottom sediments having a maximum mean size of 1.307 at a depth of 80cm. The average mean size of the bottom sediments between 40 and 100 cm depth was only 1.214, where as the average above 40cm depth is 1.794 (Fig.3). Likewise there was a remarkable change in other size parameters also. This clearly indicates the sudden input of sediments during tsunami in the Taruvaikulam region. According to Sahu (1964), the variations in the energy and fluidity factors seem to have excellent correlation with the different processes and the environment of deposition. Sahu’s linear discriminant functions of Y1 (Aeolian, beach), Y2 (Beach, shallow agitated water), Y3 (shallow marine, fluvial) and Y4 (turbidity, fluvial) were used to decipher the process and environment of deposition. With reference to the Y1 and Y2 values, six samples (50%) fall in beach process (Y1) and ten (83%) samples deposited by shallow agitated water (Y2) respectively. Eleven samples (92%) were showing the Y3 values fall in shallow marine environment. The Y4 values show that about 42% of the samples were deposited by fluvial action and 58% by turbidity action (Table-2). The results indicate that most of the sediments were deposited under shallow marine environment by beach and fluvial processes by a near shore whirlpool agitating turbidity action of water.
Fig. 1 Showing inundation distance of tsunami waves towards inland
0 0.1 0.2 0.3 0.4 0.5 0.6 0.7
Rameswaram Koil
Godandaramar Ko il
M arakalayarpattinam
Kilakarai
Anaipar
Vembar
Vaipar
Taruvakulam
Vellapatty
Pullavali
New Harbour
N. harb.Guest House
Loca
tion
Distance (Km)
N
Science of Tsunami Hazards, Vol. 25, No. 3, page 165 (2006)
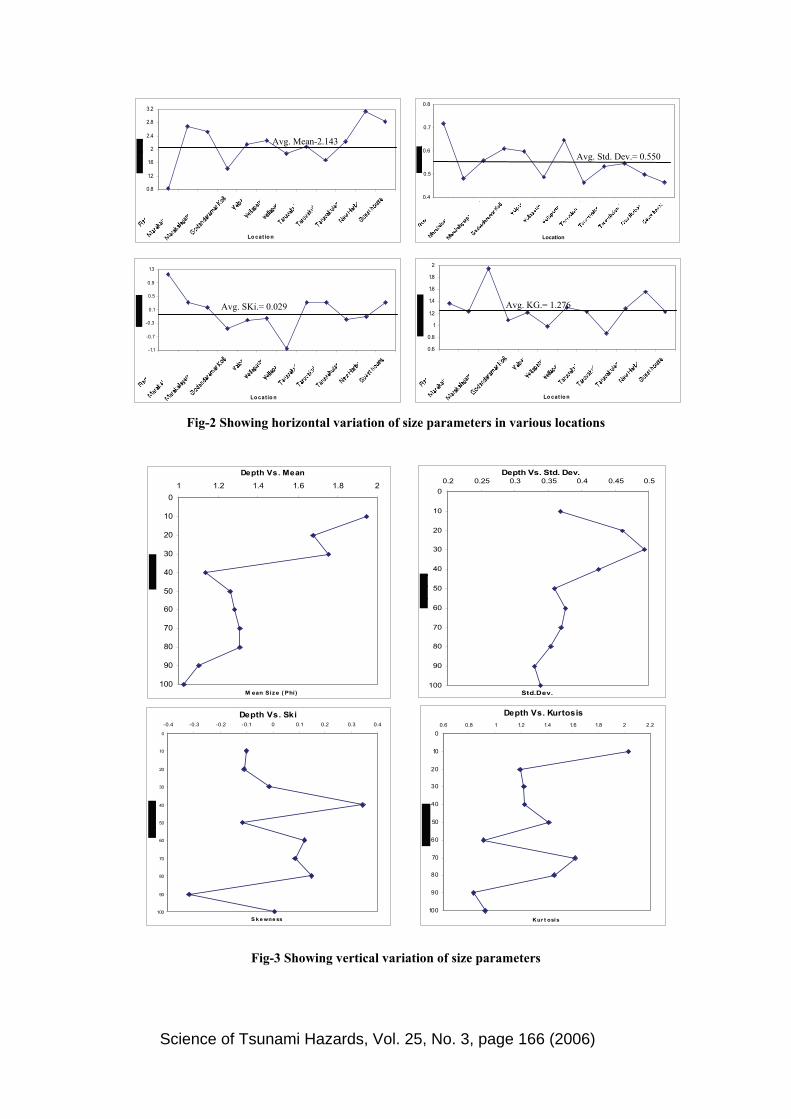
Fig-2 Showing horizontal variation of size parameters in various locations
Fig-3 Showing vertical variation of size parameters
Depth Vs. Mean
0
10
20
30
40
50
60
70
80
90
100
1 1.2 1.4 1.6 1.8 2
M ean Size ( Phi)
Depth Vs. Std. Dev.
0
10
20
30
40
50
60
70
80
90
100
0.2 0.25 0.3 0.35 0.4 0.45 0.5
Std.Dev.
Depth Vs. Ski
0
10
20
30
40
50
60
70
80
90
100
-0.4 -0.3 -0.2 -0.1 0 0.1 0.2 0.3 0.4
S k e wne ss
Depth Vs. Kurtosis
0
10
20
30
40
50
60
70
80
90
100
0.6 0.8 1 1.2 1.4 1.6 1.8 2 2.2
Kur t osi s
-1.1
-0.7
-0.3
0.1
0.5
0.9
1.3
Lo catio n
Avg. SKi.= 0.029
0.8
1.2
1.6
2
2.4
2.8
3.2
Lo cat io n
Avg. Mean-2.143
0.6
0.8
1
1.2
1.4
1.6
1.8
2
Lo cat io n
Avg. KG.= 1.276
0.4
0.5
0.6
0.7
0.8
Location
Avg. Std. Dev.= 0.550
Science of Tsunami Hazards, Vol. 25, No. 3, page 166 (2006)
SUMMARY AND CONCLUSION
The catastrophic waves generated by tsunami on 26th December, 2004 in the Indian Ocean devastated the Tamilnadu and parts of Andhra and Kerala coasts. Houses built along the coastal belt, coastal landforms and beaches were heavily damaged by strong tsunami inundation. The tsunami waves alter severely the mouth and estuary regions. The tsunami waves enter inland from the SSE direction in the study area as diffracted waves. The inundation varies from 0.01km to 0.6km. The waves alter the sediment dynamics when enter the coastal zone, thus altering the coastal geomorphology by breaching coastal dunes, eroding beaches to form new channels, filling of estuaries and backwater channels by sediments. This preliminary investigation gives an idea about the sedimentological evidence preserved between Rameswaram and Thoothukudi. The coastal morphology in Taruvaikulam and Thoothukudi harbor were altered by breaching of coastal dunes, erosion along the beach and deposition of fines along the coast. Effect of tsunami waves was more along the projected and flat beaches. The shallow shelf beaches were not affected by the tsunami waves. Beach erosion is also prominent in the flat beaches. Thick and extensive sediment deposition was observed at Taruvaikulam, where the coast is slightly projected towards the sea in the northern part. The northern part hence received a good sedimentation than the southern part, where there was no much change. In general the tsunami sedimentation in the study area indicate that they were deposited at different time intervals at different inundation distances. They were thinning landward. Multiple grading of sediment deposition was prominent, indicating that the deposition took place at different time intervals and by successive waves. From the granulometric analysis of sediments indicates a moderately well sorted nature of the sediments and moderate energy condition in the depositional environment. This is well supported by the mean size of sediments which vary from fine to medium in size and the standard deviation of sediments indicating that they were well sorted to moderately sorted characters. The sorting character infers that the sediments were from beach and not from rivers. The predominant positive skewness of the sediments indicating a unidirectional transport or deposition in sheltered low energy. The mesokurtic to leptokurtic nature of sediments refers to the continuous addition of finer or coarser materials and retention of their original characters during deposition. The size distribution of sediments indicate that a bimodal or polymodal distribution. The histogram indicates wide range of size distribution and asymmetrical nature of sediments, but predominantly the finer clastics are more and the lacking by coarser clastics. From the energy process discriminant functions of Sahu (1964), the sediments were deposited by beach and fluvial processes under shallow agitating environment and carried by turbidity action. The results indicate that most of the sediments were deposited by beach processes than by fluvial influence under a nearshore whirlpool agitating environment.
Science of Tsunami Hazards, Vol. 25, No. 3, page 167 (2006)

Acknowledgment: Author whole heartedly acknowledges DST-SERC for providing financial assistance in the form short term project. He also thanks to co-authors and university authorities for providing necessary infrastructure facilities for this research.
Map -1 Showing study area and sampling locations
Tamilnadu
Study area
Science of Tsunami Hazards, Vol. 25, No. 3, page 168 (2006)

Table – 1 Showing the Statistical Analysis of surface samples
Stn. No
Mean Std. Dev
Skewness Kurtosis Remarks
1. 0.830 0.717 1.145 1.375 Coarse sand, Moderately Sorted, St. Fine Skewed, Leptokurtic
2. 1.410 0.608 -0.473 1.093 Medium sand, Moderately Well Sorted, St.Coarse Skewed, Mesokurtic
3. 2.697 0.482 0.307 1.237 Fine Sand, Well Sorted, St. Fine Skewed, Leptokurtic
4. 2.517 0.558 0.173 1.949 Fine Sand, Moderately Well Sorted, Fine Skewed, Very Leptokurtic
5. 1.784 0.754 -0.179 1.324 Medium sand, Moderately, Coarse Skewed, Leptokurtic
6. 1.987 0.654 -0.241 1.056 Medium Sand, Moderately Well Sorted, Coarse Skewed, Mesokurtic
7. 2.154 0.598 -0.215 1.215 Fine Sand, Moderately Well Sorted, Coarse Skewed, Leptokurtic
8. 2.083 0.463 0.313 1.230 Fine sand, Well Sorted, St. Fine Skewed, Leptokurtic
9. 2.233 0.546 -0.185 1.277 Fine Sand, Moderately Well Sorted, Coarse Skewed, Leptokurtic
10. 2.267 0.486 -0.159 0.984 Fine Sand, Well Sorted, Coarse Skewed, Mesokurtic
11. 1.877 0.646 -1.055 1.296 Medium Sand, Moderately Well Sorted, St. Coarse Skewed, Leptokurtic
12. 3.153 0.498 -0.123 1.557 Very Fine Sand, Well Sorted, Coarse Skewed, Very Leptokurtic
13. 2.817 0.464 0.306 1.230 Fine Sand, Well Sorted, St. Fine Skewed, Leptokurtic
14. 1.770 0.556 0.203 0.853 Medium Sand, Moderately Well Sorted, Fine Skewed, Platykurtic
Table -2 Showing Linear discriminant function values (after Sahu, 1964)
Remarks
Stn.No. Y1 Y2 Y3 Y4 Y1 Y2 Y3 Y4
1. 0.8442 92.9487 -9.8033 15.3775 Beach Sh. Agitated water
Fluvial (deltaic)
Fluvial (deltaic)
2. 0.7216 58.0221 -0.4691 3.4689 Beach Beach Shallow Marine turbidity
3. -5.5512 85.9317 -2.7087 10.4661 Aeolian Sh. Agitated water
Shallow Marine
Fluvial (deltaic)
4. -2.1212 99.0565 -2.7624 13.1707 Beach Sh. Agitated water
Shallow Marine
Fluvial (deltaic)
5. 0.2317 86.5409 -3.5319 6.8605 Beach Sh. Agitated water
Shallow Marine turbidity
6. -1.7197 74.3849 -1.9501 5.2279 Beach Sh. Agitated water
Shallow Marine turbidity
7. -2.1341 75.8050 -1.4078 6.3932 Beach Sh. Agitated water
Shallow Marine turbidity
8. -3.4607 75.1198 -2.7562 10.0337 Aeolian Sh. Agitated water
Shallow Marine
Fluvial (deltaic)
9. -2.5055 74.8232 -1.0080 7.0043 Beach Sh. Agitated water
Shallow Marine turbidity
10. -3.8223 66.3357 -0.5972 5.6781 Aeolian Sh. Agitated water
Shallow Marine turbidity
11. 1.0720 61.6815 2.1043 0.9429 Beach Beach Shallow Marine turbidity
12. -5.2313 92.2353 -0.5965 9.5876 Aeolian Sh. Agitated water
Shallow Marine turbidity
13. -6.0622 86.5436 -2.5207 10.5158 Aeolian Sh. Agitated water
Shallow Marine
Fluvial (deltaic)
14. -2.9382 67.4795 -3.1556 7.0338 Aeolian Sh. Agitated water
Shallow Marine Turbidity
Science of Tsunami Hazards, Vol. 25, No. 3, page 169 (2006)
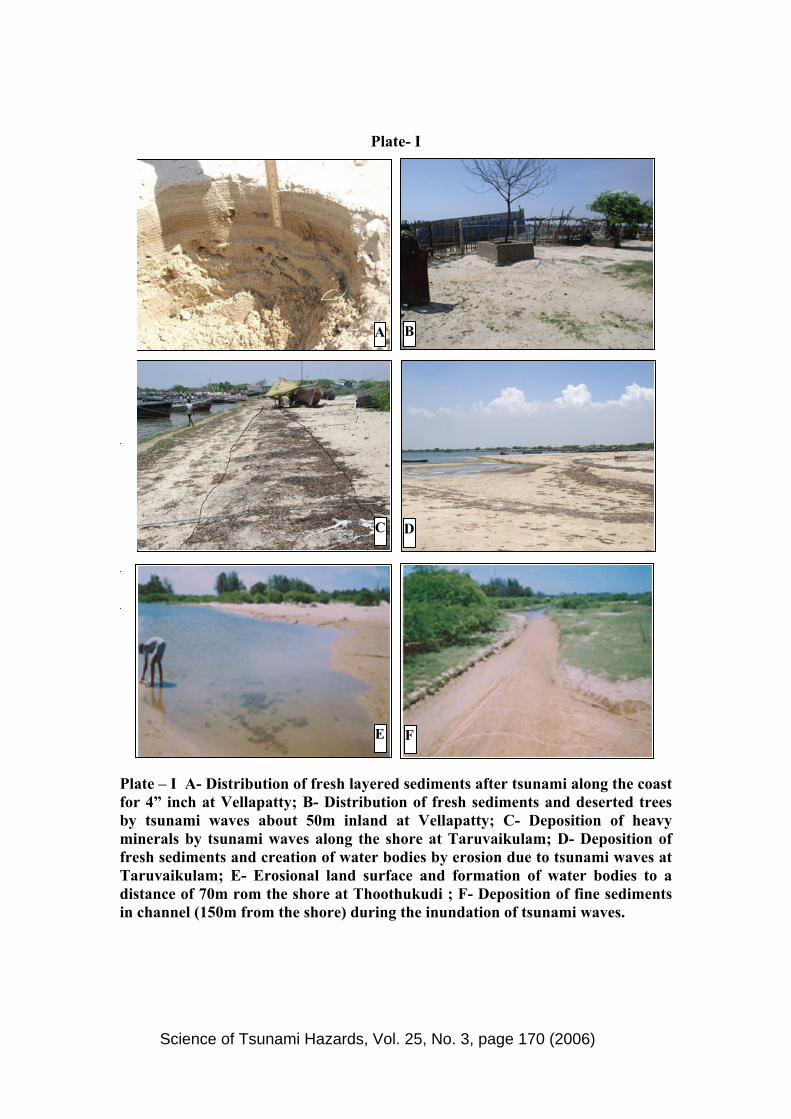
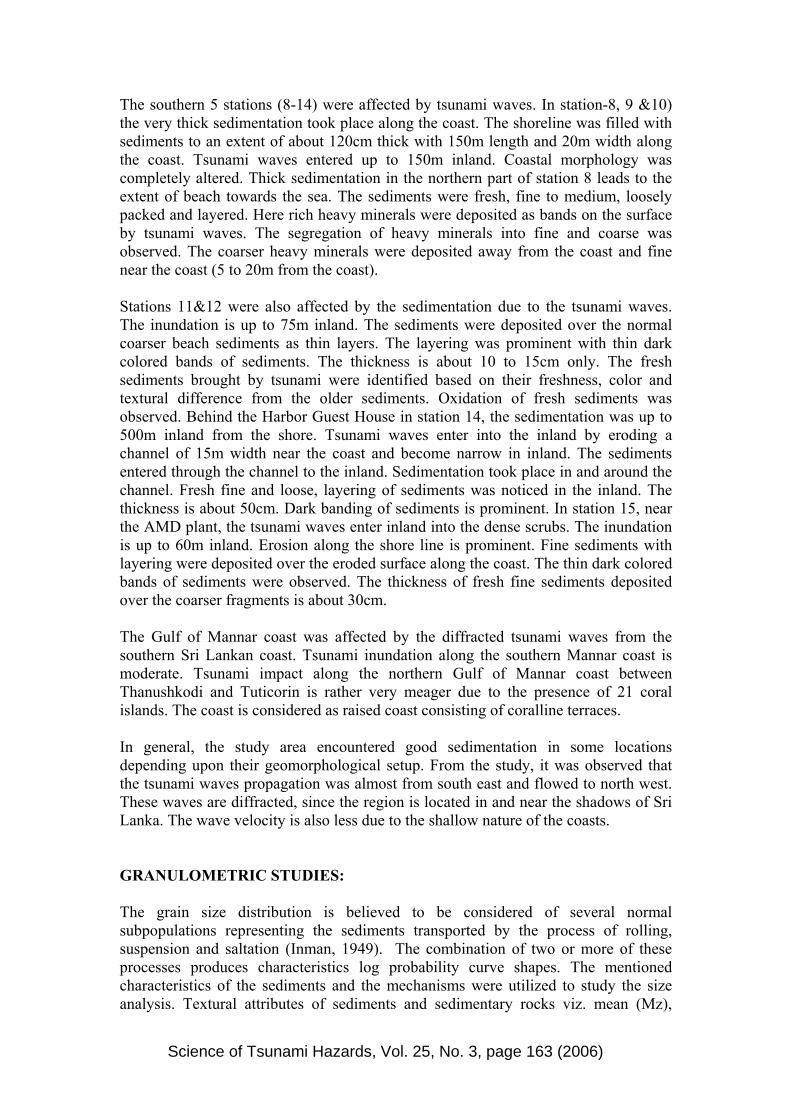
Plate- I
Plate – I A- Distribution of fresh layered sediments after tsunami along the coast for 4” inch at Vellapatty; B- Distribution of fresh sediments and deserted trees by tsunami waves about 50m inland at Vellapatty; C- Deposition of heavy minerals by tsunami waves along the shore at Taruvaikulam; D- Deposition of fresh sediments and creation of water bodies by erosion due to tsunami waves at Taruvaikulam; E- Erosional land surface and formation of water bodies to a distance of 70m rom the shore at Thoothukudi ; F- Deposition of fine sediments in channel (150m from the shore) during the inundation of tsunami waves.
C D
E F
BA
Science of Tsunami Hazards, Vol. 25, No. 3, page 170 (2006)
REFERENCES
Amaral, E.J. (1977): Depositional environment of the St. Peter sandstone deduced by textural analysis. Jour. Sed. Pet. 47, pp. 32-52.
Asselman,N.E.M. (1999): Grain size trends used to asses the effective discharge for flood plain sedimentation. River Waal, The Netherlands. Jour. Sed. Research. 69. p. 51-61.
Barbara K., Whealan.F., and J.Balley-Brock (2004): Tsunami deposits at Queen’s beach, Oahu, Hawaii- Initial results and wave modeling. Science of Tsunami Hazards, V. 22; No. 1. p. 23-43
Baruah,.J. Kotoky.P. and Sarma.J.N. (1997): textural and geochemical study on river sediments: A case study on the Jhanji river , Assam. Jour. Indian Assoc. Sedimentologists. 16. p. 195-206.
Brambati.A. (1969): Stratigraphy and sedimentation of Siwaliks of North Eastern India. Proc. Inter. Sem. Intermontane Basins: Geology and Resources, Chiang Mai, Thailand. P.427-439.
Chague-Goff, C., and J.R. Goff (1999): Geochemical and sedimentological signature of catastrophic saltwater inundations (tsunami), New Zealand. Quaternary Australasia. 17. p.38-48.
Clague, J.J., P.T. Bobrowsky and I. Hutchinson (2000): A review of geological records of large tsunamis at Vancouver Island, British Columbia and implications for hazard. Quaternary Sci. Rev. 19. p.849-863.
Dawson, A.G. and S.Z.Shi (2000): Tsunami deposits. Pure Appl. Geophys., 157, 875-897.
Dawson, A.G., D.Long and D.E.Smith (1988): The Storegga slides: evidence from eastern Scotland for a possible tsunami. Mar.Geol., 82. p.271-276.
Dominey-Howes,D., A.Cundy and I.Croudace (1999): High energy marine flood deposits on Astypalaea Island, Greece: Possible evidence for the AD1956 southern Aegean tsunami. Mar. Geol., 163. p. 303-315.
Duane, D.B. (1964): Significance of skewness in recent sediments, western Pamlico Sound, North Carolina; Jour. Sed. Pet., v.34.p.864-874.
Folk. R.L. and Ward, W.C. (1957): Brazos River Bar: a study in the significance of grain size parameters. Jour. Sed. Pet., 27. p. 3-26.
Friedman, G.M., (1961): distinction between (sic) dune, beach, and river sands from their textural characteristics: Jour. Sed. Pet., v.31.p.514-529.
----------------(1962): On sorting, sorting coefficients and the log normality of the grain-size distributions of sandstones. Jour. Geol. 70. p. 737-753.
----------------(1967): Dynamic processes and statistical parameters compared for size frequency (sic) distribution of beach (sic) and river sands. Jour. Sed. Pet. 37. p.327-354.
Inman, D.L.(1949) Sorting of sediments in the light fluid mechanics, Jour. Sed. Pet., 19, pp.51-70
Long, D., D.E.Smith and A.G. Dawson (1989): A Holocene tsunami deposits in eastern Scottland. Jour.Quaternary Sci.,4 p.61-66.
Malvarez.G.C., Cooper.J.A.G. and Jackson.D.W.T. (2001): Relationship between wave induced currents and sediment grain size on a sandy tidal flat. Jour. Sed. Research. 71., p. 705-712.
Science of Tsunami Hazards, Vol. 25, No. 3, page 171 (2006)

Mason.C.C. and Folk,R.L. (1958): Differentiation of beach, dune and eolian flat environments by size analysis, Mustang Island, Texas. Jour. Sed. Pet., 28. p.211-226.
Minoura,.K. and S.Nakaya (1991): Traces of tsunami preserved in inter-tidal lacustrine and marsh deposits: Some examples in northeast, Japan. Jour. Geology, 99. p.265-287.
Minoura, K. F.Imamura, U.Kuran, T.Nakamura, G.A. Papadopoulos, T.Takahashi and A.C.Yalciner (2000): discovery of Minoan tsunami deposits. Geology, 28, p. 59-62.
Nelson, A.R., I Shennan, and A.J.Lonh (1996 b): Identifying coastal subsidence in tidal wetland stratigraphic sequences at Cascadia subduction zone of western North America. J. Geophys. Res., 101 (B3), 6115-6135
Peterson, C.D. and M.E.Dareinzo (1996): Discrimination of climatic, oceanic and tectonic mechanisms of cyclic marsh burial. In assessing Earthquake Hazards.
Prabhakara Rao.A., Anilkumar.V., Yugandhar Rao.A., Ravi.G.S. and Krishnan.S. (2001): Grain size parameters in the interpretation of deposistional environments of coastal sediments between Bendi Creek and Vamsadhara river, East Coast, India. Jour. Indian Assoc. Sedimentologists. V.20.no.1. p. 106-116.
Sahu, B.K. (1964): Depositional mechanisms from the size analysis of clastic sediments. Jour. Sed. Pet., v.34.p.73-83.
Seralathan.P. and Padmalal.D (1994): Textural studies of the surficial sediments of Muvattupuzha river and central Vembanad Estuary, Kerala. Jour. Geol. Soc. India. 43. p. 179-190.
Valia. H.S. and Cameron, B. (1977): Skewness as paleoenvironmental indicators. Jour. Sed. Pet. 4. p.784-793
Visher, G.S. (1969): Grain size distributions and depositional process. Jour. Sed. Pet., 39. p. 1074-1106.
Wang.P., Davis.R.A. and Kraus.N.C.(1998): Cross shore distinction of sediment texture under breaking waves along low energy coasts. Jour. Sed. Research. 68. .497-506.
Wedephol, K.H. Ed. (1974): Handbook of Geochemistry, Springer Verlag Berlin, Heidelberg, New York.
Whelan, F. and Kelletat, D. (2003): Analysis of tsunami deposits at Trafalgar, Spain, using GIS and GPS technology. Essener Geographische Arbeiten 35; P.25.
Science of Tsunami Hazards, Vol. 25, No. 3, page 172 (2006)