Embed Size (px)
Citation preview

Security Valuation Chapter 35Tools & Techniques of
Investment Planning
Copyright 2007, The National Underwriter Company 1
Definition and Classification
• Security valuation is the use of analytic methods to determine the intrinsic value (as opposed to the observed market price) of a security.
• The intrinsic value is a forecasted value that reflects an investor’s expectations about future cash flows that will be generated through owning the asset, the required return for the class of risk represented by the asset, and present value considerations.

Security Valuation Chapter 35Tools & Techniques of
Investment Planning
Copyright 2007, The National Underwriter Company 2
Definition and Classification
• The intrinsic value, or value determined using a valuation method, is then compared to the market price to determine whether the security appears attractively priced.

Security Valuation Chapter 35Tools & Techniques of
Investment Planning
Copyright 2007, The National Underwriter Company 3
Definition and Classification
• There are several classes of valuation methods for assessing a security’s intrinsic value, including:– Discounted Cash Flow Methods– Market Based Methods– Asset Based Methods (more likely to be used for companies
that are expected to be liquidated)
• Equity securities (stock) are most commonly valued using the first two categories: discounted cash flow methods and market based methods

Security Valuation Chapter 35Tools & Techniques of
Investment Planning
Copyright 2007, The National Underwriter Company 4
• As with any investment, the intrinsic value of a stock can be determined by calculating the present value of the future cash flows expected to be received:
V0 = C1/(1+r)1 + C2/(1+r)2 C3/(1+r)3 +…+ Cn/(1+r)n
– Where V0 is the current value, C is the cash flow for each period (1,
2, 3...), r is the required rate of return, and n is the number of
periods.
• This intrinsic value can then be compared to the current market price to determine whether the security appears to be undervalued or overvalued.
Discounted Cash Flow Methods

Security Valuation Chapter 35Tools & Techniques of
Investment Planning
Copyright 2007, The National Underwriter Company 5
• For example, if the intrinsic value of an investment with a 10% required return is $10, but the market price is $9, the investment would be undervalued given your expectations and required return. – If you purchased the investment for $9, your expected return
would be greater than the required return of 10%. – If the market price was above $10, you would consider the
investment overvalued and your expected return would be less than 10%.
Discounted Cash Flow Methods

Security Valuation Chapter 35Tools & Techniques of
Investment Planning
Copyright 2007, The National Underwriter Company 6
• The critical variables are the cash flows and the discount rate.
• Cash flows must first be estimated.• Several cash flows can be used in a discounted cash
flow approach. The two most common are:– Dividends– Free cash flow to equity.
Discounted Cash Flow Methods

Security Valuation Chapter 35Tools & Techniques of
Investment Planning
Copyright 2007, The National Underwriter Company 7
• Dividends are cash flows that are actually distributed by the firm to shareholders. – They are distributions of earnings.
• Free cash flow to equity is the cash flow the company generates from its operations after deducting any needed investments in new assets. – Free cash flow to equity may be distributed to shareholders
as dividends or kept by the firm for future use.
Discounted Cash Flow Methods

Security Valuation Chapter 35Tools & Techniques of
Investment Planning
Copyright 2007, The National Underwriter Company 8
• The discount rate or required (desired) rate of return is the rate at which an investor is indifferent between receiving a small amount of money today or a larger
amount in the future. – In the investment world, this rate is highly dependent on the
general level of interest rates.
Discounted Cash Flow Methods

Security Valuation Chapter 35Tools & Techniques of
Investment Planning
Copyright 2007, The National Underwriter Company 9
Discounted Dividend Models
• Dividend Discount Models are popular for purposes of calculating the intrinsic value of a common stock.
• The factors used to determine intrinsic value in a dividend discount model are the expected dividend, the required return, and the expected growth.

Security Valuation Chapter 35Tools & Techniques of
Investment Planning
Copyright 2007, The National Underwriter Company 10
Discounted Dividend Models
• As the actual cash flows an investor will receive from stock holdings, dividends are an appropriate cash flow to value.
• A share of stock’s current value can be determined by forecasting future dividends per share and discounting them back to the current value at the required rate of return:
V0 = D1/(1+r)1 + D2/(1+r)2 + D3/(1+r)4+...+Dn/(1+r)n
– where D stands for dividends, Vo stands for the intrinsic value, and r
stands for the required rate of return

Security Valuation Chapter 35Tools & Techniques of
Investment Planning
Copyright 2007, The National Underwriter Company 11
Discounted Dividend Models
• Absent contrary evidence, companies are generally considered to be going concerns with dividend streams that continue into perpetuity.
• The further out in time a dividend occurs, the less it is worth in today’s dollars.– Consider a stock that is expected to pay a dividend of $1 at the end
of each of the next 30 years, for which investors require a 10% rate of return. In present value terms, each subsequent dividend is worth incrementally less than the previous dividend. By year 30, the $1 dividend is worth less than six cents in today’s dollars.
Security Valuation Chapter 35Tools & Techniques of
Investment Planning
Copyright 2007, The National Underwriter Company 12
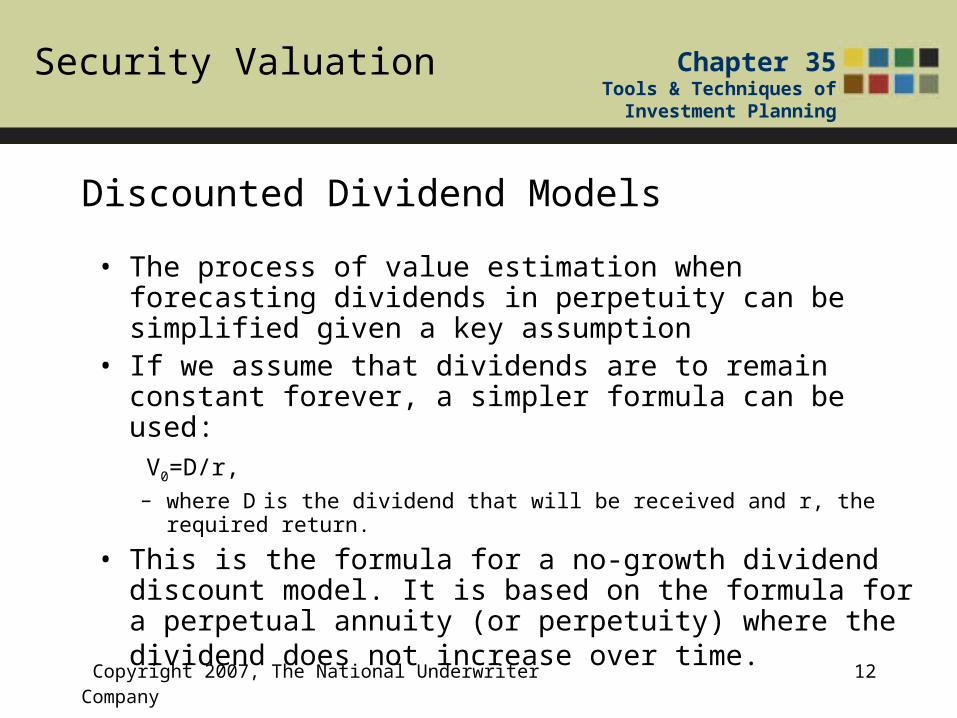
Discounted Dividend Models
• The process of value estimation when forecasting dividends in perpetuity can be simplified given a key assumption
• If we assume that dividends are to remain constant forever, a simpler formula can be used:
V0=D/r, – where D is the dividend that will be received and r, the required return.
• This is the formula for a no-growth dividend discount model. It is based on the formula for a perpetual annuity (or perpetuity) where the dividend does not increase over time.

Security Valuation Chapter 35Tools & Techniques of
Investment Planning
Copyright 2007, The National Underwriter Company 13
Example
Mark Mitchell is considering an investment in a regional utility that has paid the same annual dividend for the past 10 years of $1.25 per share. Mark views this investment as relatively low risk, but lacking in growth. Mark determines that he would be happy to receive a return of 8% per year on such investments. Using the no-growth dividend discount model Mark computes and intrinsic value of $15.63. Mark observes that the current market price is $17.50 and concludes that this is not a satisfactory investment since the market price exceeds his computed intrinsic value.

Security Valuation Chapter 35Tools & Techniques of
Investment Planning
Copyright 2007, The National Underwriter Company 14
Discounted Dividend Models
• There are few cases (some utilities and preferred stock issues) in which one can expect a constant, eternal stream of dividends.
• The no-growth dividend discount model’s assumptions can be relaxed to permit a dividend that grows at a constant rate, g:
V0 =D1/(r-g)
– Where D1 is next year’s expected dividend, r is the investor’s required rate of return, and g is the rate at which dividends are expected to grow
– This is the formula for a constant growth dividend discount model (also known as the Gordon Growth Model).
• Another version of this formula starts with this year’s dividend rather than next year’s expected dividend:
V0 =D0(1+g)/(r-g)

Security Valuation Chapter 35Tools & Techniques of
Investment Planning
Copyright 2007, The National Underwriter Company 15
Example
• Assume that a company paid a dividend this past year of $1.00 and that the dividend is expected to grow at a constant rate of 5% per year. The required rate of return is 10%. The intrinsic value of this security would be $21, calculated as follows:
V = [$1 (1+.05)} / (.10-.05) = 1.05/.05 = $21.– The investor would purchase the share only if it can be acquired for
$21 or less per share.

Security Valuation Chapter 35Tools & Techniques of
Investment Planning
Copyright 2007, The National Underwriter Company 16
Discounted Dividend Models
• Investors in stocks derive two sources of returns:– the dividend yield– the expected growth in share price (appreciation).
• Rewriting the dividend discount model and using the observed market price, rather than the intrinsic value, results in:
r = (D1/P) + g,
– where r is the expected return, D1 is next year’s expected dividend, P is the current observed market price, and g is the expected growth rate.

Security Valuation Chapter 35Tools & Techniques of
Investment Planning
Copyright 2007, The National Underwriter Company 17
Example
Evelyn Garcia is considering an investment in a large manufacturing company that paid dividends last year of $1.95. Evelyn believes that dividends will grow at 4% per year. Evelyn would like to earn an 11% return on this investment. Using the constant growth dividend discount model, Evelyn computes an intrinsic value of $28.97 [$1.95 (1.04)/(0.11-0.04)]. Evelyn observes that the current market price is $26 and concludes that this investment meets her criteria. Based on the current market price, Evelyn expects a return of 11.80% [($1.95(1.04)/$26) + 0.04 = 0.118).

Security Valuation Chapter 35Tools & Techniques of
Investment Planning
Copyright 2007, The National Underwriter Company 18
Discounted Dividend Models
• If growth is not expected to be constant, the dividend discount model can be extended to permit two or more separate growth rates.– A firm might be expected to grow at an unusually high rate
until it matures and then grow at the average for the economy.

Security Valuation Chapter 35Tools & Techniques of
Investment Planning
Copyright 2007, The National Underwriter Company 19
ExampleSalazar Ventures, Inc. (SVI) paid a dividend last year of $1.00. An investor who requires a return of 10% expects SVI’s dividend to grow 10% a year for the next three years. Subsequently, the growth rate is expected to fall to 5% in perpetuity. To apply a two-stage model we must first estimate the dividends for the next three years, and compute their present value:
$1.10/1.10 + $1.21/1.102 + $1.33/1.103 = $3.00Next we must calculate the value of the stock at the end of the 3rd
year as:$1.33(1.05)/(.10-.05) = $27.93
To determine the value today, we must discount the $27.93 back to the present for three years at the required return of 10%. This results in a present value of $20.98. Adding the second stage result to the $3.00 (present value of dividends) from stage one results in a total value today of $23.98.

Security Valuation Chapter 35Tools & Techniques of
Investment Planning
Copyright 2007, The National Underwriter Company 20
Discounted Free Cash Flow Models
• Other discounted cash flow models are available, and are often preferred over dividend-based models even when the company pays dividends.
• Free cash flow to equity, FCFE, is the company’s operating cash flow less capital investments and debt repayments. – While this cash flow is available for distribution as dividends
many companies choose to retain it for future use. – FCFE can be viewed as the cash flow that would be available to
an entity that acquired control of the subject company.– That said, even shareholders who buy only a few shares of
stock have an interest in the firm’s FCFE-based because the company could be acquired at that value or could begin paying much of the free cash flow as dividends in the future.

Security Valuation Chapter 35Tools & Techniques of
Investment Planning
Copyright 2007, The National Underwriter Company 21
Discounted Free Cash Flow Models
• The FCFE model is simply a dividend discount model where the dividend is replaced by FCFE per share:
V0 = FCFE1 / (r-g),
– Where Vo denotes the intrinsic value, FCFE1 represents next year‘s forecast of free cash flow to equity, r is the required rate of return and g refers to estimated growth.
Security Valuation Chapter 35Tools & Techniques of
Investment Planning
Copyright 2007, The National Underwriter Company 22
Discounted Free Cash Flow Models
• Its application is similar to the one described before under the dividend discount model. – The FCFE model can be expanded to multiple growth stages
by replacing dividends with FCFE per share.
• This method frequently used to value acquisitions including closely held businesses.

Security Valuation Chapter 35Tools & Techniques of
Investment Planning
Copyright 2007, The National Underwriter Company 23
Discounted Free Cash Flow Models
• Free Cash Flow to the Firm is another alternative that is often used in valuing firms in leverage buyouts or where the new owner plans to change the capital structure of the acquired firm. – Encompasses the cash flow available to all capital providers
including debt and equity holders– When valuing equity using free cash flow to the firm, the
value obtained is that of the overall enterprise (debt plus equity) not just the equity (stock) value.

Security Valuation Chapter 35Tools & Techniques of
Investment Planning
Copyright 2007, The National Underwriter Company 24
Discounted Free Cash Flow Models
• A company’s generation of free cash flow is appealing to external users– Companies that are able to generate free cash flow (whether
FCFE or FCFF) are often viewed as attractive takeover candidates.
– Free cash flow is also often discussed in company press releases as one metric to evaluate how well the company is doing.

Security Valuation Chapter 35Tools & Techniques of
Investment Planning
Copyright 2007, The National Underwriter Company 25
Example
Yahoo! Inc. included the following statement in a January 14, 2004 press release:
"We are very pleased with the strength of our fourth quarter and year-end results, and believe that they are a reflection of the strength of our current fundamentals and also represent progress on our key longer-term initiatives. As we exit our second consecutive year of strong free cash flow generation, we continue to re-invest in our customers, users and infrastructure," said Susan Decker, chief financial officer, Yahoo!. "We achieved tremendous growth this year balanced throughout the businesses of our company, and we remain focused on delivering long-term growth across our key financial metrics."

Security Valuation Chapter 35Tools & Techniques of
Investment Planning
Copyright 2007, The National Underwriter Company 26
Capitalized Earnings
• This method discounts earnings as opposed to cash flows.
• It is frequently used to evaluate real estate investments (including Real Estate Investment Trusts).
• In a capitalized earnings approach, some measure of historic earnings is divided by a capitalization rate (encompassing both the required rate of return for risk and expected growth) to obtain the intrinsic value:
V0 = Earnings / Capitalization Rate

Security Valuation Chapter 35Tools & Techniques of
Investment Planning
Copyright 2007, The National Underwriter Company 27
Capitalized Earnings
• The capitalization rate can be determined by subtracting the expected growth rate from a required rate of return that compensates for risk.
• However, the required rate of return is not the same as under the previous two models discussed, since earnings may not be readily available.– Cash flows such as dividends and free cash flow are available
to be spent currently – Earnings may have been reinvested in inventory or in other
assets– Investors may be unable to access them

Security Valuation Chapter 35Tools & Techniques of
Investment Planning
Copyright 2007, The National Underwriter Company 28
Capitalized Earnings
• Another approach, used frequently in real estate, is to develop a capitalization rate by looking at similar real estate companies/projects and determining their implied capitalization rate.
• However, care must be taken when using a capitalization of earnings approach since earnings are subject to a great deal of management discretion.– Earnings may be overstated (or even understated) and
result in an inappropriate estimate of value.
Security Valuation Chapter 35Tools & Techniques of
Investment Planning
Copyright 2007, The National Underwriter Company 29
Market Based Methods
• These methods involve estimating the intrinsic value of a security with reference to the value of other similar securities.
• This is done by comparing the market price, divided by some fundamental value such as earnings for the subject company, to that of similar peer companies.
• Some commonly used multiples include the following:• Price / Earnings• Price / Free Cash Flow• Price / Sales• Dividend/Price or Dividend Yield

Security Valuation Chapter 35Tools & Techniques of
Investment Planning
Copyright 2007, The National Underwriter Company 30
Market Based Methods
• A price/earnings ratio (P/E) is a stock’s price per share divided by earnings per share.
• The earnings per share is the firm’s net income divided by the number of shares of common stock outstanding.
• Many variations of P/E are used by professionals in determining which stocks to own or sell: annual earnings estimates, actual earnings (either last year’s or a running total of the most recent 12 months’ results).

Security Valuation Chapter 35Tools & Techniques of
Investment Planning
Copyright 2007, The National Underwriter Company 31
Market Based Methods
• P/E is a measure of relative value. • A high P/E ratio relative to other companies indicates
that the company is expensive relative to earnings. • The P/E ratio is directly related to the dividend
discount model.

Security Valuation Chapter 35Tools & Techniques of
Investment Planning
Copyright 2007, The National Underwriter Company 32
Market Based Methods
• Consider the no-growth dividend discount model, with the observed market price, P, replacing the intrinsic value, V0:
P = D/r• A no-growth company is one in which earnings are paid out as
dividends to shareholders rather than being reinvested in the company (either because the company simply chooses to or has no opportunities for growth). Therefore, for a no-growth company, earnings are equal to dividends and:
P = E/r
• From this, we can derive Justified or Warranted P/E for a no-growth company (in which earnings are paid out as dividends, such that earnings are equal to dividends):
P/E = 1/r

Security Valuation Chapter 35Tools & Techniques of
Investment Planning
Copyright 2007, The National Underwriter Company 33
Market Based Methods
• The intrinsic value of a no-growth company can be assessed by multiplying the justified P/E times the earnings per share:
V = Justified P/E x Earnings per Share
• In the case of growth companies:Justified P/E = [Payout ratio x (1+g)] / (r-g) – where P/E is the current price divided by last year’s earnings per
share; payout ratio is the proportion of earnings paid out as dividends (in decimal form); r is the required rate of return; and g is the expected growth rate.

Security Valuation Chapter 35Tools & Techniques of
Investment Planning
Copyright 2007, The National Underwriter Company 34
Market Based Methods
• Since the theoretical P/E is derived from the dividend discount model, it will provide the same estimate of intrinsic value as the dividend discount model.
• However, it is useful to determine how factors influence the P/E ratio: – Risk– Expected growth.
• A company with higher risk than other companies will have a higher required rate of return and therefore should trade at a lower P/E ratio.
• A company with a higher growth rate should trade at a higher P/E ratio.

Security Valuation Chapter 35Tools & Techniques of
Investment Planning
Copyright 2007, The National Underwriter Company 35
Market Based Methods
• Similar companies can have different exposure to risk and growth. – If a company has a higher growth rate than its peers (or
lower risk), it might deserve its higher multiple.
• A commonly used method of assessing P/E ratios relative to growth is to compute a PEG ratio.

Security Valuation Chapter 35Tools & Techniques of
Investment Planning
Copyright 2007, The National Underwriter Company 36
Market Based Methods
• The PEG ratio is calculated by dividing the P/E ratio by the firm’s earnings growth rate:
PEG ratio = (P/E) / g.
• The higher the growth rate, the lower the PEG ratio and the higher the value of the stock.

Security Valuation Chapter 35Tools & Techniques of
Investment Planning
Copyright 2007, The National Underwriter Company 37
Market Based Methods
• Care must be taken when using the PEG ratio for several reasons:– Expected growth is normally only available for short periods
of time (five years). – Companies that have a lower but more persistent growth
rate may be penalized by the model. – The PEG formula assumes a linear relationship between
growth and P/E ratios, which is not strictly correct. – The PEG ratio does not consider differences in risk between
the companies, which is another major factor in justified P/E ratios.

Security Valuation Chapter 35Tools & Techniques of
Investment Planning
Copyright 2007, The National Underwriter Company 38
Market Based Methods
• P/E ratios in general are limited in that earnings can be subject to differences between companies due to accounting methods and other non-operating reasons that can make companies non-comparable.
• Ideally, peer companies should be in the same industry, of similar size, and use similar accounting methods.
• It is imperative to remember that any estimate of future growth is just that—an estimate.

Security Valuation Chapter 35Tools & Techniques of
Investment Planning
Copyright 2007, The National Underwriter Company 39
Market Based Methods
• P/E ratios are not only useful in evaluating companies, but are useful in evaluating the holdings of mutual funds.
• One metric used to evaluate equity mutual funds is the average (or median) P/E ratio of the underlying stocks.

Security Valuation Chapter 35Tools & Techniques of
Investment Planning
Copyright 2007, The National Underwriter Company 40
Example
Morninstar.com provides the following glossary information on mutual fund P/E ratios (as of July 15, 2006):
“A fund's price/earnings ratio can act as a gauge of the fund's investment strategy in the current market climate, and whether it has a value or growth orientation. The price/earnings (P/E) ratio of a fund is the weighted average of the price/earnings ratios of the stocks in a fund's portfolio. The P/E ratio of a company, which is a comparison of the cost of the company's stock and its trailing 12-month earnings per share, is calculated by dividing these two figures. At Morningstar, in computing the average, each portfolio holding is weighted by the percentage of equity assets it represents, so that larger positions have proportionately greater influence on the fund's final P/E. A high P/E usually indicates that the market will pay more to obtain the company's earnings because it believes in the firm's ability to increase its earnings. Companies in those industries enjoying a surge of popularity (e.g.: telecommunications, biotechnology) tend to have high P/E ratios, reflecting a growth orientation. (P/Es can also be artificially inflated if a company has very weak trailing earnings, and thus a very small number in this equation's denominator.) A low P/E indicates the market has less confidence that the company's earnings will increase; however, a fund manager or an individual with a 'value investing' approach may believe such stocks have an overlooked or undervalued potential for appreciation. More staid industries, such as utilities and mining, tend to have low P/E ratios, reflecting a value orientation.”

Security Valuation Chapter 35Tools & Techniques of
Investment Planning
Copyright 2007, The National Underwriter Company 41
Market Based Methods
• P/E ratios can also be viewed in an inverse format as E/P.
• E/P is known as the earnings yield.– This is an alternative view of value.– Companies with high P/E ratios have low earnings yields
and companies with low P/E ratios have high earnings yields.

Security Valuation Chapter 35Tools & Techniques of
Investment Planning
Copyright 2007, The National Underwriter Company 42
Market Based Methods
• Other market based methods include: Price to Free Cash Flow (FCFE), Price to Sales Approach (PSR), and Dividend Yield Approach
• A theoretical P/FCFE model can be derived as:
P / FCFE= (1+g) / (r-g), – Where FCFE is free cash flow to equity for the last year
• A P/FCFE approach involves comparing a subject company’s ratio to those of similar companies to determine if it appears properly valued.– As with the P/E ratios, differences may be justified by differences in
risk and growth.

Security Valuation Chapter 35Tools & Techniques of
Investment Planning
Copyright 2007, The National Underwriter Company 43
Market Based Methods
• A theoretical Price-to-Sales ratio is:Price / Sales = {Profit Margin x Payout ratio x (1+g)} / (r-g),
– Where profit margin is a company’s earnings divided by sales, payout ratio is the portion of earnings paid out as dividends, g is the expected growth rate, and r is the required rate of return.
• Price-to-Sales is useful when the company has no dividends or earnings.– The practical application is the same as with the P/E ratio where
the P/S ratio is compared to those of peer companies.

Security Valuation Chapter 35Tools & Techniques of
Investment Planning
Copyright 2007, The National Underwriter Company 44
Market Based Methods
• Dividend Yield Approach– Utilizes price per share and dividends– Expresses relative dividend valuation in terms of dividend
yield (D/P)
• Companies with high dividend yields would indicate a good value (low price relative to dividends).
• Companies with low dividend yields (or zero) are likely to be growth oriented companies that choose to reinvest cash flow in the business.
• Taxation of Dividends can play a role in investor decision-making
Security Valuation Chapter 35Tools & Techniques of
Investment Planning
Copyright 2007, The National Underwriter Company 45
Asset Based Methods
• Alternatively, book value per share can be used to compute a price to book value ratio (P/B) and a relative valuation can be performed as in the market approach presented before.
• The value of a company may be assessed based on the book value of its underlying assets (less frequent).

Security Valuation Chapter 35Tools & Techniques of
Investment Planning
Copyright 2007, The National Underwriter Company 46
Asset Based Methods
• Book value is the amount reported on the company’s financial statements.– A balance sheet shows the assets a company owns and the
claims against those assets. • Book value per share is found by dividing the
difference between the company’s total assets and total liabilities by the number of its shares.– The numerator of book value per share is stockholder’s equity, the
amount that stockholders have invested over time in the company

Security Valuation Chapter 35Tools & Techniques of
Investment Planning
Copyright 2007, The National Underwriter Company 47
Asset Based Methods
• However, most companies sell for more than book value: – Assets in balance sheets may be valued at historical cost
and do not reflect current value. – Many companies are more valuable as going concerns than
as the sum of their assets minus liabilities • Book value does not consider the value as an ongoing
operation.