Embed Size (px)
Citation preview
Security Defenses for Vulnerable Medical Sensor
NetworkRenchi Yan, Vaibhav Chetan Shah, Teng Xu and Miodrag Potkonjak
Computer Science Department
University of California, Los Angeles
{renchi.yan, vaibhav289, xuteng, miodrag}@cs.ucla.edu
Abstract—Medical sensor networks have facilitated a widerange of applications in healthcare. However, these systems arein particular vulnerable to security attacks due to the factthat they are often not physically secured and are used inpotentially hostile environments. We have proposed a theoreticaland statistical framework for creating attacks and also thecorresponding security defenses that include attack detection,diagnosis, and impact removal. We use medical shoes to collectdata and demonstrate that low energy and low cost of medicalsensor networks increase the probabilities of successful attacks.Our approach maps a semantic attack to an instance of anoptimization problem where medical damage is maximized underthe constraints of the probability of detection and root causetracing which may consequence in incorrect medical diagnosisand treatment. Our results show that it is easy to attack severalessential medical metrics and to alter corresponding medicaldiagnosis. Finally, we have developed several low energy and lowoverhead defense procedures for detecting and analyzing semanticsecurity attacks.
I. INTRODUCTION
Healthcare applications are increasingly using Wireless sen-sor networks(WSN) to extract important health informationfrom them. Through its remote sensing ability, WSN in health-care has helped in creating numerous wireless health applica-tions and has also extended the scope of medical diagnosis. Forexample, medical experts can examine the day-to-day activitiesof a patient or analyze the patients’ physiological data collectedfrom sensors on a regular basis. This also eliminates the needto solely rely on in-person medical check-ups while improvingthe quality of care.
Embedded medical sensor networks are becoming popularas they are low-cost solutions to a variety of medical chal-lenges. Having accurate information is critical in dealing withthese medical sensor networks. For example the medical expertcan carry out the right treatment only if he/she has accurateinformation about the condition of the patient. Inaccuratemedical readings can produce irreversible damage which caneven lead to the death of a patient.
However, embedded medical sensor network enforces strictconstraints on energy and power consumption. Both of theseact as major obstacles in the application of traditional securitytechniques to medical sensors. Security is extremely criticalin medical devices as even a small error due to tamperingcan cause wrong diagnosis and can potentially endanger the
life of a patient. Moreover, in making medical devices energy-efficient by reducing the number of sensors used; makes themmore susceptible to semantic attacks. Traditional cryptographycan only guarantee the data to be safe through the wirelesschannels. However, it cannot prevent malicious manufacturersbecause of their special privileges in manufacturing. Crypto-graphic techniques are not suitable for semantic attacks as themedical devices are sometimes unattended which can lead totheir tampering and subsequent malfunctioning. Our focus isthat the medical expert should be able to detect the attacks inreal time even though the data has been tampered.
Many papers have been written to address communicationbased security issues of wireless sensor networks in healthcareapplications [1] [2]. However, we focus on semantic attacks.A semantic attack is the one in which the attacker modifiesinformation in such a way that the result is incorrect, butlooks correct to the casual or perhaps even the attentive viewer.We demonstrate that by implementing simple attacks; theattacker can hamper the result drastically. In this experimentwe prove that by attacking several essential medical metrics,the diagnosis can be changed considerably yet generatingacceptable results. We also propose defenses against thesesemantic security attacks that can detect the respective attacks.We evaluate both attacks and defenses under two different sce-narios with respect to the number of sensors used to generatethe results for comparing and analyzing our techniques.
Our proposed semantic attacks are possible in real scenarios.For example, if a malicious attacker is able to break into thecomputer of a medical expert or a malicious party can even bethe manufacturer of medical shoes who can create back doorsinto the embedded sensors such that he/she can easily accessand tamper the sensor data. However, from the perspective ofattacker, he/she cannot be too aggressive as too much deviationfrom the original data will easily make the medical expertsuspicious about the data being tampered.
We evaluate our attacks and defenses on the Hermes shoeplatform, which is designed to assess balance and instabilityin patients [3].It consists of 99 pressure sensors distributedin each insole and integrated with a common computingplatform. The special features of a person’s gait which arehighly correlated to his/her risk of falling as shown by Maki[4] are used for the attack and defense evaluation.
This paper presents the following research contributions: 1)One of the first to analyze the impact of semantic attackson the security of wireless medical devices; 2) Propose two
2014 IEEE International Conference on Healthcare Informatics
/14 $31.00 © 2014 IEEE
DOI 10.1109/ICHI.2014.48
300
2014 IEEE International Conference on Healthcare Informatics
/14 $31.00 © 2014 IEEE
DOI 10.1109/ICHI.2014.48
300
2014 IEEE International Conference on Healthcare Informatics
978-1-4799-5701-9/14 $31.00 © 2014 IEEE
DOI 10.1109/ICHI.2014.48
300
2014 IEEE International Conference on Healthcare Informatics
978-1-4799-5701-9/14 $31.00 © 2014 IEEE
DOI 10.1109/ICHI.2014.48
300
novel semantic attacks that can impact the result in a greatmanner and also corresponding defenses to identify the same;3) Detailed analysis showing that using more sensors arepotentially more resilient to semantic attacks.
The remainder of this paper is organized as follows: In Sec-tion II and III we present the related work and the preliminaryknowledge required for the experiment. Section IV gives ashort overview of the metrics considered and our formulationof the result. Sections V and VI provide the implementationdetails of our proposed attacks and defenses on the specifiedmetrics and their evaluation. Finally we conclude the paperwith Section VII summarizing our findings and stating ourconclusions.
II. RELATED WORK
In the last decade, wireless medical devices and correspond-ing techniques have attracted a great deal of research anddevelopment interest. More recently a significant emphasis hasbeen made on security issues. For example several researchgroups at different universities including University of Michi-gan, University of Massachusetts Amherst, MassachusettsInstitute of Technology, Rice and Princeton have reportedtechniques that enabled security compromise of so popular andimportant devices such as pacemaker [5], implantable cardiacdefibrillator[6] and insulin pumps [7] [8].
In addition, actual medical community has been rapidlybecoming more aware of power and energy limitations ofsecurity techniques used for medical devices [9] [10] . Inaddition to security, other issues such as privacy [11] andtrust [12] [13] have received significant attention. As a matterof fact many other aspects related to security in medicalapplications such as systems that integrate wireless devices andcloud computing have been addressed [14] [15]. We concludeout brief survey in wireless medical devices by pointing totwo comprehensive reviews in this research field [16] [17].Meanwhile, hardware based technology has been proposed tosecure the sensor network [18][19]. Protocols to protect theintegrity of sensor data are proposed in [20].
While all previous efforts in this field emphasized vulnera-bilities of used wireless security protocols and their potentialfixes, we focus on actual alteration of collected sensor datain such a way that semantic conclusion of medical expertsis altered. This alteration leads to incorrect treatments whichmight compromise the medical well being of a subject.
III. PRELIMINARIES
A. Medical Shoe
Medical sensor networks are inherently semantics-drivensystems. The medical expert is generally not concerned withthe actual sensor readings but rather more concerned with thesemantic information like the gait characteristics mentionedbelow. Hence we try to attack this semantic information sothat maximum harm can be caused.
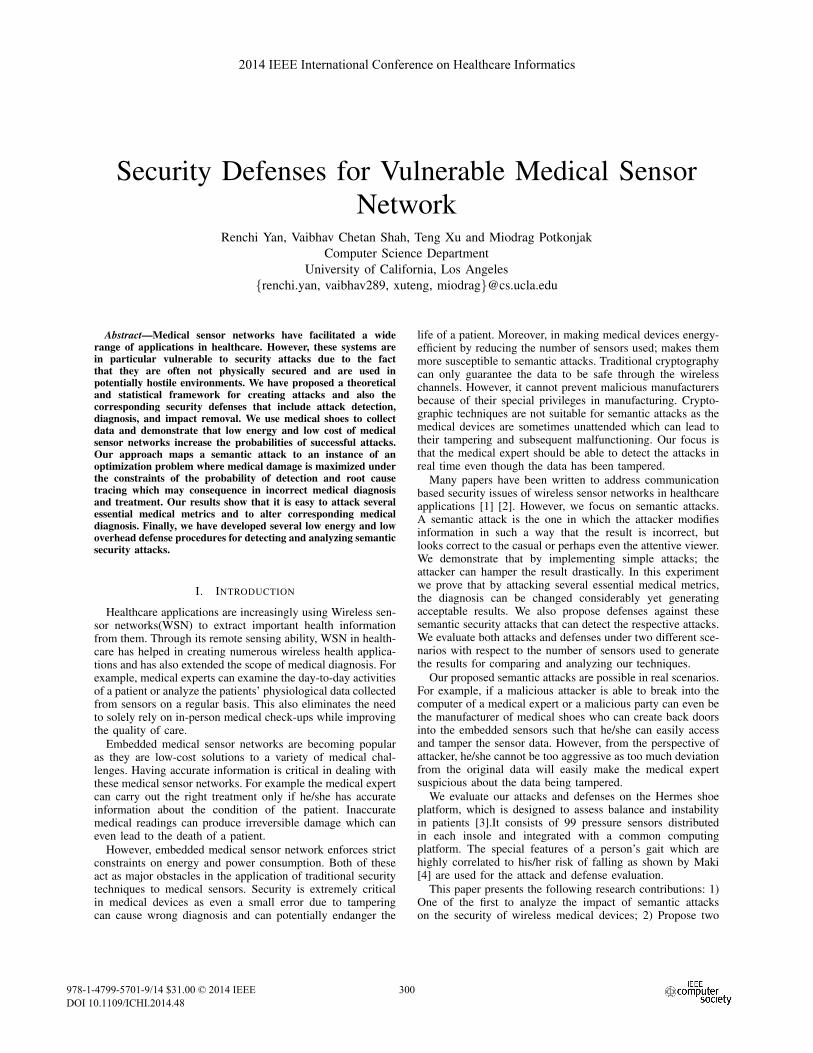
We evaluate our attacks and defenses on our medical shoewhich consists of 99 sensors distributed about the sole of thefoot, a processing unit, flash memory, a radio, and an ADC.The sensor placement is according to the Pedar plantar pressure
Fig. 1: The 99 sensor mapping of Hermes shoe platform.
mapping system [21] as shown in Figure 1. The numberingof the sensors according to their position is also depicted inFigure 1.
B. Data Set
Our dataset includes pressure readings over all the 99sensors for each shoe sampled at 50hz for four persons respec-tively using a 16-bit analog-to-digital converter. The resultingtime-dependent pressure mappings are used to calculate thebelow mentioned gait characteristics from the full dataset. Thedataset includes hundreds of steps of all the subjects which alsoincorporates data for each foot of a person separately.
The pressure readings are collected for seven differentscenarios namely walk, jump, lean, run, stand, limp, slow-walk. In our paper we focus on the walk readings and calculatethe impact of our attacks and defense mechanisms.
IV. METRICS AND FORMULATION
Maki [4] has observed that stride-to-stride variability inspeed has a strong correlation with the risk of falling. Thespatial gait parameters related to this variability like strideperiod, double support, stride length, stride width and stridevelocity help in predicting the danger of falling. We takeinto consideration the two important metrics namely strideperiod and double support to simulate our attacks and defensesrespectively.
Stride-to-stride consistency is taken into account by comput-ing the average of differences between two consecutive valuesof a specific feature. Moreover if the patient is not able to walkwith consistency; they are normally at higher risk of falling.Hence higher the variation; higher is the instability. Thus ingeneral, variation in a metric signifies increased instability.
In order to calculate the stride period with the help of ourdataset, we generated the walk waveform of each subject’s leftand right foot separately. The left foot walk waveform of thefirst subject is shown in Figure 2. The peaks with the highestpressure in this waveform represent the moment of highestpressure and hence it symbolizes the contact of foot with theground. We measure the difference between two successivepeaks to determine the required stride period. Then variation iscalculated by taking the average of all the absolute differences
301301301301

Fig. 2: The waveform of the stride period metric.
Fig. 3: The waveform of the double support metric.
of stride periods. SP(i) represents stride period at ith step andn represents the total number of steps.
Similarly to calculate double support, we superimpose thewalk waveforms of each person’s left and right foot as shownin Figure 3. We measure the overlap time between peaks ofthe two waveforms at the same time slot giving us the durationfor which both the feet are in contact with the ground simulta-neously. Variation is determined by taking the average of theseabsolute differences. ds(i) represents the double support timeat ith step in both feet and min(SP(i)) represents the minimumof left and right stride period at ith step. The dotted horizontalline passing through the waveform in Figure 3 indicates thelevel above which we assume that both the feet of the personare on the ground simultaneously.
V arSP = 1/nn∑
i=1
|SP (i+ 1)− SP (i)| (1)
V arDS = 1/nn∑
i=1
|ds(i+1)
min(SP (i+1))−
ds(i)
min(SP (i))| (2)
Thus instability can be calculated from these variationsbased on equation 1 and 2. The coefficients γSP and γDS
indicate the significance of a particular metric. The coefficientscan be adjusted by the medical specialists.
Instability = γSPV arSP + γDSV arDS (3)
We attack these two important metrics under two differentscenarios namely using the summation of 99 sensors and thesummation of just twenty fixed sensors for medical diagnosis.Furthermore, we develop two defense procedures against thesesemantic attacks under the same scenarios.
V. SECURITY ATTACKS
A. Goals and Challenges
Various types of attacks can be introduced in wireless sensornetworks. The starting point in our creation of semantic attacksis to mislead the medical diagnosis as far as possible which canbe done by altering the original V arSP and V arDS to somelarge extent. However, the main challenge for the attacker isto maintain a balance between the outcome of the attack andthe risk of the attack being detected. For example, suppose inone attack, the attacker changes the pressure value of manysensors or changes some amount of sensors by a large amountof pressure then that attack will be easily detected if themedical expert looks into the statistical properties of the dataand compares it with the historical data. As a result, the criteriain designing semantic attacks is to assume limited access tothe sensors for the attacker and also of not being suspiciousat the same time. In other words, the attacker must follow theconstraints.
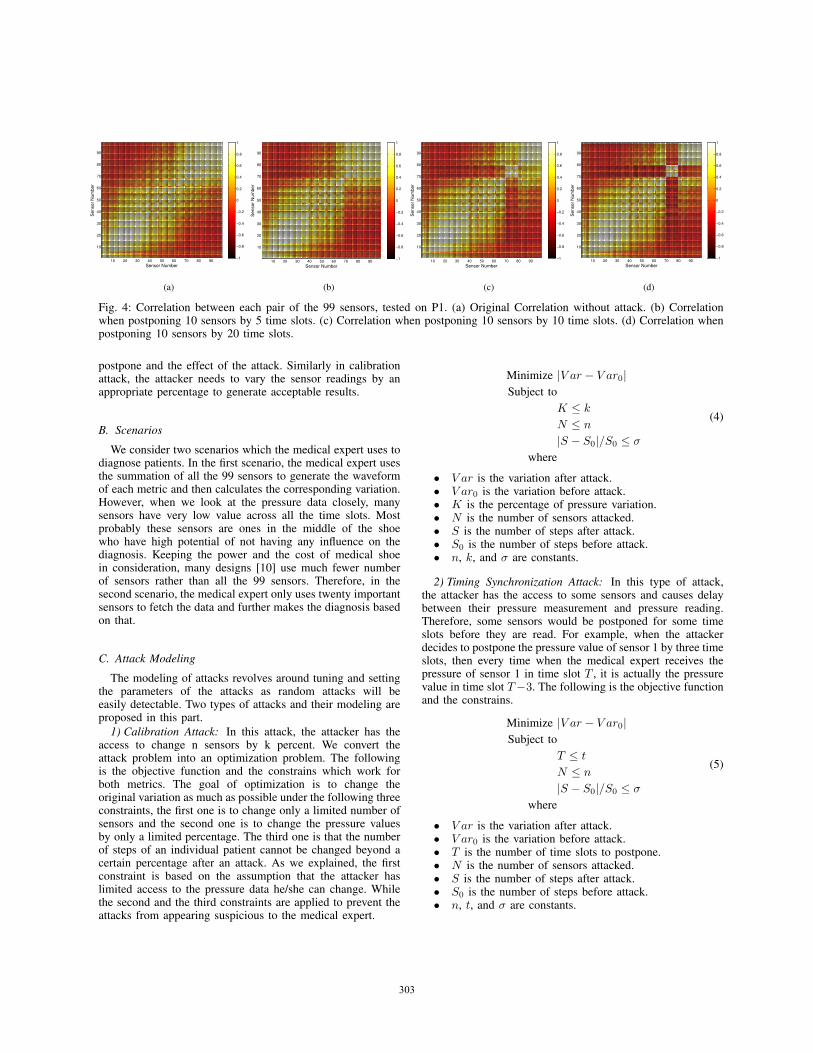
In principle, we propose two attacks on the pressure data.In the first type of attack, we assume that the attacker canchange n sensors by k percent. In the second type of attack,the attacker postpones the pressure data of some sensors forcertain time slots. And we claim that a type of attack is “good”when the attacker only changes a small number of sensorsbut changes the variation to a certain degree and yet remainsunsuspicious. The intuition behind the calibration attack is thatwhen some sensors with high pressure are being changed, thewaveform of the pressure is influenced significantly and thusthe variation is modified. This type of attack only requires theattacker to change the calibration of the sensor value whichcan be achieved at either software or hardware level andthus it is easy and feasible. However, if some sensor showsextraordinary high or low value, it can be easily detected bythe medical expert. Hence we put constrains on the percentageupto which the pressure of each sensor can be altered. Oursecond type of attack is from the perspective of timing. Theattacker intentionally introduces delay on some sensor readingsso that part of the original waveform of pressure is shiftedby some time slots. This type of attack is simple, low costand the only need is to introduce delay to some sensors. Butthe main problem here is to decide the number of time slotsthe attacker should delay while still being unsuspicious to themedical experts. One of the simplest defense technique is tolook into the sensor correlations and thus to get an idea of it weanalyzed the correlation between each pair of the 99 sensorswhen ten sensors are postponed to respectively five, ten, andtwenty time slots. The results are shown in Figure 4a, 4b, 4c,and 4d. It is obviously seen that when the number of postponedtime slots increase, the correlation between the sensors changesdramatically which is easily detectable. Therefore, the attackerneeds to seek for a balance between the number of time slots to
302302302302
10 20 30 40 50 60 70 80 90
10
20
30
40
50
60
70
80
90
Sensor Number
Sensor
Num
ber
−1
−0.8
−0.6
−0.4
−0.2
0
0.2
0.4
0.6
0.8
1
(a)
10 20 30 40 50 60 70 80 90
10
20
30
40
50
60
70
80
90
Sensor Number
Sensor
Num
ber
−1
−0.8
−0.6
−0.4
−0.2
0
0.2
0.4
0.6
0.8
1
(b)
10 20 30 40 50 60 70 80 90
10
20
30
40
50
60
70
80
90
Sensor Number
Sensor
Num
ber
−1
−0.8
−0.6
−0.4
−0.2
0
0.2
0.4
0.6
0.8
1
(c)
10 20 30 40 50 60 70 80 90
10
20
30
40
50
60
70
80
90
Sensor Number
Sensor
Num
ber
−1
−0.8
−0.6
−0.4
−0.2
0
0.2
0.4
0.6
0.8
1
(d)
Fig. 4: Correlation between each pair of the 99 sensors, tested on P1. (a) Original Correlation without attack. (b) Correlationwhen postponing 10 sensors by 5 time slots. (c) Correlation when postponing 10 sensors by 10 time slots. (d) Correlation whenpostponing 10 sensors by 20 time slots.
postpone and the effect of the attack. Similarly in calibrationattack, the attacker needs to vary the sensor readings by anappropriate percentage to generate acceptable results.
B. Scenarios
We consider two scenarios which the medical expert uses todiagnose patients. In the first scenario, the medical expert usesthe summation of all the 99 sensors to generate the waveformof each metric and then calculates the corresponding variation.However, when we look at the pressure data closely, manysensors have very low value across all the time slots. Mostprobably these sensors are ones in the middle of the shoewho have high potential of not having any influence on thediagnosis. Keeping the power and the cost of medical shoein consideration, many designs [10] use much fewer numberof sensors rather than all the 99 sensors. Therefore, in thesecond scenario, the medical expert only uses twenty importantsensors to fetch the data and further makes the diagnosis basedon that.
C. Attack Modeling
The modeling of attacks revolves around tuning and settingthe parameters of the attacks as random attacks will beeasily detectable. Two types of attacks and their modeling areproposed in this part.
1) Calibration Attack: In this attack, the attacker has theaccess to change n sensors by k percent. We convert theattack problem into an optimization problem. The followingis the objective function and the constrains which work forboth metrics. The goal of optimization is to change theoriginal variation as much as possible under the following threeconstraints, the first one is to change only a limited number ofsensors and the second one is to change the pressure valuesby only a limited percentage. The third one is that the numberof steps of an individual patient cannot be changed beyond acertain percentage after an attack. As we explained, the firstconstraint is based on the assumption that the attacker haslimited access to the pressure data he/she can change. Whilethe second and the third constraints are applied to prevent theattacks from appearing suspicious to the medical expert.
Minimize |V ar − V ar0|
Subject to
K ≤ k
N ≤ n
|S − S0|/S0 ≤ σ
where
(4)
• V ar is the variation after attack.• V ar0 is the variation before attack.• K is the percentage of pressure variation.• N is the number of sensors attacked.• S is the number of steps after attack.• S0 is the number of steps before attack.• n, k, and σ are constants.
2) Timing Synchronization Attack: In this type of attack,the attacker has the access to some sensors and causes delaybetween their pressure measurement and pressure reading.Therefore, some sensors would be postponed for some timeslots before they are read. For example, when the attackerdecides to postpone the pressure value of sensor 1 by three timeslots, then every time when the medical expert receives thepressure of sensor 1 in time slot T , it is actually the pressurevalue in time slot T−3. The following is the objective functionand the constrains.
Minimize |V ar − V ar0|
Subject to
T ≤ t
N ≤ n
|S − S0|/S0 ≤ σ
where
(5)
• V ar is the variation after attack.• V ar0 is the variation before attack.• T is the number of time slots to postpone.• N is the number of sensors attacked.• S is the number of steps after attack.• S0 is the number of steps before attack.• n, t, and σ are constants.
303303303303
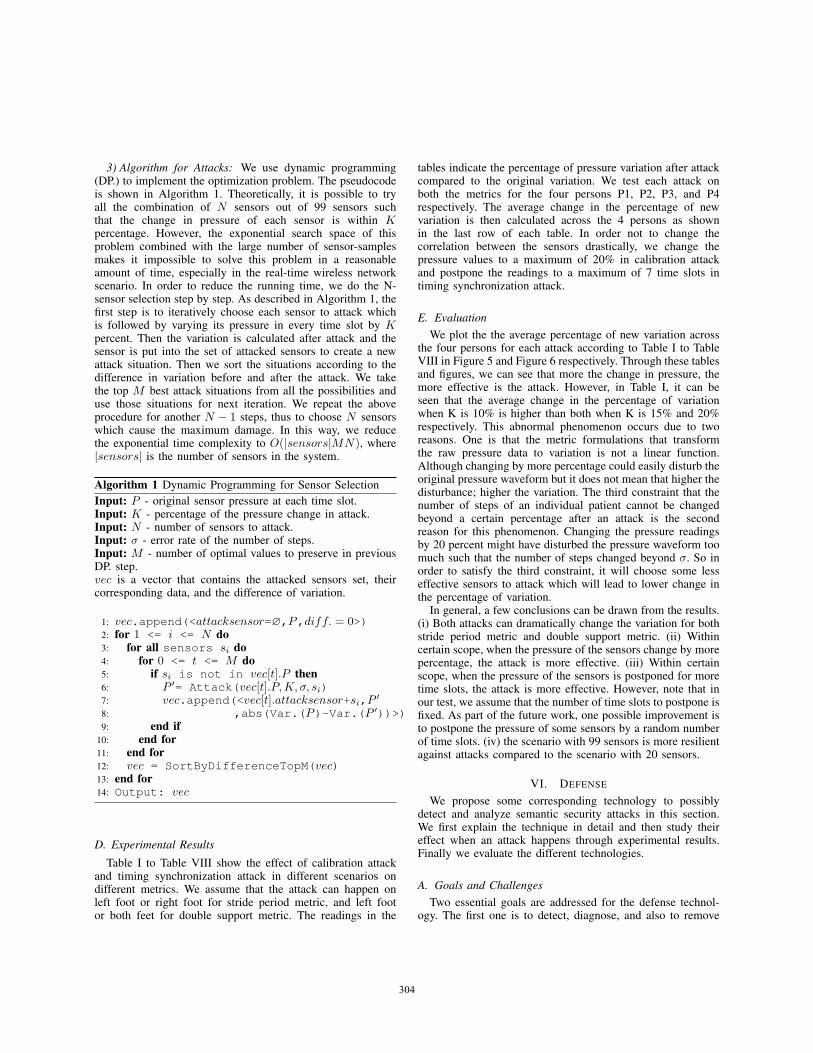
3) Algorithm for Attacks: We use dynamic programming(DP.) to implement the optimization problem. The pseudocodeis shown in Algorithm 1. Theoretically, it is possible to tryall the combination of N sensors out of 99 sensors suchthat the change in pressure of each sensor is within Kpercentage. However, the exponential search space of thisproblem combined with the large number of sensor-samplesmakes it impossible to solve this problem in a reasonableamount of time, especially in the real-time wireless networkscenario. In order to reduce the running time, we do the N-sensor selection step by step. As described in Algorithm 1, thefirst step is to iteratively choose each sensor to attack whichis followed by varying its pressure in every time slot by Kpercent. Then the variation is calculated after attack and thesensor is put into the set of attacked sensors to create a newattack situation. Then we sort the situations according to thedifference in variation before and after the attack. We takethe top M best attack situations from all the possibilities anduse those situations for next iteration. We repeat the aboveprocedure for another N − 1 steps, thus to choose N sensorswhich cause the maximum damage. In this way, we reducethe exponential time complexity to O(|sensors|MN), where|sensors| is the number of sensors in the system.
Algorithm 1 Dynamic Programming for Sensor Selection
Input: P - original sensor pressure at each time slot.Input: K - percentage of the pressure change in attack.Input: N - number of sensors to attack.Input: σ - error rate of the number of steps.Input: M - number of optimal values to preserve in previousDP. step.vec is a vector that contains the attacked sensors set, theircorresponding data, and the difference of variation.
1: vec.append(<attacksensor=∅,P,diff. = 0>)2: for 1 <= i <= N do3: for all sensors si do4: for 0 <= t <= M do5: if si is not in vec[t].P then6: P ′= Attack(vec[t].P,K, σ, si)7: vec.append(<vec[t].attacksensor+si,P
′
8: ,abs(Var.(P)-Var.(P ′))>)
9: end if10: end for11: end for12: vec = SortByDifferenceTopM(vec)13: end for14: Output: vec
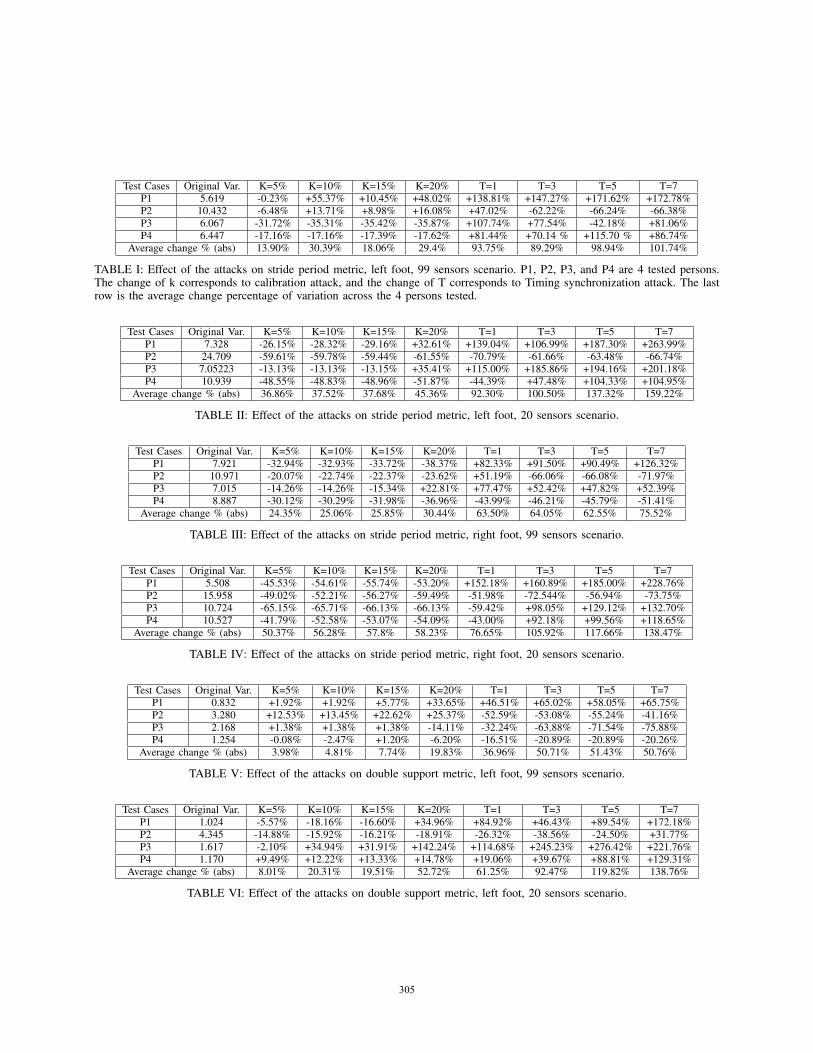
D. Experimental Results
Table I to Table VIII show the effect of calibration attackand timing synchronization attack in different scenarios ondifferent metrics. We assume that the attack can happen onleft foot or right foot for stride period metric, and left footor both feet for double support metric. The readings in the
tables indicate the percentage of pressure variation after attackcompared to the original variation. We test each attack onboth the metrics for the four persons P1, P2, P3, and P4respectively. The average change in the percentage of newvariation is then calculated across the 4 persons as shownin the last row of each table. In order not to change thecorrelation between the sensors drastically, we change thepressure values to a maximum of 20% in calibration attackand postpone the readings to a maximum of 7 time slots intiming synchronization attack.
E. Evaluation
We plot the the average percentage of new variation acrossthe four persons for each attack according to Table I to TableVIII in Figure 5 and Figure 6 respectively. Through these tablesand figures, we can see that more the change in pressure, themore effective is the attack. However, in Table I, it can beseen that the average change in the percentage of variationwhen K is 10% is higher than both when K is 15% and 20%respectively. This abnormal phenomenon occurs due to tworeasons. One is that the metric formulations that transformthe raw pressure data to variation is not a linear function.Although changing by more percentage could easily disturb theoriginal pressure waveform but it does not mean that higher thedisturbance; higher the variation. The third constraint that thenumber of steps of an individual patient cannot be changedbeyond a certain percentage after an attack is the secondreason for this phenomenon. Changing the pressure readingsby 20 percent might have disturbed the pressure waveform toomuch such that the number of steps changed beyond σ. So inorder to satisfy the third constraint, it will choose some lesseffective sensors to attack which will lead to lower change inthe percentage of variation.
In general, a few conclusions can be drawn from the results.(i) Both attacks can dramatically change the variation for bothstride period metric and double support metric. (ii) Withincertain scope, when the pressure of the sensors change by morepercentage, the attack is more effective. (iii) Within certainscope, when the pressure of the sensors is postponed for moretime slots, the attack is more effective. However, note that inour test, we assume that the number of time slots to postpone isfixed. As part of the future work, one possible improvement isto postpone the pressure of some sensors by a random numberof time slots. (iv) the scenario with 99 sensors is more resilientagainst attacks compared to the scenario with 20 sensors.
VI. DEFENSE
We propose some corresponding technology to possiblydetect and analyze semantic security attacks in this section.We first explain the technique in detail and then study theireffect when an attack happens through experimental results.Finally we evaluate the different technologies.
A. Goals and Challenges
Two essential goals are addressed for the defense technol-ogy. The first one is to detect, diagnose, and also to remove
304304304304
Test Cases Original Var. K=5% K=10% K=15% K=20% T=1 T=3 T=5 T=7
P1 5.619 -0.23% +55.37% +10.45% +48.02% +138.81% +147.27% +171.62% +172.78%
P2 10.432 -6.48% +13.71% +8.98% +16.08% +47.02% -62.22% -66.24% -66.38%
P3 6.067 -31.72% -35.31% -35.42% -35.87% +107.74% +77.54% -42.18% +81.06%
P4 6.447 -17.16% -17.16% -17.39% -17.62% +81.44% +70.14 % +115.70 % +86.74%
Average change % (abs) 13.90% 30.39% 18.06% 29.4% 93.75% 89.29% 98.94% 101.74%
TABLE I: Effect of the attacks on stride period metric, left foot, 99 sensors scenario. P1, P2, P3, and P4 are 4 tested persons.The change of k corresponds to calibration attack, and the change of T corresponds to Timing synchronization attack. The lastrow is the average change percentage of variation across the 4 persons tested.
Test Cases Original Var. K=5% K=10% K=15% K=20% T=1 T=3 T=5 T=7
P1 7.328 -26.15% -28.32% -29.16% +32.61% +139.04% +106.99% +187.30% +263.99%
P2 24.709 -59.61% -59.78% -59.44% -61.55% -70.79% -61.66% -63.48% -66.74%
P3 7.05223 -13.13% -13.13% -13.15% +35.41% +115.00% +185.86% +194.16% +201.18%
P4 10.939 -48.55% -48.83% -48.96% -51.87% -44.39% +47.48% +104.33% +104.95%
Average change % (abs) 36.86% 37.52% 37.68% 45.36% 92.30% 100.50% 137.32% 159.22%
TABLE II: Effect of the attacks on stride period metric, left foot, 20 sensors scenario.
Test Cases Original Var. K=5% K=10% K=15% K=20% T=1 T=3 T=5 T=7
P1 7.921 -32.94% -32.93% -33.72% -38.37% +82.33% +91.50% +90.49% +126.32%
P2 10.971 -20.07% -22.74% -22.37% -23.62% +51.19% -66.06% -66.08% -71.97%
P3 7.015 -14.26% -14.26% -15.34% +22.81% +77.47% +52.42% +47.82% +52.39%
P4 8.887 -30.12% -30.29% -31.98% -36.96% -43.99% -46.21% -45.79% -51.41%
Average change % (abs) 24.35% 25.06% 25.85% 30.44% 63.50% 64.05% 62.55% 75.52%
TABLE III: Effect of the attacks on stride period metric, right foot, 99 sensors scenario.
Test Cases Original Var. K=5% K=10% K=15% K=20% T=1 T=3 T=5 T=7
P1 5.508 -45.53% -54.61% -55.74% -53.20% +152.18% +160.89% +185.00% +228.76%
P2 15.958 -49.02% -52.21% -56.27% -59.49% -51.98% -72.544% -56.94% -73.75%
P3 10.724 -65.15% -65.71% -66.13% -66.13% -59.42% +98.05% +129.12% +132.70%
P4 10.527 -41.79% -52.58% -53.07% -54.09% -43.00% +92.18% +99.56% +118.65%
Average change % (abs) 50.37% 56.28% 57.8% 58.23% 76.65% 105.92% 117.66% 138.47%
TABLE IV: Effect of the attacks on stride period metric, right foot, 20 sensors scenario.
Test Cases Original Var. K=5% K=10% K=15% K=20% T=1 T=3 T=5 T=7
P1 0.832 +1.92% +1.92% +5.77% +33.65% +46.51% +65.02% +58.05% +65.75%
P2 3.280 +12.53% +13.45% +22.62% +25.37% -52.59% -53.08% -55.24% -41.16%
P3 2.168 +1.38% +1.38% +1.38% -14.11% -32.24% -63.88% -71.54% -75.88%
P4 1.254 -0.08% -2.47% +1.20% -6.20% -16.51% -20.89% -20.89% -20.26%
Average change % (abs) 3.98% 4.81% 7.74% 19.83% 36.96% 50.71% 51.43% 50.76%
TABLE V: Effect of the attacks on double support metric, left foot, 99 sensors scenario.
Test Cases Original Var. K=5% K=10% K=15% K=20% T=1 T=3 T=5 T=7
P1 1.024 -5.57% -18.16% -16.60% +34.96% +84.92% +46.43% +89.54% +172.18%
P2 4.345 -14.88% -15.92% -16.21% -18.91% -26.32% -38.56% -24.50% +31.77%
P3 1.617 -2.10% +34.94% +31.91% +142.24% +114.68% +245.23% +276.42% +221.76%
P4 1.170 +9.49% +12.22% +13.33% +14.78% +19.06% +39.67% +88.81% +129.31%
Average change % (abs) 8.01% 20.31% 19.51% 52.72% 61.25% 92.47% 119.82% 138.76%
TABLE VI: Effect of the attacks on double support metric, left foot, 20 sensors scenario.
305305305305

Test Cases Original Var. K=5% K=10% K=15% K=20% T=1 T=3 T=5 T=7
P1 0.832 +130.77% +130.77% +135.58% +140.38% +158.26% +170.93% +178.81% +232.01%
P2 3.280 +18.96% +28.54% +23.54% +34.09% +46.95% -81.52% -83.80% -86.59%
P3 2.168 +1.38% +7.15% +15.68% -27.81% -52.80% -81.62% -82.20% -80.90%
P4 1.254 -45.37% -45.37% -45.37% -50.00% -58.25% -61.05% -61.36% -61.05%
Average change % (abs) 49.12% 52.96% 55.04% 63.07% 79.07% 98.78% 101.54% 115.14%
TABLE VII: Effect of the attacks on double support metric, both feet, 99 sensors scenario.
Test Cases Original Var. K=5% K=10% K=15% K=20% T=1 T=3 T=5 T=7
P1 1.024 +123.44% +125.00% +125.78% +131.84% +134.29% +175.78% +229.56% +228.35%
P2 4.345 -42.28% -57.38% -58.92% -61.15% -76.40% -83.80% -82.08% -85.25%
P3 1.617 +46.07% +46.26% -75.26% +108.23% +148.56% +243.52% +315.97% +261.71%
P4 1.170 -44.62% -47.26% -48.63% -52.65% -62.71% -62.80% +110.78% +110.07%
Average change % (abs) 64.10% 68.98% 77.15% 88.47% 105.49% 141.48% 184.60% 171.35%
TABLE VIII: Effect of the attacks on double support metric, both feet, 20 sensors scenario.
5% 10% 15% 20%0
20%
40%
60%
80%
100%
120%
140%
160%
180%
200%
K
Ave
rag
e C
hang
e P
erc
en
tag
e
99 sensors
20 sensors
(a)
1 3 5 70
20%
40%
60%
80%
100%
120%
140%
160%
180%
200%
T
Avera
ge C
han
ge
Perc
en
tage
99 sensors
20 sensors
(b)
5% 10% 15% 20%0
20%
40%
60%
80%
100%
120%
140%
160%
180%
200%
K
Avera
ge C
han
ge
Perc
enta
ge
99 sensors
20 sensors
(c)
1 3 5 70
20%
40%
60%
80%
100%
120%
140%
160%
180%
200%
T
Avera
ge C
han
ge
Perc
en
tage
99 sensors
20 sensors
(d)
Fig. 5: Average change percentage in the following conditions. (a) Calibration attack on stride period metric, left foot. (b) Timingsynchronization attack on stride period metric, left foot. (c) Calibration attack on stride period metric, right foot. (d) Timingsynchronization attack on stride period metric, right foot.
5% 10% 15% 20%0
20%
40%
60%
80%
100%
120%
140%
160%
180%
200%
K
Avera
ge C
hang
e P
erc
en
tag
e
99 sensors
20 sensors
(a)
1 3 5 70
20%
40%
60%
80%
100%
120%
140%
160%
180%
200%
T
Avera
ge C
ha
ng
e P
erc
en
tag
e
99 sensors
20 sensors
(b)
5% 10% 15% 20%0
20%
40%
60%
80%
100%
120%
140%
160%
180%
200%
K
Avera
ge C
han
ge P
erc
en
tag
e
99 sensors
20 sensors
(c)
1 3 5 70
20%
40%
60%
80%
100%
120%
140%
160%
180%
200%
T
Avera
ge C
hang
e P
erc
en
tag
e
99 sensors
20 sensors
(d)
Fig. 6: Average change percentage in the following conditions. (a) Calibration attack on double support metric, left foot. (b)Timing synchronization attack on double support metric, left foot. (c) Calibration attack on double support metric, both feet. (d)Timing synchronization attack on double support metric, both feet.
306306306306

the impact of attacks as much as possible. The second oneis to design the defense to be low-cost, low-energy and real-time which is due to the unique properties of the wirelesssensor networks, especially for medical devices. Most wirelessmedical devices have high limitations regarding cost andenergy consumption.
The main challenge in defense technology is to find outwhether the data abnormality is because of an attack or dueto the sickness of the person. Suppose the medical expertsimply checks the pressure distribution of sensors at each timeslot. When an attack happens, it is possible that this pressuredistribution might be abnormal. However, if a person is sick,this particular distribution also has high likelihood to showsimilar abnormality. In this case, the data abnormality foundby the medical expert cannot be used to successfully detectand distinguish attacks. The above challenge is taken intoconsideration in our suggested defenses.
We propose two technologies for defense. The first technol-ogy targets at using several subgroups of the sensors to verifythe difference in variation. It is simple as the medical expertonly needs to repeat the calculation of variation on differentgroups of sensors. The second one is a new concept but it iseven more straightforward, the basic idea is to attack againon the received data to detect previous attacks, thus, only re-attacks are required. We explain their technical details in thefollowing section.
B. Defense Procedure
We demonstrate two types of defense and their modeling inthis part. We assume that the defense technology is appliedafter the attack, which means that the goal of defense is todetect the attack rather than preventing it.
1) Multi-group Verification: The basic idea of this defenseis to divide the original sensors into several subgroups. Weclaim that the variation calculated for each subgroup shouldbe close enough if the subgroups are properly divided. Sincethe sensors with numbers next to each other are usually presentnear each other as shown in Figure 1, the pressure values of thetwo neighboring sensors are highly correlated. Therefore, if thesensors are divided into two randomly selected groups, e.g.,odd group and even group according to their sensor number,the two groups should have similar waveforms, which will leadto similar variation. Note that in this defense, even though aperson is sick, because of the neighboring correlation, his/hervariation between odd/even group will be similar. However,when an attack happens, due to the fact that the effect of anattack can be very different in each individual subgroup, thevariation for each of them may vary a lot. In the followingexperiment, we divide the original sensors into odd and evengroups and then we compare α as defined below. If α becomesextraordinary large as compared to the α of history data orsome other threshold, the medical expert can conclude that thesensors were attacked. Algorithm 2 describes the multi-groupverification defense algorithm.
α =|V arodd − V areven|
min(V arodd, V areven)(6)
Algorithm 2 multi-group verification defense
Input: P - original sensor pressure at each time slot.
1: (Podd, Peven) = SplitOddEven(P)2: V arodd = Var.(Podd)
3: V areven = Var.(Peven)
4: α =|V arodd − V areven|
min(V arodd, V areven)5: if α>threshold then6: Attack Detected
7: else8: Attack Not Detected
9: end if
2) Repeated Attack based Defense: This defense targets atreversing the original attacks. When the attacker performseither attack as mentioned in section V, the change of variationcan be in two directions, either increasing or decreasing. Wesuppose that the variation of the data before attack is V ar0and the variation after attack is V ar1. Our proposed wayto defend is to perform the same attack again on the data,but for two times. For the first time, we perform the attackonly in the direction to increase V ar1 (the medical expertonly has the data after attack, which has the variation ofV ar1) and for the second time, we perform the attack onlyin the direction to decrease V ar1. So our intuition is that onlyone of the directions (because the 2 directions are opposite)will reverse V ar1 back to V ar0. However, it would be muchharder to change V ar1 in the opposite direction of V ar0 dueto the difficulty in changing the variation in one directioncontinuously. But for a piece of data that has not been attackedbefore, both directions can cause similar effects (the absolutevalue of the change) to the original variation. We further useβ defined below to compare the effect of performing attackin two opposite directions. If the data has not been attackedbefore, β will be approaching 1, otherwise it would be a largevalue. Therefore, the medical expert will be able to deducewhether the data has been attacked or not and also that inwhich direction the variation has been modified.
β =min(|V ardir1 − V ar1|, |V ardir2 − V ar1|)
max(|V ardir1 − V ar1|, |V ardir2 − V ar1|)(7)
C. Experimental Results
Table IX and Table X show the effect of multi-groupverification on calibration and timing synchronization attack.In each table, we consider 2 metric and 2 scenarios. We furtherassume that the attacks happen on left foot. The readings inthe tables indicate the value of α (defined in Eq. 6) before andafter the attack. Both tables show the average test results onP1, P2, P3, and P4 which are used to illustrate the averageperformance of the defense methodology. Similarly, Table XIand Table XII demonstrate the effect of repeated attack baseddefense and use value of β (defined in Eq. 7) to make thedecision.
307307307307

Test Situation Original α K=5% K=10% K=15% K=20%
Stride Period, left foot, 99 sensors 0.0589 0.2466 0.2568 0.2796 0.2901
Stride Period, left foot, 20 sensors 0.2032 0.3992 0.3653 0.4695 0.7624
Double Support, left foot, 99 sensors 0.2695 0.2707 0.2996 0.4194 0.3299
Double Support, left foot, 20 sensors 0.2971 0.2794 0.5888 0.4381 0.4572
TABLE IX: Multi-group verification to calibration attack, tested on P1, P2, P3, P4. The value in the table is the average α acrossthe 4 tested persons under different conditions.
Test Situation Original α T=1 T=3 T=5 T=7
Stride Period, left foot, 99 sensors 0.0589 0.2636 0.4487 0.3588 0.4526
Stride Period, left foot, 20 sensors 0.2032 0.5907 0.4134 0.5753 0.4764
Double Support, left foot, 99 sensors 0.2695 0.4340 0.3583 0.4621 0.6184
Double Support, left foot, 20 sensors 0.2971 0.5659 0.3331 0.6842 0.4351
TABLE X: Multi-group verification to timing synchronization attack.
Test Situation Original β K=5% K=10% K=15% K=20%
Stride Period, left foot, 99 sensors 2.21 21.87 37.78 20.78 29.91
Stride Period, left foot, 20 sensors 2.62 33.90 30.99 8.21 6.85
Double Support, left foot, 99 sensors 2.43 3.99 5.20 27.4 37.66
Double Support, left foot, 20 sensors 2.36 16.03 13.79 8.34 22.39
TABLE XI: Repeated attack based defense to calibration attack, tested on P1, P2, P3, P4. The value in the table is the averageβ across the 4 tested persons under different conditions.
Test Situation Original β T=1 T=3 T=5 T=7
Stride Period, left foot, 99 sensors 2.32 6.69 38.07 39.07 35.03
Stride Period, left foot, 20 sensors 3.28 23.12 13.45 15.29 4.47
Double Support, left foot, 99 sensors 2.50 5.52 7.16 21.62 13.65
Double Support, left foot, 20 sensors 6.77 6.46 10.42 6.35 17.98
TABLE XII: Repeated attack based defense to timing synchronization attack.
Algorithm 3 Repeated Attack based Defense
Input: P - original sensor pressure at each time slot.Input: K - percentage of the pressure change in attack.Input: N - number of sensors to attack.Input: σ - error rate of the number of steps.Input: M - number of optimal values to preserve in previousDP. step.AttackToIncrease() and AttackToDecrease() are the DP.algorithm in Algorithm 1.
1: V ar1 = Var.(P)2: V ardir1 = Var.(AttackToIncrease(P,K,N, σ,M))
3: V ardir2 = Var.(AttackToDecrease(P,K,N, σ,M))
4: β =min(|V ardir1− V ar1|, |V ardir2 − V ar1|)
max(|V ardir1 − V ar1|, |V ardir2 − V ar1|)5: if β>threshold then6: Attack Detected
7: else8: Attack Not Detected
9: end if
D. Evaluation
According to the Multi-group verification defense resultsin Table IX and Table X, although the original α variesfrom person to person, in most cases, it is relatively small.For both calibration and timing synchronization attack, theα value becomes extraordinarily large as compared to theoriginal α. Similarly, Repeated attack based defense results inTable XI and Table XII demonstrate that the β value increasessignificantly as compared to original β. However, in somecases the defenses are not fully dependable, as observed inTable XII with metric double support and 20 sensors scenario,when T = 5, the value of β drops from 6.77 to 6.35after timing synchronization attack which is adversary to thepurpose of the defense. Besides, there is no significant linearrelationship between α and different values of K or T , so asβ. This is due to the metric formulations that transform theraw pressure data to variation which is not a linear function.We cannot conclude that higher K or T will result in higherα and β.
For the practical application of these defenses, first we coulduse history data to get the original α and β. And then we canset a threshold for original α and β based on a particularindividual. Once the new α or β is higher than the threshold,the medical expert can conclude that the sensors are attacked.In our experiment, we set the α threshold as double of original
308308308308
Clibration Attack Timing Synchronization Attack0
10%
20%
30%
40%
50%
60%
70%
80%
90%
100%
Att
ack D
ete
ctio
n R
ate
multi−group verification defense
repeated attack based defense
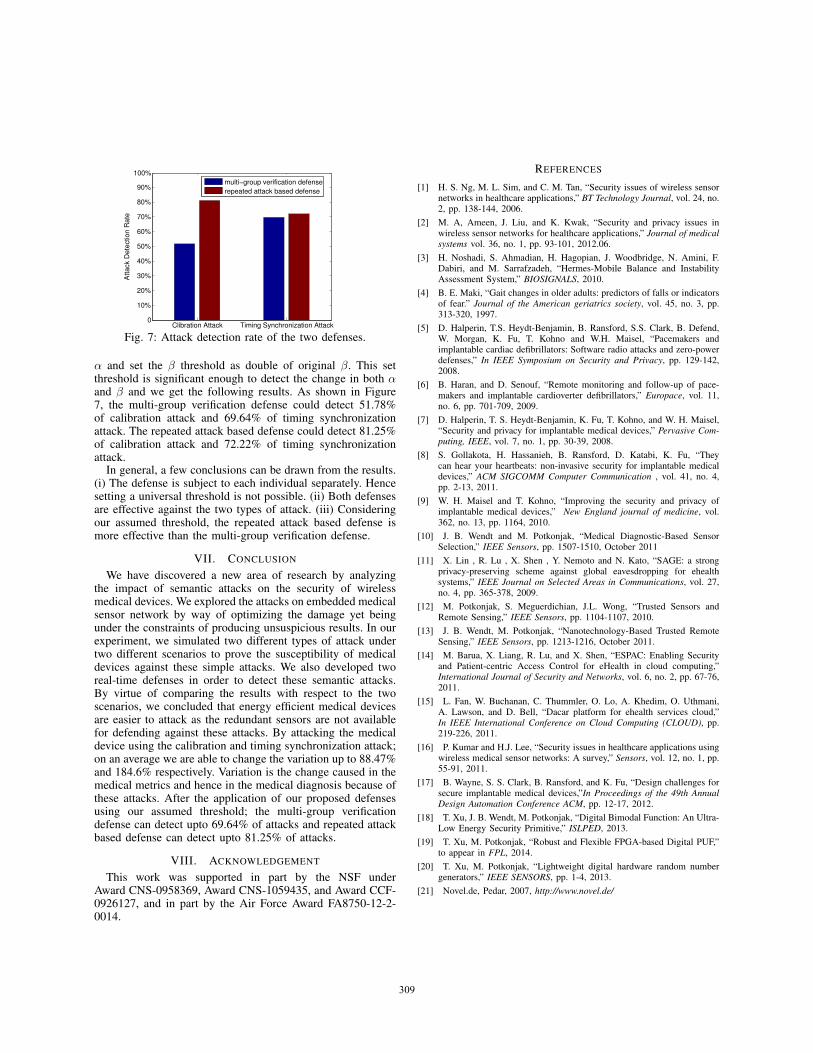
Fig. 7: Attack detection rate of the two defenses.
α and set the β threshold as double of original β. This setthreshold is significant enough to detect the change in both αand β and we get the following results. As shown in Figure7, the multi-group verification defense could detect 51.78%of calibration attack and 69.64% of timing synchronizationattack. The repeated attack based defense could detect 81.25%of calibration attack and 72.22% of timing synchronizationattack.
In general, a few conclusions can be drawn from the results.(i) The defense is subject to each individual separately. Hencesetting a universal threshold is not possible. (ii) Both defensesare effective against the two types of attack. (iii) Consideringour assumed threshold, the repeated attack based defense ismore effective than the multi-group verification defense.
VII. CONCLUSION
We have discovered a new area of research by analyzingthe impact of semantic attacks on the security of wirelessmedical devices. We explored the attacks on embedded medicalsensor network by way of optimizing the damage yet beingunder the constraints of producing unsuspicious results. In ourexperiment, we simulated two different types of attack undertwo different scenarios to prove the susceptibility of medicaldevices against these simple attacks. We also developed tworeal-time defenses in order to detect these semantic attacks.By virtue of comparing the results with respect to the twoscenarios, we concluded that energy efficient medical devicesare easier to attack as the redundant sensors are not availablefor defending against these attacks. By attacking the medicaldevice using the calibration and timing synchronization attack;on an average we are able to change the variation up to 88.47%and 184.6% respectively. Variation is the change caused in themedical metrics and hence in the medical diagnosis because ofthese attacks. After the application of our proposed defensesusing our assumed threshold; the multi-group verificationdefense can detect upto 69.64% of attacks and repeated attackbased defense can detect upto 81.25% of attacks.
VIII. ACKNOWLEDGEMENT
This work was supported in part by the NSF underAward CNS-0958369, Award CNS-1059435, and Award CCF-0926127, and in part by the Air Force Award FA8750-12-2-0014.
REFERENCES
[1] H. S. Ng, M. L. Sim, and C. M. Tan, “Security issues of wireless sensornetworks in healthcare applications,” BT Technology Journal, vol. 24, no.2, pp. 138-144, 2006.
[2] M. A, Ameen, J. Liu, and K. Kwak, “Security and privacy issues inwireless sensor networks for healthcare applications,” Journal of medical
systems vol. 36, no. 1, pp. 93-101, 2012.06.
[3] H. Noshadi, S. Ahmadian, H. Hagopian, J. Woodbridge, N. Amini, F.Dabiri, and M. Sarrafzadeh, “Hermes-Mobile Balance and InstabilityAssessment System,” BIOSIGNALS, 2010.
[4] B. E. Maki, “Gait changes in older adults: predictors of falls or indicatorsof fear.” Journal of the American geriatrics society, vol. 45, no. 3, pp.313-320, 1997.
[5] D. Halperin, T.S. Heydt-Benjamin, B. Ransford, S.S. Clark, B. Defend,W. Morgan, K. Fu, T. Kohno and W.H. Maisel, “Pacemakers andimplantable cardiac defibrillators: Software radio attacks and zero-powerdefenses,” In IEEE Symposium on Security and Privacy, pp. 129-142,2008.
[6] B. Haran, and D. Senouf, “Remote monitoring and follow-up of pace-makers and implantable cardioverter defibrillators,” Europace, vol. 11,no. 6, pp. 701-709, 2009.
[7] D. Halperin, T. S. Heydt-Benjamin, K. Fu, T. Kohno, and W. H. Maisel,“Security and privacy for implantable medical devices,” Pervasive Com-
puting, IEEE, vol. 7, no. 1, pp. 30-39, 2008.
[8] S. Gollakota, H. Hassanieh, B. Ransford, D. Katabi, K. Fu, “Theycan hear your heartbeats: non-invasive security for implantable medicaldevices,” ACM SIGCOMM Computer Communication , vol. 41, no. 4,pp. 2-13, 2011.
[9] W. H. Maisel and T. Kohno, “Improving the security and privacy ofimplantable medical devices,” New England journal of medicine, vol.362, no. 13, pp. 1164, 2010.
[10] J. B. Wendt and M. Potkonjak, “Medical Diagnostic-Based SensorSelection,” IEEE Sensors, pp. 1507-1510, October 2011
[11] X. Lin , R. Lu , X. Shen , Y. Nemoto and N. Kato, “SAGE: a strongprivacy-preserving scheme against global eavesdropping for ehealthsystems,” IEEE Journal on Selected Areas in Communications, vol. 27,no. 4, pp. 365-378, 2009.
[12] M. Potkonjak, S. Meguerdichian, J.L. Wong, “Trusted Sensors andRemote Sensing,” IEEE Sensors, pp. 1104-1107, 2010.
[13] J. B. Wendt, M. Potkonjak, “Nanotechnology-Based Trusted RemoteSensing,” IEEE Sensors, pp. 1213-1216, October 2011.
[14] M. Barua, X. Liang, R. Lu, and X. Shen, “ESPAC: Enabling Securityand Patient-centric Access Control for eHealth in cloud computing,”International Journal of Security and Networks, vol. 6, no. 2, pp. 67-76,2011.
[15] L. Fan, W. Buchanan, C. Thummler, O. Lo, A. Khedim, O. Uthmani,A. Lawson, and D. Bell, “Dacar platform for ehealth services cloud,”In IEEE International Conference on Cloud Computing (CLOUD), pp.219-226, 2011.
[16] P. Kumar and H.J. Lee, “Security issues in healthcare applications usingwireless medical sensor networks: A survey,” Sensors, vol. 12, no. 1, pp.55-91, 2011.
[17] B. Wayne, S. S. Clark, B. Ransford, and K. Fu, “Design challenges forsecure implantable medical devices,”In Proceedings of the 49th Annual
Design Automation Conference ACM, pp. 12-17, 2012.
[18] T. Xu, J. B. Wendt, M. Potkonjak, “Digital Bimodal Function: An Ultra-Low Energy Security Primitive,” ISLPED, 2013.
[19] T. Xu, M. Potkonjak, “Robust and Flexible FPGA-based Digital PUF,”to appear in FPL, 2014.
[20] T. Xu, M. Potkonjak, “Lightweight digital hardware random numbergenerators,” IEEE SENSORS, pp. 1-4, 2013.
[21] Novel.de, Pedar, 2007, http://www.novel.de/
309309309309