Embed Size (px)
Citation preview

SECURITY CLASSIFICATION OF "'IS PAGE
REPORT .OCUMEN. AD-A262 189la. REPORT SECURITY CLASSIICATION 'lb, I 11 imN11tii
UnclassifiedIa. SECURITY CLASSIFICATION AUTHORITY 3 D
2b. DECLASS1FICATION iDOWNGRADING SCHEDULE Un I imi tea
4. PERFORMING ORGANIZATION REPORT NUMBER(S) S. MONITORING ORGANIZATION REPOR. NUMBER(S)
O f f i c o f N ava l R e e r ck
6a. NAME OF PERFORMING ORGANIZATION 6b. OFFICE SYMBOL 7a. NAME OF MONITORING ORGANIZATION
Univ. of Nebraska-Lincoln Office of Naval Research 4, :,'
6C. ADDRESS (Cty, State, and ZIP Code) 7b. ADDRESS (City, State, and ZIP Code)
632 Hamilton Hall Chemistry Division, Code 111 3P0University of Nebraska 800 N. Quincy StreetSLincoln NE 68588-0304 Arlington, VA 22217-5000
Ba. NAME OF FUNDING/SPONSORING 8b, OFFICE SYMBOL 9. PROCUREMENT INSTRUMENT IDENTIFICATION NUMBERORGANIZATION (if applicable)
Office of Naval Research I..8c. ADDRESS (City, State, and ZIP Code) 10. SOURCE OF FUNDING NUMBERS
800 N. Quincy Street PROGRAM PROJECT TASK WORK UNIT
Arlington, VA 22217-5000 ELEMENT NO. NO. NO..- ACCESSION NO.
11. TITLE (Include Security Classification)Polar Order and Relaxation of Second Order Nonlinear Optical
Susceptibility in an Electric Field Polarized Amorphous Polymer
12. PERSONAL AUTHOR(S) C. H. Wang, S. H. Gu and H. W. Guan
13a. TYPE OF REPORT lim. TIE COVERED TO 14. DATE OF REPORT ('Year, MonhDa)j. PAGE COUNTT c nicl R Mn TO i l nni| •..
16. SUPPLEMENTARY NOTATION
Journal of Chemical Physics
17. COSATI CODES 18. SUBJECT TERMS (Continue on reverse if necessary and identify by block number)
FIELD GROUP SUB-GROUP
19. ABSTRACT (Continue on reverse if necessaty and identify by block number)
The dependence of the second harmonic generation (SHG) signal of an amorphous polymer system
containing nonlinear optical (NLO) chromophores on the polarizing electric field is investigated. It is
shown that under a weak poling field condition, the SHG intensity is proportional to Ep2, provided that
the polarizing electric field E is greater than a threshold field, ES. Above E., the macroscopic polar
orientational order is establisl'ed. The lengthening of the relaxation time for polar orientational order
with increasing E. is also observed. Theoretical analysis shows that the relaxation time is proportional
to the polar order-initially induced by the polarizing field. Experiments have becn carried out to confirm
the theoretical prediction.
93-0548620. DISTRIUTI)ONIAVAILABILITY OF ABSTRACT 21. ABSTRACT SECURIT
UUNCLASSIFIEDIUNLIMITED 0 SAME AS RPT. 0QDTIC USERS Unclassified22a. NAME OF RESPONSIBLE INDIVIDUAL J22b. TELEPHONE (Include Area Code) i22C OFFICE SYMBOL
fIr- JQanne Millikan J(202) 696-4409 .. .DO FORM 1473,84 MAR 83 APR edition may be used until exhausted. SECURITY CLASSIFICATION OF THIS PAGE
All other editions are obsolete.

Polar Order and Relaxation
of Second Order Nonlinear Optical Susceptibility
in an Electric Field Polarized Amorphous Polymer
C. H. Wang, S. H. Gu and H. W. Guan
A •cesion'"For"
Department of Chemistry DTIC TAB
Unannounced LI
University of Nebraska Justification .............................
Lincoln, NE 68588-0304 BY ......... ......................Distribution I
Availability Cod~es
Avail---~ I dor-Dist Special
VrTC QtATY I]

Abstract
The dependence of the second harmonic generation (SHG) signal of an amorphous
polymer system containing nonlinear optical (NLO) chromophores on the polarizing electric
field is investigated. It is shown that under a weak poling field condition, the SIIG intensity
is proportional to EP2, provided that the polarizing electric field E is greater than a
threshold field, E.. Above E., the macroscopic polar orientational order is established. The
lengthening of the relaxation time for polar orientational order with increasing EP is also
observed. Theoretical analysis shows that the relaxation time is proportional to the polar
order initially induced by the polarizing field. Experiments have been carried out to confirm
the theoretical prediction.
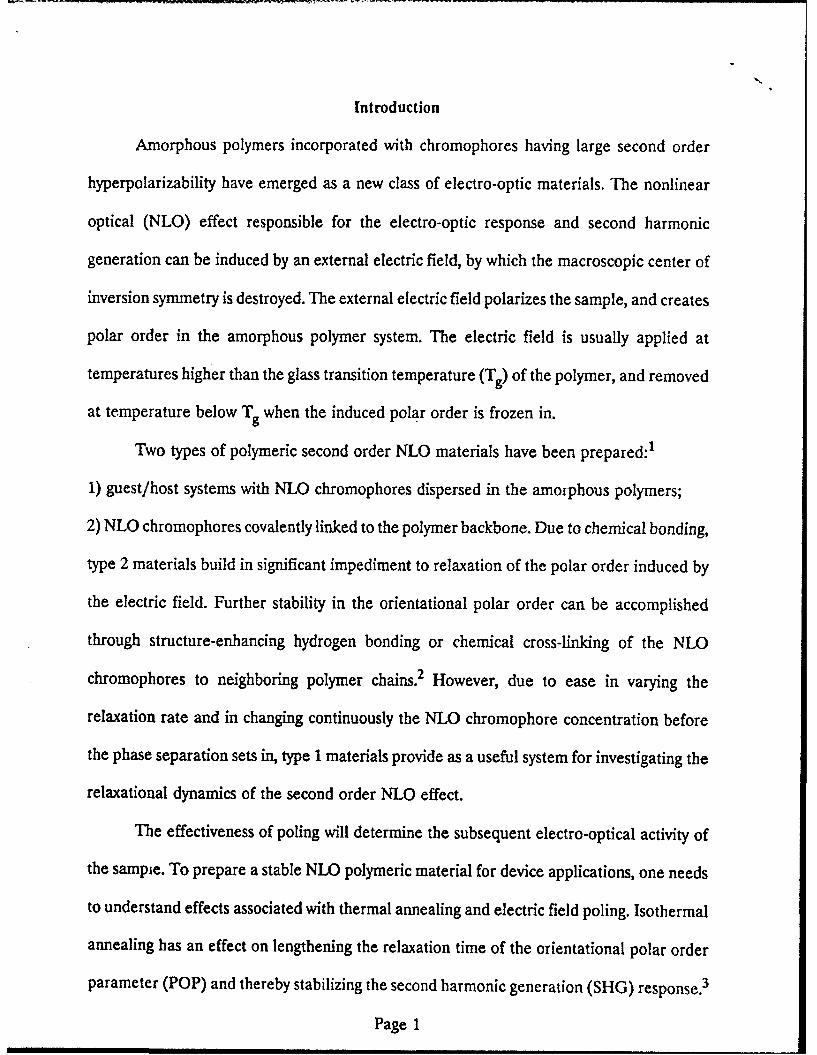
Introduction
Amorphous polymers incorporated with chromophores having large second order
hyperpolarizability have emerged as a new class of electro-optic materials. The nonlinear
optical (NLO) effect responsible for the electro-optic response and second harmonic
generation can be induced by an external electric field, by which the macroscopic center of
inversion symmetry is destroyed. The external electric field polarizes the sample, and creates
polar order in the amorphous polymer system. The electric field is usually applied at
temperatures higher than the glass transition temperature (Tg) of the polymer, and removed
at temperature below Tg when the induced polar order is frozen in.
Two types of polymeric second order NLO materials have been prepared: 1
1) guest/host systems with NLO chromophores dispersed in the amorphous polymers;
2) NLO chromophores covalently linked to the polymer backbone. Due to chemical bonding,
type 2 materials build in significant impediment to relaxation of the polar order induced by
the electric field. Further stability in the orientational polar order can be accomplished
through structure-enhancing hydrogen bonding or chemical cross-linking of the NLO
chromophores to neighboring polymer chains.2 However, due to ease in varying the
relaxation rate and in changing continuously the NLO chromophore concentration before
the phase separation sets in, type 1 materials provide as a useful system for investigating the
relaxational dynamics of the second order NLO effect.
The effectiveness of poling will determine the subsequent electro-optical activity of
the sampte. To prepare a stable NLO polymeric material for device applications, one needs
to understand effects associated with thermal annealing and electric field poling. Isothermal
annealing has an effect on lengthening the relaxation time of the orientational polar order
parameter (POP) and thereby stabilizing the second harmonic generation (SHG) response.3
Page 1

The lengthening of the relaxation time is due to densification of the material below the glass
transition temperature, in connection with physical ageing of !he amorphous polymer in the
nonequilibrium state. We are concerned in this paper with the effect of electric field poling.
We have investigated the electric field dependence of the orientational relaxation time of
the NLO chromophores under an isothermal condition. In addition, the SHG intensity is
also measured as a function of the strength of the poling electric field. We show that both
the intensity and the relaxation time increases with increasing the poling field strength. The
increase in the relaxation time with increasing the poling field strength clearly indicates that
the decay of the SHG response is closely associated with the induced orientational polar
order, thereby suggesting that the decay of the second order NLO response can be impeded
by poling the amorphous NLO polymer with a high electric field strength. We have provided
a theoretical analysis to substantiate the electric field dependence effect.
Experimental
Appropriate amounts of NLO chromophores NAS (4-amino-4-nitro-trans stilbene)
and PMMA (polymethylmethacrylate) were dissolved in chloroform to form solutions with
different NAS concentrations. After filtering each solution to remove undissolved
particulates, polymer films were prepared by spin coating the solution on ITO (indium tin
oxide) coated soda lime glass slides. The glass slides containing polymer films were first
placed in a vacuum oven at 50"C for over 24 hours, and then baked for another 24 hrs. at
higher temperature (slightly above Tg) to remove the solvent used in spin-coating. The
concentration of the NAS chromophore was monitored by UV-visible absorption
spectroscopy and appeared to suffer little decrease by the soft and hard baking processes.
Two identical glass slides coated with NLO polymer films were then placed in the vacuum
Page 2

oven at 120TC to fuse in a sandwich configuration for future contact electrode poling.
The second harmonic generation SHG intensity was measured by using a setup
similar to that reported previously.4 It consisted of a Nd:YAG laser (Spectra Physics GCR-
11, X = 1.06 Aim, Q-switched at 10 Hz) used as an excitation source. The polymer
film/electrode assembly was placed on a goniometer stage located inside a temperature
controlled oven. The film temperature was accurate to ± 0.2OC, controlled by a temperature
controller. The incidence angle of the fundamental beam at 1.06 yrm was 600; the
transmitted SHG signal at 532 nm was selected by a monochromator and detected by a
photomultiplier, followed by a preamplifier and averaged by a boxcar integrator.
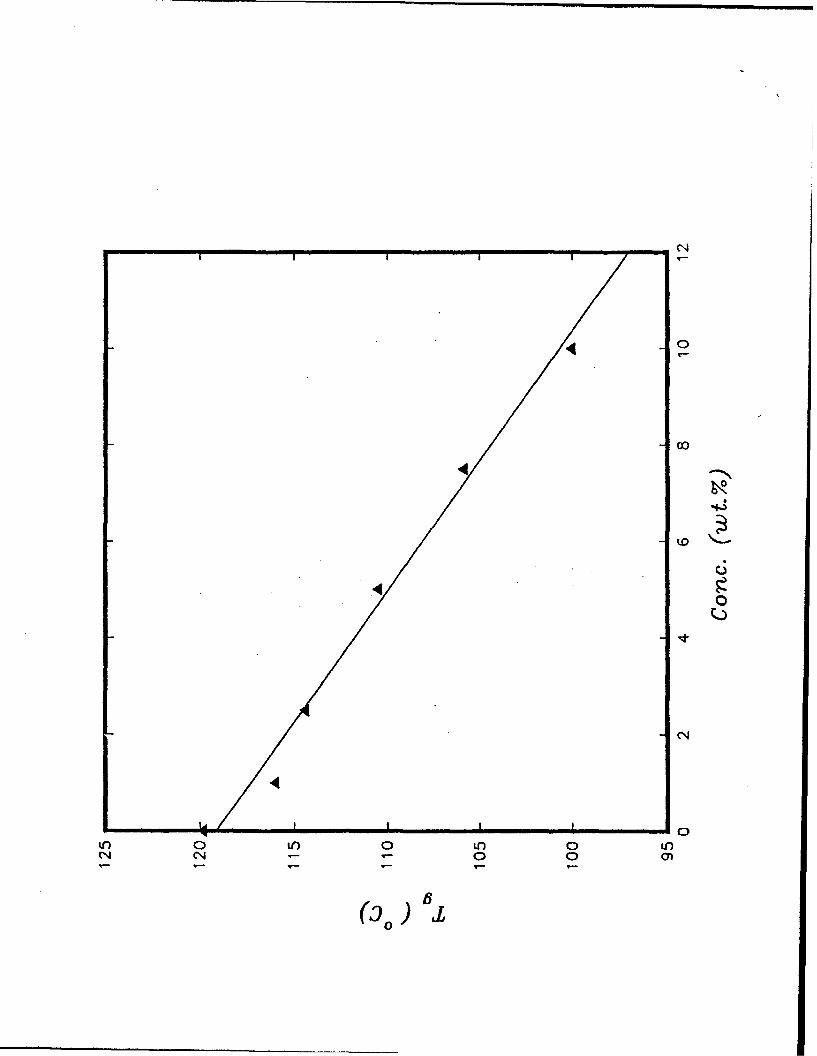
The glass transition temperatures (Tg) of the NAS/PMMA samples were determined
by using a DSC (Perkin Elmers, Delta series). Shown in Fig. 1 is the variation of Tg with
the NAS concentration. Over the 0-10 wt % concentration, the glass transition temperature
appears to decrease linearly with increasing NAS concentration. The refractive index and
thickness of the polymer film were measured by using a prism coupler (Metricon). The
prism coupler was operated in accordance with the optical waveguide principle where the
polymer film serves as the propagation layer in the slab waveguide configuration.
Results and Discussion
1. SHG Intensity and Poling Field Strength
The SHG signal of the NLO film under the isothermal condition was measured as
a function of the strength of the electric field employed to polarize (or pole) the sample.
Shown in Fig. 2 is the plot of the amplitude of the SHG signal for the 5 wt% NAS in
PMMA sample at 1 10*C as a function of the square of the poling field strength (Ep2). One
notes that there appears a threshold voltage of about 0.9x10⁶ V/cm, below which the signal
Page 3
only increases slightly with increasing poling field strength. Above this voltage, the SHG
signal increases more rapidly and it clearly increases linearly with E 2
The existence of the threshold poling field (Es) has not heretofore noticed, and it
indicates that the poling process proceeds in two separate stages. The poling field which
provides surface charges first aligns the molecules adjacent to the electrodes, and the field
from the aligned dipoles and additional surface charges further orient the remaining NLO
chromophores. Because of thermal motion, the alignment takes place in competition with
the intermolecular potentials that act among the NLO dipoles and between the dipoles with
the polymer host. It appears that below E., the poling field provides only enough surface
charges to align the molecules near the surface and very little macroscopic order is induced,
hence giving rise to a small SHG intensity. Above E,, the surface charges provided by the
poling voltage as well as the oriented dipoles combine to overcome the orientation-
randomizing molecular motion and induce macroscopic nonlinear polarization for SHG.
The SHG intensity is proportional to the square of the second order macroscopic
susceptibility Xijk(2) (-2w; w, c).1 Here w is the frequency of the fundamental laser beam (the
frequency of the YAG laser oscillating at 1.06 Am in the present case). Two elements of X(2)
are involved in the electric field poled amorphous NLO polymer. They are XZZZ(2) and
Xz=(2), where z refers to the direction of the poling electric field, i.e. the direction
perpendicular to the polymer film surface on the ITO substrate; the x direction is on the
surface of the film. By using different polarizations of the exciting laser beam the values of
Xzzz(2) and XzxX(2) can be determined.4
These XM elements are related to the orientational polar order parameters 133 and
L31 by5
Xzzz(2) -X33(2) = p F L(1)
Page 4
and
XZ~XX(2) = X31(2) = p F L31 (2)
where p is the number density of NLO chromophores; F is equal to A f.2 f2.. Here f. and
f2. are local field factors at frequency c and 2w, respectively. In the Lorentz model, the
local field factors are given by fv = (nv 2 + 2)/3, where nv is the refractive index at
frequency v. 0 is the dominant component of the molecular second order hyperpolarizability
tensor. In writing Eqs (1) and (2), one neglects the contribution from other minor
components of the hyperpolarizability tensor.
The pertinent orientational polar order parameters (POP) 1_3 and L31 are given by5
L33 (t) = <cos 3O1 (t)W>E 1 {3 <p1 (cos8l(t)) > E + 2 <P 3(cos0 1(t)) > El (3)
31 (t) = (<cos0 1 (t)>E- <cos30(t)>E)/2 =
I { <P 1 (cosO1(t))>EE <P 3(cos01(t))>E} (4)5
where 01 refers to the polar angle of the principal axis of representative NLO chromophore
1 with respect to the external poling field. Here Pl(cos 01) and P3(cos81) are the Legendre
polymonial of order I and 3, respectively. The time dependence in L33 and .-31 is caused
by molecular reorientation which leads to relaxation of POP. The angular brackets with a
subscript E indicated that the ensemble average is taken on the system in the presenc of
the poling field E.
As an approximation, POP parameters L.33 and .31 are often described in terms of
Page 5

Langevin functions of order 3 and 1.6 Such a simplistic description is only valid at very low
NLO chromophore concentration when the intermolecular interaction between dipoles can
be neglected. In reality these are complex functions of the external poling field and the
anisotropic (angular dependent) intermolecular interaction potential. 5 The dynamics of
molecular motion renders the time dependence of order parameters and gives rise to the
relaxation of 1-33 and L15. However, as shown in ref. 5, under a weak poling field condition,
<P 3(cos0 1)> is not excited. In the next section, we show by linear response theory that the
time dependence of POP in the weak poling field condition is given by
L31(t) = L33(t)/3 = a [<cos01(t) cos0 1 > + (N-i) <cos0 1(t) cos0 2>1 (5)5
where a = fo pE /kT is the poling constant. fo is the Onsager local field factor associated
with the poling field, and A is the ground state dipole moment of the chromophore. 01 and
02 correspond to polar angles for representative molecules 1 and 2, respectively. N is the
total of number of NLO chromophores which have been polarized by the external field. The
angular brackets without the subscript E in Eq. (5) correspond to an average over an
equilibrium distribution function in the absence of the poling field.
For t = 0, Equation (5) reduces to the initially induced orientational order
parameter, given by
L31(0) = 133(0)/3 = A [ <cos 2O1 > + (N-i) <cos01 cos0 2> ]
5
_ a K (6)
Equation (6) was obtained in ref. 5 by using the method of equilibrium statistical mechanics.
Page 6

Here gK is the Kirkwood g-factor given by
(N-1)<cosO Icos 02>gK = 1+ co 2 >=1+p0Gt, (7)<COSý01>
where GA is the cluster integral defined previously.
As one sees in Eq. (6), the weak poling field condition the POP is proportional to
the poling constant a, which is proportional to Ep; one thus expects that the SHG intensity
is proportional to EP2, provided that the poling field is larger than the threshold field E.,
as shown in Fig. 2.
By increasing the temperature, we have found that the SHG intensity first decreases
in accordance with the 1/T dependence in the poling constant a. However, as shown in Fig.
3, by keeping the same poling voltage, we have found that as time progresses, the lost SHG
intensity recovers and maintains at the same level as before the temperature change. One
notes that as the sample (5 wt% NAS) is heated gradually from 100 to 160 0C (about 500C
above Tg), SHG intensity remains nearly constant, in contrast to the expected intensity
decrease as the temperature increases. This intensity/temperature behavior differs from the
result of Mortazavi et al,7 who have reported a strong temperature dependence in the main
chain polymer. The present result can be understood as due to electrodes attraction
associated with the increase of the effective poling field strength. As the temperature
increases above T , the compliance of the polymer increases and the more compliant
polymer facilitates the electrodes separation to decrease. The decrease in the electrodes
separation increases the effective poling field strength which probably compensates the
(1/T)2 temperature dependence factor provided that a sufficient amount of time is allowed
Page 7

for the polymer compliance to change.
2. Relaxation of Polar Order Parameter
Shown in Fig. 4A is the decay curve of the SHG intensity for the 5 wt% sample at
100°C after the poling field (= 217 V/iAm) is removed. One notes the initial rapid intensity
decrease at short times, followed by a gradual decay at subsequent times in the SHG time
dependence curve. The nature of the initial rapid intensity decrease is not clearly
understood, despite the fact that it has been attributed to the third order nonlinear optical
effect8 and to the relaxation of the oriented chromophores in the liquid-like region for the
polarized sample below Tg.9 We have recently carried out detailed experiments, and have
found that the portion of the rapid SHG intensity decrease can be made to diminish if the
field higher than E, is employed to pole the sample above Tg for a sufficiently long time.
In Fig. 4B, we show the decay curve for the sample poled at 121TC using the same poling
voltage for more than 24 hr.; one notes that there is only a negligible initial drop in the
SHG intensity in this case. The result of the comprehensive study of the poling dynamics will
be published elsewhere. 10
The entire SHG relaxation curve, including the initial intensity drop, can be fit to a
KWW (Kahrausch-Williams-Watts) function: Ae('(t/O)O, where to is the characteristic
relaxation time, and p is the parameter signifying the distribution of relaxation times. By
fitting to one KWW function, one obtains the stretch exponential parameter p about the
order of 0.3, which is consistent with the previous result.1" However, recent work has shown
that the decay of the second order nonlinear susceptibility is better fit to a bi-exponential
form.12'13 Using the birexponential fit, we write the SHG intensity relaxation curve as:
ISHG(t) (Ae`/T1 + Bet/c2)2 (8)
where A and B are constants associated with the amplitudes of the initial and the second
Page 8

long decay, respectively. As mentioned above, if a sufficiently high voltage is used to pole
the sample above Tg for a long time, the amplitude of the initial decay becomes rather
small. As a result, the long decay associated with the reorientation of the chromophores
dipoles is found to be described by a single exponential given by
ISHG(t) - B2 exp (-2t/r 2) (9)
The continuous curves shown in Fig. (4A) and (4B) are the single exponential fit to
the experimental data. The fit to Fig. (4A) is carried out by removing the portion
corresponding to the initial rapid intensity decrease. One notes that by excluding the initial
intensity decrease, the single exponential function gives a good fit to the experimental data.
The decay of the SHG intensity corresponds to the relaxation of the polar order of
the NLO chromophore dipoles. The relaxation of the orientational order parameter can in
general be expressed in terms of time correlation functions, but to our knowledge, this
connection has not yet been shown. We now use linear response theory to relate the
relaxation of the order parameter associated with the decay of the SHG signal to the
specific time correlation functions.
To apply linear response theory, we consider a collection of electric dipoles of NLO
chromophoresk k -, --. , N, each of these interacts with the external poling field Ep(t)
and also with the others. The poling field depends on time as it is switched off after the
sample is polarized and the relaxation effect is to be probed. The Hamiltonian describing
the interaction of the dipoles with the poling field is given by
HIxt(t) = L- j " E(t) =-•Ep(t) I cos61 (10)
where 0. is the polar angle of dipole j with respect to the poling field Ep. 4 is the amplitude
Page 9
of the electric dipole of the NLO chromophore. In addition to the external Hamiltonian, the
material system is described by a Hamiltonian H0 before the poling field is applied.
Following a series of standard steps needed in linear response theory, 14 we find that
<cos 0 1(t)>E = f On(t,t.) E,(t')dt' (11)
where the response function ,(t,t') is given by (in terms of classical mechanics)
,n(t,t,) -IL E <cosno 1(t) Cos 0a (t')> (12)kT j
In accordance with Eqs. (3) and (4), we need ,3 (t,t') in order to calculate L33(t); to
calculate L3 1(t) we need ,3(t,t') and (,l(t,t'). To derive Eqs. (11) and (12), we have
assumed that initially the system has no polar order. Polar order is induced after the
external electric field is turned on. However, as previously shown, under the weak poling
field conditions only the <Pl(cosO)> type of polar order is excited. The excitation of the
< P3(cosO > order requires a high poling field and cannot be calculated with linear response
theory. We shall in another publication consider the high field case and consider here only
the low poling field condition.
We now substitate Eq. (12) into Eq. (11) (with n = 1) and carry out the integration
by part to reduce Eq. (11) to
Page 10
<cO-(t)>E = <cosO(t) cosOj(t)> Ep(t)kT j-1
N. E f. <cos01(t) cos0i(t-)> tp(t')dt" (13)
where the dot above Ep(t') designates taking the derivative with respect to t'.
We next consider the situation that after the NLO polymer material is poled for a
sufficiently long time, the dipolar order has reached a steady state. At t = 0, we turn off the
poling field and begin to investigate the relaxation behavior of the established polar
orientational order. The investigation is proceeded by observing the decay of the SHG signal
at t > 0. Namely, we set
EP(t) = E 0(t) (14)
where 0(t) equals 1 for t<0, and equals 0 for t> 0. From Eq. (12), we obtain
4 E(t) =-EpS(t) (15)
where S(t) is the Dirac delta function. Substituting Eqs. (14) and (15) into Eq. (13), we
obtain for t > 0
<cos01(t)>E = N <cos01(t) cos ol(0)>
a [<cos0 1(t) cos0l> + (N-i) <cosB1 (t) cos 02>] (16)
where the angular brackets without the subscript E indicate that the ensemble average is
taken without the poling field. The first term on the right hand side of Eq. (13) is absent
for t>0 as the poling field is removed at t=0. In Eq. (16), we have succeeded in relating the
decay of the polar order parameter to time correlation functions. One notes in Eq. (16)
there are two types of time correlation functions, one corresponding to the self time
Page 11

correlation and the other pair time correlation. In the previous work, only the analysis of
the self time correlation function is considered.1 5 We emphasize in this paper the
importance of the pair correlation contribution to the decay of the SHG intensity. Without
the pair correlation term, it would be impossible to understand the concentration
dependence16 and the present poling field dependence of the relaxation time.
3. Effect of Pair Correlation
In Eq. (16), we have established that the time dependence of the order parameter
<cosO1(t)>E is related to the correlation functions <cosO1(t) cos0 1> and
<cos01(t) cos02>. To show the importance of pair correlation contribution, we consider a
model with two interacting dipoles immersed in the environment of the amorphous polymer
above its glass transition temperature.
The dipoles are initially oriented by the poling field. After the poling field is
removed, the dipoles undergo reorientational motion to randomize the orientational order
established by the poling field. The reorientational dynamics of the dipoles can be described
by the generalized Langevin equation. 17
If we denote the state of dipoles by the dynamic variables Q1 and Q2, then the
kinetic equation for the vector variable
- Q:) (17)
is given by the generalized Langevin equation17 (in the Markov approximation)
where the relaxation matrix is given by
Page 12

A(t) = r "A(t) +F(t) (18)
11 IQ1 ; <Qj Q2) )q(19)
Here are the Onsager kinetic coefficients associated with the random force F(t). Since
the two dipoles are assumed to be chemically equivalent, we set K11 = K22 = d, and K12
= K21 = h. Here d is associated with the decay rate of uncorrelated single dipole, and h
represents dynamic correlation of the two dipoles. In addition, Q1 and Q2 are proportional
to cos0 1 and cos9 2, respectively, we set < IQ112 > =< IQ2 12 > =a and
<QlQ2*> = <Q2Q,*> =,6. Here P represents the static pair correlation between the two
dipoles. Using Eq. (6), we can write for the case of two dipoles the initial orientational
order parameter .,31 before turning off the poling field is
+ = + 131(0) =a [<CoS20 1> + <COSe 1COSe 2>] (20)
Equation (20) will be used as the initial condition for the kinetic equation given by
Eq. (18). Thus, in order to show that Eq. (18) can be used to describe the decay of the polar
orientational order parameter after the poling field is turned off, we need to make
connectiun of Eq. (18) to Eq. (16).
We take the time derivative on both sides of Eq. (16) and obtain after associating
Qi with cosf, (i = and 2):
Page 13

a <cosOl(t)>E = a (<cosOl(t) cosO1 > + <cosOl(t) cosO2>&t 2&d
+ <cos0 2(t) cos0 1 > + <cos0 2(t) cos0 2 >]
I a I [<Q 1(t) Q1> + <Q 1(t) Q2> + <Q 2(t) Q1> + <Q2(t) Q2>] (21)2 a
where we have added two terms associated with the representative dipole 2 to exploit the
symmetry of the problem. The initial condition for Eq (21) is given by Eq. (20).
The calculation of the sum of four correlation functions on the right hand side of Eq
(21) is best proceeded by considering the correlation matrix
C (<Q(t)Q> <Ql(t)Q2 (22)C•t =[Q~tQ><%w%>
(22)
The equation of motion for C (t) is obtained from Eq (18) by multiplying the adjoin of A
to the right side of both equations and then taking the ensemble average:
C1 (23)
Unlike Eq. (18), the random force F (t) is absent explicitly in Eq. (23) owing to the fact that
the correlation between random force F and dynamic variable A vanishes. 17
The sum of the diagonal elements of E (t), [<Q 1(t) Q1> + <Q 2(t) Q2 >], and the
sum of off-diagonal terms of 9(t), [ < Q1(t) Q2 > + < Q2(t) Q, > 1, are known as the self-time
correlation functions and the pair-time correlation functions, respectively. The otientational
Page 14

order parameter can thus be obtained from the elements of the time correlation function
matrix.
To calculate the time correlation function matrix, we take the Laplace transform of
Eq (23) and convert it into an algebraic equation:
~z zI (+J.Y)co (24)
where I is a 2 by 2 unit matrix, and
1ý(0) is C (t) at t = 0. Using the definition of the X matrix (Eq (19)), we have found after
performing several straightforward matrix multiplication steps that
W I [a(z +L)- PM P(z+L) -aM (26)(z+L)2-M2 P(z+L)-aM a (z+L)-13M(
where
L 1 (ad- 3h) (27A)a2 p2
M - 1 (ah- Pd) (27B)a2 p2
The self- and pair correlation parts of Eq (26) are thus given by
('L(z) =M 2 {a(z+L)-pM} (28A)(z + L 1-
Page 15

2CP~z-zL2M W{•(z +L)-am) (28B)
One notes from Eq (16) that the Laplace transform of the order parameter <cosOl(t)>E
is equal to one half of the sum of Cs(z) and Cp(z); i.e.,
<coS0I(z)>R=f" dteo- <cos61(t)>= I [ )(29)
-_ _ _+1 _ ______1_)
z+L+M z +(d+h)/(cc +3)
Equation (29) can be reverted to time by taking the inverse Laplace transform. Thus, we
have found that the decay of the POP to the polar orientational order parameter is given
by
<cosOl(t)>E = (a + p) e-t/T (30)
where the relaxation r is given by
S=(cc P • (31)(d +h)
Equation (31) shows that the relaxation time r for a two-coupled dipole system is
proportional to a + P, which in accordance with Eq (20), is equal to the order parameter
L31(0). Thus, the relaxation time increases as the polar orientational order parameter
increases. Both kinetic coefficients d and h also contribute to the relaxation time r, but they
do not depend on the order parameter. It is important to point out that if the pair
correlation contribution (Eq. (28B)) is not included in the calculation, the decay of the POP
will only be given by the self-part (Eq. (28A)), which does not have the simple form of Eq.
(30).
Although the above calculation is made on a two-coupled dipole model, we have
Page 16

SI I II I I E I
shown elsewhere, 18 that the above result is only slightly modified when the calculation is
extended to a general N-coupled dipolar system. The modification corresponds to the
replacement of p by (N-1)P, and h by (N-1)h.
To verify the prediction of Eq. (33), we have carried out the measurement of the
SHG signal as a function of time using a sample (containing 5 wt% NAS) under an
isothermal condition. The sample isothermally controlled at 115"C are repeatedly poled by
an electric field of variable strengths. The shape of the decay curve at each poling field is
fit to Eq. (9) to obtain the relaxation time r. In Fig. 5, we plot the relaxation time r versus
the strength of the poling field Ep. One notf.s that T increases with Ep, consistent with the
prediction of Eq. (31). As a + ,8 is equai to the order parameter L31(0), which increases
with the poling field strength.
We have thus shown that the decay of the SHG signal can be impeded by increasing
the poling field strength Ep. The increase in Ep results in a larger POP, which thus stabilizes
the SHG signal.
In summary, we have investigated the electric field dependence of the SHG intensity
and its stability using a guest/host polymer system. We have shown that under the low
poling field condition the SHG intensity is proportional to Ep2. provided that the poling field
is greater than the threshold field Es. Below the threshold field, only the dipoles near the
electrodes are oriented. The macroscopic orientational polar order develops as the poling
field exceeds Es. The decay of the SHG signal is strongly affected by the pair orientational
correlation which significantly contributes to the polar order. The lengthening of the
orientational relaxation time by the increase of the poling field strength is observed.
Theoretical analysis utilizing linear response theory shows that the relaxation time associated
Page 17

with the decay of polar order is proportional to the polar order parameter initially induced
in the sample. We have carried out experimental measurements and verified the prediction.
Acknowledgement: This work is supported by ONR and NSF (DMR 9112993). Partial
financial support from the Center for Material Research and Analysis is also acknowledged.
References
1. D. . Williams, ed. Nonlinear Properties of Organic and Polymeric Materials, ACS
Symp. Ser. 233 (1983).
2. D. R. Dai, M. A. Hubbard, J. Park, T. J. Marks, J. Wong, and G. K. Wong, MoL
Cryst. Liqu. Cryst. 189, 93 (1990).
3. H. W. Guan, S. H. Gu and C. H. Wang, Macromolecules (submitted)
4. H. W. Guan and C. H. Wang, J. Chem. Phys. 98, xxx (1993).
5. C. H. Wang, J. Chem. Physics 18, xxx (1993).
6. D. S. Chemla and J. Zyss, Nonlinear Optical Properties of Organic Molecules and
Crystals Vol. 1, p. 102 (1987) Academic Press.
7. M. A. Mortazavi, A. Knoesen, S. T. Kowel, R. T. Henry, J. M. Hoover and G. A.
Lindsay, Appi Phys. 1353, 287 (1991).
8. David Williams (private conversation).
9. A. Dhinojwasa, G. K. Wong, J. M. Tokelson, Polymer Preprints 32, 100 (1991).
10. H. W. Guan, S. H. Gu and C. H. Wang (to be published).
11. K. D. Singer and L. A. King, Polymer Preprints 32, 98 (1991).
12. H. C. Hampsch, J. Yang, G. K. Wong and J. M. Torkelson, Macromolecules 23, 3640
Page 18

(1990).
13. T. Goodson III and C. H. Wang, Dipolar Orientational Relaxation in a Guest/Host
Amorphous polymer Probed by Second Harmonic Generation, Macromolecules ( in
press).
14. See for example, C. H. Wang Spectroscopy of Condensed Media (Academic Press,
Orlando, 1985), Chapter 1.
15. J. W. Wu, J. Opt. Soc. Am. B 8, 142 (1991).
16. S. S. Gong, T. Goodson III, H. W. Guan and C. H. Wang, Orientational Pair
Correlation. Polar Order Parameter and Temperature Stability in the Second
Harmonic Generation Amorphous Polymers, Nonlinear Optics (to be published).
17. R. Zwanzig, Annu. Rev. Phys. Chem. 16, 67 (1965).
18. C. H. Wang, Chem. Phys. Letters (submitted).
Page 19

Figure Captions
Fig. 1 Variation of the glass transition temperature (Tg) of the NAS/PMMA system with
the NAS concentration.
Fig. 2 Amplitude of the SHG signal for the 5 wt% NAS in the PMMA sample at 110°C
plotted as a function of the square of the poling field strength (Ep2).
Fig. 3 Temperature dependence of the SHG intensity for the 5 wt% sample.
Fig. 4 The SHG decay data for the sample poled at two temperatures, at the same electric
field. Note the disappearance of the initial intensity decrease in Curve B. The solid
curves are the single exponential fit to the experimental data.
Fig. 5 Relaxation time constant r associated with the decay of the polar order for the 5
wt% NAS sample isothermally controlled at 115 0C plotted as a function of the
strength of the poling field. The solid curve is drawn to indicate the trend.
Page 20
41
00
LO
41
tn0 U)0 Ln0(N (N 0
(00)

!I I II I I I
04
L0 Lo
04 io
C oOHS%
,1 I II .,,0 • 0 0 • 4
o 6 d d d0
('l)) tts

Ul)
00
(2v)OHS I

0.4
(A)0.3
0.2
0.1
0.00100S2000 4000 6000 8000
0.4
(B)0.3
0.2
0.1
0.00 50 100 150 200 250 300

0'
0
0')
6
00 0 0 0 o00 to 4* £NC14 C4 CN04 6
(-aa) -