Embed Size (px)
Citation preview

Security Analysis &
Portfolio Management Investment Overview
class-2By
B.Pani M.Com,LLB,FCA,FICWA,ACS,DISA,MBA9731397829

Types of Financial MarketsTypes of Financial Markets
Types of Financial MarketsTypes of Financial Markets
Types of Financial MarketsTypes of Financial MarketsCapital Market
Money Market
Forex Market
EquityDebt
RetailCorporateBanksFIFIIs
T-BillsCall Money, CP,
BanksCorporateFI, FIIs
SpotsForwards
BanksCorporateFI, FIIs
AgricultureProduces,Metals,Financialfutures likeInterest rate,currency,indices etc
Banks, FIsCorporate
DerivativesMarket

GOIMinistry of Finance
RBISEBI
Depositories Companies
BrokerDealers
ClearingCorporations
StockExchanges
MutualFunds
Banks
Registrar of Companies
MerchantBankers
Registrar &TransferAgents
PrimaryDealers
GOIDept of Co. Affairs
DepositoryParticipants
Structure of Indian Financial Markets
GOIMinistry of Finance
RBISEBI
Depositories Companies
BrokerDealers
ClearingCorporations
StockExchanges
MutualFunds
Banks
Registrar of Companies
MerchantBankers
Registrar &TransferAgents
PrimaryDealers
GOIDept of Co. Affairs
DepositoryParticipants
Structure of Indian Financial System:

Financial System
Suppliers of FundsIndividualsBusinesses
Governments
Demanders of FundsIndividualsBusinesses
Governments
Financial MarketsMoney MarketCapital Market
Financial InstitutionsCommercial Banks
Insurance CompaniesMutual Funds
Provident/Pension FundsNon-banking Financial Companies
Private Placement
Funds
Securities
Funds Securities
Funds Funds
SecuritiesSecurities
FundsFunds
DepositsShares
Loans
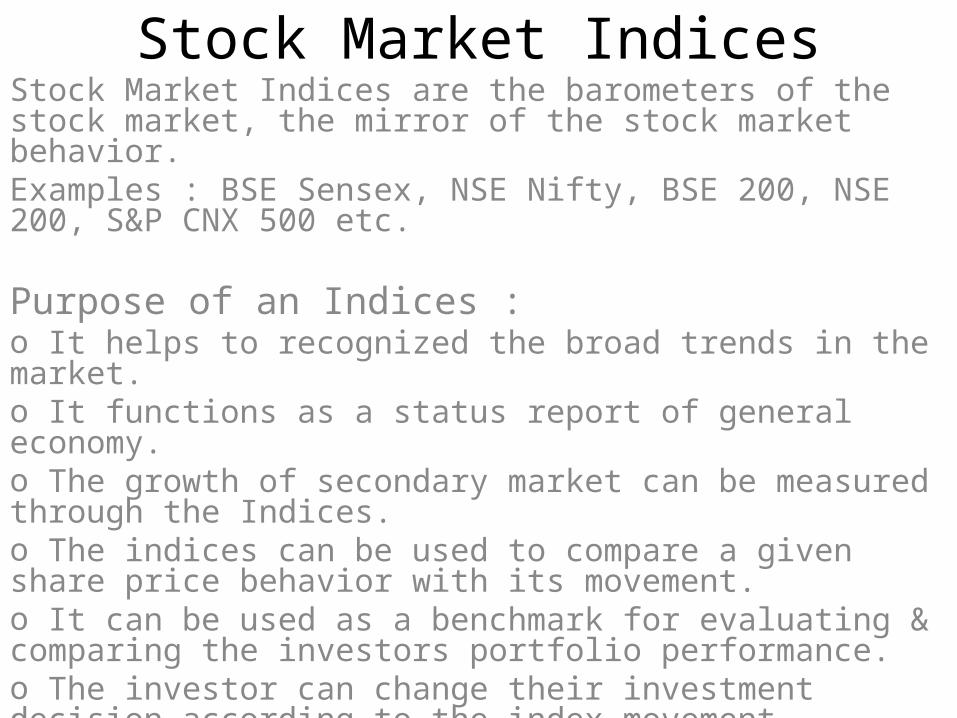
Stock Market IndicesStock Market Indices are the barometers of the stock market, the mirror of the stock market behavior.Examples : BSE Sensex, NSE Nifty, BSE 200, NSE 200, S&P CNX 500 etc.
Purpose of an Indices : o It helps to recognized the broad trends in the market.o It functions as a status report of general economy.o The growth of secondary market can be measured through the Indices.o The indices can be used to compare a given share price behavior with its movement.o It can be used as a benchmark for evaluating & comparing the investors portfolio performance.o The investor can change their investment decision according to the index movement.


NIFTY
• Nifty is a well diversified 50 stocks index accounting for 22 sectors for the economy.
• Base period is April 1995.• The base value has been set at 1000 & base capital
of Rs.2.06 trillion.• The average total traded value for the last 6 months
of all Nifty stocks is approximately 45.24% of the total traded value of all stocks on the NSE.
• Nifty stocks represents about 57.92% of the total market capitalization.

S & P CNX 500• The base year is 1994 and the base value is 1000.• It is India’s first broad based index consisting of
500 stocks.• The companies are selected on the basis of market
capitalization, trading interest and financial performances.
• The industry group included in S & P is 72.• The S&P CNX 500 represents about 90.30% of
total market capitalization and about 80.02% of the total turnover on the NSE.

SENSEX• Started journey from 1986.• The base year was 1978-79, the base value is 100.• Initially is was based on value weighted index, but
was shifted to free float methodology from 1st Sep 2003.
• Free float is defined as the proportion of total shares issued by the company that are really available for trading.
• These categories are excluded:>Holding by founder director. >Govt. holding as
promoter. >Holding through FDI route. >Strategic stake by private corporate body. > Equity held by group or associate company.

International Stock Exchanges• NYSE : The world biggest stock exchange in terms of
market capitalization. The index is called Dow Jones Industrial Average (DJIA). It is a 30 share index. The base year is 1941-42 and the base value is 10.
• National Association of Securities Dealers Automated Quotation System (NASDAQ) : It is the biggest exchange of the world in terms of ternover. The tech heavy weights like Cisco, Intel. Microsoft are listed. It also attract the young tech co. because of low listing cost. It was established in 1971 and the index is nasdaq-100.
Cont….

• London stock exchange : Index is FTSE consisting of 100 stocks.
• Tokyo stock exchange : Index is Nikkei consists of 225 stocks.
• Paris stock exchange : Index is CAC, consists of 30 shares.
CountryCountry IndexIndex
South South KoreaKorea
KospiKospi
BrazilBrazil BovespaBovespa
MexicoMexico BolsaBolsa
RussiaRussia RTS 25RTS 25
Hong Hong KongKong
Hang Hang sang sang

Calculation of IndexMost of the stock indices used in practice are of 3
types.1. Price – weighted index : An index reflecting the
sum of the prices of the sample shares in a certain year with reference to a base year.
2. Equal - weighted index : It assumes that the investor invest an equal amount of money in each stocks included in the index.
3. Value – weighted index : It assumes that the investor allocates money across various stocks included in the index in such a way that the weights assigned to the various stocks are proportional to their market capitalization.

Numerical Example
StockStock Price in the Price in the base year base year
(Rs)(Rs)
Price after Price after one year one year
(Rs)(Rs)
Number of Number of shares shares
outstandinoutstanding (mn)g (mn)
AA 5050 7070 1010
BB 4040 5050 2020
CC 100100 9090 55

Criteria for selection of stocks in NIFTY
• Impact Cost: The security should have traded at an average impact cost of 0.75% or less during the last 6 months for 90% of the observations.
[ This is the cost of executing a transaction in a given stock, for a predetermined order size at any given point of time.]
Mathematically it is the percentage difference between ideal price & actual price.
(i) Impact cost is separately computed for buy & sell.(ii) Impact cost may vary for different transaction
size.

To buy 1500 shares
Ideal Price = (99+98)/2 = 98.50Actual Buy Price = (1000*99)+(500*100)/1500 = 99.33
Impact cost = (99.33 – 98.50) /98.50 *100 = 0.84%
Bid Bid QuantityQuantity
Bid PriceBid Price Offer Offer Quantity Quantity
Offer Offer PricePrice
10001000 9898 10001000 9999
20002000 9797 15001500 100100
10001000 9696 10001000 100.50100.50
500500 95.5095.50 5050 101101

• Market Capitalization: The average market capitalisation of Rs.500 crores or more during the last six months.
• Floating stock: The company should have at least 12% floating stock.
• Other: A company which come out with IPO will be eligible for inclusion, if it fulfills the normal eligible criteria for the index like impact cost, mkt cap, floating stock for three months period instead 6 months.
• The index is reviewed every quarter & the announcement of incoming & outgoing scrip has to be given 4 weeks in advance.

Criteria for selection in Sensex
• Trading frequency: The scrip should have been traded on each & every trading day for last 6 months.
• Market capitalization weightage: The weight of each scrip in Sensex based on 6 months average free float market capitalization should be at least 0.5% of the index.
• Industry representation: Scrip selection would take into account a balanced representation of the listed companies in the universe of BSE. The index companies should be leaders in their industry group.
• Listed history: Should have a listing history of at least 3 months.

• BSE sensex : Free float value weighted index.(2003).
• NSE nifty : value weighted index.• ET index : equally weighted index.• FTSE : Free float price weighted index..• Nikkei : price weighted index.• DJIA : Free float price weighted index.• S&P 500 US : Free float value weighted index.• MSCI: Free float price weighted index.

Limitation of Indices
• The coverage is different for all the indices and hence each index may give only a partial picture of the movement of the price.
• The Index Fallacy.
• ASSIGNMENT
Security & Exchange Board of India
• Before the establishment of SEBI the principal legislation governing the security market in India were Capital Issue Controller Act 1956.
• The regulatory power were vested with CCI (for primary market) and stock exchange division (for secondary market) under the ministry of finance GoI.
• In the year 1989 SEBI was created but till 1992 CCI controlled the primary market.

Functions of SEBIIn the Primary market : Entry norm Promoters contribution Disclosure Book building. EtcIn the Secondary Market : Infrastructure Settlement & clearing Price stabilizing Delisting Regulate brokers Curb insider trading.

Three Types of Investors
1.Savers2.Speculators
3.Specialist

Savers• Savers are those people who spend the majority of their
life slowly growing their “nest egg” in order to ensure a comfortable retirement.
• They either entrust others to dictate their investments (money managers or financial planners) or they simply diversify their investments across a number of different asset classes (they create “a diversified portfolio”).
• Ultimately generate a consistent annual return in the range of 3-8% (after adjusting for inflation). Those who entrust their money to professional money managers generally get the same level of diversification, and the same 3-8% returns (minus the management fees).

• Savers seek low-risk growth of their capital, and in return, are willing to accept a relatively low rate of return.
• While there is certainly nothing wrong with striving for consistent returns, what the Saver is doing is really no different than putting their money in a Bank Deposit, albeit with slightly higher returns.
• The bulk of Savers are investing for long-term financial security and retirement.
• They start saving in their 20’s and 30’s by putting money mutual funds, and other diversified investments, and in 30 or 40 years, they have enough to retire on.

Speculators
• Unlike Savers, Speculators choose to take control of their investments, and not rely solely on “time” to get to the point of financial independence.
• Instead of just spreading their money across stock funds, bonds, real estate funds, and a variety of other asset categories, Speculators are always looking for an investing edge. Perhaps they get a hot stock tip and try to cash in on the next Google.
• Speculators recognize that they can have higher returns than Savers, and are willing to do or try anything to get those returns.

• Speculators are always looking for the next great investment; for them, it’s all about being in the right place at the right time, and taking a chance on getting rich. If today’s investment doesn’t work out, there will always be another one tomorrow.
• While the Speculator recognizes the potential gains from smart investing, he doesn’t always invest smart. He is very much a gambler, and while sometimes those gambles pay off, often times they don’t.
• While the Speculator may have enough luck and skill to be a successful investor, he may show little or no profit after paying brokerage commissions, and other investing fees.

Specialist
• Like the Speculator, the Specialist realizes that there is a more powerful investing strategy than just diversifying across a range of asset classes.
• But, unlike the Speculator, the Specialist understands that the key to successful investing isn’t luck, “hot tips”, or “being in the right place at the right time”; it’s education and experience.
• The Specialist recognizes that investing is no different than any other competitive endeavor — there will be winners and there will be losers, and the winners will generally be those who are most prepared.

• The Specialist generally picks a single investing area, and becomes an expert in that area. Some Specialists deal in paper assets, some deal in real estate, and some start businesses.
• Unlike the Speculator who looks for the next “hot” investing area and the next hot market, the Specialist can make money in his chosen investment area during any market — hot, cold, or in-between.
• The Specialist knows his investment area inside and out, and instead of just entering and exiting investments, the Specialist has a plan.
• In fact, having a plan is the key difference between the Specialist and either the Saver or the Speculator. The plan is the blueprint for achieve investment success, and with it, the Specialist can achieve huge returns with relatively low risk.

“As far as I am concerned, the stock market doesn’t exist. It is there only as a reference to see if anybody is offering to do anything foolish”
Warren Buffett