Embed Size (px)
Citation preview
CORNERSTONE RESEARCH
Securities Class Action Filings
ECONOMIC AND FINANCIAL CONSULTING AND EXPERT TESTIMONY
2014 Midyear Assessment

Securities Class Action Filings—2014 Midyear Assessment i TABLE OF CONTENTS
Executive Summary ..................................................................................................................................................................... 1 New for the 2014 Midyear Assessment ........................................................................................................................................ 3 Number of Filings ........................................................................................................................................................................ 4 Market Capitalization Losses ....................................................................................................................................................... 6 U.S. Exchange-Listed Companies ............................................................................................................................................... 8 New Analysis: Recent IPO Trends .............................................................................................................................................. 9 New Analysis: Recent IPO Litigation Exposure ........................................................................................................................ 10 Filing Lag .................................................................................................................................................................................. 12 Foreign Filings ........................................................................................................................................................................... 13 Heat Maps: S&P 500 Securities Litigation™ ............................................................................................................................. 15 Industry ...................................................................................................................................................................................... 17 Mega Filings .............................................................................................................................................................................. 18 Exchange ................................................................................................................................................................................... 19 Circuit ........................................................................................................................................................................................ 20 New Developments .................................................................................................................................................................... 21
Halliburton Co. v. Erica P. John Fund ................................................................................................................................. 21 High-Frequency Trading Litigation ...................................................................................................................................... 22
Glossary ..................................................................................................................................................................................... 23 Appendices ................................................................................................................................................................................ 25 Research Sample ........................................................................................................................................................................ 28 Endnotes .................................................................................................................................................................................... 28
The views expressed in this report are solely those of the authors, who are responsible for the content, and do not necessarily represent the views of Cornerstone Research.

Securities Class Action Filings—2014 Midyear Assessment ii TABLE OF FIGURES AND APPENDICES
Figure 1: Class Action Filings Summary ..................................................................................................................................... 1 Figure 2: Class Action Filings (CAF) Index™ Semiannual Number of Class Action Filings..................................................... 4 Figure 3: Class Action Filings (CAF) Index™ Annual Number of Class Action Filings ............................................................ 5 Figure 4: Disclosure Dollar Loss (DDL) Index™ ....................................................................................................................... 6 Figure 5: Maximum Dollar Loss (MDL) Index™ ....................................................................................................................... 7 Figure 6: Percentage of U.S. Exchange-Listed Companies Subject to Filings and Change in the Number of Companies
Listed on U.S. Exchanges ..................................................................................................................................................... 8 Figure 7: Number of IPOs on Major U.S. Exchanges.................................................................................................................. 9 Figure 8: Cumulative Litigation Exposure by Years after IPO, Controlling for Company Survival ......................................... 11 Figure 9: Semiannual Median Lag between Class End Date and Filing Date ........................................................................... 12 Figure 10: Class Action Filings-Foreign (CAF-F) Index™ Annual Number of Class Action Filings by Location of
Headquarters ....................................................................................................................................................................... 13 Figure 11: Foreign Filings by Location of Headquarters ........................................................................................................... 14 Figure 12: Heat Maps of S&P 500 Securities Litigation™ Percentage of Companies Subject to New Filings ........................ 15 Figure 13: Heat Maps of S&P 500 Securities Litigation™ Percentage of Market Capitalization Subject to New Filings........ 16 Figure 14: Filings by Industry ................................................................................................................................................... 17 Figure 15: Mega Filings ............................................................................................................................................................. 18 Figure 16: Filings by Exchange Listing ..................................................................................................................................... 19 Figure 17: Filings by Court Circuit ............................................................................................................................................ 20 Appendix 1: Filings Comparison ............................................................................................................................................... 25 Appendix 2: Survival Rates of Companies after IPO ................................................................................................................ 25 Appendix 3: Litigation Exposure Rates of Companies after IPO .............................................................................................. 26 Appendix 4: Filings by Industry ................................................................................................................................................ 27 Appendix 5: Filings by Court Circuit ........................................................................................................................................ 27

Securities Class Action Filings—2014 Midyear Assessment 1 EXECUTIVE SUMMARY
NUMBER AND SIZE OF FILINGS
• Plaintiffs filed 78 new federal class action securities cases (filings) in the first six months of 2014—13 fewer than in the second half of 2013, but slightly higher than the 75 filings in the first half of 2013. This number was 18 percent below the historical semiannual average of 95 filings observed between 1997 and 2013. (pages 4–5)
• The total Disclosure Dollar Loss (DDL) of filings remained at low levels. Total DDL was $30 billion in the first half of 2014, 52 percent below the historical semiannual average of $62 billion. (page 6)
• The total Maximum Dollar Loss (MDL) decreased again in the first half of 2014, falling to its lowest level in the last 16 years. For the first six months of 2014, MDL was $93 billion, or 70 percent below the historical semiannual average MDL of $315 billion. (page 7)
• In the first six months of 2014, there were no mega DDL or MDL filings—filings with a disclosure dollar loss (DDL) of at least $5 billion or a maximum dollar loss (MDL) of at least $10 billion. This is the first time since the latter half of 1997 that there have been no mega filings. (page 18)
Federal securities fraud class action filings slumped in the first half of 2014.
FIGURE 1: CLASS ACTION FILINGS SUMMARY
Semiannual Average1997 H1–2013 H2 2013 H1 2013 H2 2014 H1
Class Action Filings 95 75 91 78
Disclosure Dollar Loss ($ Billions) $62 $25 $79 $30
Maximum Dollar Loss ($ Billions) $315 $115 $163 $93

Securities Class Action Filings—2014 Midyear Assessment 2 EXECUTIVE SUMMARY continued
KEY TRENDS
• Class actions continued to be filed shortly after the end of the class period. In the first half of 2014, the median lag time between the end of the alleged class period and the filing date of the lawsuit was 12 days. (page 12)
• Continuing a three-year trend, in the first half of 2014 the number of filings declined against companies with large market capitalizations, as represented by firms in the S&P 500. (pages 15–16)
• Healthcare, biotechnology, and pharmaceutical companies (included in the Consumer Non-Cyclical sector) together accounted for 21 percent of total filings in the first half of 2014. As in 2012 and 2013, companies in this industry grouping were most frequently the subject of a class action, with biotechnology firms being the most common targets of class actions so far in 2014. (page 17)
• Filing activity in the first half of 2014 was less concentrated in the Second and Ninth Circuits than in the two most recent semiannual periods. Filings for the first half of 2014 in the Sixth, Eighth, and Tenth Circuits have already equaled or eclipsed the number of filings in those circuits for the full year of 2013. (page 20)
The first half of 2014 showed a decrease in filings against S&P 500 companies.

Securities Class Action Filings—2014 Midyear Assessment 3 NEW FOR THE 2014 MIDYEAR ASSESSMENT
RECENT INITIAL PUBLIC OFFERING TRENDS
This analysis examines the number of companies undertaking an initial public offering (IPO) since 2008. (page 9)
• On major U.S. exchanges, there were 112 IPOs in the first half of 2014.
• At the current pace, the number of IPOs in 2014 will be 43 percent greater than in 2013, which itself was more than 50 percent larger than the annual number of IPOs in the prior three years. Current IPO activity, however, is still much lower than the IPO activity in the latter half of the 1990s.
IPO activity has continued to pick up in the first six months of 2014.
RECENT IPO LITIGATION EXPOSURE
In the context of recent heightened IPO activity, this analysis looks at the likelihood of class actions being filed against newer public offerings. (pages 10–11)
• Recent IPOs (those after the financial crisis) have had initially higher litigation exposure in the years following their offerings than earlier IPOs.
• For more mature IPO cohorts, despite differences that may exist among the IPO groups, their litigation exposure path over time has been similar.
NEW DEVELOPMENTS
• Halliburton Co. v. Erica P. John Fund (page 21)
• High-Frequency Trading Litigation (page 22)

Securities Class Action Filings—2014 Midyear Assessment 4 NUMBER OF FILINGS
KEY FINDINGS
• There were 78 reported filings in the first half of 2014, a 14 percent decrease from the 91 filings in the second half of 2013. While the number of filings in the first half of 2014 remained below the 1997–2013 historical semiannual average of 95 filings, the 78 filings do reflect an increase since the low-water mark in the second half of 2012.
• “Traditional filings”—those excluding merger and acquisition (M&A) and Chinese reverse merger (CRM) cases—decreased by 17 percent from 82 filings in the second half of 2013 to 68 in the first half of 2014. A CRM filing is a securities class action against a China-headquartered company listed on a U.S. exchange as a result of a reverse merger with a public shell company.
• Filings related to both CRMs and M&A transactions have continued to persist at relatively low levels in recent semiannual periods. In the first half of 2014, eight filings involved M&A transactions and two related to CRMs.
The number of filings has seesawed over recent semiannual periods.
FIGURE 2: CLASS ACTION FILINGS (CAF) INDEX™ SEMIANNUAL NUMBER OF CLASS ACTION FILINGS 1997 H1–2014 H1
Note: There were two cases in 2011 that were both an M&A filing and a Chinese Reverse Merger company. These filings were classified as M&A filings in order to avoid double counting.
79
95
115
127 126
83
111105
103
77
109115
105
87
111117
109
7365
55
60
78
51
72
44
6349
6447
6474
5566
82
68
3
4
13
27
21
22 8
5
7
6
8
7
24
76
49
30
59
41
3815
8
5
97H1
97H2
98H1
98H2
99H1
99H2
00H1
00H2
01H1
01H2
02H1
02H2
03H1
03H2
04H1
04H2
05H1
05H2
06H1
06H2
07H1
07H2
08H1
08H2
09H1
09H2
10H1
10H2
11H1
11H2
12H1
12H2
13H1
13H2
14H1
Credit Crisis FilingsChinese Reverse Merger FilingsM&A FilingsAll Other Filings
6964
889494
103
72
8285
113110108
1997 H1–2013 H2 Semiannual Average
(95)
78
91
75

Securities Class Action Filings—2014 Midyear Assessment 5 NUMBER OF FILINGS continued
KEY FINDINGS
• If filing activity in the second half of 2014 is the same as in the first half of 2014, there will be a total of 156 filings for 2014, which would be 17 percent lower than the 1997–2013 historical average of 189 filings.
• If filings continue at the same pace for the rest of 2014, this year would then be the sixth consecutive year with below-average filing activity and would have the third lowest total in the last 18 years.
So far in 2014, filing activity has continued at approximately the same pace as in the previous two years.
FIGURE 3: CLASS ACTION FILINGS (CAF) INDEX™ ANNUAL NUMBER OF CLASS ACTION FILINGS 1997–2014 H1
* If the number of filings in the second half of 2014 equals the first half. Note: There were two cases in 2011 that were both an M&A filing and a Chinese Reverse Merger company. These filings were classified as M&A filings in order to avoid double counting.
174
242
209 216
180
224
192
228
182
120
138123
107 113 111129
148
68
4043 13
8
931
1039
100
53
13
1997 1998 1999 2000 2001 2002 2003 2004 2005 2006 2007 2008 2009 2010 2011 2012 2013 2014
H2 FilingsCredit Crisis FilingsChinese Reverse Merger FilingsM&A FilingsAll Other Filings
166
1997–2013 Average (189)
177
223
167175
188
152
*
78
13

Securities Class Action Filings—2014 Midyear Assessment 6 MARKET CAPITALIZATION LOSSES
Disclosure Dollar Loss (DDL) Index™
This index measures the aggregate DDL for all filings over a period of time. DDL is the dollar value change in the defendant firm’s market capitalization between the trading day immediately preceding the end of the class period and the trading day immediately following the end of the class period. DDL should not be considered an indicator of liability or measure of potential damages. See the glossary for additional discussion on market capitalization losses and DDL.
The DDL Index remained at a low level, even when considered in light of the decreased filing activity in the last five years.
KEY FINDINGS
• The DDL Index of $30 billion marked a decrease of 62 percent from the second half of 2013, and is 52 percent less than the 1997–2013 semiannual historical average. The spike in the DDL Index in the second half of 2013 was primarily attributable to one large class action.
• Filings in the first half of 2014 represented the third lowest semiannual DDL in the years since the onset of the financial crisis. This is partly explained by the lack of mega filings in the first half of 2014. See page 18.
FIGURE 4: DISCLOSURE DOLLAR LOSS (DDL) INDEX™ 2000 H1–2014 H1 (Dollars in Billions)
Note: See Appendix 1 for the mean and median values of DDL.
$164
$76
$137
$61
$81
$120
$48
$29
$57
$87
$57
$35
$21$31
$34
$84
$57$74
$29 $26$42 $19 $46
$61 $61
$35
$25
$79
$30
$37
$35
$55
$20$9
$12
00H1
00H2
01H1
01H2
02H1
02H2
03H1
03H2
04H1
04H2
05H1
05H2
06H1
06H2
07H1
07H2
08H1
08H2
09H1
09H2
10H1
10H2
11H1
11H2
12H1
12H2
13H1
13H2
14H1
Credit Crisis Filings
All Other Filings
1997 H1–2013 H2 Semiannual Average
($62)
$55
$49$54
$35
$49
$129
$92
$121
$37

Securities Class Action Filings—2014 Midyear Assessment 7 MARKET CAPITALIZATION LOSSES continued
Maximum Dollar Loss (MDL) Index™
This index measures the aggregate MDL for all filings over a period of time. MDL is the dollar value change in the defendant firm’s market capitalization from the trading day with the highest market capitalization during the class period to the trading day immediately following the end of the class period. MDL should not be considered an indicator of liability or measure of potential damages. See the glossary for additional discussion on market capitalization losses and MDL.
The first half of 2014 marked the lowest semiannual MDL Index in the last 16 years.
KEY FINDINGS
• The MDL Index of $93 billion in the first half of 2014 declined 43 percent from $163 billion in second half of 2013.
• The MDL Index was 70 percent lower than the 1997–2013 semiannual historical average of $315 billion. Positive returns in U.S. stock markets in recent years likely contributed to recent low MDL levels, and the lack of mega filings in the first half of 2014 exacerbated the decline in MDL.
FIGURE 5: MAXIMUM DOLLAR LOSS (MDL) INDEX™ 2000 H1–2014 H1 (Dollars in Billions)
Note: See Appendix 1 for the mean and median values of MDL.
$331
$429
$990
$497
$926
$1,121
$335
$240
$307
$418
$245
$117 $125$169
$160$264
$179 $178 $157$107
$306 $129
$195
$255
$253
$152$115
$163
$93
$266
$292$167 $195
$92
$38
$61
00H1
00H2
01H1
01H2
02H1
02H2
03H1
03H2
04H1
04H2
05H1
05H2
06H1
06H2
07H1
07H2
08H1
08H2
09H1
09H2
10H1
10H2
11H1
11H2
12H1
12H2
13H1
13H2
14H1
Credit Crisis FilingsAll Other Filings
1997 H1–2013 H2 Semiannual Average
($315)
$55
$0
$0
$256
$345
$199
$352$346
$471
$530
$171
$255

Securities Class Action Filings—2014 Midyear Assessment 8 U.S. EXCHANGE-LISTED COMPANIES
The percentage in the figure below is calculated as the unique number of companies listed on the NYSE or NASDAQ that were the subject of class actions in a given year divided by the unique number of companies listed on the NYSE or NASDAQ.
Despite low numbers of filings in recent years, the likelihood that a public company will be the subject of a filing has not changed dramatically.
KEY FINDINGS
• In the first half of 2014, approximately one in 60 companies listed on the major U.S. exchanges was the subject of a class action.
• Assuming the rate of litigation in the second half of 2014 will equal that of the first half, the annual rate in 2014 will be comparable to 2013.
• For the first time since 1998, the number of companies listed on U.S. exchanges increased over the course of the year.
FIGURE 6: PERCENTAGE OF U.S. EXCHANGE-LISTED COMPANIES SUBJECT TO FILINGS AND CHANGE IN THE NUMBER OF COMPANIES LISTED ON U.S. EXCHANGES 1997–2014 H1
Source: Securities Class Action Clearinghouse; Center for Research in Security Prices (CRSP) * If litigation activity in the second half of 2014 equals the first half. Note: 1. Percentages are calculated by dividing the count of issuers listed on the NYSE or NASDAQ subject to filings by the number of companies listed on the NYSE or NASDAQ as of the
beginning of the year. 2. Second-half percentage for 2014 assumes that the percentage of unique listed issuers subject to filings will match the first half. 3. Listed companies were identified by taking the count of listed securities at the beginning of each year and accounting for cross-listed companies or companies with more than one security
traded on a given exchange. Securities were counted if they were classified as common stock or American Depository Receipts (ADRs) and listed on the NYSE or NASDAQ.
2.0%
2.8%
2.5%
2.8%
2.3%
3.2%3.0%
3.7%
3.0%
2.1%
2.9%3.2%
2.5%
3.1%
3.6%
3.1%
3.4%
1.6%
1.6%
1997 1998 1999 2000 2001 2002 2003 2004 2005 2006 2007 2008 2009 2010 2011 2012 2013 2014
1997–2013Average (2.90%)
*
Change in Listed Companies 77 (419) (353) (221) (723) (475) (356) (50) (68) (58) (128) (297) (278) (104) (131) (118) 5
Percent Change 0.95% (5.12%) (4.54%) (2.98%) (10.05%) (7.34%) (5.93%) (0.89%) (1.22%) (1.05%) (2.34%) (5.56%) (5.51%) (2.18%) (2.81%) (2.61%) 0.11%
Legend <(100) (100)–0 >0<(5%) (5%)–0% >0%

Securities Class Action Filings—2014 Midyear Assessment 9 NEW ANALYSIS: RECENT IPO TRENDS
KEY FINDINGS
• IPO activity in the first half of 2014 is on pace to increase for the third consecutive year.
• So far in 2014, IPO activity has equaled 71 percent of total IPO activity in 2013 and already exceeds full-years 2009, 2010, 2011, and 2012.
• While IPO activity has continued to increase since reaching a nadir in 2008, it is still dramatically lower than the 1996–2000 average of 458 IPOs per year—the period of many dot-com IPOs. Following a lull during the financial crisis, the magnitude of IPO activity in recent years has been more comparable to the early and mid-2000s.
IPO activity has continued in the first half of 2014 on an upward trajectory.
FIGURE 7: NUMBER OF IPOs ON MAJOR U.S. EXCHANGES 2009–2014 H1
Source: Jay R. Ritter, “Initial Public Offerings: Updated Statistics” (University of Florida, July 9, 2014). * If the number of IPOs in the second half of 2014 equals the first half. Note: These data exclude the following IPOs: those with an offer price of less than $5, ADRs, unit offers, closed-end funds, real estate investment trusts (REITs), partnerships, small best
efforts offers, banks and savings and loans (S&Ls), and stocks not listed in CRSP databases.
4193 81 93
157112
112*
0
50
100
150
200
250
300
350
400
450
500
2009 2010 2011 2012 2013 2014
2001–2008 Average: 110 IPOs
1996–2000 Average: 458 IPOs

Securities Class Action Filings—2014 Midyear Assessment 10 NEW ANALYSIS: RECENT IPO LITIGATION EXPOSURE
OVERVIEW
This section provides an update to the analysis of litigation exposure following IPOs presented in the 2010 Year in Review. Companies that have recently completed an IPO tend to be higher-risk companies in their high-growth stage of development. These companies tend to have more company-specific risk— that is, they are more likely to have extreme positive and negative performance surprises and hence may have increased litigation risk. In updating the prior work, the following question was considered:
What is the litigation exposure of recent IPOs and how does it compare with prior years?
A total of 4,229 IPOs occurred between 1996 and 2013.1 Of the firms in these offerings, 825 were defendants in at least one securities class action between 1996 and the first half of 2014.
This analysis follows the litigation likelihood of companies after their IPOs between 1996 and 2000 (early period), 2001 and 2008 (pre-crisis), and 2009 and 2013 (post-crisis). These divisions between the periods were chosen because they represent lulls in the IPO market when activity was greatly diminished coinciding with the recessionary periods in the early 2000s and again during the recent financial crisis.
In the years following an IPO, many firms in the analysis drop out due to bankruptcies or M&A activity. Companies are most likely to undergo these changes in the initial years after an IPO. Thus, the calculations are adjusted to correct for survivorship bias within the IPO sample to allow for a more consistent comparison across the groups. Appendix 2 shows the survival rates of the companies in the three IPO groupings.2
Once survivorship bias is addressed, litigation exposure is measured in two ways. Cumulative litigation exposure measures the probability that a surviving company will be a defendant in at least one securities class action during the analysis period. Incremental litigation exposure signifies the probability of a surviving company that has not previously been subject to a securities class action being sued in a given year.

Securities Class Action Filings—2014 Midyear Assessment 11 NEW ANALYSIS: RECENT IPO LITIGATION EXPOSURE continued
KEY FINDINGS
• The post-crisis group’s cumulative litigation exposure rate in the initial years after IPO was higher than either the pre-crisis or the early-period cohorts, but it is likely too early to know if this trend will persist since many of the IPOs do not have three or more years of public history to track.
• In the two more mature cohorts, the incremental litigation exposure generally decreased in the first decade after IPO. See Appendix 3 for litigation exposure values.
• Increases in the tail end of the post-crisis cohort correspond to increases in the likelihood that companies on U.S. exchanges were sued in years 2010 through 2013 (see Figure 6). However, variation in the litigation exposure metrics in the latter years after IPO will naturally increase as the sample of IPOs with the requisite post-IPO history shrinks.
While some variation exists, the IPO cohorts appear to follow reasonably similar cumulative litigation paths.
FIGURE 8: CUMULATIVE LITIGATION EXPOSURE BY YEARS AFTER IPO, CONTROLLING FOR COMPANY SURVIVAL IPOs from 1996 through 2013
Source: Jay R. Ritter, “Founding Dates of IPOs from 1975–April 11, 2014,” updated April 14, 2014, http://bear.warrington.ufl.edu/ritter/FoundingDates.htm; CRSP
0%
5%
10%
15%
20%
25%
30%
35%
40%
45%
1 2 3 4 5 6 7 8 9 10 11
by IPO Offer Year
Years after IPO
Early Period: 1996–2000
Pre-Crisis: 2001–2008
Post-Crisis: 2009–2013
Securities Class Action Filings—2014 Midyear Assessment 12 FILING LAG
KEY FINDINGS
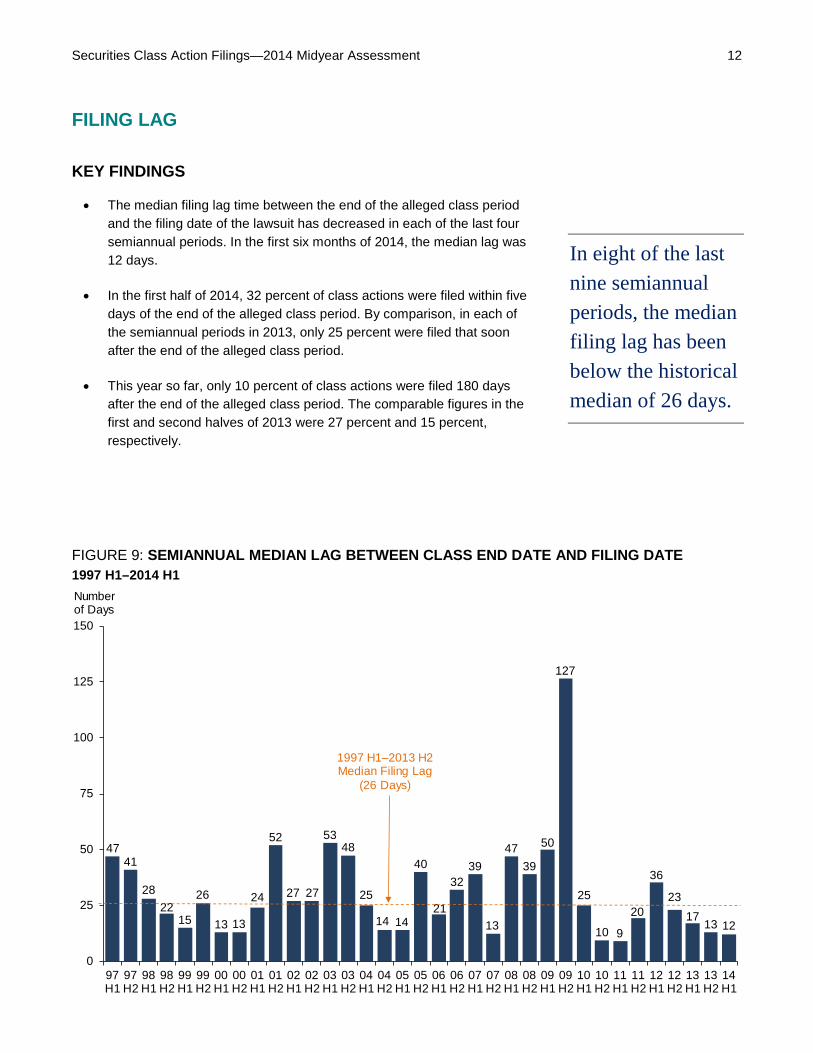
• The median filing lag time between the end of the alleged class period and the filing date of the lawsuit has decreased in each of the last four semiannual periods. In the first six months of 2014, the median lag was 12 days.
• In the first half of 2014, 32 percent of class actions were filed within five days of the end of the alleged class period. By comparison, in each of the semiannual periods in 2013, only 25 percent were filed that soon after the end of the alleged class period.
• This year so far, only 10 percent of class actions were filed 180 days after the end of the alleged class period. The comparable figures in the first and second halves of 2013 were 27 percent and 15 percent, respectively.
In eight of the last nine semiannual periods, the median filing lag has been below the historical median of 26 days.
FIGURE 9: SEMIANNUAL MEDIAN LAG BETWEEN CLASS END DATE AND FILING DATE 1997 H1–2014 H1
4741
2822
15
26
13 13
24
52
27 27
5348
25
14 14
40
21
3239
13
4739
50
127
25
10 9
20
36
2317
13 12
0
25
50
75
100
125
150
97H1
97H2
98H1
98H2
99H1
99H2
00H1
00H2
01H1
01H2
02H1
02H2
03H1
03H2
04H1
04H2
05H1
05H2
06H1
06H2
07H1
07H2
08H1
08H2
09H1
09H2
10H1
10H2
11H1
11H2
12H1
12H2
13H1
13H2
14H1
Number of Days
1997 H1–2013 H2 Median Filing Lag
(26 Days)
Securities Class Action Filings—2014 Midyear Assessment 13 FOREIGN FILINGS
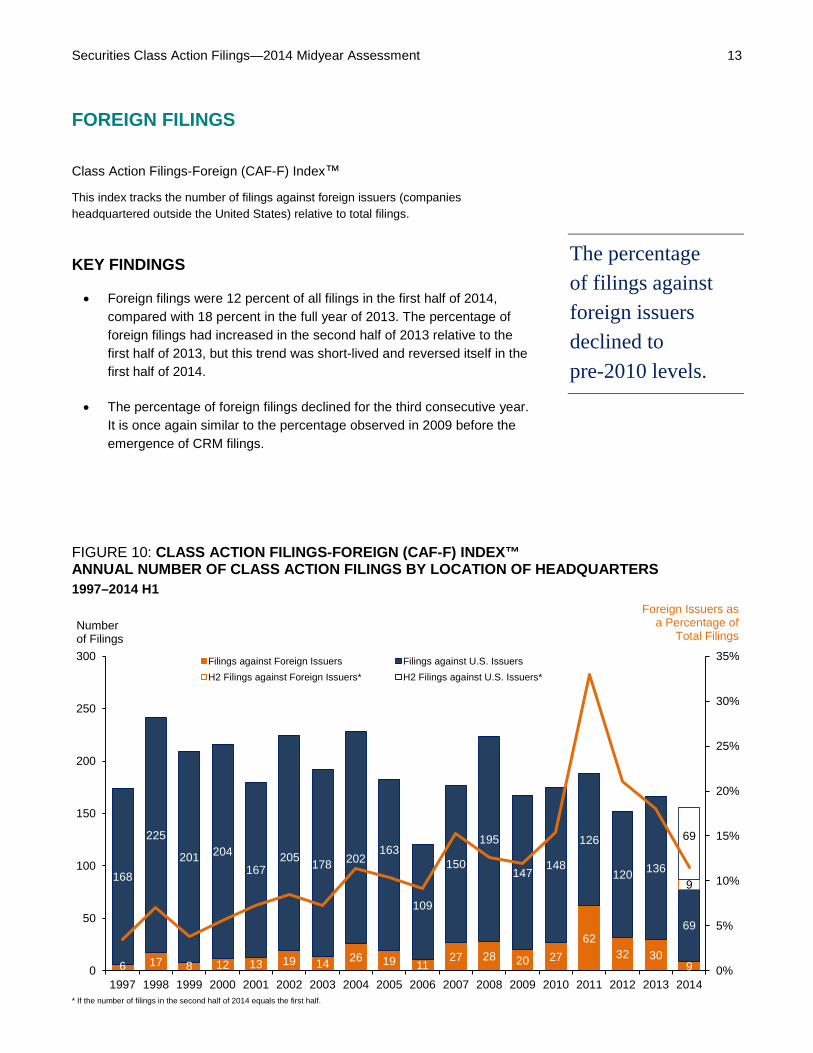
Class Action Filings-Foreign (CAF-F) Index™
This index tracks the number of filings against foreign issuers (companies headquartered outside the United States) relative to total filings.
The percentage of filings against foreign issuers declined to pre-2010 levels.
KEY FINDINGS
• Foreign filings were 12 percent of all filings in the first half of 2014, compared with 18 percent in the full year of 2013. The percentage of foreign filings had increased in the second half of 2013 relative to the first half of 2013, but this trend was short-lived and reversed itself in the first half of 2014.
• The percentage of foreign filings declined for the third consecutive year. It is once again similar to the percentage observed in 2009 before the emergence of CRM filings.
FIGURE 10: CLASS ACTION FILINGS-FOREIGN (CAF-F) INDEX™ ANNUAL NUMBER OF CLASS ACTION FILINGS BY LOCATION OF HEADQUARTERS 1997–2014 H1
* If the number of filings in the second half of 2014 equals the first half.
6 17 8 12 13 19 14 26 19 1127 28 20 27
6232 30
9
168
225
201 204167
205 178 202163
109
150
195
147148
126
120 136
69
9
69
0%
5%
10%
15%
20%
25%
30%
35%
0
50
100
150
200
250
300
1997 1998 1999 2000 2001 2002 2003 2004 2005 2006 2007 2008 2009 2010 2011 2012 2013 2014
Filings against Foreign Issuers Filings against U.S. IssuersH2 Filings against Foreign Issuers* H2 Filings against U.S. Issuers*
Foreign Issuers as a Percentage of
Total FilingsNumberof Filings

Securities Class Action Filings—2014 Midyear Assessment 14 FOREIGN FILINGS continued
KEY FINDINGS
• The absence of filings against Canadian firms in the first half of 2014 is distinctly different from the first and second halves of 2013 when these filings were 27 and 26 percent of total foreign filings, respectively.
• Despite the drop in CRM filings relative to the peak in 2011, the most common foreign filings involved Chinese companies.
• Filings against European companies continued at a pace consistent with the rate in 2013.
• Other foreign filings included class actions involving companies in the British Virgin Islands and the Cayman Islands.
The decline in foreign filings is partly explained by the lack of filings against Canadian firms in the first half of 2014.
FIGURE 11: FOREIGN FILINGS BY LOCATION OF HEADQUARTERS 1997–2014 H1
Note: The Chinese Reverse Merger and Other China and Asia categories include filings for companies headquartered in Hong Kong.
4
4
2
3
2
3
2
5
3
2
1
3
5
3
2
1
3
2
2
3
3
2
0% 10% 20% 30% 40% 50% 60% 70% 80% 90% 100%
Semiannual Average1997 H1–2013 H2
2012 H2
2013 H1
2013 H2
2014 H1
Asia Total Chinese Reverse Merger Other China and Asia Canada Europe Other
Securities Class Action Filings—2014 Midyear Assessment 15 HEAT MAPS: S&P 500 SECURITIES LITIGATION™
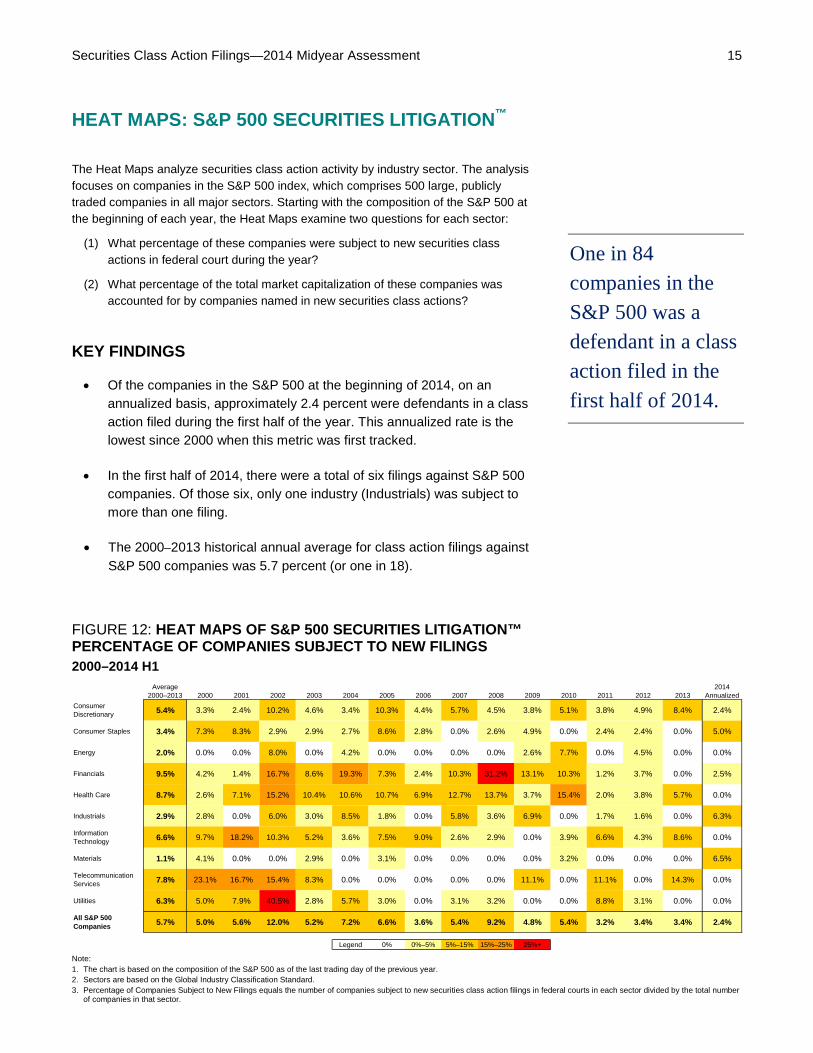
The Heat Maps analyze securities class action activity by industry sector. The analysis focuses on companies in the S&P 500 index, which comprises 500 large, publicly traded companies in all major sectors. Starting with the composition of the S&P 500 at the beginning of each year, the Heat Maps examine two questions for each sector:
(1) What percentage of these companies were subject to new securities class actions in federal court during the year?
(2) What percentage of the total market capitalization of these companies was accounted for by companies named in new securities class actions?
One in 84 companies in the S&P 500 was a defendant in a class action filed in the first half of 2014.
KEY FINDINGS
• Of the companies in the S&P 500 at the beginning of 2014, on an annualized basis, approximately 2.4 percent were defendants in a class action filed during the first half of the year. This annualized rate is the lowest since 2000 when this metric was first tracked.
• In the first half of 2014, there were a total of six filings against S&P 500 companies. Of those six, only one industry (Industrials) was subject to more than one filing.
• The 2000–2013 historical annual average for class action filings against S&P 500 companies was 5.7 percent (or one in 18).
FIGURE 12: HEAT MAPS OF S&P 500 SECURITIES LITIGATION™ PERCENTAGE OF COMPANIES SUBJECT TO NEW FILINGS 2000–2014 H1
Note: 1. The chart is based on the composition of the S&P 500 as of the last trading day of the previous year. 2. Sectors are based on the Global Industry Classification Standard. 3. Percentage of Companies Subject to New Filings equals the number of companies subject to new securities class action filings in federal courts in each sector divided by the total number
of companies in that sector.
Average 2000–2013 2000 2001 2002 2003 2004 2005 2006 2007 2008 2009 2010 2011 2012 2013
2014 Annualized
Consumer Discretionary 5.4% 3.3% 2.4% 10.2% 4.6% 3.4% 10.3% 4.4% 5.7% 4.5% 3.8% 5.1% 3.8% 4.9% 8.4% 2.4%
Consumer Staples 3.4% 7.3% 8.3% 2.9% 2.9% 2.7% 8.6% 2.8% 0.0% 2.6% 4.9% 0.0% 2.4% 2.4% 0.0% 5.0%
Energy 2.0% 0.0% 0.0% 8.0% 0.0% 4.2% 0.0% 0.0% 0.0% 0.0% 2.6% 7.7% 0.0% 4.5% 0.0% 0.0%
Financials 9.5% 4.2% 1.4% 16.7% 8.6% 19.3% 7.3% 2.4% 10.3% 31.2% 13.1% 10.3% 1.2% 3.7% 0.0% 2.5%
Health Care 8.7% 2.6% 7.1% 15.2% 10.4% 10.6% 10.7% 6.9% 12.7% 13.7% 3.7% 15.4% 2.0% 3.8% 5.7% 0.0%
Industrials 2.9% 2.8% 0.0% 6.0% 3.0% 8.5% 1.8% 0.0% 5.8% 3.6% 6.9% 0.0% 1.7% 1.6% 0.0% 6.3%
Information Technology 6.6% 9.7% 18.2% 10.3% 5.2% 3.6% 7.5% 9.0% 2.6% 2.9% 0.0% 3.9% 6.6% 4.3% 8.6% 0.0%
Materials 1.1% 4.1% 0.0% 0.0% 2.9% 0.0% 3.1% 0.0% 0.0% 0.0% 0.0% 3.2% 0.0% 0.0% 0.0% 6.5%
Telecommunication Services 7.8% 23.1% 16.7% 15.4% 8.3% 0.0% 0.0% 0.0% 0.0% 0.0% 11.1% 0.0% 11.1% 0.0% 14.3% 0.0%
Utilities 6.3% 5.0% 7.9% 40.5% 2.8% 5.7% 3.0% 0.0% 3.1% 3.2% 0.0% 0.0% 8.8% 3.1% 0.0% 0.0%
All S&P 500 Companies 5.7% 5.0% 5.6% 12.0% 5.2% 7.2% 6.6% 3.6% 5.4% 9.2% 4.8% 5.4% 3.2% 3.4% 3.4% 2.4%
Legend 0% 0%–5% 5%–15% 15%–25% 25%+

Securities Class Action Filings—2014 Midyear Assessment 16 HEAT MAPS: S&P 500 SECURITIES LITIGATION continued
KEY FINDINGS
• On an annualized basis, approximately 1.1 percent of the S&P 500 market capitalization in the first half of 2014 was subject to new filings. This annualized 2014 rate is markedly low compared with the 2000–2013 historical average of 10.1 percent.
• No single industry in the first half of 2014 had over 5.0 percent of its market capitalization subject to new filings (on an annualized basis).
• Historically, larger S&P 500 companies have been more likely targets of class actions, as demonstrated by a lower historical percentage of firms subject to filings (5.7 percent) than the historical share of market capitalization attributed to such firms (10.1 percent). This trend reversed in the first half of 2014, when the percentage of S&P 500 companies subject to filings (2.4 percent) was higher than the share of market capitalization attributed to these companies (1.1 percent).
Uncharacteristically, fewer of the larger companies in the S&P 500 were targeted with filings in the first half of 2014.
FIGURE 13: HEAT MAPS OF S&P 500 SECURITIES LITIGATION™ PERCENTAGE OF MARKET CAPITALIZATION SUBJECT TO NEW FILINGS 2000–2014 H1
Note: 1. The chart is based on the market capitalizations of the S&P 500 companies as of the last trading day of the previous year. If the market capitalization on the last trading day is not
available, the average fourth-quarter market capitalization is used. 2. Sectors are based on the Global Industry Classification Standard. 3. Percentage of Market Capitalization Subject to New Filings equals the total market capitalization of companies subject to new securities class action filings in federal courts in each sector
divided by the total market capitalization of all companies in that sector.
Average 2000–2013 2000 2001 2002 2003 2004 2005 2006 2007 2008 2009 2010 2011 2012 2013
2014 Annualized
Consumer Discretionary 6.4% 6.5% 1.3% 24.7% 2.0% 7.9% 5.7% 8.9% 4.4% 7.2% 1.9% 4.9% 4.6% 1.6% 4.4% 4.9%
Consumer Staples 5.0% 34.5% 6.3% 0.3% 2.3% 0.1% 11.4% 0.8% 0.0% 2.6% 3.9% 0.0% 0.8% 14.0% 0.0% 0.9%
Energy 2.4% 0.0% 0.0% 1.7% 0.0% 44.9% 0.0% 0.0% 0.0% 0.0% 0.9% 3.3% 0.0% 1.2% 0.0% 0.0%
Financials 20.4% 3.3% 0.8% 29.2% 19.9% 46.1% 22.2% 8.2% 18.1% 55.0% 38.3% 31.1% 6.9% 11.0% 0.0% 0.5%
Health Care 14.9% 11.0% 5.4% 35.2% 16.3% 24.1% 10.1% 18.1% 22.5% 20.0% 1.7% 33.7% 0.7% 3.8% 4.4% 0.0%
Industrials 6.4% 3.9% 0.0% 13.3% 4.6% 8.8% 5.6% 0.0% 2.2% 26.4% 23.2% 0.0% 2.1% 1.2% 0.0% 2.3%
Information Technology 9.7% 8.5% 37.6% 5.7% 1.0% 1.5% 12.4% 9.9% 4.2% 1.7% 0.0% 6.8% 11.1% 2.5% 18.1% 0.0%
Materials 2.0% 8.6% 0.0% 0.0% 1.4% 0.0% 5.1% 0.0% 0.0% 0.0% 0.0% 12.5% 0.0% 0.0% 0.0% 1.3%
Telecommunication Services 11.7% 39.5% 13.3% 19.9% 4.0% 0.0% 0.0% 0.0% 0.0% 0.0% 1.7% 0.0% 28.4% 0.0% 6.3% 0.0%
Utilities 7.6% 5.6% 17.4% 51.0% 4.3% 4.8% 5.6% 0.0% 5.5% 4.0% 0.0% 0.0% 5.6% 6.8% 0.0% 0.0%
All S&P 500 Companies 10.1% 11.1% 10.9% 18.8% 8.0% 17.7% 10.7% 6.7% 8.2% 16.2% 8.6% 11.2% 5.1% 4.9% 4.7% 1.1%
Legend 0% 0%–5% 5%–15% 15%–25% 25%+

Securities Class Action Filings—2014 Midyear Assessment 17 INDUSTRY
This analysis encompasses both the large capitalization companies of the S&P 500, shown on the preceding pages, as well as smaller companies.
Filings against Consumer Non-Cyclical companies increased for the third semiannual period in a row.
KEY FINDINGS
• Healthcare, biotechnology, and pharmaceutical companies (included in the Consumer Non-Cyclical sector) together accounted for 21 percent of all filings in the first half of 2014. Within this group, the pace of filings against biotechnology companies doubled compared with the previous two semiannual periods. Conversely, healthcare companies were the subject of class actions significantly less frequently in the first half of 2014.
• Filings against companies in the Financial sector increased by one from the second half of 2013 to the first half of 2014. The Financial sector accounted for 14 percent of all filings, its highest percentage since the first half of 2011, but remained well below the historical semiannual average.
• Filings against Communications companies decreased from 14 in the second half of 2013 to five in the first half of 2014.
FIGURE 14: FILINGS BY INDUSTRY
Note: 1. Analysis excludes two filings in unknown sectors in 2013 and two filings in unknown sectors in 2014. Filings with missing sector information or infrequently used sectors may be excluded
in prior years. For more information, see Appendix 4. 2. Sectors are based on the Bloomberg Industry Classification System.
18
8
10
11
23
19
26
28
9
7
9
8
13
10
10
9
11
9
10
8
15
9
14
5
4
10
7
5
2
1
4
2
2
1
0% 10% 20% 30% 40% 50% 60% 70% 80% 90% 100%
Average1997 H1–2013 H2
2013 H1
2013 H2
2014 H1
Financial Consumer Non-Cyclical Industrial Technology Consumer Cyclical Communications Energy Basic Materials Utilities
Securities Class Action Filings—2014 Midyear Assessment 18 MEGA FILINGS
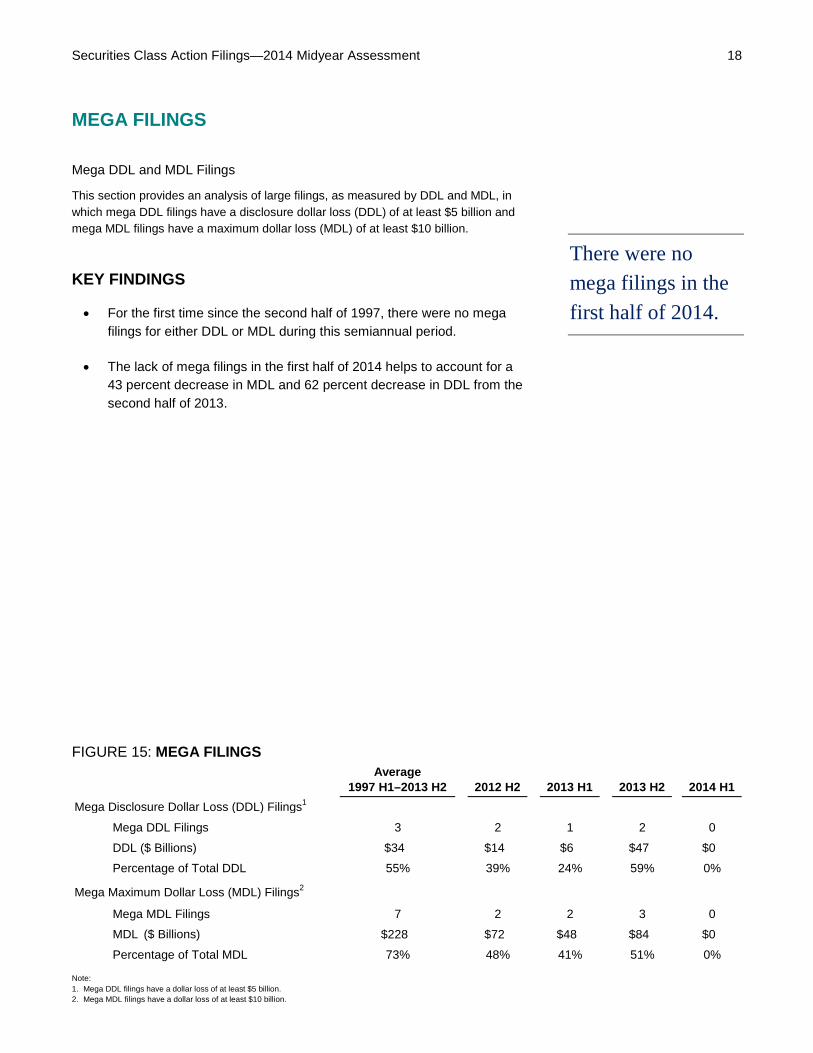
Mega DDL and MDL Filings
This section provides an analysis of large filings, as measured by DDL and MDL, in which mega DDL filings have a disclosure dollar loss (DDL) of at least $5 billion and mega MDL filings have a maximum dollar loss (MDL) of at least $10 billion.
There were no mega filings in the first half of 2014.
KEY FINDINGS
• For the first time since the second half of 1997, there were no mega filings for either DDL or MDL during this semiannual period.
• The lack of mega filings in the first half of 2014 helps to account for a 43 percent decrease in MDL and 62 percent decrease in DDL from the second half of 2013.
FIGURE 15: MEGA FILINGS
Note: 1. Mega DDL filings have a dollar loss of at least $5 billion. 2. Mega MDL filings have a dollar loss of at least $10 billion.
Average1997 H1–2013 H2 2012 H2 2013 H1 2013 H2 2014 H1
Mega Disclosure Dollar Loss (DDL) Filings1
Mega DDL Filings 3 2 1 2 0
DDL ($ Billions) $34 $14 $6 $47 $0
Percentage of Total DDL 55% 39% 24% 59% 0%
Mega Maximum Dollar Loss (MDL) Filings2
Mega MDL Filings 7 2 2 3 0
MDL ($ Billions) $228 $72 $48 $84 $0
Percentage of Total MDL 73% 48% 41% 51% 0%
Securities Class Action Filings—2014 Midyear Assessment 19 EXCHANGE
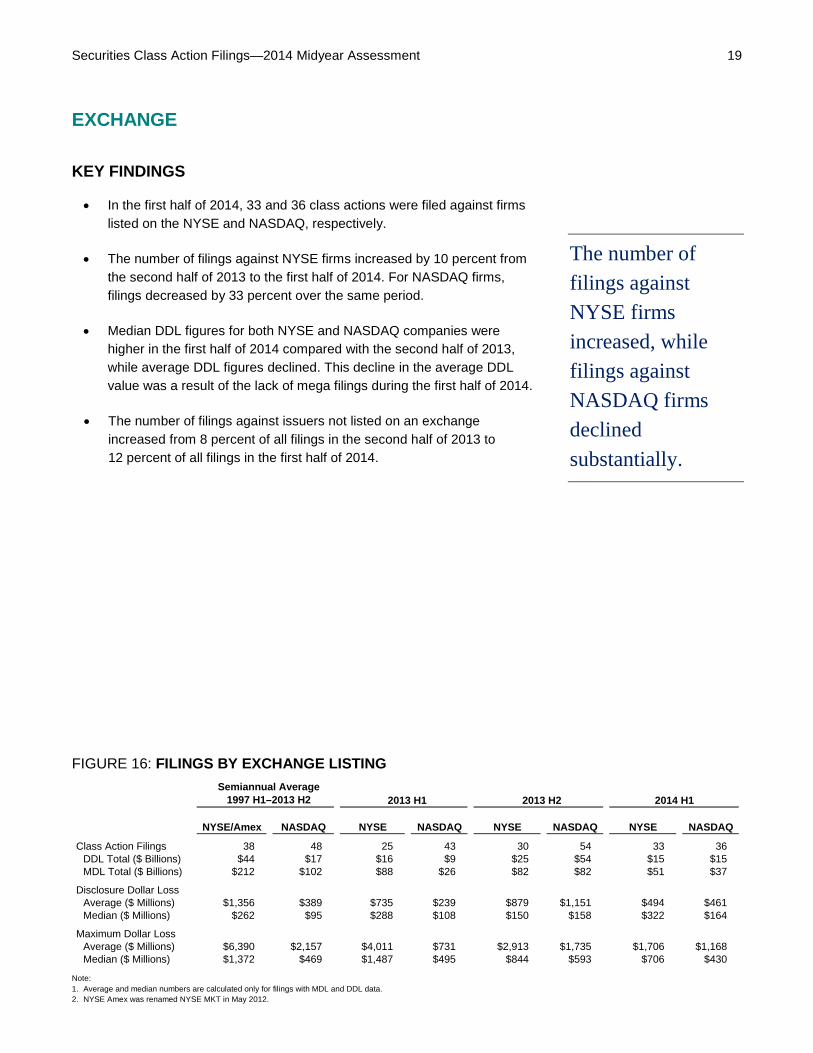
KEY FINDINGS
• In the first half of 2014, 33 and 36 class actions were filed against firms listed on the NYSE and NASDAQ, respectively.
• The number of filings against NYSE firms increased by 10 percent from the second half of 2013 to the first half of 2014. For NASDAQ firms, filings decreased by 33 percent over the same period.
• Median DDL figures for both NYSE and NASDAQ companies were higher in the first half of 2014 compared with the second half of 2013, while average DDL figures declined. This decline in the average DDL value was a result of the lack of mega filings during the first half of 2014.
• The number of filings against issuers not listed on an exchange increased from 8 percent of all filings in the second half of 2013 to 12 percent of all filings in the first half of 2014.
The number of filings against NYSE firms increased, while filings against NASDAQ firms declined substantially.
FIGURE 16: FILINGS BY EXCHANGE LISTING
Note: 1. Average and median numbers are calculated only for filings with MDL and DDL data. 2. NYSE Amex was renamed NYSE MKT in May 2012.
Semiannual Average1997 H1–2013 H2 2013 H1 2013 H2 2014 H1
NYSE/Amex NASDAQ NYSE NASDAQ NYSE NASDAQ NYSE NASDAQ
Class Action Filings 38 48 25 43 30 54 33 36DDL Total ($ Billions) $44 $17 $16 $9 $25 $54 $15 $15MDL Total ($ Billions) $212 $102 $88 $26 $82 $82 $51 $37
Disclosure Dollar Loss Average ($ Millions) $1,356 $389 $735 $239 $879 $1,151 $494 $461Median ($ Millions) $262 $95 $288 $108 $150 $158 $322 $164
Maximum Dollar LossAverage ($ Millions) $6,390 $2,157 $4,011 $731 $2,913 $1,735 $1,706 $1,168Median ($ Millions) $1,372 $469 $1,487 $495 $844 $593 $706 $430
Securities Class Action Filings—2014 Midyear Assessment 20 CIRCUIT
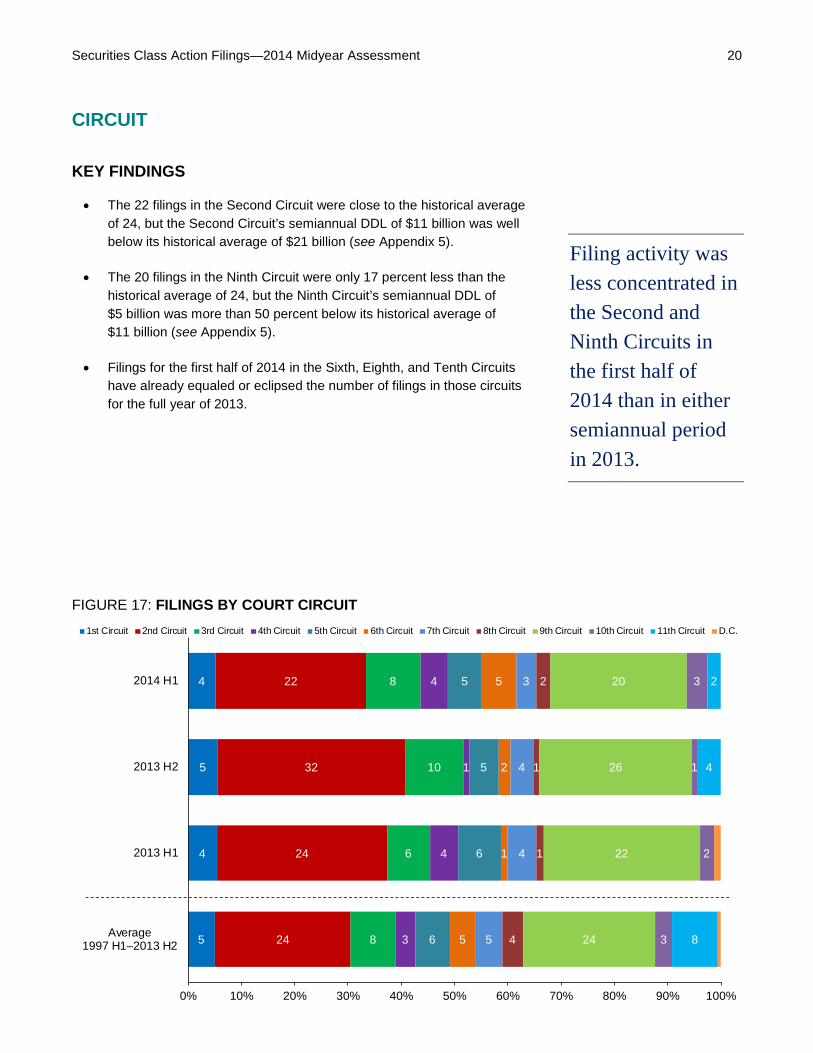
KEY FINDINGS
• The 22 filings in the Second Circuit were close to the historical average of 24, but the Second Circuit’s semiannual DDL of $11 billion was well below its historical average of $21 billion (see Appendix 5).
• The 20 filings in the Ninth Circuit were only 17 percent less than the historical average of 24, but the Ninth Circuit’s semiannual DDL of $5 billion was more than 50 percent below its historical average of $11 billion (see Appendix 5).
• Filings for the first half of 2014 in the Sixth, Eighth, and Tenth Circuits have already equaled or eclipsed the number of filings in those circuits for the full year of 2013.
Filing activity was less concentrated in the Second and Ninth Circuits in the first half of 2014 than in either semiannual period in 2013.
FIGURE 17: FILINGS BY COURT CIRCUIT
5
4
5
4
24
24
32
22
8
6
10
8
3
4
1
4
6
6
5
5
5
1
2
5
5
4
4
3
4
1
1
2
24
22
26
20
3
2
1
3
8
4
2
0% 10% 20% 30% 40% 50% 60% 70% 80% 90% 100%
Average1997 H1–2013 H2
2013 H1
2013 H2
2014 H1
1st Circuit 2nd Circuit 3rd Circuit 4th Circuit 5th Circuit 6th Circuit 7th Circuit 8th Circuit 9th Circuit 10th Circuit 11th Circuit D.C.
Securities Class Action Filings—2014 Midyear Assessment 21 NEW DEVELOPMENTS
HALLIBURTON CO. v. ERICA P. JOHN FUND
In a highly anticipated ruling, on June 23, 2014, the U.S. Supreme Court issued its opinion in Halliburton Co. v. Erica P. John Fund, 573 U.S. ___ (2014) (Halliburton II). At issue in this appeal by Halliburton was the fraud-on-the-market presumption established in Basic Inc. v. Levinson, 485 U.S. 224 (1988).
Petitioners presented two questions to the Court: (1) whether the Court should overrule or substantially modify Basic and the notion that classwide reliance derives from the fraud-on-the-market concept; and (2) whether defendants may rebut the presumption, when invoked by plaintiffs, by introducing evidence that the alleged misrepresentations did not distort the market price of the security at issue.
For a typical securities class action, Basic established that plaintiffs did not need to demonstrate that individual class members relied on any allegedly misleading statements if the market in which the security at issue traded can be shown to be “efficient”—that is, the market price reflected all publicly available information. In those circumstances, any material misrepresentations were reflected in the price of the security.
In Halliburton II, the Court declined to overturn Basic. It did find, however, that in cases where plaintiffs met their burden of proving market efficiency, defendants could rebut the presumption prior to class certification by showing direct evidence “that the alleged misrepresentations did not actually affect the stock price—that is, that it had no ‘price impact.’” It will be interesting to see if the Supreme Court’s ruling will accelerate the demand for rigorous economic analysis related to the price impact (if any) of an alleged misrepresentation, providing defendants with a possible way to truncate a case earlier.

Securities Class Action Filings—2014 Midyear Assessment 22 NEW DEVELOPMENTS continued
HIGH-FREQUENCY TRADING LITIGATION
On April 18, 2014, in the U.S. District Court for the Southern District of New York, the City of Providence, Rhode Island, filed suit against BATS Global Markets Inc. and others—the first of several class actions related to high-frequency trading (HFT). Defendants in the lawsuit include firms that specialize in HFT, as well as numerous U.S. securities exchanges and brokerage firms.
Plaintiffs’ counsel seeks to represent a large class defined in the complaint as “all public investors who purchased and/or sold shares of stock on a U.S.-based exchange or alternate trading venue.”3 The purported class period covers April 18, 2009, through the date of the first complaint, April 18, 2014. Plaintiffs allege violations of Section 10(b) of the Securities Exchange Act of 1934 and Rule 10b-5, as well as other counts, against combinations of the exchange defendants, HFT firms, and brokerage firms. The related class action filings also alleging violations of federal securities laws have now been consolidated.
In addition to lawsuits alleging violations of federal securities laws, claims have been made in other jurisdictions against some of the defendants in the securities lawsuits.
A flurry of lawsuits related to high-frequency trading followed the publicity and release of Michael Lewis’s book Flash Boys.
Securities Class Action Filings—2014 Midyear Assessment 23 GLOSSARY
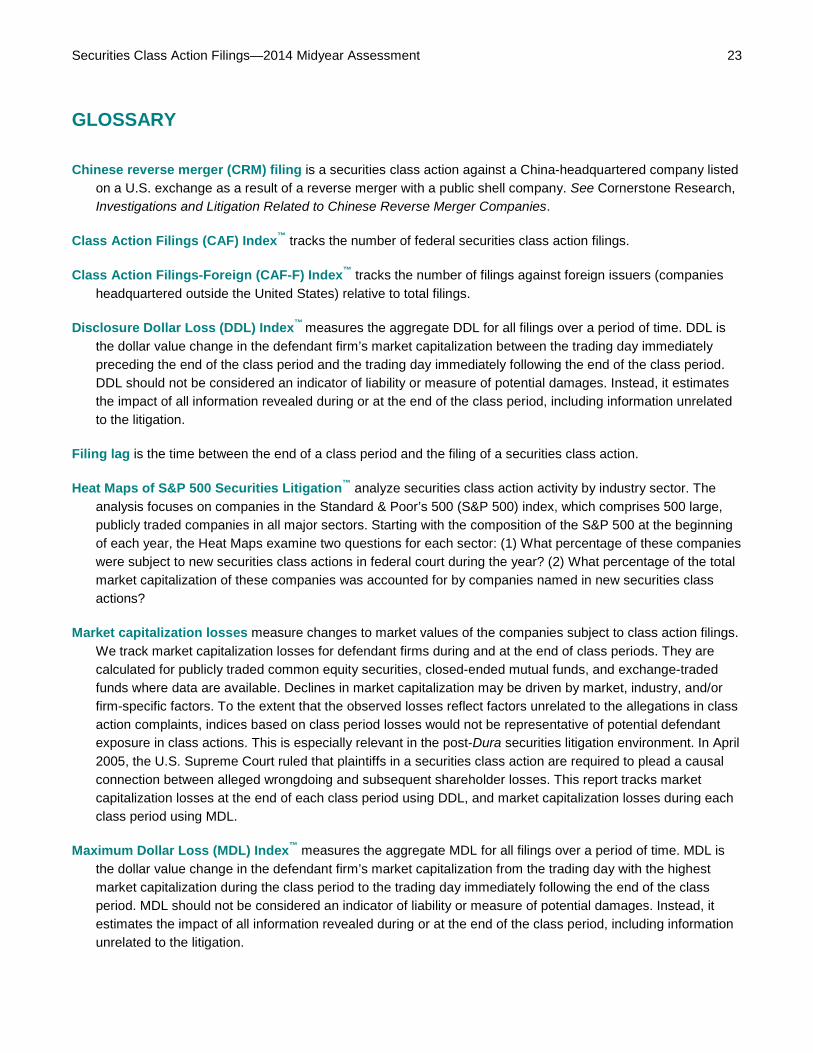
Chinese reverse merger (CRM) filing is a securities class action against a China-headquartered company listed on a U.S. exchange as a result of a reverse merger with a public shell company. See Cornerstone Research, Investigations and Litigation Related to Chinese Reverse Merger Companies.
Class Action Filings (CAF) Index™ tracks the number of federal securities class action filings.
Class Action Filings-Foreign (CAF-F) Index™ tracks the number of filings against foreign issuers (companies headquartered outside the United States) relative to total filings.
Disclosure Dollar Loss (DDL) Index™ measures the aggregate DDL for all filings over a period of time. DDL is the dollar value change in the defendant firm’s market capitalization between the trading day immediately preceding the end of the class period and the trading day immediately following the end of the class period. DDL should not be considered an indicator of liability or measure of potential damages. Instead, it estimates the impact of all information revealed during or at the end of the class period, including information unrelated to the litigation.
Filing lag is the time between the end of a class period and the filing of a securities class action.
Heat Maps of S&P 500 Securities Litigation™ analyze securities class action activity by industry sector. The analysis focuses on companies in the Standard & Poor’s 500 (S&P 500) index, which comprises 500 large, publicly traded companies in all major sectors. Starting with the composition of the S&P 500 at the beginning of each year, the Heat Maps examine two questions for each sector: (1) What percentage of these companies were subject to new securities class actions in federal court during the year? (2) What percentage of the total market capitalization of these companies was accounted for by companies named in new securities class actions?
Market capitalization losses measure changes to market values of the companies subject to class action filings. We track market capitalization losses for defendant firms during and at the end of class periods. They are calculated for publicly traded common equity securities, closed-ended mutual funds, and exchange-traded funds where data are available. Declines in market capitalization may be driven by market, industry, and/or firm-specific factors. To the extent that the observed losses reflect factors unrelated to the allegations in class action complaints, indices based on class period losses would not be representative of potential defendant exposure in class actions. This is especially relevant in the post-Dura securities litigation environment. In April 2005, the U.S. Supreme Court ruled that plaintiffs in a securities class action are required to plead a causal connection between alleged wrongdoing and subsequent shareholder losses. This report tracks market capitalization losses at the end of each class period using DDL, and market capitalization losses during each class period using MDL.
Maximum Dollar Loss (MDL) Index™ measures the aggregate MDL for all filings over a period of time. MDL is the dollar value change in the defendant firm’s market capitalization from the trading day with the highest market capitalization during the class period to the trading day immediately following the end of the class period. MDL should not be considered an indicator of liability or measure of potential damages. Instead, it estimates the impact of all information revealed during or at the end of the class period, including information unrelated to the litigation.

Securities Class Action Filings—2014 Midyear Assessment 24 GLOSSARY continued
Mega filings include mega DDL filings, securities class action filings with a DDL of at least $5 billion; and mega MDL filings, securities class action filings with an MDL of at least $10 billion.
Merger and acquisition (M&A) filing is a securities class action that has Section 14 claims, but no Rule 10b-5, Section 11, or Section 12(2) claims, and involves a merger and acquisition transaction.
Securities Class Action Clearinghouse is an authoritative source of data and analysis on the financial and economic characteristics of federal securities fraud class action litigation, cosponsored by Cornerstone Research and Stanford Law School.

Securities Class Action Filings—2014 Midyear Assessment 25 APPENDICES
APPENDIX 1: FILINGS COMPARISON
Note: Average and median numbers are calculated only for filings with MDL and DDL data.
APPENDIX 2: SURVIVAL RATES OF COMPANIES AFTER IPO
Semiannual Average1997 H1–2013 H2 2013 H1 2013 H2 2014 H1
Class Action Filings 95 75 91 78
DDL Total ($ Billions) $62 $25 $79 $30MDL Total ($ Billions) $315 $115 $163 $93
Disclosure Dollar LossAverage ($ Millions) $794 $407 $1,009 $446Median ($ Millions) $122 $163 $134 $189Median DDL % Decline 22.93% 20.25% 21.80% 15.92%
Maximum Dollar LossAverage ($ Millions) $4,055 $1,887 $2,096 $1,364Median ($ Millions) $657 $531 $566 $541
Percent of Companies Surviving to End of Year Years after IPO Early Period: 1996–2000 Pre-Crisis: 2001–2008 Post-Crisis: 2009–2013
1 97.3% 98.6% 98.6%2 85.2% 92.3% 95.9%3 70.9% 81.8% 92.4%4 59.7% 74.2% 90.2%5 52.0% 66.7% 89.8%6 45.7% 61.8%7 41.2% 56.6%8 37.7% 53.8%9 34.7% 52.1%10 31.2% 50.4%11 27.8% 50.0%
Securities Class Action Filings—2014 Midyear Assessment 26 APPENDICES continued
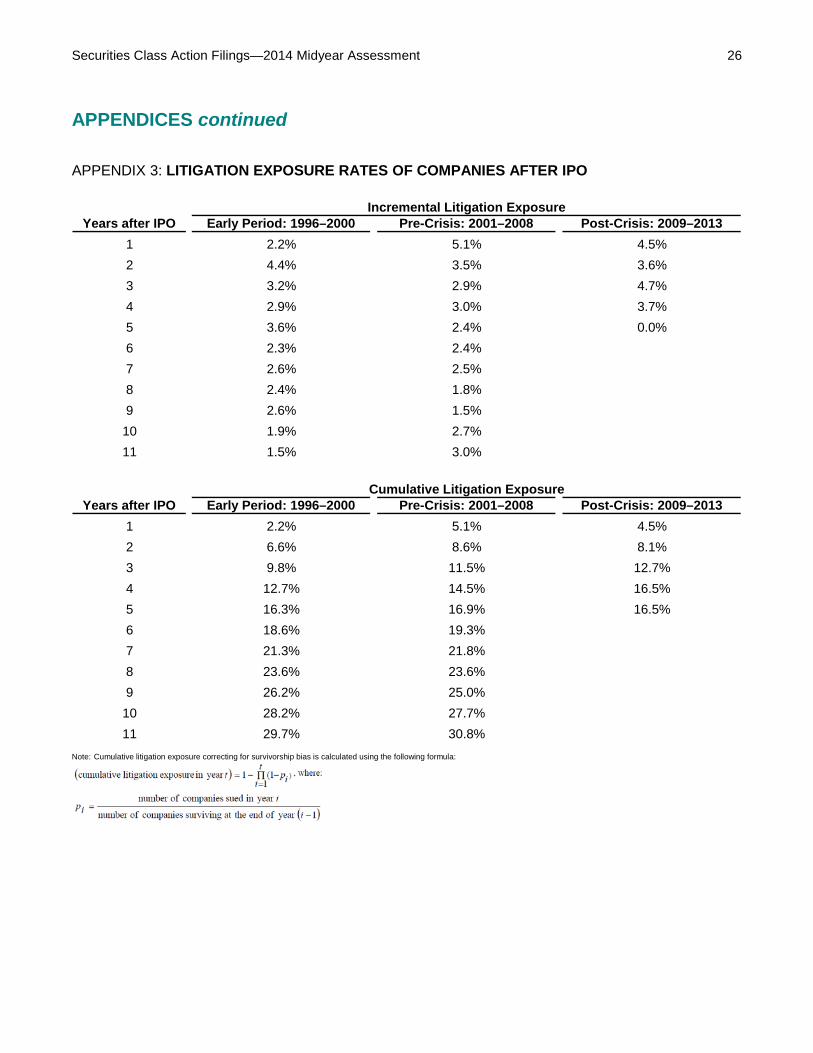
APPENDIX 3: LITIGATION EXPOSURE RATES OF COMPANIES AFTER IPO
Note: Cumulative litigation exposure correcting for survivorship bias is calculated using the following formula:
Incremental Litigation Exposure Years after IPO Early Period: 1996–2000 Pre-Crisis: 2001–2008 Post-Crisis: 2009–2013
1 2.2% 5.1% 4.5%2 4.4% 3.5% 3.6%3 3.2% 2.9% 4.7%4 2.9% 3.0% 3.7%5 3.6% 2.4% 0.0%6 2.3% 2.4%7 2.6% 2.5%8 2.4% 1.8%9 2.6% 1.5%10 1.9% 2.7%11 1.5% 3.0%
Cumulative Litigation ExposureYears after IPO Early Period: 1996–2000 Pre-Crisis: 2001–2008 Post-Crisis: 2009–2013
1 2.2% 5.1% 4.5%2 6.6% 8.6% 8.1%3 9.8% 11.5% 12.7%4 12.7% 14.5% 16.5%5 16.3% 16.9% 16.5%6 18.6% 19.3%7 21.3% 21.8%8 23.6% 23.6%9 26.2% 25.0%10 28.2% 27.7%11 29.7% 30.8%

Securities Class Action Filings—2014 Midyear Assessment 27 APPENDICES continued
APPENDIX 4: FILINGS BY INDUSTRY (Dollars in Billions)
Note: 1. Numbers may not add due to rounding. 2. Filings with missing sector information or infrequently used sectors may be excluded in prior years.
APPENDIX 5: FILINGS BY COURT CIRCUIT (Dollars in Billions)
Note: Numbers may not add due to rounding.
Class Action Filings Disclosure Dollar Loss Maximum Dollar Loss
IndustryAverage
1997 H1–2013 H2 2013 H1 2013 H2 2014 H1Average
1997 H1–2013 H2 2013 H1 2013 H2 2014 H1Average
1997 H1–2013 H2 2013 H1 2013 H2 2014 H1
Financial 18 8 10 11 $10 $0 $1 $2 $58 $1 $2 $5
Consumer Non-Cyclical 23 19 26 28 $17 $5 $14 $12 $64 $28 $28 $32
Industrial 9 7 9 8 $7 $1 $1 $2 $20 $4 $5 $8
Technology 13 10 10 9 $9 $3 $49 $7 $41 $10 $84 $17
Consumer Cyclical 11 9 10 8 $4 $3 $9 $6 $27 $12 $19 $11
Communications 15 9 14 5 $12 $9 $4 $0 $89 $13 $9 $8
Energy 4 10 7 5 $2 $2 $0 $1 $10 $10 $3 $2
Basic Materials 2 1 4 2 $1 $0 $0 $1 $6 $36 $14 $9
Utilities 2 1 0 0 $1 $0 $0 $0 $5 $1 $0 $0
Unknown/Unclassified - 1 1 2 - - - - - - - -Total 94 75 91 78 $62 $25 $79 $30 $319 $115 $163 $93
Class Action Filings Disclosure Dollar Loss Maximum Dollar Loss
CircuitAverage
1997 H1–2013 H2 2013 H1 2013 H2 2014 H1Average
1997 H1–2013 H2 2013 H1 2013 H2 2014 H1Average
1997 H1–2013 H2 2013 H1 2013 H2 2014 H1
1st 5 4 5 4 $4 $1 $39 $1 $11 $2 $44 $3
2nd 24 24 32 22 $21 $10 $21 $11 $115 $63 $74 $26
3rd 8 6 10 8 $9 $1 $2 $2 $31 $1 $7 $3
4th 3 4 1 4 $1 $2 $0 $1 $7 $4 $0 $9
5th 6 6 5 5 $4 $0 $1 $1 $19 $2 $4 $4
6th 5 1 2 5 $4 $0 $0 $5 $14 $1 $0 $14
7th 5 4 4 3 $3 $1 $0 $1 $13 $7 $1 $1
8th 4 1 1 2 $2 $1 $0 $1 $7 $11 $0 $4
9th 24 22 26 20 $11 $8 $13 $5 $76 $23 $28 $21
10th 3 2 1 3 $1 $1 $3 $1 $7 $1 $5 $1
11th 8 0 4 2 $3 $0 $0 $1 $12 $0 $1 $6
D.C. 1 1 0 0 $0 $0 $0 $0 $2 $0 $0 $0
Total 95 75 91 78 $62 $25 $79 $30 $315 $115 $163 $93

Securities Class Action Filings—2014 Midyear Assessment 28 RESEARCH SAMPLE
• The Stanford Law School Securities Class Action Clearinghouse, in collaboration with Cornerstone Research, has identified 3,809 federal securities class action filings between January 1, 1996, and June 30, 2014 (securities.stanford.edu).
• The sample used in this report is referred to as the “Classic Filings” sample and excludes IPO Allocation, Analyst, and Mutual Fund filings (313, 68, and 25 filings, respectively).
• Multiple filings related to the same allegations against the same defendant(s) are consolidated in the database through a unique record indexed to the first identified complaint.
ENDNOTES 1 Jay R. Ritter, “Founding Dates of IPOs from 1975–April 11, 2014,” updated April 14, 2014,
http://bear.warrington.ufl.edu/ritter/FoundingDates.htm. 2 IPOs in the post-crisis group have, so far, had distinctly higher early-year survival rates than earlier IPOs
possibly because these companies tend to be larger (see Cornerstone Research, Securities Class Action Filings—2013 Year in Review).
3 Complaint for Violation of the Federal Securities Laws, City of Providence v. BATS Global Markets Inc. et al., No. 14-cv-2811 (S.D.N.Y. Apr. 18, 2014).

Boston617.927.3000
Chicago312.345.7300
Los Angeles213.553.2500
Menlo Park650.853.1660
New York212.605.5000
San Francisco415.229.8100
Washington202.912.8900
www.cornerstone.com
The authors request that you reference Cornerstone Research and the Stanford Law School Securities Class Action Clearinghouse in any reprint of the information or figures included in this study.
Please direct any questions to:
Alexander Aganin 650.853.1660 or [email protected]
© 2014 by Cornerstone Research. All rights reserved. Cornerstone Research is a registered service mark of Cornerstone Research, Inc. C and design is a registered trademark of Cornerstone Research, Inc.


![Securities Class Action Settlements [Empirical Analysis]](https://img.dokumen.tips/doc/110x75/617d114ccaed0b527b06fee6/securities-class-action-settlements-empirical-analysis.jpg)


