Embed Size (px)
Citation preview

SECURITIES AND EXCHANGE COMMISSIONWashington, D.C. 20549
FORM 6-KREPORT OF FOREIGN PRIVATE ISSUER
Pursuant to Rule 13a-16 or 15d-16 of theSecurities Exchange Act of 1934
For the month of July 2015
Commission File Number: 001-36744
Cnova N.V.(Translation of registrant’s name into English)
WTC Schiphol AirportTower D, 7 Floor
Schiphol Boulevard 2731118 BH SchipholThe Netherlands
(Address of principal executive offices)
Indicate by check mark whether the registrant files or will file annual reports under cover Form 20-F or Form 40-F.
Form 20-F Form 40-F
Indicate by check mark if the registrant is submitting the Form 6-K in paper as permitted by Regulation S-T Rule 101(b)(1):
Indicate by check mark if the registrant is submitting the Form 6-K in paper as permitted by Regulation S-T Rule 101(b)(7):
th

EXPLANATORY NOTE
On July 22, 2015, Cnova N.V. issued a press release titled “Cnova Publishes its Semi-Annual Report.” A copy of this press release and a copy of the Cnova N.V. Semi-Annual Report for the Six Months Ended June 30, 2015 are furnished herewith as Exhibits 99.1 and 99.2, respectively.
2

SIGNATURE
Pursuant to the requirements of the Securities Exchange Act of 1934, the registrant has duly caused this report to be signed on its behalf by the undersigned, thereunto duly authorized.
3
CNOVA N.V.
Date: July 22, 2015 By: /s/ VITOR FAGÁ DE ALMEIDAName: Vitor Fagá de AlmeidaTitle: Executive Vice President and Chief Financial Officer(Principal Financial and Accounting Officer)

EXHIBIT INDEX
4
Exhibit Description
99.1 Press release dated July 22, 2015 titled “Cnova Publishes its Semi-Annual Report”
99.2 Cnova N.V. Semi-Annual Report for the Six Months Ended June 30, 2015, dated July 22, 2015

Exhibit 99.1
July 22, 2015
Cnova publishes its semi-annual report
AMSTERDAM, July 22, 2015 22:01 — Cnova N.V. (Nasdaq & Euronext in Paris: CNV) (“Cnova” or the “Company”) today published its Dutch semi-annual report for the first half year of 2015 as filed with the Dutch Authority for the Financial Markets (Autoriteit Financiële Markten) and, on a Form 6-K, with the U.S. Securities and Exchange Commission (“SEC”) on that same date . These documents are available on www.cnova.com for a period of five years after publication. The Form 6-K can also be downloaded from the SEC’s website (www.sec.org).
***
Cnova Investor Relations Contact:
G. Christopher Welton
Tel: +31 20 795 06 71
Media contact:Cnova N.V.
Head of Communication: +33 6 80 39 50 [email protected]
***
About Cnova N.V.
Cnova N.V., one of the world’s largest e-Commerce companies, serves 15 million active customers via state-of-the-art e-tail websites: Cdiscount in France, Brazil, Colombia, Ecuador, Panama, Thailand, Vietnam, Ivory Coast, Senegal, Cameroon, Burkina Faso and Belgium; Extra.com.br, Pontofrio.com and Casasbahia.com.br in Brazil. Cnova N.V.’s product offering of more than 21 million items provides its clients with a wide variety of very competitively priced goods, several fast and customer-convenient delivery options as well as practical payment solutions. Cnova N.V. is part of Groupe Casino, a global diversified retailer. Cnova N.V.’s news releases are available at www.cnova.com/investor-relations.aspx. Information available on, or accessible through, the sites referenced above is not part of this press release.
This press release contains regulated information (gereglementeerde informatie) within the meaning of the Dutch Financial Supervision Act (Wet op het financieel toezicht) which must be made publicly available pursuant to Dutch and French law. This press release is intended for information purposes only.
Forward-Looking Statements
In addition to historical information, this press release contains forward-looking statements within the meaning of the U.S. Private Securities Litigation Reform Act of 1995, Section 27A of the U.S. Securities Act of 1933, and Section 21E of the U.S. Securities Exchange Act of 1934. Such forward-looking statements may include projections regarding Cnova’s future performance and, in some cases, may be identified by words like “anticipate,” “assume,” “believe,” “continue,” “could,” “estimate,” “expect,” “intend,”“may,” “plan,” “potential,” “predict,” “project,” “future,” “will,” “seek” and similar terms or phrases. The forward-looking statements contained in this press release are based on management’s current expectations, which are subject to uncertainty, risks and changes in circumstances that are difficult to predict and many of which are outside of Cnova’s control. Important factors that could cause Cnova’s actual results to differ materially from those indicated in the forward-looking statements include, among others: the ability to grow its customer base; the ability to maintain and enhance its brands and reputation; the ability to manage the growth of Cnova effectively; changes to technologies used by Cnova; changes in global, national, regional or local economic, business, competitive, market or regulatory conditions; and other factors discussed under the heading “Risk Factors” in the U.S. Annual Report on the Form 20-F for the year ended December 31, 2014 filed with the U.S. Securities and Exchange Commission on March 31, 2015 and other documents filed with or furnished to the U.S. Securities and Exchange Commission. Any forward-looking statement made in this press release speaks only as of the date hereof. Factors or events that could cause Cnova’s actual results to differ from the statements contained herein may emerge from time to time, and it is not possible for Cnova to predict all of them. Except as required by law, Cnova undertakes no obligation to publicly update any forward-looking statements, whether as a result of new information, future developments or otherwise.
1

Exhibit 99.2
SEMI-ANNUAL REPORT AND FINANCIAL STATEMENTS OF CNOVA N.V.FOR THE 6-MONTH PERIOD ENDED JUNE 30, 2015
IN ACCORDANCE WITH BOOK 2, TITLE 9 OF THE DUTCH CIVIL CODE

INDEX TO SEMI-ANNUAL REPORT
Table of Contents
F-2
Index to Semi-Annual Report 2
INTRODUCTION 3
1. Directors’ Report 5
2. Risk Factors 5
3. Financial Overview 5
4. Board of Directors 16
5. Related Party Transactions 16
6. Responsibility Statement and In Control Statement 18
OTHER INFORMATION 19
Independent auditor’s report 19
Unaudited Consolidated financial Statements 20

INTRODUCTION
In this semi-annual report, the terms “Cnova,” “we,” “us,” “our” and “the Company” refer to Cnova N.V. and, where appropriate, its subsidiaries. Any reference to “our brands” or “our domain names” in this semi-annual report includes the brands “Cdiscount,” “Extra,” “Casas Bahia,” and “Ponto Frio” and related domain names, which are either registered in the names of our Parent Companies or in the name of Cdiscount, Via Varejo or our Parent Companies as more fully described herein. Additionally, unless the context indicates otherwise, the following definitions apply throughout this semi-annual report:
F-3
Name Definition
Big C Supercenter Big C Supercenter plc and its subsidiaries
Casino Casino, Guichard-Perrachon S.A.
Casino Group Casino, Guichard-Perrachon S.A. and its subsidiaries and, where appropriate, the controlling holding companies of Casino, including Rallye S.A. and Euris S.A.S. which are ultimately controlled by our chairman Jean-Charles Naouri
CBD Companhia Brasileira de Distribuiç o and, where appropriate, its subsidiaries (together, commonly known as Grupo P o de Açúcar, or GPA)
Cdiscount Cdiscount S.A. and, where appropriate, its subsidiaries
Cdiscount Group Cdiscount Group S.A.S. (formerly Casino Entreprise S.A.S.) and, where appropriate, its subsidiaries
Cnova Brazil or Nova OpCo CNova Comércio Eletrônico S.A., a wholly owned subsidiary of Cnova owning the Brazilian non-food eCommerce businesses of CBD and Via Varejo following the completion of the Reorganization
Dutch HoldCo Marneylectro B.V., a wholly owned subsidiary of Lux HoldCo, organized under Dutch law
Euris Euris S.A.S.
Éxito Almacenes Éxito S.A. and, where appropriate, its subsidiaries
Founding Shareholders Casino, CBD, Via Varejo S.A., Éxito and certain current and former managers of Nova Pontocom. The interests of CBD, Via Varejo and the managers of Nova Pontocom in Cnova are held indirectly through Nova HoldCo, Lux HoldCo and/or Dutch HoldCo
Lux HoldCo Marneylectro S.à r.l., a company organized under Luxembourg law and whose entire issued share capital is held by Nova HoldCo, CBD and Via Varejo
Nova HoldCo Nova Pontocom Comércio Eletrônico S.A., following the completion of the Reorganization (as defined in the Dutch Annual Report (defined hereafter)
Nova Pontocom Nova Pontocom Comércio Eletrônico S.A. and, where appropriate, its subsidiaries, prior to completion of the Reorganization
Parent Companies Big C Supercenter, Casino, CBD, Éxito and Via Varejo, each of which is an affiliate of Cnova

We also have a number of other registered trademarks, service marks and pending applications relating to our brands. Solely for convenience, trademarks and trade names referred to in this semi-annual report may appear without the “®” or “™” symbols, but such references are not intended to indicate, in any way, that we will not assert, to the fullest extent possible under applicable law, our rights or the rights of the applicable licensor to these trademarks and trade names. Except for the trademarks and domain names licensed to us by our indirect shareholders CBD and Via Varejo, we do not intend our use or display of other companies’ trade names, trademarks or service marks to imply a relationship with, or endorsement or sponsorship of us by, any other companies. Each trademark, trade name or service mark of any other company appearing in this semi-annual report is the property of its respective holder.
This semi-annual report includes other statistical, market and industry data and forecasts which we obtained from publicly available information and independent industry publications and reports that we believe to be reliable sources. These publicly available industry publications and reports generally state that they obtain their information from sources that they believe to be reliable, but they do not guarantee the accuracy or completeness of the information. Although we believe that these sources are reliable, we have not independently verified the information contained in such publications. Certain estimates and forecasts involve uncertainties and risks and are subject to change based on various factors, including those discussed under “4 Risk Management and Risk Factors” in this annual report.
Forward-Looking Statements
In addition to historical information, this semi-annual report contains forward-looking statements within the meaning of the U.S. Private Securities Litigation Reform Act of 1995, Section 27A of the U.S. Securities Act of 1933, and Section 21E of the U.S. Securities Exchange Act of 1934. Such forward-looking statements may include projections regarding Cnova’s future performance and, in some cases, may be identified by words like “anticipate,” “assume,” “believe,” “continue,” “could,” “estimate,” “expect,”“intend,” “may,” “plan,” “potential,” “predict,” “project,” “future,” “will,” “seek” and similar terms or phrases. The forward-looking statements contained in this semi-annual report are based on management’s current expectations, which are subject to uncertainty, risks and changes in circumstances that are difficult to predict and many of which are outside of Cnova’s control. Important factors that could cause Cnova’s actual results to differ materially from those indicated in the forward-looking statements include, among others: the ability to grow its customer base; the ability to maintain and enhance its brands and reputation; the ability to manage the growth of Cnova effectively; changes to technologies used by Cnova; changes in global, national, regional or local economic, business, competitive, market or regulatory conditions; and other factors discussed under the heading “Risk Factors” in the U.S. Annual Report on Form 20-F for the year ended December 31, 2014 filed with the U.S. Securities and Exchange Commission on March 31, 2015 and other documents filed with or furnished to the U.S. Securities and Exchange Commission. Any forward-looking statement made in this semi-annual report speaks only as of the date hereof. Factors or events that could cause Cnova’s actual results to differ from the statements contained herein may emerge from time to time, and it is not possible for Cnova to predict all of them. Except as required by law, Cnova undertakes no obligation to publicly update any forward-looking statements, whether as a result of new information, future developments or otherwise.
F-4
Rallye Rallye S.A. and, where appropriate, its subsidiaries
Via Varejo Via Varejo S.A. and, where appropriate, its subsidiaries
Voting Depository Stichting Cnova Special Voting Shares

1. DIRECTORS’ REPORT
We refer to the ‘Annual Report and Financial Statements of Cnova N.V. for the fiscal year ended December 31, 2014 in accordance with book 2, title 9 of the Dutch Civil Code’, as submitted to the United States Securities and Exchange Commission on April 8, 2015 (the “Dutch Annual Report”). In the Dutch Annual Report, an extensive Directors Report was given, setting forth the main characteristics of the Company’s business. We refer to such Directors’ Report, which report should be read in conjunction with this semi-annual Report.
In clause 2.1.2 of the Dutch Annual Report, we announced that we intended to, among others, expand into other markets in Europe, Latin America, Asia and Africa. Since the filing of the Dutch Annual Report, the Company, through its subsidiary Cdiscount, expanded into the Burkina Faso and Mali markets.
2. RISK FACTORS
Chapter 4 of the Dutch Annual Report describes the risk factors that might be or become applicable to the Company. We refer to this Chapter 4 of the Dutch Annual Report, which report should be read in conjunction with this semi-Annual Report.
3. FINANCIAL OVERVIEW
3.1 Selected Financial Data
The following tables set forth our selected consolidated financial data. The consolidated income statement data for the 6-month periods ended June 30, 2014 and 2015 and the consolidated balance sheet data as of December 31, 2014 and June 30, 2015 are derived from our unaudited interim condensed consolidated financial statements, included elsewhere in this semi-annual report.
The selected consolidated historical financial information should be read in conjunction with “3.2 Operating and Financial Review and Prospects,” our financial statements and the accompanying notes included elsewhere in this semi-annual report as well as our 2014 annual report. Our financial statements have been prepared in accordance with International Financial Reporting Standards (“IFRS”) as issued by the International Accounting Standards Board (“IASB”) and have not been audited by Ernst & Young Audit, an independent registered public accounting firm.
F-5

The share capital of Cnova is composed of 441,297,846 ordinary shares as of June 30, 2015, which include 25,567 shares conditionally issued to independent board members on December 8, 2014.
F-6
June June€ thousands 30, 2014 30, 2015Net sales 1,533,261 1,752,158Operating expensesCost of sales (1,330,332) (1,531,392)Fulfillment (103,887) (143,552)Marketing (31,779) (40,690)Technology and content (39,037) (49,686)General and administrative (26,892) (38,539)Operating profit (loss) before restructuring, litigation, initial public
offering expenses, gain / (loss) from disposal of non-current assets and impairment of assets 1,334 (51,701)
Restructuring (8,876) (11,677)Litigation (410) (1,396)Initial public offering expenses (4,800) (3,812)Gain / (loss) from disposal of non-current assets (23) (533)Impairment of assets — (6,477)Operating profit (loss) (12,776) (75,595)Financial income 3,238 22,500Financial expense (35,539) (42,686)Profit (loss) before tax (45,077) (95,781)Income tax gain (expense) 6,550 14,957Share of losses of associates (1,418) —Net loss for the period (39,945) (80,824)Attributable to equity holders of Cnova (39,473) (73,773)Attributable to non-controlling interests (472) (7,051)
December 31,2014
June 30, 2015(Unaudited)
(€ thousands) (€ thousands)Consolidated Balance Sheet data:Cash and cash equivalents 573,321 412,331Trade receivables, net 139,307 139,981Inventories, net 417,164 466,664Total assets 2,161,459 1,969,692Trade payables 1,296,013 1,012,337Financial debt 104,602 376,066Total consolidated equity 584,291 458,561
(1) Gross margin is a non-GAAP financial measure that we calculate as net sales minus cost of sales.
(2) Gross margin post-marketing expenses is a non-GAAP financial measure that we calculate as gross margin minus marketing expenses.
(3) Adjusted EBITDA is a non-GAAP financial measure that we calculate as operating profit (loss) before restructuring, initial public offering expenses, litigation, gain/(loss) from disposal of non-current assets and impairment of assets and before depreciation and amortization expense and share-based payments.
(4) Free cash flow is a non-GAAP financial measure that we calculate as net cash from operating activities as presented in our cash flow statement less capital expenditures (purchase of property and equipment and intangible assets) and less the financial expense paid in relation to factoring activities.
(5) Net financial debt/(Excess of cash over financial debt) is a non-GAAP financial measure that we calculate as financial debt less: (i) cash and cash equivalents and (ii) the current account provided by Cdiscount to Casino.
(1) Adjusted EBITDA excluding expansion to new countries is a non-GAAP financial measure that we calculate as Adjusted EBITDA excluding the adjusted EBITDA related to countries with operations starting after January 1, 2014.
(2) Operating Profit Before Other Expenses And Excluding Expansion To New Countries is a non-GAAP financial measure that we calculate as operating profit (loss) before restructuring, initial public offering expenses, litigation, gain/(loss) from disposal of non-current assets and impairment of assets and excluding the impact related to countries with operations starting after January 1, 2014
(3) Operating Profit Before Other Expenses And Net Of Factoring Costs Excluding Expansion To New Countries is a non-GAAP financial measure that we calculate as Operating profit before other expenses and net of factoring costs excluding expansion to new countries and excluding the factoring costs incurred by the Company in discounting sales receivable.
(4) Adjusted Net Profit (loss) (attributable to equity holders of Cnova) is a non-GAAP financial measure that we calculate as net profit/(loss) attributable to equity holders of Cnova before restructuring, initial public offering expenses, litigation, gain/(loss) from disposal of non current assets and impairment of assets and the related tax impacts.
(5) Adjusted EPS is a non-GAAP financial measure that we calculate as Adjusted Net Profit (loss) (attributable to equity holders of Cnova) divided by the weighted average number of outstanding ordinary shares of Cnova during the applicable period.
F-7
€ thousands June 30, 2014 June 30, 2015Other Financial Data:Gross margin (1) 202,929 220,766Gross margin post-marketing expenses (2) 171,150 180,076Adjusted EBITDA (3) 14,868 (31,364)Free cash flow (4) (277,058) (465,109)Net financial debt/(Excess of cash over financial debt) (5) 8,782 (36,265)
€ thousands (except Adjusted EPS) June 30, 2014 June 30, 2015New Other Financial Data:Adjusted EBITDA excluding expansion to new countries (1) 14,868 (17,567)Operating profit before other expenses and excluding expansion to new
countries (2) 1,334 (37,268)Operating profit before other expenses and net of factoring costs excluding
expansion to new countries (3) (24,947) (71,028)Adjusted Net Profit (Loss) attributable to equity holders of Cnova (4) (28,383) (52,917)Adjusted EPS (€)(5) (0.06) (0.12)
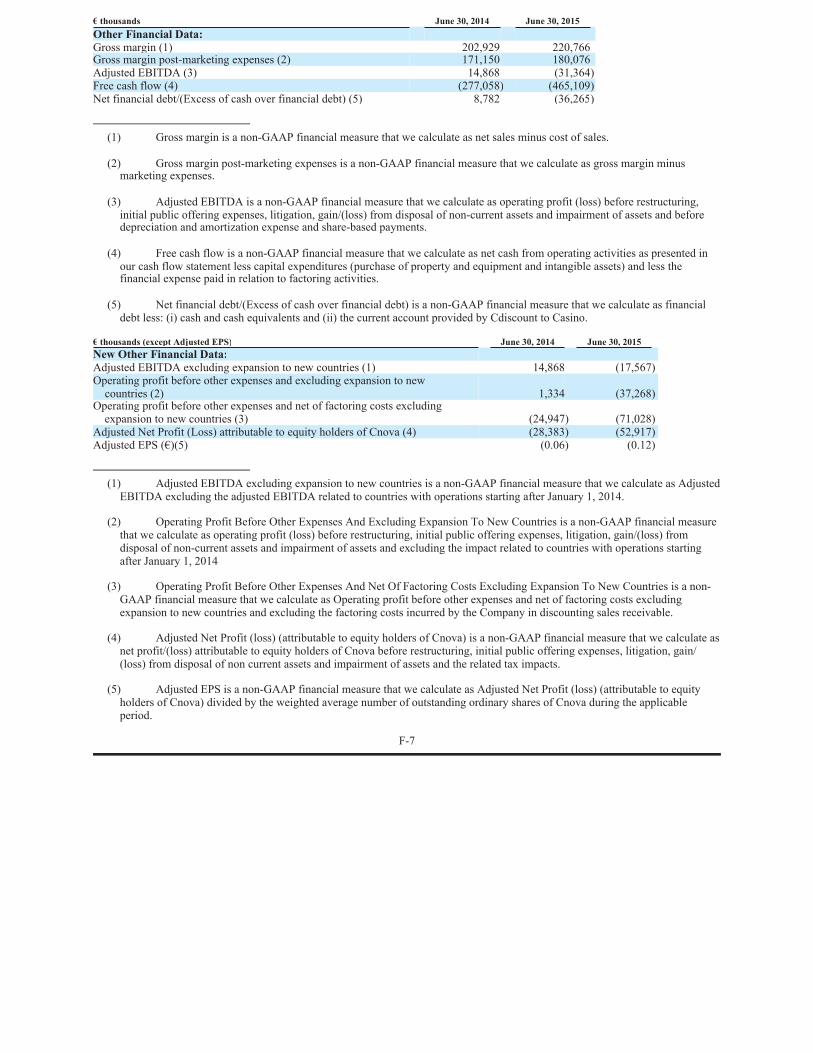
(1) GMV, GMV Cdiscount and GMV Cnova Brazil in millions. GMV, GMV Cdiscount and GMV Cnova Brazil currently include the GMV of fulfilled orders with respect to our direct sales business and GMV of approved and sent orders with respect to our marketplaces.
Exchange Rates
All references in this annual report to “U.S. dollars” or “$” are to the legal currency of the United States, all references to “€” or “euro” are to the currency introduced at the start of the third stage of the European economic and monetary union pursuant to the treaty establishing the European Community, as amended, and all references to the “real” or “R$” are to Brazilian reals, the official currency of the Federative Republic of Brazil (“Brazil”).
The tables below show the period end, average, high and low exchange rates of U.S. dollars per euro for the periods shown. Average rates are computed by using the noon buying rate of the Federal Reserve Bank of New York for the euro on each business day during the relevant year indicated or each business day during the relevant month indicated.
The noon buying rate of the Federal Reserve Bank of New York for the euro on July 15, 2015 was €1.00 = $1.0975.
The tables below show the period end, average, high and low exchange rates of euros per real for the periods shown. Average rates are computed by using the foreign exchange reference rate as published by the European Central Bank on its website for the real on each business day during the relevant year indicated or each business day during the relevant month indicated.
F-8
June 30, 2014 June 30, 2015Operating Data:GMV(1) € 1,941.0 € 2,400.5GMV Cdiscount(1) € 960.4 € 1,216.8GMV Cnova Brazil(1) € 980.6 € 1,183.6
Year Ended December 31, High Low Average Year-End2010 1.4536 1.1959 1.3261 1.32692011 1.4875 1.2926 1.3931 1.29732012 1.3463 1.2062 1.2859 1.31862013 1.3816 1.2774 1.3281 1.37792014 1.3927 1.2101 1.3299 1.2101
Month Ended High Low Average Month-EndSeptember 30, 2014 1.3136 1.2628 1.2889 1.2628October 31, 2014 1.2812 1.2517 1.2677 1.2530November 30, 2014 1.2554 1.2394 1.2473 1.2438December 31, 2014 1.2504 1.2101 1.2329 1.2101January 31, 2015 1.2015 1.1279 1.1615 1.1290February 28, 2015 1.1462 1.1197 1.1350 1.1197March 31, 2015 1.1212 1.0524 1.0819 1.0741April 30, 2015 1.1174 1.0582 1.0822 1.1162May 31, 2015 1.1428 1.0876 1.1167 1.0994June 30, 2015 1.1404 1.0913 1.1226 1.1154
Year Ended December 31, High Low Average Year-End2010 0.4598 0.3828 0.4298 0.45092011 0.4585 0.3896 0.4303 0.41392012 0.4449 0.3613 0.3999 0.36992013 0.3955 0.3070 0.3507 0.30702014 0.3443 0.2924 0.3203 0.3105

The reference rate of the European Central Bank for the Real on July 15, 2015 was R$1.00 = €0.2890.
We make no representation that any euro, U.S. dollar or Brazilian real amounts could have been, or could be, converted into U.S. dollars or euro, as the case may be, at any particular rate, at the rates stated above, or at all. The rates set forth above are provided solely for your convenience and may differ from the actual rates used in the preparation of the consolidated financial statements included in this annual report and other financial data appearing in this semi-annual report.
3.2 Operating and Financial Review and Prospects
3.2.1 Company Overview
We are one of the largest global eCommerce companies, with operations in Europe, Latin America, Asia and Africa. Our current geographies represent over 550 million people. We had GMV of €2,400.5 million and €1,941.0 million for the 6-month periods ended June 30, 2015 and 2014, respectively. This growth in GMV was attributable to the growth of our net sales across the markets in which we operated during the period, including growth in revenue from product sales as well as commissions we realized from sales of products on our marketplaces. Our net sales increased by €218.9 million, or 14.3%, between half-year 2014 and half-year 2015. This increase was primarily driven by an increase in the number of visits, Cnova’s price positioning in its markets, the growing success of the Click-&-Collect (C&C) delivery option, the “preferred customer” service in France, Cdiscount à volonté, the search engine optimization (SEO) of Cnova’s websites, and the strong growth of visits coming from mobile devices, which more than doubled year-over-year and now represents 36.9% of total traffic.
We believe we provide our customers with the best value proposition through a low-cost business model that allows us to offer attractive pricing, an extensive product assortment and highly differentiated delivery and payment solutions. We achieve this through our scalable and proprietary technology platforms and preferred relationships with our Parent Companies, which are among the largest retailers in the markets in which we operate.
As of June 30, 2015, we offered our over 15.0 million active customers access to a wide and growing assortment of approximately 21 million product offerings through a combination of our direct sales and sales by third-party vendors on our marketplaces.
Our 18.1 million placed orders for the 6-month period ended June 30, 2015 represented a year-over-year increase of placed orders by 32.1%, while our active customers increased by 22.0% over the same period. Our most significant product categories in terms of GMV are home appliances, consumer electronics, computers and home furnishings. Our branded sites, including Cdiscount, Extra, Casas Bahia and Ponto Frio, are among the best recognized in the markets in which we operate.
We are a leading eCommerce company in France. From 2008 to 2014, our GMV in France experienced a CAGR of 16.1%. We believe we are the second largest eCommerce company in Brazil, with a GMV CAGR of 44.4% from 2008 to 2014. During the first quarter of 2014, we successfully launched operations in the high-growth emerging markets of Colombia, Thailand and Vietnam. In the second quarter of 2014, we launched operations in Ivory Coast and Ecuador and, in the third quarter of 2014, we launched operations in Senegal. We also extended our operations to Belgium in the third quarter of 2014, where we serve our customers from France through our Cdiscount.com site. We entered into the Cameroonian market in the fourth quarter of 2014, when we launched Cdiscount.com. In
F-9
Month Ended High Low Average Month-EndSeptember 30, 2014 0.3343 0.3182 0.3325 0.3245October 31, 2014 0.3332 0.3110 0.3224 0.3256November 30, 2014 0.3215 0.3065 0.3142 0.3142December 31, 2014 0.3171 0.2924 0.3077 0.3105January 31, 2015 0.3442 0.3083 0.3268 0.3321February 28, 2015 0.3301 0.3055 0.3126 0.3069March 31, 2015 0.3112 0.2808 0.2944 0.2861April 30, 2015 0.3146 0.2915 0.3050 0.3009May 31, 2015 0.3005 0.2893 0.2932 0.2897June 30, 2015 0.2903 0.2817 0.2862 0.2882
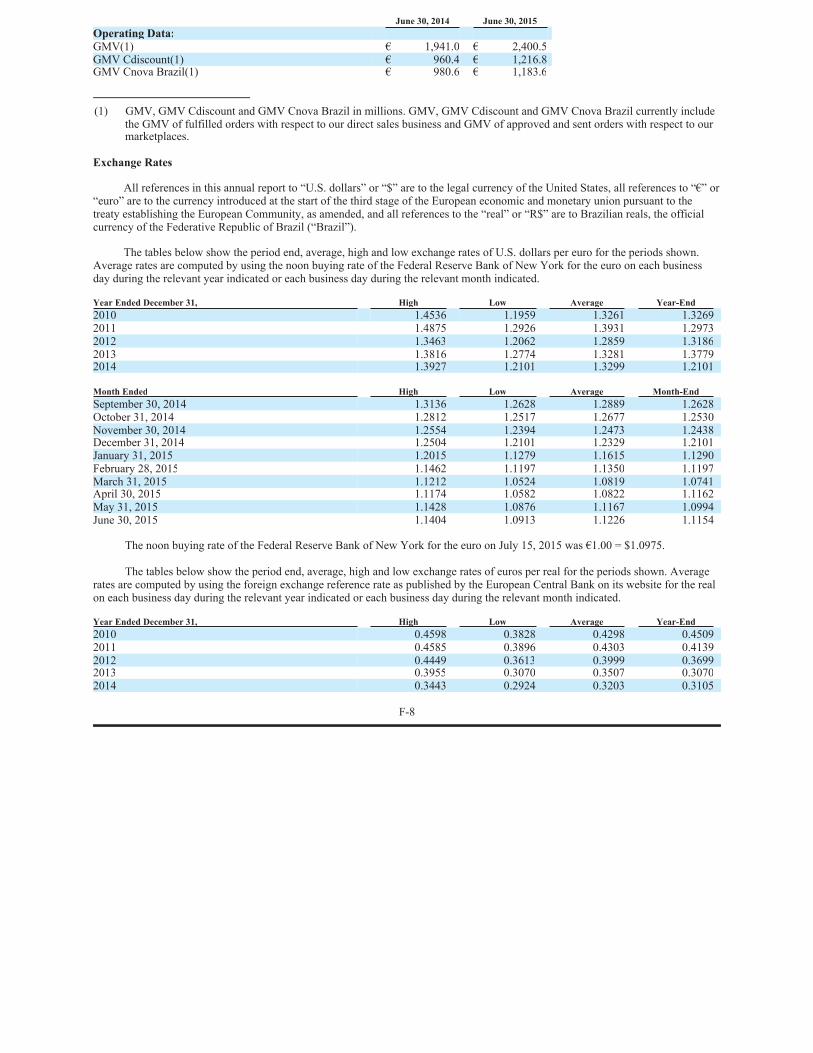
January 2015, we launched operations in Panama and in May 2015 in Burkina Faso and Mali. At the end of 2014, we also launched two specialty sites: moncornerbrico.com, an online seller of home improvement products for the DIY consumer, and moncornerbaby.com, an online seller of infant care products and toys. We launched two other specialty website in May 2015: moncornerjardin and moncornerkids and moncornerhomme in June 2015.
The eCommerce industry is characterized by meaningful differences across different regions. As a result of these differences, among other things, we manage our operations through three operating segments, Cdiscount France, Cdiscount International and Cnova Brazil.
3.2.2 Components of Statements of Income
Net sales
Net sales consist primarily of revenue generated from product sales and related services from our business to consumer direct sales and our business to business transactions, across our variety of product categories. Our product categories are home appliances, consumer electronics, computers, home furnishings, leisure and personal goods. Net sales also include revenues generated from commissions from our marketplaces on sales by third party vendors selling products on our sites. We launched our first marketplace in France in 2011 and in Brazil in 2013. To date, our marketplace revenues represent only a small portion of our total net sales, however, we expect to expand our marketplace business significantly in coming years, including the expansion of our program to provide fulfillment services to marketplace sellers for a fee, which will contribute to our net sales. In addition, we generate revenue from shipping, extended warranties, advertising sales, data monetization, fees collected from customers using our customer service call centers and eCommerce services provided to third parties through our B2B sites. We exclude revenue from items that are returned and orders that are cancelled. Net sales are primarily driven by growth in our active customers, the frequency with which customers purchase products from our sites and average order value. Net sales are also impacted by incentive and discount offers we include on products sold from our direct sales sites. These include percentage discounts off a current purchase, inducement offers for future discounts subject to a minimum current purchase and other similar offers. Revenue from product sales is recognized when the significant risks and rewards of ownership have passed to the customer, regardless of when the payment is being made. Revenue from services is recognized once the service is rendered. We measure revenue at the fair value of the sale or commission price received or receivable, accounting for the terms of payment and excluding taxes or duty.
Net sales increased by €218.9 million, or 14.3%, from €1,533.3 million in the first half 2014 to €1,752.2 million in the first half 2015. Excluding the impact of foreign exchange, our net sales increased by 17.5%.
Geographical Breakdown of Net Sales
Brazil is our largest market, and France is our second largest market. The balance of our revenues is generated from the rest of the world, including Latin America, Asia, and Africa. The following table sets forth the geographic breakdown of our net sales by region for the periods indicated:
Our net sales from our Cdiscount segment (France and International) increased by €103.8 million, or 15.1%, from €686.2 million from the first half 2014 to €790.0 million in the first half 2015. This increase was primarily due to an increase in the volume of sales of products from our home furnishings, home appliances and consumer electronics products categories as well as an increase in marketplace commissions, with an increase of marketplace share in GMV of more than 987 bps.
Our net sales from our Cnova Brazil segment increased by €115.1 million, or 13.6%, from €847.1 million in the first half 2014 to €962.2 million in the first half 2015. Excluding the impact of foreign exchange, our net sales in Brazil in local currency increased by 19.4% during the period. The increase in our net sales was primarily due to an increase in sales of specific products from our consumer electronics products such as tablets and smartphones and home appliances, due to an increase in both traffic and conversion rates across all our sites in Brazil.
F-10
Geographical Region: June 30, 2014 June 30, 2015France 44.8% 44.1%Brazil 55.2% 54.9%Other Countries — 1.0%Total 100.0% 100.0%

Cost of sales
Cost of sales consist primarily of costs related to our direct sales business, including purchase price of consumer products sold to customers in our direct sales business, inbound shipping charges to our fulfillment centers and outbound shipping charges from our fulfillment centers to pick-up locations or directly to end customers, fees payable to pick-up locations, packaging supplies, gains related to discounts we obtain from our suppliers and costs for lost, stolen or damaged goods we receive. Shipping charges to receive products from our suppliers are included in our inventory and recognized as cost of sales upon sale of products to our customers. Cost of sales are primarily driven by growth in orders placed by customers, the mix of the products available for sale on our direct sales sites and transportation costs related to delivering orders to our customers at the point of delivery they choose, including pick-up locations or a postal address. As our business grows in size, we expect an increase in our cost of sales.
Cost of sales increased by €201.1 million, or 15.1%, from €1,330.3 million in the first half 2014 to €1,531.4 million in the first half 2015. Our cost of sales was 86.8% of our net sales in the first half 2014, compared to 87.4% of our net sales during the same period in 2015. The increase was driven by different factors. We experienced an increased volume of sales of large home appliances and home furnishing products, which tend to be more expensive to ship than other products. In France, as part of our commercial strategy, we offered customers free shipping on certain orders and decreased marketing expenses, as described below. In Brazil, we have promotional initiatives impacting the margins and experienced a larger volume of sales to customers outside of São Paulo and Rio de Janeiro, the traditional hub for our sales in Brazil, where our fulfillment centers are concentrated and more developed infrastructure and logistics are in place.
Operating expenses
Our operating expenses are classified into four categories: fulfillment, marketing, technology and content, and general and administrative costs.
Fulfillment costs
Fulfillment costs consist of costs we incur in operating and staffing our fulfillment centers and customer service centers, payment processing, after sales costs and extended warranties. The costs related to operating our fulfillment centers include warehousing costs and preparation costs, which include picking, packaging and preparing customer order, and payroll and related expenses. Payment processing costs include credit card fees and fees paid to Banque Casino in relation to our payment-in-installments program in France. After sales costs consist primarily of preparing and resending products that are returned to suppliers or third parties to be repaired. Extended warranties costs include costs to third parties who repair or replace products for which we have sold an extended warranty.
Fulfillment costs are primarily driven by the size of our operations. As our business grows in size and we invest in our fulfillment capabilities, we expect a corresponding increase in fulfillment costs in absolute terms and potentially a temporary increase as a percentage of our net sales. We also expect an increase in fulfillment costs corresponding to the growth of our home furnishings product category offering, where the sizes of products and preparation costs tend to be larger than other products. As we grow the size of our marketplaces, we expect an increase in fulfillment costs related to payment processing, credit card fees, related transaction costs and warehousing costs where we provide fulfillment services for marketplace sellers for a fee. We also expect an increase in fulfillment costs as the headcount of our customer service centers grows to handle additional customer contacts corresponding to the growth of our business.
Fulfillment expenses increased by €39.7 million, or 38.2%, from €103.9 million in the first half 2014 to €143.6 million in the first half 2015. Cnova strengthened its logistics infrastructure. In France, the opening of the Paris warehouse combined with the ongoing extension of the Lyon distribution center have added +35% in capacity. These actions will enable the acceleration of express pick-up and same day delivery in Paris and Lyon for heavy products as well expanded product assortment. In Brazil, warehouse surfaces are growing by 23%, in order to enhance product availability and to reduce by 3 days the delivery timeline for Mid-West and South regions. In addition fulfillment costs were impacted by the fast growing marketplace and the doubling of Click-and-Collect pick-up points in Brazil to 516 at the end of June 2015.
F-11

Marketing costs
Marketing costs consist primarily of online and offline advertising, such as display advertising and search engine marketing, fees paid for third-party marketing services, costs related to the launch of new business activities and payroll and related expenses for personnel engaged in marketing. Marketing costs are primarily driven by the level of traffic we experience on our sites and the determination we make as to whether we need to attract traffic via paid marketing channels in order to grow and retain our customer base. As we continue to attract customers through our attractive pricing strategy, we expect to maintain marketing costs for existing sites at a similar level as a percentage of net sales as we rely more on non-paid methods (SEO and mails) to attract traffic to our sites, including by expanding our direct sales and marketplace product offerings and expanding our customer loyalty programs. Regarding the launching of new sites, we expect additional marketing costs.
Marketing costs increased by €8.9 million, or 28.0%, from €31.8 million in the first half 2014 to €40.7 million in the first half 2015. As a percentage of net sales, our marketing expenses increased from 2.1% in the first half 2014 compared to 2.3% of our net sales in the first half 2015. This relative stability was primarily attributable to the implementation of our strategy in France to concentrate our commercial strategy on price attractiveness and customer acquisitions.
Technology and content costs
Technology and content expenses consist primarily of technology infrastructure expenses and payroll and related expenses for employees involved in application, product, and platform development, category expansion, editorial content, purchasing (including expenses and payroll related to our overall purchasing activity), merchandising selection, systems support and digital initiatives. We expense technology and content costs as they are incurred and amortize development costs over time, including software used to upgrade and enhance our websites and applications supporting our business. We expect an increase in technology and content expenses as we continue the development of our platforms, expand our product categories and launch new sites.
Technology and content costs increased by €10.7 million, or 27.3%, from €39.0 million in the first half 2014 to €49.7 million in the first half 2015. Cnova accelerated the conversions to new IT systems both in France and in Brazil: with the launch of a new warehouse management system (Manhattan) in France, providing central visibility on inventories across multiple warehouses and enabling same day delivery; the implementation of a new search engine (Solr) at Cdiscount providing customers improved navigation tools across an expanded product offering; the implementation of a new mobile “responsive design” software at Cdiscount, which adapts online content and lay-out for mobile devices; and in Brazil, the acceleration of new IT system conversions including transition to a new ERP and customer service system, as well as the launch of a new recommendation tool and the opening of 5 new specialty websites between May and early July 2015.
General and administrative costs
General and administrative expenses consist primarily of payroll and related expenses for management, including employees involved in general corporate functions, including accounting, finance, tax, legal, and human resources, including our management equity incentive plans, as well as costs associated with use by these functions of facilities and equipment, such as depreciation expense and rent, and general labor costs. General and administrative costs also include management fees paid to our Parent Companies for shared services, such as accounting, finance, legal and human resources. We also include professional fees and litigation costs and other general corporate costs as general and administrative costs. General and administrative costs take into account costs related to our status as a U.S. public company, such as higher legal, corporate insurance, investor relations and accounting expenses.
General and administrative costs increased by €11.6 million, or 43.3%, from €26.9 million in the first half 2014 to €38.5 million in the first half 2015. As a percentage of net sales, our general and administrative expenses increased from 1.8% of our net sales in the first half 2014 compared to 2.2% of our net sales during the same period in the first half 2015. This increase was primarily driven by holding costs and corporate development expense.
Impairment of Assets
Losses from impairment of assets were €6.5 million in first half 2015 (nil in first half 2014). As discussed in the notes to our financial statements found elsewhere in this semi-annual report, this was mostly related to the write-off of obsolete IT development costs of our Cdiscount segment (€6.0 million including €0.7 million in Asia) and Cnova Brazil segment (€0.5 million).
F-12

Litigation
In half year 2015, litigation expenses consist of a €1.4 million expense related to disputes with suppliers and to a tax litigation at Cdiscount. In half year 2014, litigation expense was €0.4 million, mainly related to a litigation following a breach of contract with a supplier.
Restructuring and Initial Public Offering expenses
For half year 2015, restructuring expenses were €11.7 million, consisting mostly of costs related to reorganization and opening of warehouses in France and Brazil (€3.2 million), costs related to adapting the corporate structure to the environment of a listed company (€2.3 million) and strengthening the efficiency and documentation of our processes and controls to comply with the Sarbanes-Oxley Act (€0.8 million).
During half year 2015, costs incurred in connection with our initial public offering of November 2014 and subsequent listing on Euronext Paris in 2015 and recorded through income amounted to €3.8 million, related primarily to the Reorganization and the restructuring in the governance and management of Cnova, and were expensed in the income statement. These costs include notably fees and legal expenses for €2.3 million and specific bonuses for €1.3 million.
Financial income (expense), net
Financial income and expenses, net consist primarily of revenue from cash and cash equivalents held by us, our interest expense on our borrowings and costs we incur related to the sales of receivables in Brazil. The vast majority of our sales in Brazil are paid for in interest-free installments with credit cards. On average, our customers in Brazil who choose to pay by installments pay off the full purchase price with on average seven to eight installment payments. Historically, we have sold at a discount nearly all receivables generated in installment sales in our Brazil operations to banks and other entities, which comprise an important component of the results of operations in Brazil. These financial expenses are expected to remain relatively stable as a percentage of GMV, assuming no increase in Brazilian interest rates in relation with a shift in our product mix whereby we would offer fewer high-priced products for which customers would be more likely to require financing options and with a change in our policies that tailors the maximum number of installment payments we allow, depending on the product category or product offered, and raises the minimum installment payment amount. In addition, we believe the recent trend of retail companies in the Brazilian market offering fewer installment payments will continue.
Net financial expense decreased by €12.1 million, or 37.5%, from €32.3 million in the first half 2014 to €20.2 million in half year 2015. Excluding the effect of one-time accrued interest on tax credit of €7.1 million in the first quarter of 2015, financial net expenses declined 15.5% to €27.3 million, as a consequence of stronger balance sheet and the reduction of average number of instalments in Cnova Brazil sales.
Income tax gain (expense)
Income tax gain increased by €8.4 million, or 128.4%, from €6.6 million to €15.0 million in the first half 2015. The effective tax rate amounted to -14.5% and -15.6% respectively in the first half 2014 and 2015. The change in the effective tax rate from the first half 2014 to the same period in 2015 was primarily due to the limitation of deferred tax assets in Cdiscount.
3.2.3 Application of Critical Accounting Policies and Estimates
Our significant accounting policies are set forth in the note titled “Description of the reporting entity” and note 1 to our audited consolidated financial statements for the years ended December 31, 2012, 2013, and 2014 included in our annual report. The preparation of our consolidated financial statements in accordance with IFRS requires our management to make judgments, estimates and assumptions that affect the amount reported in consolidated financial statements. Estimates and assumptions are periodically re-evaluated by management and are based on historical experience and other factors, including expectations of future events that are believed to be reasonable under the circumstances. Actual results may differ significantly from those estimates and assumptions. We have identified the following accounting policies as the most critical to an understanding of our financial position and results of operations because the application of these policies requires significant and complex management estimates, assumptions and judgment, and the reporting of materially different amounts could result if different estimates or assumptions were used or different judgments were made.
F-13

3.2.4 Liquidity and Capital Resources
Our principal sources of liquidity have traditionally consisted of cash flows from operating activities, loans or cash received from our Parent Companies and, to a lesser extent, capital increases and proceeds obtained from short- and long-term loans and financings from third-party financial institutions. Notes 27 and 30 to our consolidated financial statements, included in our annual report, provide additional financial information regarding our liquidity and capital resources.
Cash Flows and Working Capital
The following table presents the major components of net cash flows for the periods presented:
(1) Includes €(225,506) and €(337,035) of changes in working capital for the 6-month periods ended June 30, 2014 and 2015, respectively.
Historically, we have worked to optimize our working capital and we generated cash flow through, among other things, a one-time sale of a receivables portfolio, the factoring of receivables and a gradual increase in days of trade payables to suppliers. In the future, we expect an increase in net sales and profitability, rather than working capital optimization, to be primary drivers of cash flow generation.
Our cash flows and working capital fluctuate throughout the year, primarily driven by the seasonality of our business. At the end of December of each year, we experience high trade payables relative to the rest of the year following the peak sales volumes achieved in November and December associated with the holiday shopping period. In the first three quarters of each year, trade payables decrease due to seasonality leading to a cash balance reduction compared to the end of the prior year.
Although the levels of trade receivables and inventories typically are stable relative to our net sales throughout the year, the level of our payables with suppliers may vary from period to period, particularly in Brazil where we have from time to time renegotiated payment conditions with suppliers.
We had cash and cash equivalents of €412.3 million and €66.4 million as of June 30, 2015 and 2014, respectively. The increase in our net cash and cash equivalents by €345.9 million represents our net cash flow over the last twelve months. Excluding the net proceeds of €123.9 million we received from our initial public offering, we generated €222.0 million in cash during the period. We believe that our existing cash and cash equivalents together with cash generated from operations, and our existing financial resources and credit lines suffice to meet our working capital expenditure requirements for at least the next 12 months, assuming we have continuous access to banks and credit card operators for credit lines facilities and discount of receivables. However, we may need additional cash resources in the future if we identify opportunities for investment, strategic cooperation or other similar actions, which may include investing in technology, including data analytics and our fulfillment capabilities. If we determine that our cash requirements exceed our amounts of cash on hand, we may seek to issue debt or equity securities or obtain credit facilities or other sources of funding.
Our trade payables include accounts payable to suppliers associated with our direct sales business. Our trade payables amounted to €1,012.3 million and €1,296.0 million as of June 30, 2015 and December 31, 2014, respectively. We typically pay our suppliers within 50-80 days measured from the day the product is received in our distribution center and invoiced. There is a higher level of days payable in the first three months of the year relative to the rest of the year due to higher volumes of purchasing from November and December of the previous year in anticipation of holiday shopping. The purchasing is paid for in the first three months of the following year.
Our net inventories of products amounted to €466.7 million and €417.2 million as of June 30, 2015 and December 31, 2014,
F-14
€ thousands June 30, 2014 June 30, 2015Cash Flows:Net cash from (used in) operating activities(1) (219,252) (386,469)Net cash from (used in) investing activities 38,588 22,301Net cash from (used in) financing activities 7,392 232,543Effect of changes in foreign currency translation
adjustments 6,983 (29,249)Cash and cash equivalents, net, at end of period 66,361 412,276

respectively. Our inventory balances will fluctuate over time due to a number of factors, including our sales performance, expansion in our product selection and changes in our product mix.
Cash From (Used in) Operating Activities
Cash used in operating activities in the first half year 2015 was €386.5 million, as adjusted for changes in operating working capital and other activities. Changes in working capital primarily consisted of a €242.6 million decrease in trade payables. This decrease in trade payables relates to the seasonal effect following the end-of-year festive period increased purchases, together with a €65.4 million increase in inventories of products either in our fulfillment centers awaiting shipment to customers or in transit to customers were partially offset by a €20.8 million decrease in trade receivables.
Cash used in operating activities in the first half year 2014 was €219.3 million, as adjusted for changes in operating working capital and other activities. Changes in working capital primarily consisted of a €254.1 million decrease in trade payables, which relates to the seasonal effect following the end-of-year festive period increased purchases, which was partially offset by an decrease of €10.8 million of trade receivables and a €23.6 million decrease in inventories of products which were either in our fulfillment centers awaiting shipment to customers or in-transit to customers.
Cash From (Used in) Investing Activities
Cash from investing activities was €22.3 million in the first half year 2015 and was primarily attributable to the change in loans granted (including to related parties) for €65.2 million, partially offset by €44.9 million in acquisitions of property, equipment and intangible assets. This included capital expenditures related to improved investment in our supply chain infrastructure in France and the improvement of our warehouses and expansion of our logistical capacity to support sales growth in Brazil. Generally, this cash use also related to investments in our eCommerce platforms and new specialty sites and investments concentrated in back-end IT solutions (namely, the implementation of ERP) or front-end IT solution aimed at developing the user experience and increasing the value our clients may reap from our services.
Cash from investing activities was €38.6 million in the first half 2014 and was primarily attributable to the change in loans granted (including to related parties) for €71.3 million, partially offset by €31.5 million in acquisitions of property, equipment and intangible assets, including capital expenditures related to investments in our eCommerce platforms, new specialty sites, mobile platforms and back office technology systems, improved investment in our supply chain infrastructure in France and the consolidation of three smaller fulfillment centers into a single, larger fulfillment center in S o Paulo.
Cash From (Used in) Financing Activities
Cash from financing activities was €232.5 million in the first half 2015 and was primarily attributable to €272.8 million of additional related party financial debt incurred by Cnova subsidiaries, which was partially offset by €25.7million of net interest payments primarily related to the discounting of receivables in Brazil and €13.2 million related to payment of IPO costs.
Cash from financing activities was €7.4 million in the first half 2014 and was primarily attributable to €43.0 million of additional related party financial debt incurred by Cnova subsidiaries, which was partially offset by €28.7 of net interest payments primarily related to the discounting of receivables in Brazil and €6.2 million related to payment of IPO costs.
3.2.5 Research and Development
Our research and development strategy is centered on building and enhancing our e-Commerce platforms, mobile platforms and applications, and fulfillment management systems, as well as other aspects of our IT infrastructure, such as customer facing and back office features for our sites. We focus on application, product, and platform development, category expansion, editorial content, purchasing (including expenses and payroll related to our overall purchasing activity), merchandising selection, systems support and digital initiatives.
We incurred approximately €49.7 million and €39.0 million of research and development expenses in first half 2015 and first half 2014, respectively.
For a description of our research and development activities, see “2.1.8 Technology” in our annual report.
F-15

4. BOARD OF DIRECTORS
In the Company’s General Meeting of Shareholders, held on May 20 , 2015, the shareholders (re-)appointed several directors. As from May 20 , 2015, our board of directors consists of ten directors. The individuals listed below are our current directors.
(1) Member of our Audit Committee.(2) Member of our Nomination and Remuneration Committee.
The following paragraphs set forth biographical information regarding the director appointed at the Company’s General Meeting of Shareholders, held on May 20 , 2015:
Antoine Giscard d’Estaing is a graduate of the HEC School of Management and the École Nationale d’Administration. After serving four years in the auditing department of the French Treasury, he joined Suez-Lyonnaise des Eaux in 1990 and eventually became that company’s Chief Financial Officer. He then joined Schneider Electric in 2000 as Executive Vice-President of Finance, Auditing and Legal Affairs, before moving to Danone in 2005 as Executive Vice-President of Finance, Strategy and Information Systems. He was appointed Danone’s Corporate Secretary in 2007. Since 2008, he has been a partner with Bain & Company Paris. He joined Casino group in April 2009 as Chief Financial Officer and member of the Executive Committee.
5. RELATED PARTY TRANSACTIONS
In the Dutch Annual Report, an extensive overview of the Company’s policy governing Related Party Transactions is given; setting forth the main characteristics of the Company’s material Related Party Transactions. We refer to such Related Party Transaction Overview, which review should be read in conjunction with this semi-annual Report.
The following is a description of material transactions, or series of related material transactions, for the period since March 31 , 2015 through the filing of this semi-annual report, to which we have been a party and in which the other parties included or will include our directors, executive officers, holders of more than 5% of our voting securities or any member of the immediate family of any of the foregoing persons.
Cdiscount SA- Distribution Casino France
On June 30, 2015, Cdiscount and Distribution Casino France (“DCF”) entered into an agreement pursuant to which Cdiscount (i) designed and created a tab on its website dedicated to the DCF e-commerce site named ‘Casinodrive’; and (ii) provides continuing maintenance services related to the tab. The term of this agreement is one year, and can be tacitly renewed for the same duration unless terminated by either party with three months prior notice.
Cdiscount SA- Leaderprice Exploitation
On June 30, 2015, Cdiscount and Leaderprice Exploitation (“Leaderprice”) entered into an agreement pursuant to which Cdiscount (i) designed and created a tab on its website dedicated to the Leader Price e-commerce site named ‘Leaderdrive’; and (ii)
F-16
Name Date of appointment Current term Nationality Year of birthNon-executive directorsJean-Charles Naouri, Chairman October 31, 2014 2014-2017 French 1949Líbano Miranda Barroso October 31, 2014 2014-2016 Brazilian 1965Silvio J. Genesini (1)(2) December 8, 2014 2015-2018 Brazilian 1952Eleazar de Carvalho Filho October 31, 2014 2014-2016 Brazilian 1957Ronaldo Iabrudi dos Santos Pereira (2) July 24, 2014 2014-2017 Brazilian 1955Didier Lévêque October 31, 2014 2015-2018 French 1961Bernard Oppetit (1) November 19, 2014 2014-2016 French 1956Arnaud Strasser (2) May 30, 2014 2014-2017 French 1966Antoine Giscard d’Estaing May 20, 2015 2015-2018 French 1961Executive directorGermán Quiroga, Co-CEO May 30, 2014 2015-2016 Brazilian 1967
th
th
th
st

provides continuing maintenance services related to the tab. The term of this agreement is one year, and can be tacitly renewed for the same duration unless terminated by either party with three months prior notice.
Cdiscount SA- Distribution Casino France
On June 30, 2015, Cdiscount and Distribution Casino France (“DCF”) entered into an agreement pursuant to which Cdiscount is granted a fee calculated on the basis of its volume contribution out of the total purchasing volume made with DCF with non-food suppliers. As such, DCF compensates Cdiscount for its improving purchasing financial conditions due to the volumes amalgamation. The term of this agreement is 10 years, and can be tacitly renewed for subsequent 5 year periods unless terminated by either party with two years prior notice.
Prior to the entering into of the above mentioned Related Party Transactions, Grant Thornton reviewed all material terms that it believed should be considered in determining whether a transaction is on arm’s-length terms, including pricing, duration and termination provisions. Grant Thornton’s review was performed under International Standard on Assurance Engagements 3000 and concluded that no material element existed that would preclude the determination that each such related party transaction was entered into on arm’s-length terms and in accordance with the Company’s RPT-policy, taking into account all material aspects of each transaction.
F-17

6. RESPONSIBILITY STATEMENT AND IN CONTROL STATEMENT
In accordance with the EU Transparency Directive, as incorporated in chapter 5.1A of the Dutch Financial Markets Supervision Act ( Wet op het financieel toezicht ), the Company’s Chief Financial Officer and each of its Co-CEOs declares that, to the best of his knowledge:
The Consolidated Financial Statements give a true and fair view of the assets, liabilities, financial position and results of the Company at June 30, 2015;
The semi-annual report gives a true and fair view of the position as per the balance sheet date, the state of affairs during the first six months of the 2015 financial year of the Company and its affiliated companies included in the consolidated financial statements;
The semi-annual Report contains a true and fair view of the material Related Party Transactions entered into by the Company and its subsidiaries; and
The semi-annual report describes the principal risks and uncertainties that the Company faces.
It should be noted that the foregoing does not imply that this system and these procedures provide absolute assurance as to the realization of operational and strategic business objectives, or that they can prevent all misstatements, inaccuracies, errors, fraud and non-compliance with legislation, rules and regulations.
Germán QuirogaEmmanuel GrenierVitor Faga
F-18

OTHER INFORMATION
Independent auditor’s report
Cnova, N.V.
Six months ended June 30, 2015To the Board of Directors and Shareholders of Cnova, N.V.
Introduction
We have reviewed the accompanying consolidated balance sheet of Cnova, N.V. as of June 30, 2015 and the related consolidated income statement, consolidated statement of changes in equity and consolidated statement of cash flows for the six-month period then ended, and a summary of significant accounting policies and other explanatory notes. Management is responsible for the preparation and fair presentation of this interim financial information in accordance with IAS 34 Interim Financial Reporting. Our responsibility is to express a conclusion on this interim financial information based on our review.
Scope of Review
We conducted our review in accordance with International Standard on Review Engagements 2410, “Review of Interim Financial Information Performed by the Independent Auditor of the Entity.” A review of interim financial information consists of making inquiries, primarily of persons responsible for financial and accounting matters, and applying analytical and other review procedures. A review is substantially less in scope than an audit conducted in accordance with International Standards on Auditing and consequently does not enable us to obtain assurance that we would become aware of all significant matters that might be identified in an audit. Accordingly, we do not express an audit opinion.
Conclusion
Based on our review, nothing has come to our attention that causes us to believe that the accompanying interim financial information does not give a true and fair view of the financial position of Cnova N.V. as of June 30, 2015, and of its financial performance and its cash flows for the six-month period then ended in accordance with IAS 34 Interim Financial Reporting.
Paris-La-Défense, July 22, 2015
/S/ ERNST & YOUNG Audit
Daniel Mary-Dauphin
F-19

UNAUDITED INTERIM CONDENSED CONSOLIDATED FINANCIAL STATEMENTS
Unaudited interim condensed consolidated income statementfor the six months ended June 30, 2015
The accompanying notes are an integral part of these unaudited interim condensed consolidated financial statements.
F-20
€ thousands Notes June 30, 2014 June 30, 2015Net sales 6 1,533,261 1,752,158Operating expensesCost of sales 6 (1,330,332) (1,531,392)Fulfillment 6 (103,887) (143,552)Marketing 6 (31,779) (40,690)Technology and content 6 (39,037) (49,686)General and administrative 6 (26,892) (38,538)Operating loss profit before Restructuring, Litigation, Initial public
offering expenses, Gain (loss) from disposal of non-current assets and Impairment of assets 1,334 (51,701)
Restructuring 7 (8,876) (11,677)Litigation 8 (410) (1,396)Initial public offering expenses 9 (4,800) (3,812)Gain (loss) from disposal of non-current assets (23) (533)Impairment of assets — (6,477)Operating loss (12,776) (75,595)Financial income 10 3,238 22,500Financial expense 10 (35,539) (42,686)Loss before tax (45,077) (95,781)Income tax gain (expense) 11 6,550 14,957Share of losses of associates 12 (1,418) —Net loss for the period (39,945) (80,824)Attributable to equity holders of Cnova (39,473) (73,773)Attributable to non-controlling interests (472) (7,051)
In € June 30, 2014 June 30, 2015Basic earnings per share (0.10) (0.17)Diluted earnings per share (0.10) (0.17)

Unaudited interim condensed consolidated statement of comprehensive incomefor the six months ended June 30, 2015
The accompanying notes are an integral part of these unaudited interim condensed consolidated financial statements.
F-21
€ thousands June 30, 2014 June 30, 2015Net loss for the period (39,945) (80,824)Items that may subsequently be recycled to profit or lossForeign currency translation 35,779 (44,759)Items that may not be recycled to profit or lossAvailable-for-sale financial assets — (133)Actuarial gains or losses — (593)Non-controlling interests 1,491 375Other comprehensive income (loss) for the period 37,270 (45,110)Total comprehensive income (loss) for the period (2,675) (125,934)Attributable to the equity holders of Cnova (3,694) (119,258)Attributable to non-controlling interests 1,019 (6,676)

Unaudited interim condensed consolidated balance sheetas of December 31, 2014 and June 30, 2015
ASSETS
EQUITY AND LIABILITIES
The accompanying notes are an integral part of these unaudited interim condensed consolidated financial statements.
F-22
€ thousands December 31, 2014 June 30, 2015Cash and cash equivalents 573,321 412,331Trade receivables, net 139,307 139,981Inventories, net 417,164 466,664Current income tax assets 1,466 1,381Other current assets, net 202,627 141,000Total current assets 1,333,885 1,161,356Other non-current assets, net 93,727 81,702Deferred tax assets 46,463 60,953Investment in associates — —Property and equipment, net 43,989 45,330Intangible assets, net 147,082 154,992Goodwill (refer to Note 13) 496,313 465,359Total non-current assets 827,574 826,439TOTAL ASSETS 2,161,459 1,969,692
€ thousands December 31, 2014 June 30, 2015Current provisions 4,733 736Trade payables 1,296,013 1,012,337Current financial debt 102,557 366,201Current taxes liabilities 37,943 37,587Other current liabilities 117,953 70,083Total current liabilities 1,559,199 1,486,944Non-current provisions 4,608 10,345Non-current financial debt 2,045 9,865Other non-current liabilities 4,023 2,427Deferred tax liabilities 7,293 1,551Total non-current liabilities 17,969 24,188Share capital 22,065 22,065Reserves and retained earnings 555,908 436,851Equity attributable to equity holders of Cnova 577,973 458,916Non-controlling interests 6,318 (355)Total equity 584,291 458,561TOTAL EQUITY AND LIABILITIES 2,161,459 1,969,692

Unaudited interim condensed consolidated statement of cash flowsfor the six months ended June 30, 2014 and 2015
Bank overdrafts arise from settlement of promissory notes that are due to suppliers and are repayable on demand to banks when such promissory notes are presented by suppliers for settlement.
The accompanying notes are an integral part of these unaudited interim condensed consolidated financial statements.
F-23
€ thousands June 30, 2014 June 30, 2015Net loss attributable to equity holders of Cnova (39,473) (73,773)Net loss attributable to non-controlling interests (472) (7,051)Net loss for the period (39,945) (80,824)Depreciation and amortization expense 13,485 19,885Expenses on share-based payment plans 49 450(Gains) losses on disposal of non-current assets and impairment of assets 23 7,010Share of losses of associates 1,418 —Other non-cash items 5,665 856Financial expense, net 32,301 20,187Current and deferred tax profit (6,550) (14,957)Income tax paid (194) (2,041)Change in operating working capital (225,506) (337,035)
Inventories of products 23,604 (65,435 )Trade payables (254,061 ) (242,584 )Trade receivables 10,775 20,757Other (5,824 ) (49,771 )
Net cash used in operating activities (219,252) (386,469)Purchase of property and equipment and intangible assets (31,524) (44,880)Purchase of non-current financial assets (1,239) (421)Proceeds from disposal of property and equipment, intangible assets and non-current financial
assets 53 2,423Changes in loans 71,298 65,180Net cash from investing activities 38,588 22,301Payment of IPO expenses (6,158) (13,230)Additions to financial debt 42,952 272,795Repayments of financial debt (653) (1,307)Interest paid, net (28,748) (25,714)Net cash from (used in) financing activities 7,392 232,543Effect of changes in foreign currency translation adjustments 6,983 (29,249)Change in cash and cash equivalents (166,289) (160,875)Cash and cash equivalents at beginning of period 263,550 573,321Bank overdrafts at beginning of period (30,899) (169)Cash and cash equivalents, net, at beginning of period 232,651 573,152Cash and cash equivalents at end of period 66,361 412,331Bank overdrafts at end of period — (55)Cash and cash equivalents, net, at end of period 66,361 412,276

Una
udite
d in
teri
m c
onde
nsed
con
solid
ated
stat
emen
t of c
hang
es in
con
solid
ated
equ
ityfo
r th
e si
x m
onth
s end
ed J
une
30, 2
014
and
2015
(i) “
Oth
er m
ovem
ents
”ar
e m
ainl
y re
late
d to
gen
eral
and
adm
inis
trativ
e ex
pens
es, m
ainl
y co
nsis
ting
of h
eadq
uarte
rs a
nd m
anag
emen
t cos
ts th
at b
enef
it th
e eC
omm
erce
ent
ities
, ass
umed
by
Cas
ino
on b
ehal
f of C
nova
. Th
e re
porte
d am
ount
incl
udes
the
equi
ty im
pact
of t
he re
imbu
rsem
ent b
y C
asin
o of
bon
uses
pai
d to
Cdi
scou
nt m
anag
ers i
n A
pril
2014
.
The
acco
mpa
nyin
g no
tes a
re a
n in
tegr
al p
art o
f the
se u
naud
ited
inte
rim c
onde
nsed
con
solid
ated
fina
ncia
l sta
tem
ents
.
F-24
€th
ousa
nds
Num
ber
ofsh
ares
Shar
eca
pita
l
Add
ition
alpa
id in
capi
tal
Ret
aine
dea
rnin
gs
Fore
ign
curr
ency
tran
slat
ion
Act
uari
alga
ins a
ndlo
sses
Ava
ilabl
e-fo
r-sa
lefin
anci
al a
sset
s
Equ
ityho
lder
s of
the
Pare
nt
Non
-co
ntro
lling
inte
rest
s
Tot
alco
nsol
idat
edeq
uity
As o
f Dec
embe
r 31
, 201
341
1 45
5 56
920
573
678
695
(131
620
)(1
12 1
88)
(359
)(1
2)45
5 08
918
072
473
161
Oth
er c
ompr
ehen
sive
inco
me
for t
he p
erio
d—
——
—35
779
——
35 7
791
491
37 2
70N
et lo
ss fo
r the
per
iod
——
—(3
9 47
3)—
——
(39
473)
(472
)(3
9 94
5)C
onso
lidat
ed c
ompr
ehen
sive
loss
for
the
peri
od—
——
(39
473)
35 7
79—
—(3
694
)1
019
(2 6
75)
Shar
e-ba
sed
paym
ents
——
49—
——
49—
49In
itial
pub
lic o
ffer
ing
expe
nses
(5 7
00)
——
—(5
700
)—
(5 7
00)
Mon
show
room
Put
opt
ion
——
4 66
6—
——
4 66
6—
4 66
6O
ther
tran
sact
ion
betw
een
Gro
up a
nd N
CI
——
71—
——
71(5
37)
(466
)O
ther
mov
emen
ts (i
)—
—10
715
——
—10
715
470
11 1
85A
s of J
une
30, 2
014
411
455
569
20 5
7367
8 69
5(1
61 2
92)
(76
409)
(359
)(1
2)46
1 19
619
024
480
220
Oth
er c
ompr
ehen
sive
inco
me
for t
he y
ear
——
——
(33
409)
(473
)14
5(3
3 73
7)(1
650
)(3
5 38
7)N
et p
rofit
for t
he y
ear
——
—(1
2 31
8)—
——
(12
318)
(2 1
63)
(14
481)
Con
solid
ated
com
preh
ensi
ve in
com
e fo
r th
e ye
ar—
——
(12
318)
(33
409)
(473
)14
5(4
6 05
5)(3
813
)(4
9 86
8)Sh
are-
base
d pa
ymen
ts—
—7
501
(49)
——
—7
452
—7
452
Initi
al p
ublic
off
erin
g (n
et o
f exp
ense
s)29
182
894
1 45
912
7 16
65
700
——
—13
4 32
5—
134
325
Mon
show
room
Put
opt
ion
——
4 35
3(4
666
)—
——
(313
)8
(305
)N
ova
Pont
ocom
Reo
rgan
izat
ion
——
47 6
08—
(15
392)
——
32 2
16(1
7 13
2)15
084
Acq
usiti
on o
f Cdi
scou
nt C
olom
bia
659
383
331
568
(969
)—
——
632
2 53
03
162
Acq
uisi
tion
of C
-Asi
a—
——
(13
651)
——
—(1
3 65
1)1
940
(11
711)
Oth
er tr
ansa
ctio
n be
twee
n G
roup
and
NC
I—
—(5
70)
(71)
——
—(6
41)
4 13
83
497
Oth
er m
ovem
ents
(i)
——
13 5
29(1
0 71
5)—
——
2 81
4(3
78)
2 43
5A
s of D
ecem
ber
31, 2
014
441
297
846
22 0
6587
9 84
9(1
98 0
32)
(125
210
)(8
32)
133
577
973
6 31
858
4 29
1D
isco
untin
g fo
r pen
sion
s com
mitm
ents
Oth
er c
ompr
ehen
sive
inco
me
for t
he p
erio
d—
——
—(4
4 75
9)(5
93)
(133
)(4
5 48
5)37
5(4
5 11
0)N
et lo
ss fo
r the
per
iod
——
—(7
3 77
3)—
——
(73
773)
(7 0
51)
(80
824)
Con
solid
ated
com
preh
ensi
ve lo
ss fo
r th
e pe
riod
——
—(7
3 77
3)(4
4 75
9)(5
93)
(133
)(1
19 2
58)
(6 6
76)
(125
934
)Sh
are-
base
d pa
ymen
ts—
—45
1—
——
—45
1—
451
Initi
al p
ublic
off
erin
g ex
pens
es—
—(1
82)
——
——
(182
)—
(182
)O
ther
mov
emen
ts(6
9)(6
9)3
(65)
As o
f Jun
e 30
, 201
544
1 29
7 84
622
065
880
118
(271
874
)(1
69 9
69)
(1 4
25)
—45
8 91
5(3
55)
458
561
Doc 3 Pa EDGAR :Redline:OFF-99.2 Cnova N.V. - semi-annual report5538 c:\jms\105538\15-15853-1\task7499451\15853-1-MO-09.pdf
Chksum: 800971 Cycrrill Corporation 15-15853-1 Wed Jul 22 21:49:27 2015 (V 2.4m-2-P94780CHE)
NOTES TO THE UNAUDITED INTERIM CONDENSED CONSOLIDATEDFINANCIAL STATEMENTS
Description of reporting entity and basis of preparation of Cnova consolidated financial statements
On June 4, 2014, the boards of directors of Casino Guichard-Perrachon S.A. (“Casino”), a public company in France, Companhia Brasileira de Distribuiçao (“CBD” or “GPA”), a controlled subsidiary of Casino and a public company in Brazil and in the United States, Via Varejo S.A. (“Via Varejo”), a controlled subsidiary of GPA and a public company in Brazil, Almacenes Éxito S.A. (“Éxito”), a controlled subsidiary of Casino and a public company in Colombia have agreed the financial and legal conditions of the transfer of their respective eCommerce business, mainly operated by Cdiscount S.A. (“Cdiscount”) in France, by Nova Pontocom Comércio Eletrônico S.A. (“Nova Pontocom”) in Brazil under a newly incorporated Dutch holding company, Cnova N.V. (“Cnova”), and to list Cnova in the United States stock market, while retaining control of Cnova (the “Cnova reorganization”). For more information on the Cnova reorganization refer to the Description of reporting entity and basis of preparation of Cnova consolidated financial statements on the 2014 consolidated financial statements.
After completing as initial public offering on the Nasdaq on November 19, 2014, Cnova losted its shares on Euronext Paris on January 23, 2015.
Note 1 Basis of preparation and changes to Cnova accounting policies
Cnova N.V. is a public limited liability company incorporated and domiciled in the Netherlands. The Group consists of leading global eCommerce operations. Operations are performed essentially in Brazil and France, with recently launched operations in Colombia, Thailand, Vietnam, Ecuador, Belgium, in 2014 and Burkina Faso, Cameroon, Ivory Coast, Mali and Senegal in 2015.
The Group interim condensed consolidated financial statements of Cnova and its subsidiaries (collectively, the Group) for the six months ended June 30, 2015 were authorized for issue in accordance with the resolution of the Board of Directors on July 21, 2015.
The interim condensed consolidated financial statements for the six months ended June 30, 2015 have been prepared in accordance with IAS 34 Interim Financial Reporting.
The interim condensed consolidated financial statements do not include all the information and disclosures required in the annual consolidated financial statements, and should be read in conjunction with Cnova’s consolidated financial statements as of and for the years ended December 31, 2012, 2013 and 2014.
New standards, interpretations and amendments adopted by the Group
The accounting policies adopted in the preparation of the interim condensed consolidated financial statements are consistent with those followed in the preparation of Cnova’s annual consolidated financial statements as of and for the year ended December 31, 2014, except for the adoption of new standards and interpretations effective as of January 1, 2015.
As required by IAS 34, the nature of these changes are disclosed below. However, they do not impact the annual consolidated financial statements of Cnova or the interim condensed consolidated financial statements of Cnova at the end of the reporting period.
The nature of these new standards or amendments are described below:
Annual improvements cycle 2010-2012 Annual improvements cycle 2011-2013 IAS 19 “Defined Benefits Plans: Employees Contributions”.
The Group has not early adopted any other standard, interpretation or amendment that has been issued but is not yet effective.
F-25

NOTES TO THE UNAUDITED INTERIM CONDENSED CONSOLIDATEDFINANCIAL STATEMENTS (Continued)
Note 2 Earnings per share
Following the completion of the Cnova reorganization, the earnings per share of the 6-month period ended June 30, 2014 disclosed in the interim financial statements is computed based on the number of the Cnova shares resulting from the retrospective accounting of the Cnova reorganization.
The weighted average number of ordinary shares before dilution was 411,455,569 and 442,617,845 (including 1,319,999 awards of deferred stock units granted to certain executives and employees of Cnova which are non-forfeitable) as of June 30, 2014 and 2015 and the net loss attributable to equity holders of Cnova amounted to €(39,473) thousand and €(73,773) thousand as of June 30, 2014 and 2015, respectively.
No dilutive or potentially dilutive instruments have been issued or granted by Cnova as of June 30, 2014 and 2015.
Note 3 Business combinations and equity transactions
From January 1, 2015 to June 30, 2015, the Group did not enter into any business combination or equity transaction.
Note 4 Seasonality of interim operations
The Group does not earn revenues and incur expenses evenly throughout the year, with a traditional peak demand around the end of the year. Additionally, the France segment historically experiences higher sales volume during January and July, the two seasonal sales periods in the country, and the Brazil segment historically experiences higher sales volume during January, May and August, during which time early year sales and local holidays are celebrated.
Note 5 Operating segments
Key indicators by operating segment
(i) of which depreciation, amortization and impairment €5.3 million for Cdiscount and €0.5 million for Cnova Brazil in 2015 (2014: €1.2 million for Cdiscount and nil for Cnova Brazil).
F-26
€ thousands June 30, 2014 June 30, 2015Net sales 1,533,261 1,752,158
Cnova Brazil 847,096 962,207Cdiscount France 686,165 772,341Cdiscount International — 17,610
Segment operating profit (loss) before Restructuring, Litigation, Initial public offering expenses, Gain (loss) from disposal of non-current assets and Impairment of assets (i) 1,334 (51,701)Cnova Brazil 15,216 (17,135)Cdiscount France (13,883) (15,273)Cdiscount International — (14,433)Holdings — (4,859)

Geographical information
Considering the nature of the business, there is no major customer to report. Revenues by group of similar products or services are not available from the accounting system and the cost to develop this information would be excessive.
Reconciliation to financial statements
F-27
€ thousands June 30, 2014 June 30, 2015Net sales 1,533,261 1,752,158
France 686,165 772,341Brazil 847,096 962,207Other — 17,610
€ thousands December 31, 2014 June 30, 2015Non-current assets 827,574 808,337
France 188,371 192,087Brazil 622,008 592,782Other 17,195 23,468
€ thousands June 30, 2014 June 30, 2015Segment operating profit (loss) before Restructuring, Litigation, Initial public
offering expenses, Gain (loss) from disposal of non-current assets and Impairment of assets 1,334 (51,701)
Restructuring (8,876) (11,677)Litigation (410) (1,396)Initial public offering expenses (4,800) (3,812)Gain (loss) from sale of non-current assets (23) (533)Impairment of assets — (6,477)Operating loss (12,776) (75,595)Finance income 3,238 22,500Finance costs (35,539) (42,686)Loss before tax (45,077) (95,781)Income tax gain (expense) 6,550 14,957Share of losses of associates (1,418) —Net loss (39,945) (80,824)

NOTES TO THE UNAUDITED INTERIM CONDENSED CONSOLIDATEDFINANCIAL STATEMENTS (Continued)
Note 6 Operating profit before restructuring, litigation, initial public offering expenses, gain/(loss) from disposal of non-current assets and impairment of assets
Net sales
Cost of sales
Expenses by nature and function
F-28
€ thousands June 30, 2014 June 30, 2015Product sales 1,483,749 1,667,350Marketplace sales (commissions) 16,970 39,784Other revenues 32,542 45,024Net sales 1,533,261 1,752,158
€ thousands June 30, 2014 June 30, 2015Purchases and shipping costs (1,307,615) (1,597,834)Change in inventories (22,718) 66,443Cost of sales (1,330,332) (1,531,392)
€ thousands Fulfillment MarketingTechnologyand content
General andadministrative
June 30,2014
Employee benefits expense (17,836) (4,055) (18,367) (10,817) (51,075)Other expenses (83,017) (25,753) (12,387) (15,878) (137,035)Depreciation and amortization expense (3,034) (1,971) (8,283) (197) (13,485)Total as of June 30, 2014 (103,887) (31,779) (39,037) (26,892) (201,595)
€ thousands Fulfillment MarketingTechnologyand content
General andadministrative
June 30,2015
Employee benefits expense (42,999) (5,412) (21,757) (15,947) (86,114)Other expenses (96,048) (33,545) (14,338) (22,535) (166,466)Depreciation and amortization expense (4,506) (1,733) (13,592) (56) (19,886)Total as of June 30, 2015 (143,552) (40,690) (49,686) (38,537) (272,466)

NOTES TO THE UNAUDITED INTERIM CONDENSED CONSOLIDATEDFINANCIAL STATEMENTS (Continued)
Note 6 Operating profit before restructuring, litigation, initial public offering expenses, gain/(loss) from disposal of non-current assets and impairment of assets (Continued)
The following table presents the breakdown of other fulfillment costs, other marketing costs and other technology and content costs:
Note 7 Restructuring
As of June 30, 2015, restructuring expenses were €11.7 million, consisting mostly of costs related to reorganization and opening of warehouses in France and Brazil (€3.2 million), costs related to adapting the workforce to the environment of a listed company (€2.3 million) and strengthening the efficiency and documentation of our processes and controls to comply with the Sarbanes-Oxley Act (€0.8 million).
Note 8 Litigation
As of June 30, 2015, litigation expense consists of a €1.4 million expense related to disputes with suppliers and to a tax litigation at Cdiscount.
Note 9 Initial public offering expenses
As of June 30, 2015, costs incurred in connection with our initial public offering of November 2014 and subsequent listing on Euronext Paris in 2015 and recorded through income amounted to €3.8 million, related primarily to the Reorganization and the restructuring in the governance and management of Cnova, and were expensed in the income statement. These costs include notably fees and legal expenses for €2.3 million and specific bonuses for €1.3 million.
The incremental expenses directly attributable to the offering of new shares of Cnova in the IPO of Cnova on the NASDAQ were recorded through equity for an amount of €46 million before tax (€34.6 million after tax) at the end of 2014. They consist mainly of legal, financial, accounting and printing fees associated with drafting and filing the registration statement of Cnova.
F-29
€ thousands June 30, 2014 June 30, 2015Operation of fulfillment centers (47,769) (52,799)Payment processing (22,635) (26,790)Customer service centers (7,066) (12,357)Other fulfillment costs (5,547) (4,103)Fulfillment costs (83,017) (96,048)Online and offline marketing costs (24,511) (32,435)Other marketing costs (1,241) (1,110)Marketing costs (25,752) (33,545)Technology infrastructure (11,729) (14,104)Other technology and content costs (658) (234)Technology and content costs (12,387) (14,338)

NOTES TO THE UNAUDITED INTERIM CONDENSED CONSOLIDATEDFINANCIAL STATEMENTS (Continued)
Note 10 Financial income and expense
Interest expense related to GPA loan (included in caption “Interest expense on borrowings”) was €490 thousand as of June 30, 2015 and €3,696 thousand as of June 30, 2014. This GPA loan was retained on July 21, 2014 by Nova Holding as part of the Cnova reorganization (refer to the “Description of reporting entity and basis of preparation of Cnova consolidated financial statements in the consolidated financial statements for the year ended December 31, 2014”).
Interest on current accounts with Casino (included in caption “Other financial expenses”) was €559 thousand as of June 30, 2015 and €191 thousand as of June 30, 2014.
Other financial income include a €7.1 million credit resulting from to the monetary actualization of a tax credit recognized in 2014.
Note 11 Taxes
Income tax expense
Analysis of income tax expense:
(i) Include CVAE which is a French tax expense based on the value added. CVAE is considered to meet the definition of a tax on income as defined in IAS 12.
F-30
€ thousands June 30, 2014 June 30, 2015Revenue from cash and cash equivalents 1,607 9,869Exchange gain 5 993Gain related to financial discounts obtained from suppliers 905 782Other financial income 721 10,856Total finance income 3,238 22,500Interest expense on borrowings (4,033) (1,548)Costs related to sales of receivables (26,281) (33,760)Exchange loss — (627)Other financial expense (5,225) (6,752)Total finance expense (35,539) (42,686)
€ thousands June 30, 2014 June 30, 2015Current taxes (214) (416)Other taxes on income (i) (604) (849)Deferred taxes 7,368 16,223Total income tax profit recognized in the income statement 6,550 14,957
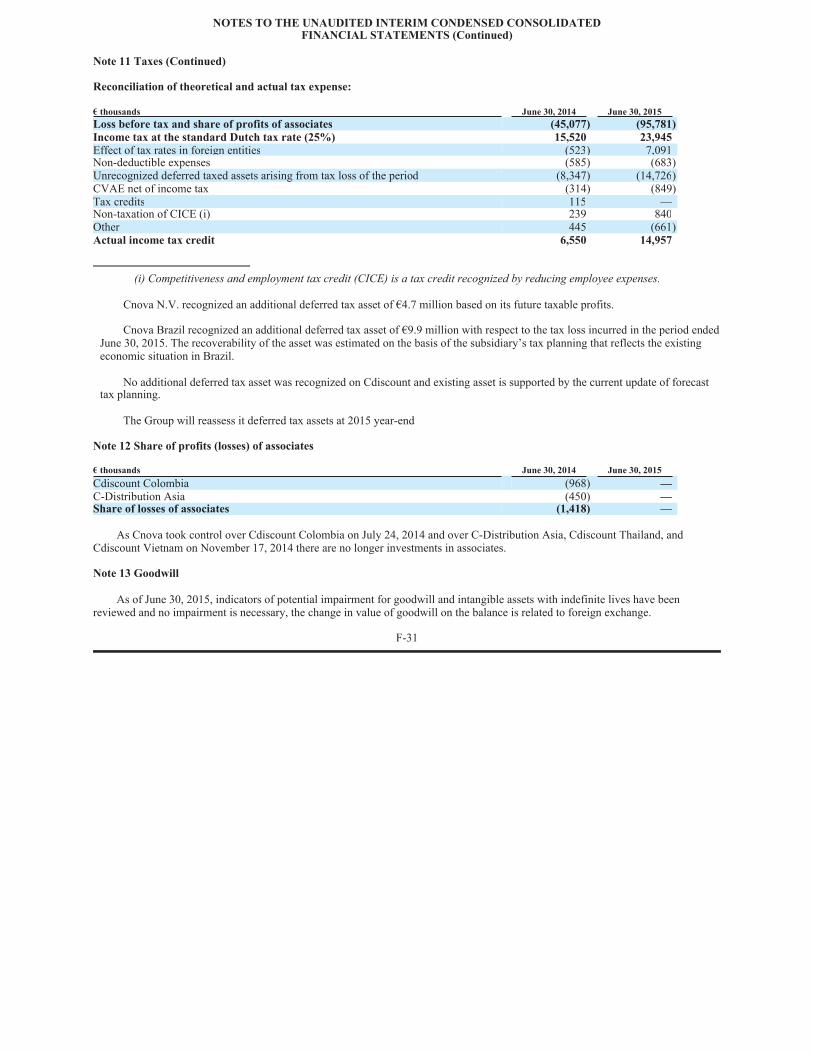
NOTES TO THE UNAUDITED INTERIM CONDENSED CONSOLIDATEDFINANCIAL STATEMENTS (Continued)
Note 11 Taxes (Continued)
Reconciliation of theoretical and actual tax expense:
(i) Competitiveness and employment tax credit (CICE) is a tax credit recognized by reducing employee expenses.
Cnova N.V. recognized an additional deferred tax asset of €4.7 million based on its future taxable profits.
Cnova Brazil recognized an additional deferred tax asset of €9.9 million with respect to the tax loss incurred in the period ended June 30, 2015. The recoverability of the asset was estimated on the basis of the subsidiary’s tax planning that reflects the existing economic situation in Brazil.
No additional deferred tax asset was recognized on Cdiscount and existing asset is supported by the current update of forecast tax planning.
The Group will reassess it deferred tax assets at 2015 year-end
Note 12 Share of profits (losses) of associates
As Cnova took control over Cdiscount Colombia on July 24, 2014 and over C-Distribution Asia, Cdiscount Thailand, and Cdiscount Vietnam on November 17, 2014 there are no longer investments in associates.
Note 13 Goodwill
As of June 30, 2015, indicators of potential impairment for goodwill and intangible assets with indefinite lives have been reviewed and no impairment is necessary, the change in value of goodwill on the balance is related to foreign exchange.
F-31
€ thousands June 30, 2014 June 30, 2015Loss before tax and share of profits of associates (45,077) (95,781)Income tax at the standard Dutch tax rate (25%) 15,520 23,945Effect of tax rates in foreign entities (523) 7,091Non-deductible expenses (585) (683)Unrecognized deferred taxed assets arising from tax loss of the period (8,347) (14,726)CVAE net of income tax (314) (849)Tax credits 115 —Non-taxation of CICE (i) 239 840Other 445 (661)Actual income tax credit 6,550 14,957
€ thousands June 30, 2014 June 30, 2015Cdiscount Colombia (968) —C-Distribution Asia (450) —Share of losses of associates (1,418) —

NOTES TO THE UNAUDITED INTERIM CONDENSED CONSOLIDATEDFINANCIAL STATEMENTS (Continued)
Note 14 Related party transactions
Related party transactions with parent companies
The following transactions were carried out with related parties (which are composed of Casino and its controlled subsidiaries):
Other related party transactions
Cdiscount SA- Distribution Casino France
On June 30, 2015, Cdiscount and Distribution Casino France (“DCF”) entered into an agreement pursuant to which Cdiscount (i) designed and created a tab on its website dedicated to the DCF e-commerce site named ‘Casinodrive’; and (ii) provides continuing maintenance services related to the tab. The term of this agreement is one year, and can be tacitly renewed for the same duration unless terminated by either party with three months prior notice.
Under the agreement Cdiscount received a €1.3 million upfront payment and will received a royalty of 10% of sales generated by customers coming from Cdiscount.com.
Cdiscount SA- Leaderprice Exploitation
On June 30, 2015, Cdiscount and Leaderprice Exploitation (“Leaderprice”) entered into an agreement pursuant to which Cdiscount (i) designed and created a tab on its website dedicated to the Leader Price e-commerce site named ‘Leaderdrive’; and (ii) provides continuing maintenance services related to the tab. The term of this agreement is one year, and can be tacitly renewed for the same duration unless terminated by either party with three months prior notice.
Under the agreement Cdiscount received a €1.3 million upfront payment and will received a royalty of 10% of sales generated by customers coming from Cdiscount.com.
Cdiscount SA- Distribution Casino France
On June 30, 2015, Cdiscount and Distribution Casino France (“DCF”) entered into an agreement pursuant to which Cdiscount is granted a fee calculated on the basis of its volume contribution out of the total purchasing volume made with DCF with non-food suppliers. As such, DCF compensates Cdiscount for its improving purchasing financial conditions due to the volumes amalgamation. The term of this agreement is 10 years, and can be tacitly renewed for subsequent 5 year periods unless terminated by either party with two years prior notice.
Under the agreement Cdiscount will receive a fee of €0.5 million as of June 30, 2015.
Prior to the entering into of the above mentioned Related Party Transactions, Grant Thornton reviewed all material terms that it believed should be considered in determining whether a transaction is on arm’s-length terms, including pricing, duration and termination provisions. Grant Thornton’s review was performed under International Standard on Assurance Engagements 3000 and concluded that no material element existed that would preclude the determination that each such related party transaction was entered into on arm’s-length terms and in accordance with the Company’s RPT-policy, taking into account all material aspects of each transaction.
F-32
December 31, 2014 June 30, 2015€ thousands Transactions Balances Transactions BalancesLoans due from Parent Company 3,662 71,146 (66,905) 4,241Receivables 60,977 63,920 (28,942) 34,978Loan due to Parent Companies 5,701 105,205 246,581 351,786Payables 42,872 96,646 (11,690) 84,956Expense 130,141 — 71,096 —Income 45,614 — 20,918 —