Embed Size (px)
Citation preview
This PDF is a selection from an out-of-print volume from the National Bureauof Economic Research
Volume Title: Money in Historical Perspective
Volume Author/Editor: Anna J. Schwartz
Volume Publisher: University of Chicago Press
Volume ISBN: 0-226-74228-8
Volume URL: http://www.nber.org/books/schw87-1
Publication Date: 1987
Chapter Title: Secular Price Change in Historical Perspective
Chapter Author: Anna J. Schwartz
Chapter URL: http://www.nber.org/chapters/c7497
Chapter pages in book: (p. 78 - 109)
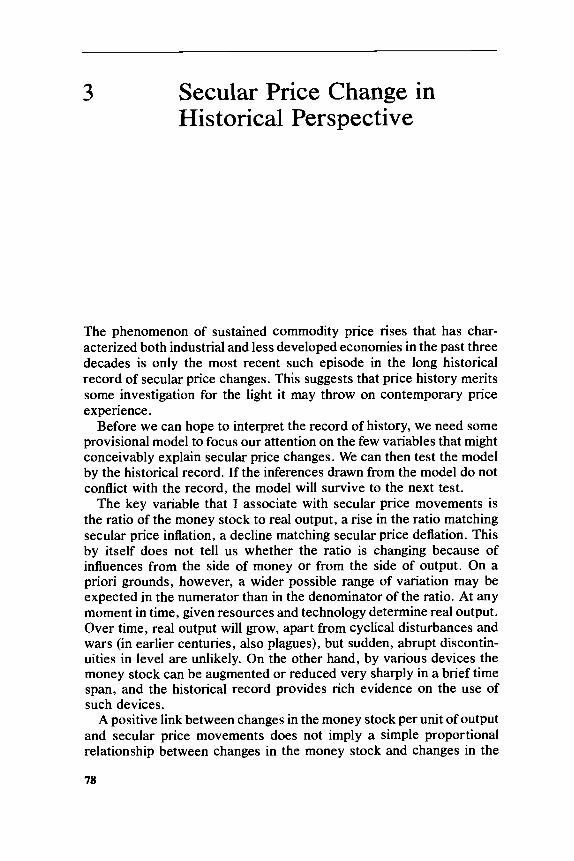
3 Secular Price Change in Historical Perspective
The phenomenon of sustained commodity price rises that has char- acterized both industrial and less developed economies in the past three decades is only the most recent such episode in the long historical record of secular price changes. This suggests that price history merits some investigation for the light it may throw on contemporary price experience.
Before we can hope to interpret the record of history, we need some provisional model to focus our attention on the few variables that might conceivably explain secular price changes. We can then test the model by the historical record. If the inferences drawn from the model do not conflict with the record, the model will survive to the next test.
The key variable that I associate with secular price movements is the ratio of the money stock to real output, a rise in the ratio matching secular price inflation, a decline matching secular price deflation. This by itself does not tell us whether the ratio is changing because of influences from the side of money or from the side of output. On a priori grounds, however, a wider possible range of variation may be expected in the numerator than in the denominator of the ratio. At any moment in time, given resources and technology determine real output. Over time, real output will grow, apart from cyclical disturbances and wars (in earlier centuries, also plagues), but sudden, abrupt discontin- uities in level are unlikely. On the other hand, by various devices the money stock can be augmented or reduced very sharply in a brief time span, and the historical record provides rich evidence on the use of such devices.
A positive link between changes in the money stock per unit of output and secular price movements does not imply a simple proportional relationship between changes in the money stock and changes in the
78

79 Secular Price Change in Historical Perspective
price level.' In addition, once a price movement establishes itself, it tends to be reinforced by its effect on expectations, rising prices leading to a rise in velocity, falling prices to a fall in velocity. Finally, although commodity price movements bear the initial impact of a secular change in money stock per unit of output, the impact then spreads to factor prices and to interest rates, as cooperating agents of production come to anticipate inflation or deflation. Thus, money wages tend to rise faster and interest rates tend to be higher during periods of secular price rise than of price fall.
Ideally, one would need data on money supply, real output, com- modity prices, money wages, and interest rates to test the model. Clearly, a full set of such data is unavailable except for recent decades for most countries. I propose, therefore, on the basis of admittedly unsatisfactory data the further back in time one goes, first, to sketch what evidence there is for past episodes of price change, in the process commenting on alternative models that have been suggested, and sec- ond, to draw some conclusions from this evidence.
The episodes I shall comment on cover a time span of 24 millenia, so I cannot pretend to give more than a very superficial account of material drawn from writings of specialized scholars of the past with rather different interests from mine. Chronologically the episodes may be divided into four periods: (1) from antiquity through the fourth century of the Christian era; (2) from the fifth through the fifteenth centuries-the Middle Ages; (3) from the sixteenth century to the Na- poleonic Wars; (4) from the nineteenth century through the early 1930s.
3.1 Antiquity
Three developments of Graeco-Roman times are relevant to this survey. One is the contrast between Greek and Roman monetary ar- rangements. The second is the monetary experience of the Hellenistic world following Alexander the Great's conquest of the Persians (330 B.c.). The third is the monetary crisis at the beginning of the 4th century A.D. in the Roman Empire.
a. From the fifth century B.c., Athenian silver coins of uniform fine- ness and weight became the prevailing standard not only among other Greek city-states but also among Attic trading partners in Asia Minor. Athens did not tamper with her coinage even when the state treasury was bare and when military needs were urgent. Rome, on the other hand, even when its monetary system was far less advanced than that of Greece, had a history of debasement. In the two centuries before the Punic Wars, it debased its copper coinage. During the next two centuries, when silver was introduced, it debased both silver and cop- per coinage and added an increasing amount of alloys to the dwindling
80 Anna J. Schwartz
amount of fine metals. Gold coins came into use at the beginning of the Empire in 30 B.C. For the next four hundred years, debasements were again the rule (Glotz 1926, pp. 230-37; Louis 1927, pp. 80-84,
Why Greek and Roman practice should have been so different I cannot say. There is evidence of persistent inflation under the Empire, but I cannot report that price stability characterized Classical Greece. The reason is that, though there are numerous relative price statistics, with one exception to which I shall refer in a moment, I do not know of reliable documentation of price level changes. The other bit of evi- dence related to the contrast in monetary arrangements between Greece and Rome is that interest rates on “normal” loans, comparable to modern personal loans, declined in Greece from 16 percent in 550 to 6 percent in 250 B.c., and then remained stable to 50 B.c.; whereas in the Roman Empire, they rose from 4 percent in A.D. 50 to over 12 percent by A.D. 250 (Homer 1963, p. 64; Louis 1927, pp. 317-18). There were clearly influences other than monetary arrangements af- fecting the levels of interest rates, but the contrasting trends in interest rates under the two regimes are in line with a dominant monetary effect.
b. The one case of a documented price level change in the annals of ancient Greece occurred as a consequence of Alexander the Great’s conquest of the Persian kingdom (330 B.c.) Immense hoards of Persian gold were introduced by him into the Greek economy, transforming a silver into a predominantly gold standard. Prices and wages increased not only in Greece but also throughout the Hellenistic empire, as gold coinage was diffused through trade in markets from India and Egypt to Western Mediterranean lands. There is some reason to believe that prices were more unstable during the aftermath of Alexander’s con- quests than in earlier or following centuries of antiquity (Michell 1946; Heichelheim 1935, pp. 1-2).
c. The Emperor Diocletian in A.D. 296 tried to reform the chaotic state of the Roman currency by introducing full-weight gold and silver coins and a new bronze coin. This action might have been expected to stabilize prices but an overwhelming increase in the money stock su- pervened. Two alternative explanations have been advanced to account for the sources of the increase. One is that it occurred in the supply of precious metals from three sources: from (1) Diocletian’s conquests in the East; (2) temple treasures that were dishoarded with the decline of paganism; and (3) private stocks transferred under compulsion to the imperial account. The last source would have contributed a net increase only if the Emperor coined metal transferred to his account that was not previously used in private transactions. This explanation has been rejected as unsubstantiated and replaced by one stressing that prices were fixed not in silver or in gold but in bronze (or copper). The
207-8, 313-18).

81 Secular Price Change in Historical Perspective
source of the increase in the money stock, on this view, was the man- ufacture of copper coins. In any event, a pronounced price inflation followed, which Diocletian attempted to repress by issuing in A.D. 301 an Edict on Maximum Prices. Of price ceilings covering 900 commod- ities, 130 grades of labor, and various freight rates, the sections of the Edict in existence list maximum prices for 100 articles and wages rang- ing from a common laborer’s to a lawyer’s, the penalty for exceeding the maximum being death for both buyer and seller. The system of price control was a failure. Numerous death penalties, disturbances in the labor market, and the disappearance of new output from the product market characterized the period until A.D. 305 that the price edict was in effect. In that year Diocletian abdicated (Mattingly 1928, pp. 217, 222-27,232-34; Michelll947, pp. 1-3; West 1951, pp. 300-301; Jones 1953).
3.2 The Middle Ages
For almost a thousand years there are no statistics for either com- modity prices or interest rates. Following the sack of Rome in 410, Western Europe was held by barbarian kingdoms. Barter transactions became common in domestic trade, while international trade declined. In the East, the Byzantine Empire, the successor of the Asiatic portion of the Roman Empire, revived the Classical Greek-tradition of an in- trinsically stable and uniform coinage, in this case, of gold. Its coinage became accepted in international trade. Not until the eighth century was the monopoly of Byzantine coins in international use broken. Then a new Moslem Arabic coin, the symbol of Arabic ascendance in Asia Minor, North Africa, and Spain, gained wide acceptability. In later medieval Europe, a variety of silver coins, issued by ecclesiastics, feudal lords, and kings-often debased-was in local use. By the thir- teenth century, with the expansion of trade, Italian merchant republics began to coin gold, the coin of Florence in particular becoming the favored means of international payment. Later in the century, gold coinage was established in France and, in the fourteenth century, also in England, Flanders, Castile and Aragon, and Germany (Spufford
Fragmentary price quotations, available for a few English and French commodities, indicate that prices were higher at the end than at the beginning of the thirteenth century. Even if it could be established that the movement is not a statistical artifact, the explanation of the rise would remain to be determined. Coinage, population, and output all increased over the century. Of these factors, presumably only the in- crease in coinage would be expected to raise the general level of prices. Interest rate quotations are too sporadic to suggest any trend.
1965, pp. 576-602).
82 Anna J. Schwartz
For the fourteenth century, price history is less scanty. The effect on prices of repeated changes in the silver coinage in France has been compared with that of relative stability of the silver coinage in England. The advantage of such an international comparison is that it enables one to treat as ceteris paribus contemporary nonmonetary factors, such as wars, famine, plague, and institutional changes, which can be shown to have had common effects on both countries, and to concentrate on the effects of monetary factors. Over the century, French kings ordered thirty-two changes in the maximum number of livres-the French unit of account until the Revolution-struck from a standard silver mark, the maximum number ranging from 2.9 to 125 livres per mark. The changes alternated between restorations and debasements of the me- tallic content of the coin. In the fourteenth century, by contrast, English alterations of silver money were relatively few and limited in size. If for each year, a comparison is made between the maximum price of wheat quoted in each country (actually, prices in the vicinity of Ox- fordshire and in Chartres and Paris), on the assumption that it was the maximum that was paid in the most debased money, the movements of the French and English series, each expressed in the monetary units in which they existed, with no reference to the metal content of the unit of account, are usually diverse. However, when the prices in each country are expressed in money of constant metallic value and the units made comparable between the two, the movements of the two series are similar enough to suggest that French prices fully adjusted to al- terations of the coinage, whether there was peace or war, famine or plenty, military success or failure (Miskimin 1963, pp. 37-38, 47, 82).
The comparative analysis is of particular interest, in view of difficulty in reconciling money supply and price estimates in the case of alter- ations of English coinage in the sixteenth century. Before turning to that episode, let me summarize the evidence on price and wage trends at the close of the Middle Ages in France, England, and three Spanish provinces that were then independent kingdoms (table 3.1). A price rise in the third quarter of the fourteenth century was the result of a sharp decline in population and output, due to the spread of bubonic plague through Europe, while the supply of money was increasing. The sources of that increase included the discovery of gold in Silesia and Hungary; an increase in trade with goldmining countries of north- western Africa; debasement of, and a rise in money of account values assigned to, existing coinage. In the final quarter of the fourteenth century the trend of prices was declining, though Navarre is an excep- tion; the price rise there is attributable to deliberate monetary expan- sion that offset a decline in prices quoted in gold. Elsewhere, the decline in prices reflected the resumption of vigorous population growth, and an increase in output, with no significant change in the money supply. The downward pressures on the price level were exacerbated in the

83 Secular Price Change in Historical Perspective
Table 3.1 Comparison of Rates of Change in Prices and Money Wages in Selected Countries at the Close of the Middle Ages (in Money of Account, Percent Per Year)
England France Aragon Navarre Valencia Series and Period (1) (2) (3) (4) (5) ~~~~~~ ~~
Prices: 1326-50 to 1351-75 1.2 1.9 3.6 2.4 1351-75 to 1376-1400 - 1.0 -0.9 -1.0 2.1 1376-1400 to 1476-1500 0 0 0 -0.1
Money wages: 1326-50 to 1351-75 1.3 1.9 2.4 1351-75 to 1376-1400 0.1 -0.5 3.1 1376- 1400 to 1476- 1500 0.2 0.4 0
Source: (by column): (1) Phelps Brown and Sheila Hopkins, 1956, pp. 311-12. Prices refer to a “composite
unit of consumables” ; wages refer to builders’ wages in Southern England. Quarter-century averages were computed from annual figures for prices and real wages. Annual figures for the latter are lacking in some cases. Money wages were computed by multiplying real wages by the price indexes.
(2) Phelps Brown and Sheila Hopkins, 1957, p. 305. Original source is Viscomte d’Avenel (Histoire Economique de la PropriCtC, des Salaires, des DenrCes, et de Tous Prix en Gdndral, Paris, 1894- 1926, Vols. I-VII), on the basis of whose collection, index numbers were constructed by Georg Wiebe, Zur Geschichte der Preisrevolution des XVI and XVII Jahrhunderts, Leipzig, 1895. Prices refer to composite unit of consumables; wages refer to builders’ wages.
(3-5) Hamilton, 1936a, pp. 59, 105, 162 (prices), 74, 115, 183 (wages). Quarter-century averages were computed from annual figures. For Aragon, a single annual figure is available for the first two quarter-centuries, with occasional gaps thereafter in the price series. Wages are reported beginning the last quinquennial of the 14th century. For Navarre, index numbers for prices are limited to only three, and for wages are limited to only one annual figure for the first quarter-century. The series for prices ends in 1445, for wages, in 1450. For Valencia, prices and wages are available beginning in the last decade of the 14th century. Note: Rate of change is the difference between the natural logarithms of the average values of index numbers of the terminal and initial periods divided by the time interval between their mid-points.
fifteenth century by the spread of the money economy and specie flows to the Far East in payment for spices and luxury goods, yet general price stability characterized the period. Debasements and the marking- up of existing coinage apparently offset the deflationary forces (Ham- ilton 1936a, pp. 124-28, 193-204).
Money wages also rose as the Black Death struck, and continued to rise or decline less than prices over the next century and a quarter. Again, it is difficult to determine a trend in interest rates from the available quotations.
3.3 From the Sixteenth to the Close of the Eighteenth Century
For the English experiment in the sixteenth century with alterations of the coinage, estimates of the money supply and the price level are
84 Anna J. Schwartz
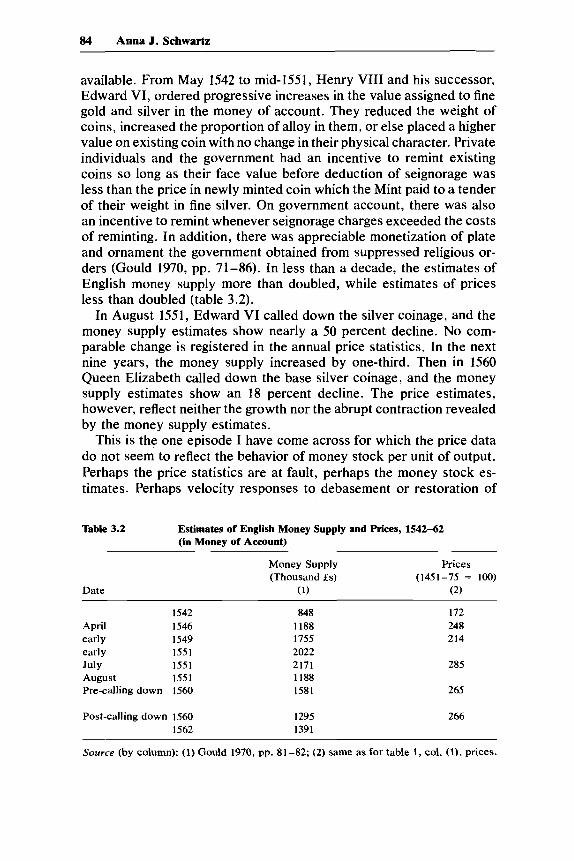
available. From May 1542 to mid-1551, Henry VIII and his successor, Edward VI, ordered progressive increases in the value assigned to fine gold and silver in the money of account. They reduced the weight of coins, increased the proportion of alloy in them, or else placed a higher value on existing coin with no change in their physical character. Private individuals and the government had an incentive to remint existing coins so long as their face value before deduction of seignorage was less than the price in newly minted coin which the Mint paid to a tender of their weight in fine silver. On government account, there was also an incentive to remint whenever seignorage charges exceeded the costs of reminting. In addition, there was appreciable monetization of plate and ornament the government obtained from suppressed religious or- ders (Gould 1970, pp. 71-86). In less than a decade, the estimates of English money supply more than doubled, while estimates of prices less than doubled (table 3.2).
In August 1551, Edward VI called down the silver coinage, and the money supply estimates show nearly a 50 percent decline. No com- parable change is registered in the annual price statistics. In the next nine years, the money supply increased by one-third. Then in 1560 Queen Elizabeth called down the base silver coinage, and the money supply estimates show an 18 percent decline. The price estimates, however, reflect neither the growth nor the abrupt contraction revealed by the money supply estimates.
This is the one episode I have come across for which the price data do not seem to reflect the behavior of money stock per unit of output. Perhaps the price statistics are at fault, perhaps the money stock es- timates. Perhaps velocity responses to debasement or restoration of
Table 3.2 Estimates of English Money Supply and Prices, 1542-62 (in Money of Account)
Money Supply hices (Thousand f s ) (1451-75 = loo)
Date (1) (2)
1542 848 172 April 1546 1188 248 early 1549 1755 214 early 1551 2022 July 1551 2171 285 August 1551 1188 Pre-calling down 1560 1581 265
Post-calling down 1560 1562
1295 1391
266
Source (by column): (1) Gould 1970, pp. 81-82; (2) same as for table 1, col. (l), prices.
85 Secular Price Change in Historical Perspective
the currency produced offsetting effects. Did debasement encourage increased holding of existing coinage and a reduction in goods pur- chases, and did restoration encourage the opposite tendency? How- ever, until one or another of these explanations is tested and found satisfactory, this episode must be regarded as a contradiction to the basic hypothesis.
It has been suggested that debasements and coinage restorations should not be regarded as capricious actions taken by governments for revenue reasons, but instead as possibly stabilizing if debasements were instituted during periods when prices would otherwise have declined and restorations when prices would otherwise have risen. At the time the Great Debasement of 1546-51 began, prices in England had been rising at an annual rate of 1.3 percent per year since the turn of the century, although prices during the decade of the 1530s were relatively stable. Pursuing this line, one could argue that the intention of de- basement was to insure the continuance of rising prices and of coinage restoration to slow the rate of price rise; hence both were stabilizing.
The episode of the Great Debasement in England occurred during the course of a price rise that marked the sixteenth and early seven- teenth century in Europe, known as the Price Revolution. Compared with modern experience, the annual rates of price rise in various coun- tries over this time span hardly seem to warrant such a designation. The price statistics, however, are often not expressed in terms of cur- rent coinage but are reduced to a silver basis, to facilitate comparison among countries. After correcting for the varying premium on silver, the price statistics show more modest rates of rise then would be the case if they were expressed in current coinage. For France, rates of change in prices expressed in money of account can be compared with the corresponding rates when prices are expressed in silver. For En- gland, a similar comparison may be less reliable because the underlying indexes are not the same. In any event, table 3.3 shows both sets of results.
For Spain, for which the most detailed price statistics on a silver basis are available, and the country where the Price Revolution first occurred, the continuously compounded rate of rise from the first de- cade of the sixteenth to the first decade of the seventeenth century is 1.2 percent. For other European countries, for which statistics are less complete, the comparable annual rates of price rise are 1.0 (France and England) and 0.8 (Saxony). Expressed in money of account, the price rises for France and England are converted to 2.1 and 1.7 percent per year, respectively. Money wage rates also rose during the sixteenth century, on a silver basis in Spain, at 1.1 percent per year through the closing decade (at 1.3 percent if the following decade is included); in terms of current coinage in France and England, at 1.1 percent per

86 Anna J. Schwartz
Table 3.3 Comparison of Rates of Change in Prices and Money Wages in Selected Countries during the Price Revolution (Percent per Year)
Prices Money Wages
in in Money in in Money Country and Period Silver of Account Silver of Account
Spain:
France:
England:
1. 1501-10 to 1601-10 1.2 1.3
2. 1501-25 to 1576-1600 1 .o 2.1 0.3 1.1
3. 1501-10 to 1593-1602 1 .o 1.7 0.3 0.8 4. 1501-10 to 1581-90 1.5 1.4
5. 1476-1500 to 1591-99 0.8 Saxony:
Source (by line): II. 1-3 and 5, prices and money wages in silver, from Hamilton 1929, pp. 352 (England) and 353 (France); Hamilton 1934, pp. 271 and 403 (Spain) and 209 (Saxony). The original source of the English figures is Thorold Rogers (A History of Agriculture and Prices in England, Oxford, 1882-87, Vols. III-VI), on the basis of whose collection Georg Wiebe (see table 1, col. 1) constructed index numbers. 1. 2, prices and money wages in money of account, same as for Table 2.1, col. 2. 11. 3-4, prices and money wages in money of account, same as for table 2.1, col. 1. Note: Same as for table 2.1.
year in the former, 1.4 percent in the latter through the ninth decade of the sixteenth century, following which money wages were essentially unchanged. Such interest rate quotations as exist suggest a sharp rise in their level during the course of the century.
Let me digress from price history for a bit to discuss the two broad explanations of the Price Revolution that have coexisted from the time its impact was first recognized by contemporaries. One explanation traced the price rise to an initial increase beginning in the last quarter of the fifteenth century in European silver output, which was dwarfed in the next century by an influx first of gold and later of silver from the Spanish possessions in the New World (Nef 1941, pp. 585-86; Hamilton 1934, pp. 293-302). By 1660, the close of the period of Span- ish imports, the European stock of gold had nearly doubled, and the stock of silver had increased three and two-fifths times (Brenner 1961).*
The precious metals that reached Spain first were dispersed to other European countries by unfavorable trade balances in Spain, due to the earlier impact of the increase in money supply on its prices, and by military expenditures and administrative expenses incurred in main- taining the Spanish empire. Hence the widespread scope of the Price Revolution. The extent of the price rise in individual countries varied
87 Secular Price Change in Historical Perspective
with the size of specie inflows, the amount diverted to nonmonetary uses, the relative growth of output, and the spread of the money economy.
The second explanation traced the price rise to nonmonetary factors. The Spanish price rise in the sixteenth century was ascribed to an expansion of European demand for Spanish wool and other products, the cessation of the price rise in the seventeenth century to ruinous taxation, agricultural decay, depopulation, and malfeasance of busi- nessmen (Hamilton 1929).
Several economic historians have seized on the second type of ex- planation. One objection they have raised against the monetary expla- nation is that it has to be shown that the increase in Spain’s stock of metals actually was dispersed through Europe, as asserted. The basis for this objection is the absence of a rise after the middle of the sixteenth century in figures for the quantity of woollen cloth exports from the port of London, the argument being that if there were an outflow of specie from Spain, England should have had a favorable balance of trade. _However, the woollen cloth exports are quantity figures, for which no export prices are available; the port of London was evidently declining, while other ports were rising in importance; and, finally, no value figures exist for imports; so no balance of trade data can be cited in support of the challenge. A second objection is that prices were rising before American treasure could have had an appreciable effect. The rise in European silver output beginning in the last quarter of the fifteenth century, to which reference has been made, disposes of this point. A third objection is that if there were an increase in the money supply, the increase in volume of trade should have offset it. The answer is that the increase in the money supply was far greater than the increase in output. A fourth objection is that if the increase in the money supply produced the price change, why were there not similar effects on prices of all commodities and services. The question indeed is turned around: since some prices rose sharply, others rose less markedly, and still other prices fell, how could monetary increase possibly be a common explanation for the diversity? The preceding objection is grouped with a final one, namely, demographic changes can account for the differ- ential price changes without invoking monetary factors at all (Brenner 1961, 1962; Gould 1964; Hammarstrom 1957).
The theory of a causal relation between population and prices dis- tinguishes between agriculture and industrial prices. Given an increase in population and inelastic agricultural supply and demand, two con- sequences are deduced: (1) food prices rise sharply; (2) the increase in the labor force finds industrial employment, so industrial output rises, but as residual income left to wage-earners after providing themselves with food is limited, demand for industrial output is weak. Conse-
88 Anna J. Schwartz
quently, prices of agricultural goods with inelastic demand and supply rise more sharply than prices of elastic industrial goods. Accordingly, periods of secular population increase can be linked with periods of rising prices, periods of declining population with periods of stable or falling prices.
The difficulty with this analysis is that it cannot explain why industrial prices rise at all during periods of population increase; under the stated conditions, they should fall. Moreover, although it is alleged that in periods of declining population, supplies of food were plentiful and cheaper because marginal lands were abandoned, the theory cannot account for the rise in prices in the third quarter of the fourteenth century that accompanied the decline in population at the time of the Black Death.
In any case, changes in relative prices tell us nothing about changes in the aggregate. Economic historians frequently display a bias against aggregates, in part, possibly, because aggregate data are lacking for past centuries. A charge they level against monetary analysis is that it deals only with aggregates. In addition, as noted, they allege that a monetary explanation to be valid implies a similar monetary effect on all prices. This is true but it does not follow that all prices will therefore move in unison. The common monetary effect has superimposed on it forces that affect relative prices. For particular commodities, the fac- tors affecting relative prices may be far more important than the com- mon monetary effect. However, the price of commodity X, for example, can double with respect to commodity Y by the absolute price of X doubling and the price of Y staying the same, or by the absolute price of X staying the same and the price of Y halving, or by any of an infinite number of other combinations. No amount of information on the factors affecting the relative prices of X and Y can explain which of these alternatives will occur. That is the role of aggregate analysis. To resume the description of the course of prices in the seventeenth
century, Spanish prices reached a peak in the first decade of the sev- enteenth century, while English and French prices continued to rise until the middle of the century, in the French case with an interruption in the upward movement from 1600 to 1625. Up to 1650 a composite price index for all of Spain is available; thereafter only separate regional indexes exist (see table 3.4). The different behavior of Valencian and Castilian prices in the second half of the seventeenth century is of some interest. Prices in Valencia were declining from mid-century on, but they rose steeply in New Castile until 1680 and then reversed movement to the end of the century. The difference reflects the independent mon- etary system in Valencia, where the money of account was virtually constant in terms of silver during the period, while Castilian money was progressively debased and overissue of fractional coins drove the

Table 3.4 Comparison of Rates of Changes in Prices and Money Wages and Nominal Interest Rates, in Selected Countries during the 17th and 18th Centuries
Prices Money Wages Yields on Long-Term
in inMoney in in M~~~~ Government Silver of Account Silver of Account Skmhies
Country and Period (Percent per Year) per Year) (Percent per Year
Spain:
Valencia:
1. 1601-10 to 1641-50 -0.1
2. 1651-55 to 1686-90
4. 1721-25 to 1746-50 3. 1701-05 to 1721-25
5. 1751-55 to 1786-90
New Castile: 6. 1656-60 to 1676-80 7. 1676-80 to 16%-1700 8. 1701-05 to 1721-25 9. 1721-25 to 1746-50
10. 1756-60 to 1786-90
-0.8 -0.2
0.4 0.7
2.0 - 2.3 -0.4
0.3 1 .o
0.3
0.4a 0.3

Table 3.4 (continued)
Prices Money Wages Yields on Long-Term
in in Money in in M~~~~ Government
Silver of Account Silver of Account Securities
Country and Period (Percent per Year) per Year) (Percent per Year
England: 11. 1593-1602 to 1643-52
13. 1593-1602 to 1710-19 14. 1693-1702 to 1731-40 15. 1731-40 to 1781-90
12. 1643-52 to 1693-1702
16. 1710-19 to 1781-90 France:
17. 1576-1600 to 1601-25 18. 1601-25 to 1626-50 19. 1626-50 to 1676-1700
20. 1726-50 to 1751-75 American Colonies:
0.6 0.6 0 0
0.3
0.8 0.3
- 0.5
-1.1 -0.7 1 .O 1.6
-0.1 0
1.2
0.7 0.6
0.5
0.3 0.4
0 0.2 0.5 0.8 0 0.5
Source (by line): 1. I , same as for table 3.3, line 1. 11. 2-5, Hamilton 1947, pp. 121, 141, 157 (prices). Only fragmentary wage figures are given (p. 21 1). II . 6-10, same as for lines 2-5, except money wage figures are given, beginning 1737 (p. 208). 11. 11-16, prices and money wages, same as for table 3.3, lines 1 and 3-4; line 15, yields, Homer 1963, pp. 161-62. II. 17-19, same as for table 3.3, lines 1-2.1. 20, Warren and Pearson 1932, pp. 7-8. Note: Same as for table 3.1. "1737-40 to 1746-50.
91 Secular Price Change in Historical Perspective
precious metals out of circulation. The premium on silver in Castile quintupled between 1650 and 1680, when the inflation was abruptly halted (Hamilton 1947, pp. 27-32, 1121). The military, political, and economic decline of Spain during the seventeenth century is apparently not unrelated to the monetary disorders in Castile. In the eighteenth century, Spanish prices moved downward moderately until 1725, and the rose at a rate of under 1 percent per year until the closing decade. From 1650 to 1740, English prices moved within a narrow range, al- ternately rising and falling at rates well under l percent per year until the half-century before the outbreak of the Napoleonic Wars, when they rose at 8 percent per year.
Although it did not involve a secular change in the price level, let me interject a comment here on the British recoinage toward the end of the seventeenth century. Two kinds of silver coin were then in use, hammered ones minted before 1663 and milled ones introduced there- after. Hammered coins differed in weight when issued, were easily clipped, and wore down in use. The milled coins were more uniform when issued, resisted clipping because of the raised and grooved rim, and did not show wear. By the early 1690s, the contrast between the condition of the two kinds of coin eroded confidence in the clipped and worn ones. In the second half of 1695, the efforts of holders of these coins to exchange them for gold guineas and commodities led to a rise in the sterling value of the guineas from twenty-one to thirty shillings, and an increase in the monthly prices of a sample of nonagricultural commodities at an annual rate of 23 percent. The price rise was also a response to a 19 percent increase in the money supply in 1695 as coinage of gold guineas increased.
Finally, in December, 1695, the government took action. It demo- netized all clipped and worn silver coins as of February 1696, after which the Mint would accept them by weight only. The recall of the silver coinage to the Mint in 1696, without provision for prompt reissue of coin of standard weight and fineness, led to an abrupt reduction in the money supply in the first half of 1696. This effect was offset to some extent by the dishoarding of standard weight coins and by note issues of the Bank of England which suspended specie payments; money substitutes, for which there are no estimates, were also pressed into use. The monthly price data, in any event, declined at a 12 percent annual rate in the first half of 1696, reflecting not only the contraction in the money supply but also the unloading of stocks of commodities accumulated earlier. Thereafter, as the new coinage was disbursed by the Mint, the money supply grew slowly, reaching the same level in mid-1698 as in mid-1694. Since the monthly price data end in April 1697, we cannot trace the price change for the parallel period, but prices are rising at the time the series ends (Horsefield 1960; Letwin 1964; Ashton 1960).3
92 Anna J. Sehwartz
The French price series, which ends in 1700, follows a roughly similar course to that of the English series. One exception occurred in the eighteenth century, during the years 1716-20, when John Law’s ex- periment with banknote issues slightly more than doubled the volume of French currency. Commodity prices exhibited a similar rise, though money wages rose only 60 percent. This episode may be observed in the monthly data for Paris, but not for London, Madrid, or Philadelphia (Hamilton 1936b, pp. 62-70). Wholesale prices in the American Col- onies apparently increased from 1726-50 to 1751 -75 at an annual rate of 1.2 percent per year.
For the European countries, rates of change in money wages are shown for available dates and matching price changes are given (table 3.4). Money wages sometimes rose faster than prices, sometimes slower. Depending on the initial and terminal dates chosen, the pattern shifts, but in general the wage data show movements paralleling commodity prices. The trend of the spotty interest rate data in the seventeenth century is downward. Beginning 1727 yields on long-term British gov- ernment securities are available. They are remarkably similar in move- ment to British commodity price changes (Homer 1963, pp. 161-62).
Our statistical information regarding the monetary experience of the American colonies is sketchy, so it is difficult to determine the extent to which it conforms to the money-output-price relationship I have been describing. From 1720 to 1774, discontinuous annual estimates of the outstanding value of bills of public credit and Treasury notes are available with better coverage for five of the colonies than for seven others. Matching price data for each colony are unavailable. Exchange rates on London are, however, known for each of the five colonies. The depreciation of exchange rates varied from 12 to 13 percent in New York and in Virginia, to 27 percent in Pennsylvania, 330 percent in Boston, and 1340 percent in Rhode Island. The outstanding value of bills of public credit issued does not closely match exchange rate movements, although in general the New England colonies issued far more than did the Middle Atlantic colonies and Virginia. However, bills of credit were oniy one form of paper money then in use. Estimates of loan bank issues and of private bills of exchange plus such specie as there was would need to be included to form some judgment of how serious the disparity is between total nominal money issues and the real values of those issues expressed as sterling at current exchange rates (U.S. Bureau of the Census 1960; Weiss 1970).
Since the focus here is secular price change, I omit discussion of the two short-term episodes at the conclusion of this subperiod: the 84 percent per month average rate of rise in prices during the American Revolution, ending in the discontinuation in use of continental cur- rency; and the 10 percent per month average rate of rise in prices in France during the revolutionary era, ending in the discontinuation in

93 Secular Price Change in Historical Perspective
use of assignats (Bezanson 1951, pp. 93, 343; Harris 1930, pp. 106, 108).
One important change in the eighteenth century was the proliferation of forms in which money was held and used. In England, silver and gold coin were supplemented by note issues of the Bank of England, London private banks, and, after 1750, country banks, as well as by inland bills of exchange created by individual borrowers or lenders. In Holland, where the Bank of Amsterdam was founded at the beginning of the seventeenth century, paper money became well known. In Spain, its use became familiar in the last quarter of the eighteenth century. In France, lingering distrust created by John Law’s ill-fated banknote issues effectively ended further public willingness to hold money in any form but coin until the Revolution.
The eighteenth century was punctuated by brief periods of peace between prolonged wars involving at one time or another all the leading countries. Though wars in modern experience are associated with price increases as monetary authorities finance government expenditures to prosecute their military involvements, in the eighteenth century before the Napoleonic Wars no consistent relationship between wars and prices is observed. The Bank of England, for example, curtailed loans on private account when it increased them on government account (Ashton 1959, p. 65). In Spain, outflows of specie and blockades against imports from Spanish America occurred during wartime, and except when pa- per money issues were introduced, prices did not rise. During peace- time, inflows of specie and paper money issues matched periods of price rise (Hamilton 1947, p. 217).
For the eighteenth century, as for the Price Revolution, European population change has been invoked by some economic historians as the causal factor producing the rough stability of prices until the middle of the century, and the rise thereafter, with differential effects on ag- ricultural and industrial prices. Change in rate of population growth, however, is not consistently related to change in secular price move- ments in the nineteenth and twentieth centuries, the final historical evidence that I want to consider (Grauman 1968, pp. 378-79).
3.4 From the Napoleonic Wars to the Twentieth Century
Table 3.5 shows annual average rates of price change for the series available for selected countries for each of six secular episodes in the period from 1790 to the early 1930s. Wage and interest rate data are included where possible. Three periods of secular price rise alternate with three periods of secular price decline.
In the extensive literature devoted to these episodes, four main ex- planations have been advanced: explanations stressing (1) monetary factors, (2) cost-push and cost-pull factors, (3) a long-wave mechanism,

lsble 3.5
Episode: 1. Inflation 2. Deflation 3. Inflation 4. Deflation 5. Inflation 6. Deflation General
Six Episodes of Secular Price Change, Four Countries, 1790-1934
Chronology: 1790-1815 1815-50 1850- 73 1873-96 18%-1920 1920-34
Annual Average Rate of Change (Prices and Money Wages in Percent per Year; Interest Rates in Percent per Year per Year)
Great Britain: Prices Money wages Interest rates
Prices Money wages Interest rates
Germany: Prices Money wages Interest rates
France: Prices Interest rates
U.S.:
2.8 - 2.2 2.9 - 0.6 0.09 -0.05
3.3 - 2.3
3.2 - 1.9
- 0.06
- 1.0 - 0.10
0.9 1.9 0.01
5.3
1.9
0.02
1.2 0.07
- 1.7 -0.1 -0.04
- 1.8 -0.3 -0.13
-0.8 -0.2 -0.04
- 2.5 - 0.10
4.7 5.2 0.13
4.2 5.0 0.09
11.0
0.24
8.2 0.10
-4.1 -3.8 -0.16
- 3.9 - 2.2 - 0.09
- 1.2 -0.3 -0.27
- 8.4 - 0.25

Note: Rates of change are from initial to terminal values assuming continuous compounding. Sources:
Great Britain--Prices: 1790- 1813; 1813-50 (Gayer, Rostow and Schwartz index of domestic and imported com- modities, from Mitchell and Deane 1%2, p. 470); 1873-96; 1896-1920; 1920-34 (through 1913, an approximation of retail prices, furnished by Phyllis Deane; thereafter, 1914- 18, Ministry of Labour cost-of-living index; 1919-34, Ministry of Labour retail price index). Wages: 1790-1810; 1810-45 (from Mitchell and Deane 1%2, p. 343, Part A, Great Britain); 1850-74 (ibid., Part B); 1874-95; 1895-1920; 1920-34 (wage rates from Phelps Brown and Sheila Hopkins, 1950, pp. 276, 281-1914-20 shifted to level of 1895-1914). Interest rates: 1792-1812; 1812-52; 1852- 74; 1874-97; 1897-1920; 1920-35 (yield on Consols, from Homer 1963, pp. 162, 195-197, 409).
United Stares-Prices: 1791-1814; 1814-49; 1849-65 (from Warren and Pearson 1932, pp. 8-9); 1869-96; 18%- 1920; 1920-33 (price deflator implicit in unpublished annual net national product estimates of Robert Gallman, 1869-1909, thereafter ot Simon Kuznets). Wages: 1869-95; 1895-1920; 1920-33 (wage rates, from Phelps Brown and Sheila Hopkins, 1950, pp. 277, 282-1914-20 shifted to level of 1895-1914). Interest rates: 1869-99; 1899- 1921; 1921-34 (through 1899, railroad bond yields, adjusted to level of following segment, which is the basic yield on 30-year corporate bonds, from Homer 1963, pp. 310, 316, 374).
Germany-Prices: 1792-94 to 1807-09; 1807-09 to 1848-50 (wholesale prices from Jacobs and Richter 1935, pp. 82-83); 1850-74; 1874-95 (price deflator implicit in net national product, from Hoffmann 1965, pp. 825-828); 1896- 1920; 1924-31 (cost-of-living index, from Bry 1960, pp. 325-327). Wages: 1873 to 1894-95; 1925-33 (Phelps Brown and Margaret Browne 1968, pp. 436-438). Interest rates: 1818-52, 1852-73; 1873-96; 1896-1924; 1924-33 (yield on Prussian State 4s or 3%; Bavarian 31/zs; computed average of bond yields; high-grade bond yields, from Homer
France--Prices: 1820-51; 1851-73; 1873-96; 1896-1920; 1926-34 (wholesale prices, from Jacobs and Richter 1935, pp. 34-35). Interest rates: 1816-52; 1853-73; 1873-97; 1897-1920; 1925-34 (yield on 5% or 3% French government rentes, from Homer 1%3, pp. 222-223, 426-427).
1963, pp. 259-260, 260-261,461).

% Anna J. Schwartz
and (4) rates of economic growth. I shall summarize each approach and then discuss objections raised against each.
1 . In each pair of episodes the monetary explanation notes the fol- lowing factors:
a. Wartime expansion of note issues in England, especially after the Bank of England suspended specie payments in 1797, followed by contraction of paper money issues, especially after England resolved to return to the gold standard at the prewar parity in 1821. The return to gold was coupled with a decline in the output of precious metals in Latin America; and accompanied by growth in output and population.
b. Gold discoveries in the United States and Australia, 1848-51, increased world gold output over the following decade and a half at an annual rate of 8 percent. The gold producing countries distributed the output among their trading partners, thus leading to faster monetary growth in those countries. Monetary expansion was greatly increased in the United States during the Civil War when specie payments were suspended, and in France and Germany during the Franco-Prussian War. This episode was succeeded by a 1 percent per year decline in the rate of growth of world gold output, 1873-87, at a time when the gold standard was adopted by several countries, the United States resumed specie payments, and silver was demonetized. An expansion of world gold output during the following decade was accompanied by rapid growth in population and output (Warren 1933, p. 97).
c. An increase of about 4.5 percent per year in world gold output, 1896- 1914, permitted faster growth of money supply. To finance World War I, the belligerent countries stepped up monetary growth further. Prices collapsed in 1920 or 1921 as extraordinary wartime rates of growth of money ceased, except in Austria, Germany, Hungary, Po- land, and Russia, where hyperinflations intervened. Thereafter, the progressive contraction of the U.S. money supply, 1929-32, and the collapse of the U.S. banking system produced a sharp price decline. The U.S. contraction ensured a worldwide decline in prices because of the links forged by fixed rates of exchange under the gold exchange standard to which most countries adhered in 1929.
2. The cost-push or cost-pull explanation stresses demand and supply conditions in individual markets. Rises in costs are associated with poor harvests, obstructions in supply conditions-including wartime blockades-increases in foreign exchange, insurance, freight, and in- terest costs. Declines in costs are associated with good harvests, im- proved transportation facilities, discovery of new foreign sources of supply, technological improvements, and reduced foreign exchange, insurance, and interest costs.
The cost-push explanation was advanced with special emphasis on the price rise from 1896 to 1910 at a session on the causes of the inflation
97 Secular Price Change in Historical Perspective
at the December 1910 annual meeting of the American Economic As- sociation. J. Laurence Laughlin argued that since the increase in the supply of gold had just been offset by the increase in demand for gold, and since the supply of credit was determined by the demand, factors other than an increase in money supply must have been responsible for the price rise. The factors he cited included the Dingley Tariff of 1897, higher tax rates, agricultural conditions, speculation, general ex- travagance-“new wealth makes a liberal spender” (Laughlin 191 1, p. 36)-and, finally, two factors with a very modern ring: wages and union- ism, and monopolies and trusts. A year and a half earlier, in the Journal of Political Economy, Laughlin had argued that “the pressure of labor unions” had been “an influence independent of prices” which acted to raise the rate of wages, and that once a high rate of wages had been granted, it was not easy for employers to force a reduction. His proof was “the after-effects of the recent panic of 1907” (Laughlin 1909, pp. 267, 269). As for monopolies and trusts, Laughlin stated, “As every economist knows, in the conditions under which many industries are today organized, expenses of production have no direct relation to prices. In such conditions, there is a field in which the policy of charging ‘what the traffic will bear’ prevails; and this includes industries that are not public utilities” (Laughlin 1911, p. 35). (A companion paper at this session was delivered by Irving Fisher, who responded gallantly, “I find myself unable to agree with most of the positions taken by Professor Laughlin in his able paper.”)4
3. The long-wave explanation, in Schumpeter’s version, stresses the role of new techniques, as, for example, in the manufacture of textiles and iron in the Industrial Revolution of the first pair of episodes, the introduction of railways in the second pair, and innovations utilizing electric power and chemistry in the third pair. Prices rise in the upward phase of a long wave, corresponding to the introduction of innovations by pioneering entrepreneurs, because credit is expanded and the de- mand for goods increases while the output of the innovations is not yet fully realized. Prices fall during the downward phase of a long wave, corresponding to the period when hordes of followers imitate the in- novators, and the cost-reducing effects of the innovations are realized in increased output. Profits and interest rates are high during the upward phase and low during the downward phase. Since variation in the output of commodities is determined by the long-wave process, unless the behavior of the money supply were exactly compensatory, price move- ments are generally determined by output movements (Schumpeter 1939).
4. The explanation stressing economic growth compares rates of growth of world industrial capacity and the output of primary products since 1815. When industrial capacity grows faster than the output of
98 Anna J. Schwartz
primary products, the prices of primary products rise absolutely and relatively to industrial wages. The rise in wholesale prices of raw ma- terials raises prices “fixed” for final products, which induces wage earners to press for rises in money wages. Other incomes rise in turn, causing further rises in costs and prices. The risk of raising prices is smaller for sellers at such a time when competitors are also raising their prices and customers’ expectations of price increases justify them. It is granted that monetary restriction could stop prices from rising, but in fact, it is asserted, in the past, monetary restriction has taken place only enough to raise the long-term rate of interest gradually as the upward price trend has gone on. All these reactions to a rise in wholesale prices are in the reverse directions when wholesale prices fall. Long-period price declines have not been due to shortage of money, it is asserted, although presumably monetary expansion could stop prices from falling (Brown and Ozga 1955).
Let me now examine in turn the objections that have been raised against each of these explanations. Three have been raised against the monetary explanation.
1. One objection to the monetary explanation was based on erroneous British money supply statistics, particularly from about 1875 to 1913, which purported to show a relatively constant rate of growth of the series, unaffected by variations in gold production. Improved statistics indicate that the growth rate of the British money supply was decidedly lower from 1873 to 1895 than from 1851 to 1873 and from 1895 to 1913, and the same seems to be true of money growth rates of other countries with defective banking statistics (Higonnet 1957, pp. 350-354).
2. Another objection judged the fall in interest rates during periods of secular price decline to be an embarrassment to the monetary ex- planation, implying that no distinction need be made between nominal and real interest rates. Once the distinction is made, however, declining interest rates can be interpreted as a reflection of declining prices. Insofar as changes in the purchasing power of money are anticipated, bond prices will tend to be higher and nominal yields lower when commodity prices are falling than when they are rising, the increase in the real value of the principal constituting a return in addition to the nominal interest paid. Since anticipations usually lag the actual fall in prices, interest rates will usually fall together with commodity prices as they adjust to the price fall. The Gibson Paradox, in short, is an implication of rather than an embarrassment to the monetary expla- nation of secular price movements.
It has been suggested that the paradox disappears if the assumption is made that movements in the price level are inversely related to the change in money supply. A rise in prices would imply “(other things being equal) an extension of the demand for monetary balances, and
99 Secular Price Change in Historical Perspective
higher rates of interest” (Brown and Browne 1968, p. 108); a decline in prices would imply a contraction of the demand for monetary bal- ances, and a lower rate of interest. In my view, the willingness to “allow the possibility that the rise of the price level may come about without an antecedent increase in the stock of money” reflects both error re- garding the movements of the money stock and commitment to the belief that changes in money supply influence interest rates only, and that the channel of influence is only through a negative liquidity effect.
3. A final objection is that the monetary explanation cannot incor- porate cost changes. The argument is essentially a statement of the view that prices rise when money costs rise and prices fall when money costs fall. Thus, this objection to the monetary explanation ties in with the cost approach to secular price change, so I shall discuss it in the more general context of that view.
The monetary explanation, it must be said at the outset, incorporates all supply influences in the output variable to which the growth in the money supply is related. The effects of reduced real costs are allowed for in the monetary explanation in the increase in output which cost reduction has achieved, or in the decrease in output which real cost increases entail, under given demand conditions.
What the cost explanation, on the other hand, fails to show is, first, where the autonomous increase in cost comes from. Fundamentally, it begs the question. Of course, if costs rise more than productivity, so will prices in general. But what produces the rise in cost? Here the explanation is generally ad hoc, relying on different factors in different circumstance^,^ and typically confusing effects on relative costs with effects on absolute costs. Moreover, even if this basic defect is over- looked, and we suppose an autonomous rise in nominal costs, the cost explanation must then show how the increase in money costs increased either money supply or velocity or both or how a decrease in money costs decreased either money supply or velocity or both. It has failed to do so. With respect to the relationship between costs and money supply we can set aside the political argument that is advanced in respect of post-World War I1 conditions, namely, that the existence of a full-employment policy enforces growth in the money supply to Val- idate cost increases that would otherwise lead to unemployment. This political argument obviously has no relevance to the world of the nine- teenth and first third of the twentieth century. An alternative argument to the effect that changing costs affected the demand for working cap- ital, on the surface, seems more plausible. It implies that demand for bank loans determined the rate of growth of money.
On this issue, we have some evidence in Cagan’s study of the U.S. money supply. If banks were the channel through which secular changes in the rate of growth of the money supply were produced, we should
100 Anna J. Schwartz
expect to find the usable reserve ratio-Cagan’s term for total minus required reserve ratio-rising during secular periods of price decline, when presumably the demand for bank loans would have been weak, and declining during secular periods of price rise, when presumably the demand for bank loans would have been strong. We do not observe such movements in the data. The usable reserve ratio declined during the period of secular price decline to 1895, declined further during the following period of secular price rise to 1920, and during the succeeding period of price decline also declined through 1929. So the U.S. reserve ratio gives no confirmation to the argument that demand for loans determined the money supply. More basically, Cagan has shown that the major source of secular changes in the U.S. money supply has been changes in high-powered money, not changes in the reserve ratio (Ca- gan 1965, pp. 280-286).
It has been asserted that there need be no “preliminary permissive or causal movement on the side of money” (Brown and Browne 1968, p. 156) for the general level of prices to change. “The general level of prices can rise . . . if particular price rises originating in the balance of supply and demand for particular products or factors of production are passed on, and compensated, by rises of other prices and money incomes. Recent years of full employment have shown how a tacit conspiracy to do this can be formed and perpetuate itself when once each man who takes part in it comes to believe that the others are in it too” (Brown and Browne 1968, p. 108). This is a modern example of the confusion between relative and absolute costs discussed earlier.
However, the modern version of the fallacy is buttressed by a more sophisticated argument, namely, that with no change in the money stock, a rise in costs or prices will force interest rates up, since the demand for nominal money rises; the rise in interest rates will then push up velocity; a decline in costs or prices will pull interest rates down, since the demand for nominal money falls; the decline in interest rates will then pull down velocity. But this raises two problems: first, the standard problem of what causes absolute costs to rise or fall; and, second, how this effect, even if it occurred, could be more than a once- for-all effect. For inflation to continue, velocity must continue to rise. As already stated, the monetary explanation implies such a pattern, following an increase in the rate of monetary growth, because of the effect of inflation on nominal interest rates. However, the cost-inflation explanation must produce the result with no change in the money stock. On the cost-inflation view, there is no reason why price rises and falls should be correlated at all with rates of monetary growth; they should rather be correlated with velocity. In fact, the correlations are decidedly higher with rates of monetary growth per unit of output than with velocity. Indeed, the theoretically expected relation between velocity

101 Secular Price Change in Historical Perspective
and rate of price change, while it can be detected in the data by sophisticated statistical analysis, is generally hidden to the naked eye. For example, velocity declined in the United States during both secular price declines and secular price rises in the period from 1869 to 1932. Finally, secular velocity changes, at least through 1929 in the United States, did not parallel closely similar swings in interest rates.
The cost-push cost-pull argument amounts to an assertion that there is no common element affecting the price level. The price level is only the collection of prices determined in individual markets. A rise in an individual price has an inflationary effect, with no force producing offsetting changes if one relative prices increases. Relative price changes accordingly are identical with price level changes.
No better response to this approach can be cited than one Irving Fisher gave sixty years ago (Fisher 1911a):
The legitimacy of separating the study of price levels from that of [individual] prices will be clearly recognized, when it is seen that individual prices cannot be fully determined by supply and demand, money cost of production, etc., without surreptitiously introducing the price level itself. We can scarcely overemphasize the fact that the “supply and demand” or the “cost of production” of goods in terms of money do not and cannot completely determine prices. Each phrase, fully expressed, already implies money. There is always hid- den somewhere the assumption of a general price level.
. . . In elementary textbooks much emphasis is laid on the fact that “demand” and “supply” are incomplete designations and to give them meaning it is necessary to add to each the phrase “at a price.” But emphasis also needs to be laid on the fact that “demand at a price” and “supply at a price” are still incomplete designations, and that to give them meaning it is necessary to add “at a price level.” The demand for sugar is not only relative to the price of sugar, but also to the general level of other things. . . . The price of sugar in dollars depends partly on sugar and partly on dollars, that is, on what dollars will buy-that is, on the price level. . . . We have more need to study the price level preparatory to a study of the price of sugar than to study the price of sugar preparatory to a study of the price level.
. . . The terms “demand” and “supply,” used in reference to par- ticular prices, have no significance whatever in explaining a rise or fall of price levels. In considering the influence affecting individual prices we say that an increase in supply lowers prices, but an increase in demand raises them. But in considering the influences affecting price levels we enter upon an entirely different set of concepts, and must not confuse the proposition that an increase in the trade tends

102 Anna J. Schwartz
to lower the price level, with the proposition that an increase in supply tends to lower an individual price.
I now turn to the Schumpeter long-wave interpretation of secular price changes. This is not the occasion to review the detailed challenges to the validity of the whole long-wave conception, so I shall limit myself to two comments. Long-run price behavior of individual commodities and services may be adequately explained by an innovation process such as Schumpeter describes, but it is hard to believe that the impact of innovation limited to a few pioneering entrepreneurs can be as de- cisive a factor for the economy as a whole as Schumpeter’s thesis requires in the long-wave upswing. It is also hard to believe that pi- oneering entrepreneurs would emerge in all Western countries at ap- proximately the same time. This is not to deny that the long-wave conception may have some merit in ascribing increased output in the downswing to the widespread adoption of new techniques, but at best the explanation is incomplete and partial.
More important, this explanation would call for change in the rate of monetary growth of a smaller order of magnitude than of either changes in the rates of price rise and output growth. But the facts are the other way around. Variability in monetary growth is of far larger order of magnitude than variability in rates of price rise and output growth .‘j
Finally, with respect to the hypothesis that secular price changes came about through disparities between the world growth rates of industrial capacity and output of primary products, the only evidence presented in support of the conception is a chart for 1872-1951 of a world (less Russia) pig iron output-to indicate industrial capacity-xpressed as a ratio to an index of world output of eight primary products. Although the results are described as “not inconsistent with our account of the origin of the wholesale price level” (Brown and Ozga 1955, p. 13), I do not observe a downward trend that is supposed to characterize the pe- riod 1872-94, one of three subperiods the chart is supposed to substan- tiate (data for the years 1946-51 can hardly be considered a fourth sec- ular subperiod). At a minimum, parallel data on prices and output for industrial and primary products would be required, and some evidence as well on leads and lags to give substance to the hypothesis. Even so, it would still be necessary to show that the assumptions the hypothesis makes relating to monetary behavior are valid.
There are no doubt models other than those I have discussed in the literature on secular price movements of the nineteenth and twentieth centuries, but I hope I have said enough to indicate the variety that exists. It is time now to state the conclusions that I draw from the historical record.

103 Secular Price Change in Historical Perspective
3.5 Conclusions from the Historical Evidence
I draw ten conclusions from the historical record: 1. Episodes of rising prices have alternated with episodes of declining
prices, apparently for as long as money has been used as a medium of exchange.
2. Until the eighteenth century, the sources of monetary expansion and contraction were the output of precious metals and debasement or restoration of the coinage. These sources have since been supplemented or supplanted by paper money issues of banknotes or deposit currency. All forms of money issue have been subject to governmental control.
3. Before the era of twentieth-century central banking, governments tended to be passive in relation to long-term changes in world precious metal output and the changing rate of accrual to their national stocks. In earlier centuries, debasements and restorations of coinage seem to have been determined mainly by fiscal needs, although this does not explain why the Greek practice was so different in this respect from that of the Romans, or why England engaged in little debasement in the fourteenth century while France engaged in much, and in a follow- ing century why England debased and France did not. On some oc- casions such measures may have offset the retardation or acceleration of the growth of precious metals, but there are only limited data to confirm this suggestion. Since the eighteenth century, deliberate large- scale increases in paper money issues have usually been associated with war financing, but John Law’s experiment is an exception. Delib- erate contraction of paper money issues has been associated with post- war return to the gold standard at a prewar parity, or a decision to call a halt to a postwar inflation, as in the United States in 1920.
4. Long-run price changes consistently parallel the monetary changes, with one exception for England in the sixteenth century.
5 . With the exception of war and immediate postwar periods; in earlier centuries, plagues; and the economic disaster of 1929-32, output has apparently grown during both periods of secular price rise and fall.
6. Discrepancies between movements of the ratio of the money stock to real output and price movements reflect long-run changes in the public’s demand for money balances. U.S. and British data suggest that the long-run movement until World War I1 trended upward. Such a trend would accentuate price declines and moderate prices rises. 7. In recent centuries, the price episodes occurred at approximately
the same dates in numerous countries. The mechanism for the diffusion of an episode was the mutual adjustment of price levels between coun- tries by international trade and the redistribution of the world stock of monetary reserves. This was the case under both the gold standard before 1914, when the quantity of money in each country was a de-

104 Anna J. Schwartz
pendent variable, which had to adjust to produce a level of prices relative to prices abroad consistent with balance of payments equilib- rium, and in the period after the war, when monetary authorities had more leeway with respect to control of the quantity of money. In both cases, a change in the quantity of money was the mechanism whereby prices in one country were kept in line with prices abroad. Changes in the quantity of money in any one country were produced by changes in that country’s prices relative to foreign prices. Changes in the quan- tity of money then produced changes in the country’s absolute price level.
8. Over the centuries it has been alleged that factors other than the ratio of money stock to output have caused secular price movements. These factors have ranged from changing population growth to changes in costs of production to the presence or absence of speculation. If each price episode were a response to a constellation of factors other than money, it would then be necessary to show how that constellation produced either a change in money stock or in velocity associated with an individual price episode. No one has done so.
9. Costs of production are prices that are subject to change by the same monetary influences as are prices of final goods. Prices of factors that did not change in unison with commodity prices would indicate a defect in the market for labor or capital, lack of foresight that would lead to an effective wage below the marginal product of labor, or too low an interest rate to leave borrower-lender relations unaffected when prices are rising and the opposite when prices are falling. The existence of a temporary lag is conceivable in cases where arrangements are contractual or customary, but contracts were renegotiated and custom changed, so presumably prices of factors eventually responded. The rise in wages and interest rates during price upswings and their fall during price downswings were not the causes of the price movements but reflections of the same forces that produced the price movements.
Particularly with respect to secular price movements from the six- teenth to the twentieth centuries, the literature of economics contains many analyses contending that wages lagged behind prices, swelling business profits during inflations and inflicting business losses during periods of declining prices. As Kessel and Alchian (1960) have shown, this is an untested hypothesis. If it were true, it would be difficult to reconcile with the cost-push, cost-pull hypothesis.
Were there autonomous forces raising wages and prices? Increasingly strong unions and increasingly strong monopolies in the process of raising their wages and prices to levels consistent with their newly acquired monopoly power can push their relative wages and prices up, and if there is a lag in the adjustment of other absolute prices, for a time this can produce a rise in the absolute price level without a mon-

105 Secular Price Change in Historical Perspective
etary stimulus-though not without unemployment. The attribution in 1909 of the U.S. price rise after 1897 to the effect of unions and trusts suggests that the pre-World War I economy was viewed by some con- temporaries in much the same light as the post-World War I1 economy is viewed by some contemporaries now. The difficulty posed by this explanation is that, if used to account for the secular price rise, it cannot then account for the sharp reversal in the price movement in 1920. Union membership constituted 3.5 percent of all nonagricultural employees in 1897, 9.9 percent in 1909 (when Laughlin wrote), and peaked at 19.6 percent in 1921, a year after the wholesale price index had declined 37 percent and the consumer price index had declined 11 percent (Troy 1965, p. 2). Similarly, monopoly power was evidently growing during the first decade of the century; no data suggest that it subsequently disintegrated. The absurd conclusion the explanation compels is that strong unions and monopolies chose to lower wages and prices drastically in 1920.
10. The role of price expectations as an autonomous factor lowering or raising interest rates, reducing or adding to wage demands in past secular price movements, is difficult to establish. However, some pre- liminary results of a study of monetary trends that Professor Friedman and I have been engaged in suggest that in the form in which we express our variables, past price change is a good index of expectations about current price behavior. The higher the index, the larger the fraction of current monetary expansion that is absorbed by prices. Similarly, we find that over periods longer than a cycle, a higher rate of monetary change is associated with a higher level of nominal interest rates. This relationship is a reflection of a relationship between price expectations and the level of interest rates.
Having completed this summary of what I believe the historical re- cord teaches us, I want finally to give some indication that the lessons of the past are not irrelevant to the present. Rates of change in money stock (currency plus demand deposits), per unit of output, and rates of change in prices in forty countries over the period 1952-69 are plotted as a scatter diagram in figure 3.1.* Each dot plots the rate of change in prices over the 17-year period against the rate of change in the quantity of money per unit of output over the same period. There are 40 dots for 40 countries. The diagonal lines across the chart is the line on which a 12 percent change in prices is associated with a 12 percent change in the quantity of money, a 10 percent change in one with a 10 percent change in the other, and so on. The points are closely scattered along such a diagonal line. At the top of the chart are the countries that have had about a 30 percent increase in the quantity of money per unit of output and they have had about a 30 percent change in prices. At the bottom are the countries that have had a small rate
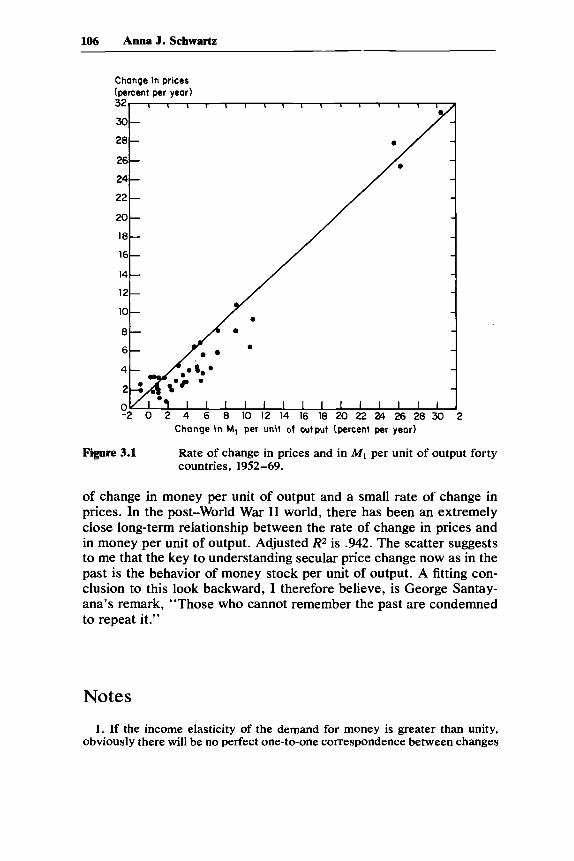
106 Anna J. Schwartz
Change in prices (percent per year)
Change in MI per unit of output (percent per year)
Rate of change in prices and in MI per unit of output forty countries, 1952-69.
Figure 3.1
of change in money per unit of output and a small rate of change in prices. In the post-World War I1 world, there has been an extremely close long-term relationship between the rate of change in prices and in money per unit of output. Adjusted R* is .942. The scatter suggests to me that the key to understanding secular price change now as in the past is the behavior of money stock per unit of output. A fitting con- clusion to this look backward, I therefore believe, is George Santay- ana’s remark, “Those who cannot remember the past are condemned to repeat it.”
Notes
1 . If the income elasticity of the demand for money is greater than unity, obviously there will be no perfect one-to-one correspondence between changes
107 Secular Price Change in Historical Perspective
in the ratio of money to output and prices. I regard Paul Trescott’s comments on this score as a refinement of, rather than a challenge to, the broad-brush picture I have drawn. The first-order effect I have examined seems to me to have high explanatory power. Trescott’s comment introduces a second-order effect. A similar statement applies to his reference to the presence of a lagged influence of money on prices, which I in no way dispute.
2. Judged by modern monetary experience, these growth rates of the gold and silver stock are modest. For example, the U.S. money supply multiplied 157-fold in the period 1867-1960 or at an annual rate of 5.4 percent. Debase- ment, of course, and later, paper money issues permitted faster growth of national money stocks than of their metallic constituent. The estimates of the English money stock in 1562 (table ? above) and 1697 (see n. 3, below) indicate that during the period it multiplied 15.5-fold or at an annual rate of 2 percent. Prices rose .8 percent per year over the comparable period. After allowance for the rate of price rise, in the absence of the underlying estimates, we cannot say how the annual rate of monetary growth was divided among the rate of population growth, per capita output, and the growth in per capita holdings of money.
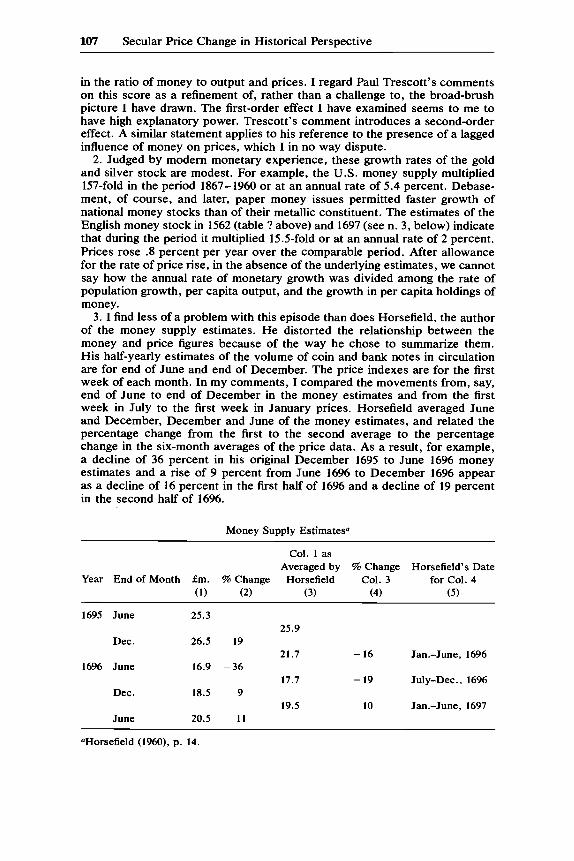
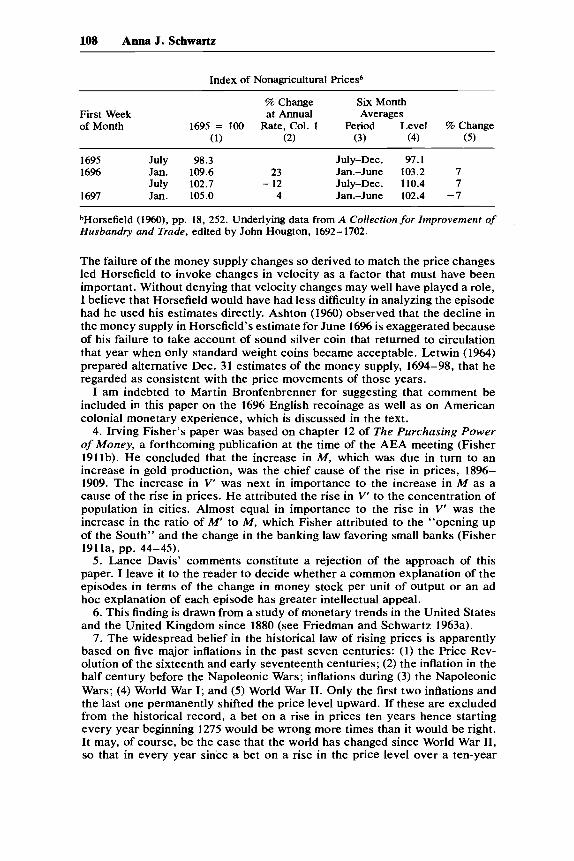
3. I find less of a problem with this episode than does Horsefield, the author of the money supply estimates. He distorted the relationship between the money and price figures because of the way he chose to summarize them. His half-yearly estimates of the volume of coin and bank notes in circulation are for end of June and end of December. The price indexes are for the first week of each month. In my comments, I compared the movements from, say, end of June to end of December in the money estimates and from the first week in July to the first week in January prices. Horsefield averaged June and December, December and June of the money estimates, and related the percentage change from the first to the second average to the percentage change in the six-month averages of the price data. As a result, for example, a decline of 36 percent in his original December 1695 to June 16% money estimates and a rise of 9 percent from June 1696 to December 1696 appear as a decline of 16 percent in the first half of 1696 and a decline of 19 percent in the second half of 16%.
Money Supply Estimatesa
Col. 1 as Averaged by % Change Horsefield’s Date
Year End of Month fm. % Change Horsefield Col. 3 for Col. 4 (1) (2) (3) (4) (5)
1695 June 25.3 25.9
21.7 - 16 Jan.-June, 1696
17.7 - 19 July-Dec., 16%
19.5 10 Jan.-June, 1697
Dec. 26.5 19
16% June 16.9 -36
Dec. 18.5 9
June 20.5 11
OHorsefield (1%0), p. 14.
108 Anna J. Schwartz
Index of Nonagricultural Pricesb
% Change Six Month First Week at Annual Averages of Month 1695 = 100 Rate, Col. 1 Period Level % Change
(1) (2) (3) (4) (5 )
1695 July 98.3 July-Dec. 97.1 1696 Jan. 109.6 23 Jan.-June 103.2 7
1697 Jan. 105.0 4 Jan.-June 102.4 -7 July 102.7 - 12 July-Dec. 110.4 7
bHorsefield (1960), pp. 18, 252. Underlying data from A Collection for Improvement of Husbandry and Trade, edited by John Hougton, 1692-1702.
The failure of the money supply changes so derived to match the price changes led Horsefield to invoke changes in velocity as a factor that must have been important. Without denying that velocity changes may well have played a role, I believe that Horsefield would have had less difficulty in analyzing the episode had he used his estimates directly. Ashton (1960) observed that the decline in the money supply in Horsefield’s estimate for June 1696 is exaggerated because of his failure to take account of sound silver coin that returned to circulation that year when only standard weight coins became acceptable. Letwin (1964) prepared alternative Dec. 31 estimates of the money supply, 1694-98, that he regarded as consistent with the price movements of those years.
I am indebted to Martin Bronfenbrenner for suggesting that comment be included in this paper on the 1696 English recoinage as well as on American colonial monetary experience, which is discussed in the text.
4. Irving Fisher’s paper was based on chapter 12 of The Purchasing Power of Money, a forthcoming publication at the time of the AEA meeting (Fisher 1911b). He concluded that the increase in M , which was due in turn to an increase in gold production, was the chief cause of the rise in prices, 1896- 1909. The increase in V’ was next in importance to the increase in M as a cause of the rise in prices. He attributed the rise in V’ to the concentration of population in cities. Almost equal in importance to the rise in V‘ was the increase in the ratio of M’ to M, which Fisher attributed to the “opening up of the South” and the change in the banking law favoring small banks (Fisher 191 la, pp. 44-45).
5. Lance Davis’ comments constitute a rejection of the approach of this paper. I leave it to the reader to decide whether a common explanation of the episodes in terms of the change in money stock per unit of output or an ad hoc explanation of each episode has greater intellectual appeal.
6. This finding is drawn from a study of monetary trends in the United States and the United Kingdom since 1880 (see Friedman and Schwartz 1963a).
7. The widespread belief in the historical law of rising prices is apparently based on five major inflations in the past seven centuries: (1) the Price Rev- olution of the sixteenth and early seventeenth centuries; (2) the inflation in the half century before the Napoleonic Wars; inflations during (3) the Napoleonic Wars; (4) World War I; and ( 5 ) World War 11. Only the first two inflations and the last one permanently shifted the price level upward. If these are excluded from the historical record, a bet on a rise in prices ten years hence starting every year beginning 1275 would be wrong more times than it would be right. It may, of course, be the case that the world has changed since World War 11, so that in every year since a bet on a rise in the price level over a ten-year

109 Secular Price Change in Historical Perspective
span would be right, but then the argument would be that rather than an extrapolation from the past, future price experience will differ from the long historical record. For an illuminating discussion of the evidence, see Lipsey (1 960a).
8. James Lothian kindly provided me with a printout of annual data for the forty countries through 1%6, and I updated the figures to 1969, except for two countries (Brazil and the Dominican Republic) for which the period ends in 1968 and three (Iceland, Peru, and Uruguay) for which the period ends in 1967. The money and price figures come from International Financial Statistics Supplement, 1971. Money is defined as currency plus demand deposits held by the public. Prices are cost-of-living indexes on a 1963 base. Income data are from U.N., Yearbook ofNationa1 Account Statistics, 1970, table 179, and U.N., Monthly Bulletin ofstatistics, Oct. 1971, table 61, except for Sweden, which were derived from Sweden, The Swedish Economy: Revised National Budget, 1971.2, p. 590. Income figures are net national income except for Brazil (net national product) and Nicaragua, Sweden, and Uruguay (gross domestic product).
On the printout I obtained from Lothian money was defined as the sum of “Money” and “Quasi-Money’’ (commercial and mutual savings-bank time deposits, postal savings deposits, and savings and loan shares where they ex is tedhas shown in International Financial Statistics. Adjusted R2 for the observations based on this definition of money for the period Lothian covered was .877.