Embed Size (px)
Citation preview
IZA DP No. 3324
Sectoral Transformation, Turbulence,and Labor Market Dynamics in Germany
Ronald BachmannMichael C. Burda
DI
SC
US
SI
ON
PA
PE
R S
ER
IE
S
Forschungsinstitutzur Zukunft der ArbeitInstitute for the Studyof Labor
January 2008
Sectoral Transformation, Turbulence,
and Labor Market Dynamics in Germany
Ronald Bachmann RWI Essen
Michael C. Burda
Humboldt University of Berlin, CEPR and IZA
Discussion Paper No. 3324 January 2008
IZA
P.O. Box 7240 53072 Bonn
Germany
Phone: +49-228-3894-0 Fax: +49-228-3894-180
E-mail: [email protected]
Any opinions expressed here are those of the author(s) and not those of IZA. Research published in this series may include views on policy, but the institute itself takes no institutional policy positions. The Institute for the Study of Labor (IZA) in Bonn is a local and virtual international research center and a place of communication between science, politics and business. IZA is an independent nonprofit organization supported by Deutsche Post World Net. The center is associated with the University of Bonn and offers a stimulating research environment through its international network, workshops and conferences, data service, project support, research visits and doctoral program. IZA engages in (i) original and internationally competitive research in all fields of labor economics, (ii) development of policy concepts, and (iii) dissemination of research results and concepts to the interested public. IZA Discussion Papers often represent preliminary work and are circulated to encourage discussion. Citation of such a paper should account for its provisional character. A revised version may be available directly from the author.
IZA Discussion Paper No. 3324 January 2008
ABSTRACT
Sectoral Transformation, Turbulence, and Labor Market Dynamics in Germany*
This paper analyzes the interaction between structural change and labor market dynamics in West Germany, during a period in which industrial employment declined by more than 30% and service sector employment more than doubled. Using transition data on individual workers, we document a marked increase in structural change and turbulence, in particular since 1990. Net employment changes resulted partly from an increase in gross flows, but also from an increase in the net transition “yield" at any given gross worker turnover. In growing sectors, net structural change was driven by accessions from nonparticipation rather than unemployment; contracting sectors reduced their net employment primarily via lower accessions from nonparticipation. While gross turnover is cyclically sensitive and strongly procyclical, net reallocation is countercyclical, meaning that recessions are associated with increased intensity of sectoral reallocation. Beyond this cyclical component, German reunification and Eastern enlargement appear to have contributed significantly to this accelerated pace of structural change. JEL Classification: J63, J64, J62 Keywords: gross worker flows, sectoral and occupational mobility, turbulence Corresponding author: Michael C. Burda Department of Economics Humboldt-Universität zu Berlin Spandauer Str. 1 D-10178 Berlin Germany E-mail: [email protected]
* We thank participants at the EALE 2007, the EEA 2007 and the CAPE 2007 meetings, the 2007 annual meeting of the Verein für Socialpolitik, the 2nd Data User Conference of the IAB, and seminar participants of the Berlin Network of Labour Market Research (BeNA) and at Bergische Universität Wuppertal for helpful comments. We also gratefully acknowledge the support of the German Science Foundation (DFG) and of the Collaborative Research Centre SFB 649 at Humboldt-Universität zu Berlin.
1 Introduction
Modern market economies are constantly subject to structural change. Some sectors shrink, while others
grow. Some of these changes are of short duration, reflecting fads, terms of trade, or temporary shifts of
technology, while others appear more or less permanent. The most important common long-run trend for
developed economies has been a marked shift of employment away from production towards service activities,
as predicted by the “three-sector hypothesis” (for the classic references, see Fisher, 1935, Clark, 1940, and
Fourastie, 1949). Indeed, with the exceptions of Finland, Ireland, and Sweden, the share of manufacturing
in total GDP has declined throughout the European Union over the past quarter century.
It is natural to associate structural change with pervasive gross and net movements of workers between
the different sectors of the economy. This expectation is borne out in economic research on labor market
flows, and is especially relevant for Germany, in which the share of manufacturing in total GDP declined
from 28% in 1980 to 21% in 2005.1 This development has not been an even one. From 1970 to 1990,
manufacturing employment declined from 10.1m to 9.1m, i.e. by 1m or 10%. From 1990 to 2005, it fell
further to 6.8m, which corresponds to a drop of 2.3m, or 25%. The growth of service sector employment, by
contrast, was much more steady, rising from 6.1m in 1970, to 10.6m in 1990, to 14.5m in 2005. At the same
time, unemployment rose from below 2% to over 10%. The German case is important not only because of
Germany’s size in the European Union and Euro area, but also because of its highly industrialized initial
conditions and the marked delay of its transformation when compared with other EU economies.
Research on the roles of gross and net flows in structural change has been limited by the availability
of detailed data on individual workers’ employment histories.2 In this paper, we are able to assess both
the extent and the dynamics of structural change by using data on individual worker transitions in West
Germany during the time period 1975-2001. We do this by computing gross and net worker flows from a
large panel data set which covers 2% of the German social security workforce, and by evaluating the extent
of occupational and sectoral mobility over this period. We are thus able to identify precisely where structural
change is most prevalent in the economy, which workers are most affected, which worker flows contribute
most to it, and how they do so. We also analyze which differences exist between growing and shrinking sectors
in this context. Furthermore, we emphasize the role the business cycle plays for sectoral and occupational
worker reallocation.1The data in this section are from the OECD STAN Database and Statistische Amter der Lander (2006).2As discussed in the next section, the few studies taking a similar approach to ours are Fallick (1996), Golan, Lane, and
McEntarfer (2007), and Greenaway, Upward, and Wright (2000).
3
2 Theoretical and Empirical Perspectives on Structural Change
2.1 Long-run Trends and Structural Change
The long-run evolution of economies from agricultural, then to industrial, and finally to service-based struc-
ture is the key prediction of the “three-sector-hypothesis” associated with Fisher, Clark, and Fourastie.
Central to most theoretical explanations is an exogenous, persistent divergence in labor productivity growth
rates in manufacturing and services, as well as a relatively inelastic demand for services.3 At the sectoral
level, it is natural to think of an economy buffeted by idiosyncratic disturbances which reflect changes in
tastes, terms of trade, technologies, or institutional interventions, and empirical evidence tends to support
the view that these factors are responsible for long-term movements in unemployment.4 One of the first mod-
els to consider this in general equilibrium was Lucas and Prescott (1974). Rogerson (1987, 2005) extended
this analysis to include multi-sectoral models. In the former, a two-period, two-sector model with permanent
sectoral shocks is analyzed. Rogerson (2005) proposes a variant of the Lucas-Prescott model which allows
for finitely lived agents and sector-specific human capital. In contrast to Lucas and Prescott (1974), where
workers always move from declining to expanding sectors, workers from a declining sector might well end up
non-employed. This analysis thus allows for a richer set of worker histories. More recently, Lee and Wolpin
(2006) investigate the importance of the costs workers face when switching their sector of employment, as
well as the role of labor supply and demand factors in the growth of the service sector. In order to do so, they
estimate a two-sector growth model with aggregate and idiosyncratic shocks for the US economy. They find
that these mobility costs are large, and that demand side factors, namely technical change and movements
in product and capital prices, were responsible for the growth of the service sector.
2.2 Turbulence and Labor Market Dynamics
Structural change and worker mobility is related to the recent discussion of turbulence in the labor market.
It must be stressed that there exist a number of different notions of turbulence. First, following Lilien (1982),
3See Baumol (1967) for theoretical linkages of labor productivity growth differences to the secular development of the sizeof the service sector. Balassa (1964) discussed these developments in terms of nontraded output. Fuchs (1980) linked thesedevelopments to increasing female labor force participation. More recently, Ngai and Pissarides (2005) have studied a multi-sector model of growth with differences in TFP growth rates between sectors to derive conditions for balanced growth. Forempirical assessments see Layard, Nickell, and Jackman (2005), and the recent report by the European Central Bank (van Riet,Ernst, Madaschi, Orlandi, Rivera, and Benoıt, 2004).
4Marimon and Zilibotti (1998) decompose employment and labor costs in 11 European countries into country, industry,and temporal influences, and attribute 80% of the long-run differentials across countries and industries in employment growthto sectoral effects. They argue that Spain’s very high unemployment in the 1990s was mainly due to the difficulties thiseconomy had with reallocating workers from agriculture to industry. van Riet, Ernst, Madaschi, Orlandi, Rivera, and Benoıt(2004) review the main stylized facts concerning sectoral specialization in the European Union, as well as the changes thathave taken place over time. One of their findings is that some countries (notably Finland, Germany, and Sweden) experiencedabove-average rates of sectoral reallocation in the early 1990s. In their analysis of the service sector employment in the EU-15,D’Agostino, Serafini, and Ward-Warmedinger (2006) conclude that an efficient sectoral reallocation of labor has been hinderedby the inflexibility of the labor market and by the mismatch between workers’ skills and job vacancies.
4
turbulence could be defined as the increased net reallocation of workers between sectors during a period.
Second, turbulence may be defined as an increasing instability of employment relationships, i.e. an increase
in gross worker flows (cf. Farber, 1999). Third, one can define turbulence as an increase in mismatch on
the labor market. Layard, Nickell, and Jackman (2005) look at the mismatch between labor demand and
labor supply across economic sectors. This can be measured by examining either sectoral market tightness or
sectoral unemployment rates. Similarly, Marimon and Zilibotti (1999) construct a theoretical model where
workers have specific skills and firms have specific skill requirements. An increase in the mismatch between
skills and skill requirements can be seen as an increase in turbulence. In a related vein, Ljungqvist and
Sargent (2004) equate turbulence to the increased loss of human capital while workers are unemployed,
which reduces the incentive to take up a new job. This is especially the case when unemployment benefits
are high. Note that this definition only posits a reduced outflow rate from unemployment, but remains silent
about all other worker flows.
While there is thus a large literature on the causes and the effects of sectoral change, there seems to
be a lack of analyses which specifically look at the dynamics of this change. One exception is Greenaway,
Upward, and Wright (2000), who examine the behavior of net and gross worker flows in the UK over the
time period 1950-2000. Their key findings are, first, that gross worker flows do not display a secular trend,
and second, that net worker flows, i.e. sectoral reallocation, was higher in the 1970s and 1980s than in any
other post-war decade. They also argue that gross worker flows are not indicative of the amount of sectoral
reallocation occurring. Instead, they are best seen as an indication of the cost of sectoral reallocation. For
the US labor market, Fallick (1996) finds that workers hired into relatively fast-growing industries are mostly
drawn from the ranks of new entrants and re-entrants to the labor force. Golan, Lane, and McEntarfer (2007)
document the magnitude of worker reallocation between and within industries, as well as differences between
demographic groups, and show that old workers are much less likely to reallocate than younger workers.
Furthermore, they find that firm-level job and worker reallocation increases the transition probabilities of
even the most stable groups of workers.
2.3 The Business Cycle and Structural Change
Another, somewhat unsuccessful strand of the macroeconomic literature has linked structural change to
business cycle fluctuations. In his seminal contribution, Lilien (1982) associated downturns with periods
of high sectoral desynchronization, arguing that sectoral shocks require the reallocation of workers between
sectors. Because of the time-consuming nature of the labor reallocation process, frictional unemployment
arises, which raises the overall unemployment rate. This hypothesis did not hold up to subsequent analyses.
5
Abraham and Katz (1986) and Blanchard and Diamond (1989) show that the evolution of vacancies is not
consistent with the sectoral-shocks explanation. In particular, vacancy data do not suggest large differences
in labor demand between sectors. Without very strong complementarities across sectors, such sectoral
shocks cannot be seen as a cause of higher unemployment; rather, sectors merely differ in their sensitivity to
aggregate shocks. Despite a lack of empirical support, the “Lilien Hypothesis” gave rise to further attempts
to study sectoral complementarities and their role in the cycle. In a related vein, Caballero and Hammour
(1994) endogenized the restructuring decision to allow for endogenous scrapping of capital, implying that
recessions are better times for firms to “clean house” and shed unproductive capacity.
While this paper is mainly concerned with sectoral flows, it is related to a more general literature on
mobility in the labor market, looking especially at the consequences of worker mobility for individual workers
and for the economy as a whole.5 Voluntary job mobility by individual workers has been extensively analyzed
in the job search literature (for an overview of job search, see Rogerson, Shimer, and Wright, 2005). One of
the conclusions related to our investigation is that young workers follow a two-stage search strategy: they
first try to find a job in a preferred occupation, and only afterwards decide on which sector they want to work
in (see, for example, Neal, 1999). Involuntary job mobility, on the other hand, has been studied extensively
in the displaced workers literature (see, for example, Hamermesh, 1989, Burda and Mertens, 2001, Kuhn,
2002, and Bender and von Wachter, 2006). Displacement has implications both for future wages and for
the subsequent labor market history of workers. These consequences are likely to be more negative when a
worker has to change sector or occupation, as this implies the loss of sector- or occupation-specific human
capital. Worker mobility thus plays a role for the evolution of the wage structure.6 Worker mobility is of
central importance for allocating workers to their most productive use in the economy.
2.4 Empirical Evidence for Germany
The dynamics of the German labor market were analyzed by Bachmann (2005) using the IAB Regional File
1975-2001. This data set consists of registry data provided by the Institute for Employment Research (IAB)
of the German Federal Employment Agency. He finds that worker flows do not display a marked trend
over the time period considered, but that there is an acceleration in gross flows in the second half of the
1990s. This is consistent with the evidence presented by Winkelmann and Zimmermann (1998), who find no
evidence of increased job instability in Germany for the time period 1974-94. Similar findings are reported
by Farber (1999) for the US. As for the cyclical features of worker flows, Bachmann (2005) shows that while
5Jovanovic and Moffitt (1990) estimate a structural model with both idiosyncratic and sectoral productivity shocks. Theyfind that, for the US between 1966-1980, while having a lower impact than idiosyncratic factors, sectoral shocks play animportant role for gross worker mobility.
6This issue is also analyzed by Kambourov and Manovskii (2004) and Vella and Moscarini (2004).
6
separations are relatively flat over the business cycle, accessions are procyclical. This points to the fact
that hirings, i.e. inflows into employment, play a key role for the dynamics of the labor market. In the US
context, this point has been stressed by Hall (2005) and Shimer (2005). Velling and Bender (1994) analyze
the cross-sectional properties of occupational mobility for employment covered by social security legislation
for the year 1989. They also use registry data provided by the IAB. Their main findings are as follows:
occupational mobility depends on worker characteristics such as age, education, and sex. Furthermore,
the labor market history of a worker, in terms of both wages and previous transitions, has an important
impact on the probability of a change of occupation. Bender, Haas, and Klose (1999b) provide descriptive
evidence on both types of mobility for the time period 1985-1995 using the same data set. From this, they
conclude that the influence of the business cycle on both series is strong. Furthermore, unemployed workers
are found to have become more mobile over the time period considered. Gathmann and Schoenberg (2006)
analyze the transferability of specific skills across occupations using the IAB employment sample (IABS)
1975-2001. They find that movers can transfer between 20 and 33% of the value of occupational tenure across
occupations. Isaoglu (2006) explicitly analyzes occupational mobility of male employed workers in Germany
for the time period 1985-2003 using the German Socio-Economic Panel Study (SOEP). She estimates probit
transition models and concludes that occupational mobility is strongly procyclical and dependent upon
individual characteristics.
2.5 This Study
Our study is explorative in nature and meant to aid the inductive search process from a wide class of existing
models. To do so, we use information on individual transitions in the IAB employment sample (IABS) for the
time period 1975-2001 to study aggregate gross and net sectoral worker flows over the period 1975-2001. The
main advantages of the IAB data set, which is described in detail below, are that the information is relatively
accurate, that the sample size is very large, and that the same workers are followed over a long period of time.
Using different concepts and definitions, we first investigate the extent of structural change and turbulence in
West Germany. We then analyze sectoral and occupation worker mobility in more detail.7 Our results show
which worker flows are most prevalent in the economy as a whole, and which worker flows contribute most to
structural change. Furthermore, we investigate whether differences in sectoral employment growth rates can
be attributed to workers leaving shrinking sectors (sectoral outflows) or to workers entering growing sectors
(sectoral inflows). We also show that the adjustment processes leading to changes in sectoral employment
stocks depend very much on the growth rate of the sectors under investigation. Finally, we investigate the7The results presented in this paper focus on sectoral change. More results on occupational change are in Bachmann and
Burda (2007).
7
role of the business cycle for the pace of structural change.
3 Data and Measurement Issues
3.1 The IAB Regional File
The data set used is the IAB Regional File 1975-2001 (IABS-R01), which is generated by the Institute for
Employment Research (IAB) of the German Federal Employment Agency. The data base covers 2% of all the
persons who worked in an employment covered by social security between the 1st January 1975 (for western
German employees) or the 1st January 1992 (for eastern German employees) and the 31st December 2001.
The data source consists of notifications made by employers to the social security agencies, which include
health insurances, statutory pension schemes, and unemployment insurance.8 These notifications are made
on the behalf of workers, employees and trainees who pay contributions to the social insurance system. This
means that, for example, civil servants and self-employed are not included. Overall, the subsample includes
roughly 1.3 million people, of which 1.1 million are from western Germany. For 1995, the employment
statistics, from which the IAB Regional File is drawn, cover roughly 80% of the employed persons in western
Germany, and 86% of all employed persons in eastern Germany. Of the unemployed, only those entitled
to unemployment benefits are covered. This means that the unemployment stock is about one third lower
than the one reported in official labor statistics.9 Data observations are generated by notifications which
are made at the beginning and at the end of an employment or unemployment spell. Furthermore, there is
an annual report which updates some of the information. The information provided is the following: sex,
year of birth, and degree of education/training. Also, information on the occupation and the gross earnings
of workers, an establishment number, and the economic sector is available on a daily basis. Our notion of
a job is based on establishments, not firms, which means that a change of establishment within the same
firm will also be recorded as a job change. Employers do not have to notify the social security agency if only
the sector or the occupation of an employee changes. However, this information must be reported in every
mandatory notification, i.e. at the beginning of an employment spell, and at the beginning of every calendar
year. As a change of sector always involves a new employment relationship, and thus a new notification,
every such change is recorded. This is not true for changes of occupation, as this might well change for an
employee while he remains in the same establishment. Therefore, a change of occupation on the same job
will only be recorded at the end of the year. This means that some occupational mobility is not recorded, for
example when the reported occupation of an employee changes and the match is destroyed before the next8For a complete description of the data set, see Bender, Haas, and Klose (2000).9See Bender, Haas, and Klose (1999a).
8
annual notification. Thus, we have exact information on sectoral mobility, and a lower bound on occupational
mobility. The empirical analysis considers 16 broad economic sectors; 128 different occupations are recorded.
Two states of the labor market can be directly derived from the data set: employment covered by social
security, and unemployment, if the worker is receiving some form of unemployment compensation. The
third state that we consider, “nonparticipation”, is not directly recorded but is defined as those individuals
of working age who do not pay social security contributions while employed, and do not receive unem-
ployment benefits. This means that nonparticipation includes the state “out-of-the-labor-force”, but also
self-employment, civil service employment, retirement, or marginal employment.10
This data set has a number of unique advantages. First, it does not suffer from the problems inherent
in most panel data sets, e.g. there is no sample attrition, and it follows workers over a long period of time
as opposed to rotation-based samples such as the CPS.11 Given the length of our times series, the evidence
here is likely to be more conclusive than the US studies cited above, which observe only one episode of
labor market tightening (1994-2000) and slowdown (2000-2003). Our data set covers two decades and two
full business cycle swings. Second, it offers observations at a very high frequency, which means that every
actual transition is observed. This is a distinct advantage over survey data like the CPS or the SOEP, which
does not record multiple transitions that take place between two interview dates and, in the case of the
SOEP, uses retrospective data. Two limitations of the data are noteworthy. First, it is representative for the
working population covered by social security legislation, and not the entire working population. Second, it
only covers unemployed who receive unemployment benefits. Therefore, this special structure of the data
set should be taken into account when interpreting the different flows, especially the ones into and out of
nonparticipation.
3.2 Construction of Worker Flows
In order to fully exploit the daily structure of the data set at hand, we calculate flows cumulatively, i.e.
counting every transition between labor market states that takes place within a given month, even if there
are several changes of state within this time period. Thus, we take into account short spells as well, which
are generally not recorded in other data sets.12 Commensurately, we need to address the possibility of
measurement errors in the data. In particular, workers’ notifications of leaving the state of unemployment
might not always correspond exactly to the actual change of labor market state. We correct for this latter
potential measurement error in the following way: If the time interval between an unemployment and
an employment record is smaller than 30 days, we count it as a direct transition between the two states10Cf. Fitzenberger and Wilke (2004) for an in-depth analysis of this issue.11Technically attrition is possible in the sense of non-benefit recipients and labor force activity in the underground economy.12In the CPS, for example, workers are rotated out of the sample after 4 months.
9
recorded.13 If the gap between two notifications is larger than 30 days, we count this as an intervening
spell of nonparticipation. As for job-to-job flows, records that are from the same person and the same
establishment are counted as one single spell as long as the time between two consecutive employment
notifications does not exceed 7 days.
As we are interested in consistent time series that go back as far as possible, the empirical analysis is
restricted to workers from western Germany. As there is no information on the place of residence in the data
set, we discard observations on employees that at some point have worked in eastern Germany. We also drop
some observations, such as artists, who feature an implausibly high number of spells.14 As these observations
are due to administrative rules, they are not interesting from an economic point of view. The number of
people receiving unemployment benefits is measured with significant error before 1980; consequently, the
stock of those workers, as well as the flows from that state, are not used. As employment is correctly
measured, we obtain reliable estimates for direct job-to-job transitions for the entire time period 1975 to
2001.
4 Findings: Sectoral Employment and Structural Change
4.1 The Sectoral Structure of the German Economy
We begin by examining trends in the allocation of dependent status, socially-insured employment across six
main sectors of the economy: agriculture, production, energy and mining, trade and transport, services and
government. Dependent-status employment is defined for each year in our sample (1975-2001) as the average
of the employment levels on the 15th of every month of that year.15 The results are displayed in Figure
A.1, which conveys the quantitative importance of the different sectors. For the time period considered,
most workers were employed in production, in the service sector, and in trade and transport; construction,
agriculture, energy, and mining, and the public sector are quantitatively much less important. The three
latter sectors, as well as trade and transport, are relatively stable over time and show little if any pronounced
trend. The most striking evolution in the graph is the reduction of the employment share in the production
sector, and a concomitant, sharp increase in the size of the service sector. The employment share of services
rises by more than 10 percentage points, matched by an equal decline in the production sector’s share.
Sectoral shares of full-time and part-time employment for a finer breakdown of 16 sectors are presented in
Table A.1 in the appendix. Over the time period 1975-2001, household-related services remained relatively13Recalculation of spells for shorter intervals does not change the results significantly.14“Implausibly high” is defined as 200 employment spells or more per year.15Ideally, one would use beginning or end of year figures. However, due to the particular way in which the data are collected
in the IAB-data set, we are unable to do so.
10
stable; the employment share of social services, however, increased by over 80%, and the share of business
related services more than doubled. As for shrinking sectors, the decline in the employment share is strongest
for primary and intermediate goods production (-40%), consumption goods (-41%), and construction (-45%).
The main message of this analysis is that over the last decades, an ongoing process of structural change in
the German economy has reallocated workers from the production sector to the service sector. Within the
service sector, business-related services have increased most, while the share of household-related services
has remained relatively constant. Moreover, this process seems to have accelerated since 1990. A natural
question to address is whether the reallocation of workers from shrinking to expanding sectors has been
smooth, or whether the pace of structural change has accelerated over time. This is the topic of the next
section.
4.2 Net Structural Change and Turbulence
As a measure of the pace of structural change, we follow Layard, Nickell, and Jackman (2005) in calculating
a Lilien (1982)-type index which takes the form16
λd,t =12
J∑
j=1
∣∣∣∣∆dEj,t
Et
∣∣∣∣ . (1)
Here, J denotes the number of economic sectors considered, Ej,t is employment in sector j in period t,
Et is total employment in period t, ∆ is the difference operator, and d indicates the number of years over
which the difference is taken. Thus, for example, λ1,t measures the turbulence at time t as half the sum of
changes in sectoral shares from year t − 1 to year t. The evolution of the turbulence index is depicted in
Figure A.2 for six main economic sectors and three differences, namely 1-, 5-, and 8-year differences. As one
can see, the indices rise with the time interval considered, i.e. the λ5-index is larger than the λ1-index, and
the λ8-index is larger than the λ5-index. This could have been expected as the λ1-index captures short-run
changes (from one year to the next), while the other indices capture more long-run trends. What is striking
however, is that all three measures indicate a marked increase in the 1990s, especially the first part of that
period. This is in all likelihood due to the impact that German reunification had on the labor market of the
entire country. But even in the second half of the 1990s, the indices do not return to the previous, lower
levels of the 1980s. Neglecting the jump in the early 1990s and comparing the time periods 1985-89 and
1995-99, the means of the three indices increase by at least 85%. This means that this type of turbulence16For more discussion and use of this index, see Layard, Nickell, and Jackman (2005). The original Lilien (1982) index is
defined as σ =[∑J
j=1(Ejt
Et)(∆ log Ejt −∆log Et)
]1/2. The reason for calculating a modified index is that it provides a more
natural point of comparison for the flow analysis we are conducting. The two indices yield very similar results.
11
did not abate even more than five years after German reunification. This finding is robust to using a finer
division of sectors, and also holds for occupational turbulence (cf. Table A.2).
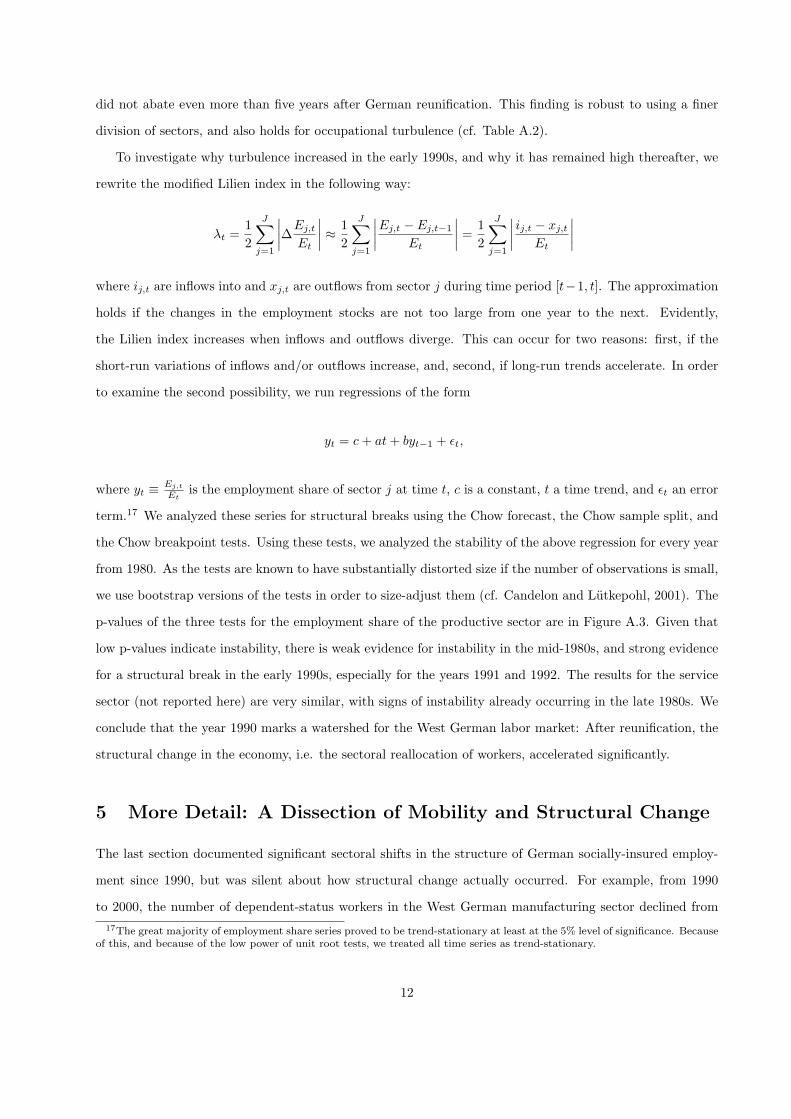
To investigate why turbulence increased in the early 1990s, and why it has remained high thereafter, we
rewrite the modified Lilien index in the following way:
λt =12
J∑
j=1
∣∣∣∣∆Ej,t
Et
∣∣∣∣ ≈12
J∑
j=1
∣∣∣∣Ej,t − Ej,t−1
Et
∣∣∣∣ =12
J∑
j=1
∣∣∣∣ij,t − xj,t
Et
∣∣∣∣
where ij,t are inflows into and xj,t are outflows from sector j during time period [t−1, t]. The approximation
holds if the changes in the employment stocks are not too large from one year to the next. Evidently,
the Lilien index increases when inflows and outflows diverge. This can occur for two reasons: first, if the
short-run variations of inflows and/or outflows increase, and, second, if long-run trends accelerate. In order
to examine the second possibility, we run regressions of the form
yt = c + at + byt−1 + εt,
where yt ≡ Ej,t
Etis the employment share of sector j at time t, c is a constant, t a time trend, and εt an error
term.17 We analyzed these series for structural breaks using the Chow forecast, the Chow sample split, and
the Chow breakpoint tests. Using these tests, we analyzed the stability of the above regression for every year
from 1980. As the tests are known to have substantially distorted size if the number of observations is small,
we use bootstrap versions of the tests in order to size-adjust them (cf. Candelon and Lutkepohl, 2001). The
p-values of the three tests for the employment share of the productive sector are in Figure A.3. Given that
low p-values indicate instability, there is weak evidence for instability in the mid-1980s, and strong evidence
for a structural break in the early 1990s, especially for the years 1991 and 1992. The results for the service
sector (not reported here) are very similar, with signs of instability already occurring in the late 1980s. We
conclude that the year 1990 marks a watershed for the West German labor market: After reunification, the
structural change in the economy, i.e. the sectoral reallocation of workers, accelerated significantly.
5 More Detail: A Dissection of Mobility and Structural Change
The last section documented significant sectoral shifts in the structure of German socially-insured employ-
ment since 1990, but was silent about how structural change actually occurred. For example, from 1990
to 2000, the number of dependent-status workers in the West German manufacturing sector declined from17The great majority of employment share series proved to be trend-stationary at least at the 5% level of significance. Because
of this, and because of the low power of unit root tests, we treated all time series as trend-stationary.
12
8.5m to 6.5m.18 How was this reduction achieved? To answer this question, we use our data set to compute
individual gross worker flows, exploiting longitudinal information on the workers in question.
Gross flows can occur for several reasons. A change in labor demand of one economic sector relative to
the others gives rise to flows from one sector to another; here, gross flows of workers are associated with net
sectoral reallocation. Changes in idiosyncratic productivity of a match can also result in worker flows which
at some later date lead to matches in a different economic sector. It is possible to imagine workers “trading
places” between sectors - without changing relative sectoral employment levels, or young workers replacing
retirements. Here, a worker flow in one direction implies another in the reverse direction. These two worker
movements thus lead to gross reallocation of labor while leaving net reallocation and the distribution of
workers across sectors unchanged.
5.1 Gross Sectoral and Occupational Mobility
We first consider employment inflows: newly formed employment relationships (accessions) involving a
change of sector, or occupation, or both, and distinguish between three different states of origin: em-
ployment, unemployment, and nonparticipation. Effectively, we are looking at flows entailing a change of
sector/occupation with workers moving from one employer to another (EE flow) and from unemployment
to employment (UE flow). Furthermore, transitions from the state of nonparticipation (technically, non-
registration) to employment (NE flow) are analyzed.19 The analysis is conducted separately for men and
women, and for three different age groups, 16-29, 30-49 and 50-65.
The central statistic for our analysis is the rate of incidence of a transition expressed as a ratio to the stock
of the originating state at the beginning of the period (employment, unemployment and nonparticipation),
measured over a fixed period of time. While these rates are expressed on a cumulative monthly basis (i.e.
all transitions are recorded on a daily basis), they will be generally presented as annual averages or averaged
over several years. This rate captures the overall level of sectoral or occupational mobility, respectively. As
both types of mobility are likely to be related to the type of transition a worker experiences at the same
time, we also study the sectoral and occupational transition rates conditional on one particular employment
transition occurring. The rates generated in this way are meant to capture sectoral and occupational mobility
over and above the movements in worker flows.18Cf. Statistische Amter der Lander (2006).19Note that the data set does not contain any information on workers when they are neither in dependent-status employment
nor receive unemployment compensation. We are therefore not able to report changes of sector or occupation for EN and NEtransitions.
13
5.1.1 Cross-Sectional Results
Table A.3 provides an overview of different labor force transition rates on an annual basis for the time periods
1981-1990 and 1991-2000. Note that the transition rates to a new employer or to a new sector are calculated
in the cumulative way described above. This means that all transitions are taken into account, also when a
worker has multiple transitions within one year. The results show that transitions from employment are most
likely to lead to nonparticipation or to unemployment. The annual rate at which workers experience a direct
job-to-job transitions is lower, and these transitions more often take place within the same sector rather
than involving a change of sector. Workers leaving unemployment are most likely to transit to the state of
nonparticipation. Furthermore, when a worker leaves unemployment, he is more likely to find a job in the
sector where he has worked previously rather than in a different sector. Exits from nonparticipation usually
lead to employment, and not to unemployment. Finally, note that these transition rates have changed over
time, as a comparison between the two time periods considered shows. This issue will be considered in the
next section.
Next, we analyze differences between age cohorts, and men and women. Table A.4 shows the uncon-
ditional incidence, for dependent status employees, of moving into employment and changing sector at the
same time, as well as the rate of sectoral change conditional on making a certain type of transition. The
corresponding results for occupational changes are presented in Table A.5. The rates of incidence are very
similar with respect to sectors and occupations. Looking at the differences between age cohorts, one can see
that the incidence rates are all strongly falling with age, which is similar to evidence presented by Golan,
Lane, and McEntarfer (2007) for the United States. This finding can be rationalized by the fact that young
workers, who have only relatively recently entered the labor market, are engaging in job shopping in order
to look for the sector and the occupation that suits them best (cf. Neal, 1999). For older workers, this effect
is of less importance. Also, older workers have accumulated more sector/occupation-specific human capital.
Changing sector or occupation therefore entails a larger loss of human capital for older workers than for
younger workers. Hence, the propensity to change sector and occupation is falling with age.20
In general, women exhibit lower rates of sectoral and occupational change. This finding is in line with the
evidence presented in Fitzenberger and Kunze (2005), who argue that female workers are often locked in low
wage careers, characterized by low mobility and for which job changes only lead to small wage gains. The
measure of sectoral and occupational mobility is higher when a worker has been unemployed previously than
when he experiences a direct job-to-job transition. This implies that direct job-to-job transitions generally
take place between jobs involving the same sector and occupation. These results are quite similar for women,20Because sectors are more broadly defined than occupations, the rate of sectoral change is generally lower than that for
occupational change.
14
with one exception: for young women, direct job-to-job transitions are much less likely to involve a change
of occupation than for young men.
5.1.2 Long-Run Trends
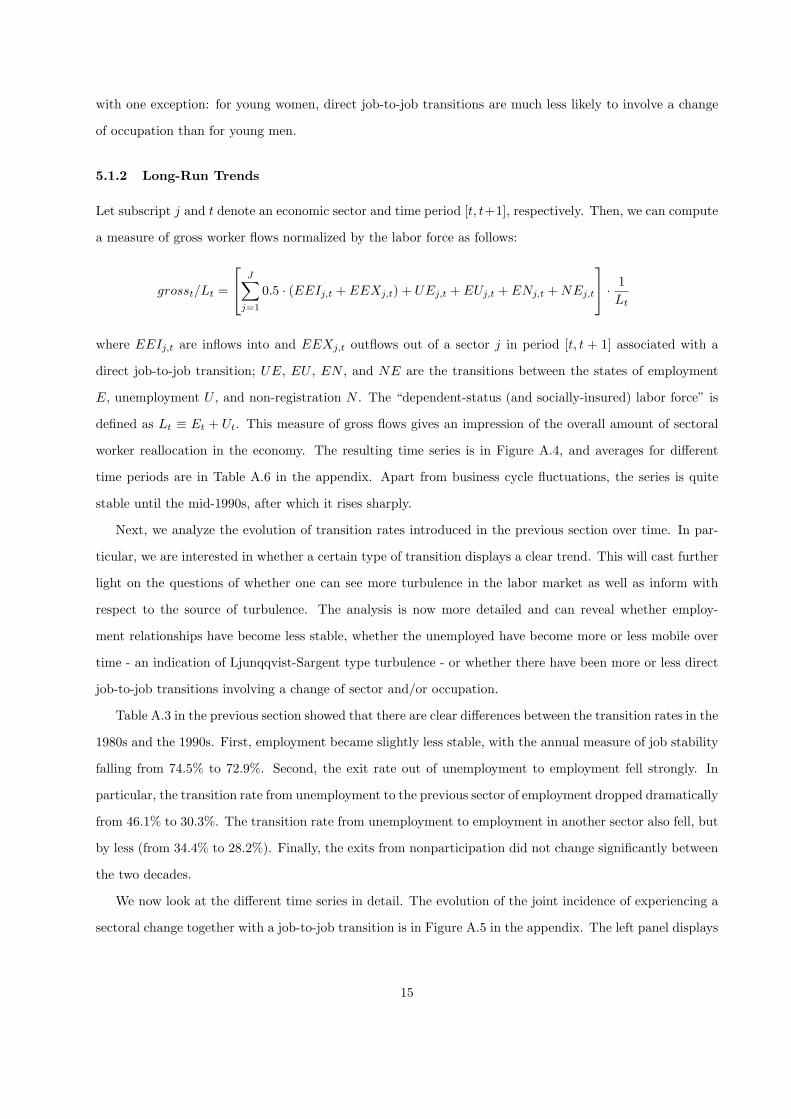
Let subscript j and t denote an economic sector and time period [t, t+1], respectively. Then, we can compute
a measure of gross worker flows normalized by the labor force as follows:
grosst/Lt =
J∑
j=1
0.5 · (EEIj,t + EEXj,t) + UEj,t + EUj,t + ENj,t + NEj,t
· 1
Lt
where EEIj,t are inflows into and EEXj,t outflows out of a sector j in period [t, t + 1] associated with a
direct job-to-job transition; UE, EU , EN , and NE are the transitions between the states of employment
E, unemployment U , and non-registration N . The “dependent-status (and socially-insured) labor force” is
defined as Lt ≡ Et + Ut. This measure of gross flows gives an impression of the overall amount of sectoral
worker reallocation in the economy. The resulting time series is in Figure A.4, and averages for different
time periods are in Table A.6 in the appendix. Apart from business cycle fluctuations, the series is quite
stable until the mid-1990s, after which it rises sharply.
Next, we analyze the evolution of transition rates introduced in the previous section over time. In par-
ticular, we are interested in whether a certain type of transition displays a clear trend. This will cast further
light on the questions of whether one can see more turbulence in the labor market as well as inform with
respect to the source of turbulence. The analysis is now more detailed and can reveal whether employ-
ment relationships have become less stable, whether the unemployed have become more or less mobile over
time - an indication of Ljunqqvist-Sargent type turbulence - or whether there have been more or less direct
job-to-job transitions involving a change of sector and/or occupation.
Table A.3 in the previous section showed that there are clear differences between the transition rates in the
1980s and the 1990s. First, employment became slightly less stable, with the annual measure of job stability
falling from 74.5% to 72.9%. Second, the exit rate out of unemployment to employment fell strongly. In
particular, the transition rate from unemployment to the previous sector of employment dropped dramatically
from 46.1% to 30.3%. The transition rate from unemployment to employment in another sector also fell, but
by less (from 34.4% to 28.2%). Finally, the exits from nonparticipation did not change significantly between
the two decades.
We now look at the different time series in detail. The evolution of the joint incidence of experiencing a
sectoral change together with a job-to-job transition is in Figure A.5 in the appendix. The left panel displays
15
these rates for different age groups of male workers, while the right panel shows the same for female workers.
While there is no long-term trend in the data, the series are strongly procyclical. Furthermore, the cylicality
is falling with age. In order to keep the analysis tractable, in the remainder of this section, we only discuss
the results for men aged between 30 and 49.21
Figure A.6 depicts different measures of flows between sectors.22 The left panel shows the fraction of
new employment relationships which involve a worker who has changed sector, and who has made either
a direct job-to-job transition, or who has been previously unemployed, or not in the data set. The right
panel displays the fraction of new employment relationships which involve a worker who has changed sector
conditional on a certain labor market transition. The latter transition thus abstracts from movements in the
number of labor market transitions, and focuses on the fraction of labor market transitions which lead to a
change of sector in the total number of a certain labor market transition. As for trend behavior, none of the
series features a strong long-run trend, with one exception: The conditional incidence measure of changing
sector after an unemployment spell has been strongly rising since the early 1980s. Thus, the unemployed
seem to have become more mobile across sectors during the last two decades. This might be an indication
for Ljungqvist-Sargent type turbulence: If the skills of the unemployed started depreciating more quickly
from the early 1980s, then it is likely that the unemployed will have a lower propensity to return to their
sector and/or occupation in later periods.
5.1.3 Gross Sectoral Flows and Outsourcing
Structural change does not only occur because workers are moving from one economic sector to another.
Organizational changes within firms can also play an important role. In particular, firms might split up
along their business divisions. As an example, a car manufacturer might create a subsidiary firm dealing
uniquely with the logistics of the manufacturer. In the extreme case, the subsidiary firm will employ exactly
those workers that were previously employed by the manufacturer, and perform exactly the same tasks.
This case of “outsourcing” would show up as a sectoral employment shift, although the tasks performed
in the economy have not changed. In order to test whether outsourcing is driving our results, we employ
the following strategy:23 Outsourcing as in the case described above would involve a sectoral transition of
an individual worker, but not a change of occupation. We therefore analyze which percentage of sectoral
transitions involve a change of occupation as well. As direct job-to-job transitions are likely to play the most
important role in this respect, we concentrate on these flows. The result is in Table A.7.21The results for all age groups, and men and women, are similar with respect to long-run trends and cyclicality. They are
available from the authors upon request.22Cf. Bachmann and Burda (2007) for evidence on occupational mobility.23If there was firm information in the data set we use, we could analyze this issue in greater detail. However, this is
unfortunately not the case, i.e. we only dispose of information on individual workers.
16
It becomes apparent that in all time periods considered, the majority of direct job-to-job transitions
across sectors go together with a change of occupation. Furthermore, the percentage of sectoral EE flows
involving a change of occupation has not fallen dramatically, as would have been the case if outsourcing had
been a major driving force behind structural change. We see these results as evidence that outsourcing could
have played some role, but certainly not an overwhelming one.
5.2 Net Flows
Having examined gross flows and sectoral inflows and outflows, we now turn to the analysis of net sectoral
flows, i.e. changes in sectoral employment stocks. We calculate two different measures of net reallocation:
the first measure has a net effect on sectoral employment stocks on a monthly basis, the second has a net
effect on a yearly basis. Note that these two measures can move independently from each other, depending
on which proportion of short-run turbulence is canceled out over the year.
Both time series are in Table A.8 and in the left panel of Figure A.4. The results show a marked difference
between the two time series computed. Net flows on an monthly basis display a relatively small, but clear
downward trend. This implies that the short-run variation in net changes has declined over time. Calculating
net flows from seasonally adjusted worker flows reveals that this decline is entirely due to seasonal factors.
Net flows on a yearly basis, on the other hand, increased over the same time period, and especially in the
early 1990s. Given the results obtained for the modified Lilien index in Section 4.2, the latter result is
not surprising. However, the fact that at the same time seasonally-induced short-run variations declined is
somewhat of a puzzle.
5.2.1 Accounting for Changes in Employment Stocks: The Role of Different Labor Market
Transitions
Having found that the evolution of employment stocks changed significantly from the beginning of the 1990s,
we now want to analyze in more detail where these changes come from. In order to do so, we calculate the
flow components of changes in stocks. Note that sectoral reallocation can be expressed in terms of flows:
nett/Lt =
J∑
j=1
|EEIj,t − EEXj,t + UEj,t − EUj,t + NEj,t − ENj,t| · 1
Lt
We calculate both the differences EEI − EEX, NE − EN , UE − EU , and the individual flows.
17
Net Flows: Aggregate Evidence
The results for the economy as a whole are in Table A.8. Several features are noteworthy. First, direct
job-to-job transitions only play a minor role for structural adjustment. Not only is their level low relative
to the other flows, but their net impact, measured by the difference between EEI and EEX, is low as well.
Furthermore, their net effect over the time period considered is relatively stable. Second, both according to
their level and their net effect, the flows between employment and unemployment are much more important.
The level of these flows is relatively stable until the mid-1990s and increases thereafter. Finally third, the
flows between employment and non-registration play the most important role. This is both true for the level
of the gross flows, and for the net effect, which peaked in the second half of the 1990s.
The analysis in this section up to now was for the economy as a whole. However, given the divergence in
the evolution of employment between sectors, one would presume that there are also important differences
in the way these net changes come about. In order to investigate this matter further, we again look at the
differences between flows, as well as at individual flows. This time, however, we do so for two sectors: first,
the consumption goods sector, which lost 35% of its employment share between 1975 and 2001, and second,
the business-related service sector, whose employment share grew by 75% during the same period.
Net Flows: Growing vs. Shrinking Sectors
The results for the consumption goods sector are in Table A.9, and those for the business-related service
sector are in Table A.10 in the appendix. Direct job-to-job transitions are higher in the growing sector. The
net contribution of these transitions to employment change (|EEI − EEX|) is very small in both sectors
though.
Two noteworthy aspects differentiate the two sectors. First, the outflow rates are not appreciably dif-
ferent, and the one for the growing sector is even higher (22.9% for the service sector and 20.7% for the
consumption goods sector). Higher growth of the service sector can be attributed to its higher inflow rate
(25.7%, vs. 18.7% in the consumption goods sector). Second, there is a large difference in the net contribu-
tion of the flows between employment and unemployment. For the shrinking sector, these flows are relatively
high (with flows from unemployment accounting for nearly one third of sectoral employment inflows), and
they play by far the most important role for net sectoral employment changes. This is not the case for the
business-related service sector, where unemployment flows play a much smaller role (one fifth of sectoral
inflows). By contrast, the gross transitions between non-registration and employment are lower for the de-
clining sector than for the growing sector (53% vs. 62% of sectoral inflows, respectively). Furthermore, these
18

flows are of minor importance for changes in the sectoral employment share in the declining sector. The
opposite is true in the growing sector: here, the flows between employment and nonparticipation are by far
the most important contributor to changes in the employment share. We conclude that direct job-to-job
transitions only play a minor role for net worker reallocation in both sectors, flows between unemployment
and employment are most important for this purpose in the shrinking sector, which is the case for transitions
between non-registration and employment in the growing sector. The results featured by the consumption
goods sector and the business-related services sector can be found for the other sectors of the economy as
well, depending on their respective growth performance. In other words, the features of the consumption
goods sector are shared by the other shrinking sectors in the economy, and those of the business-related
services sector are shared by the other growing sectors.
5.2.2 Accounting for Changes in Net Flows: The Persistence of Sectoral Flows and Sectoral
Recalls
As shown above, net sectoral worker flows have increased mainly in the early 1990s, while gross sectoral
worker flows only started to increase from the mid-1990s. This points to the issues of the persistence of
sectoral flows, as well as of sectoral recalls. In this section, we try to measure the persistence of both. First,
as a measure of the persistence of sectoral worker flows, we calculate which percentage of those workers who
start employment in a new sector at a given point in time are still employed in this sector in the next year.
Second, in order to analyze which role temporary movements play, we also calculate sectoral recalls. In
particular, we quantify the percentage of workers who start employment in a new sector and who take up
an employment again in the sector they were previously employed in one year later. We calculate these two
time series both for workers who were employed, and for workers who were unemployed, before their sectoral
switch. The results are summarized in Table A.11. Neither the persistence of sectoral flows coming from
employment, nor the persistence of sectoral flows coming from unemployment, has increased significantly
since the early 1980s. However, the inclination of workers to return to their previous sector has clearly
declined. This is true both for workers coming from employment and from unemployment. The latter fact
speaks in favor of sectoral shocks having become more permanent.
We conclude that direct job-to-job transitions play only a minor role for new worker reallocation in both
sectors. In shrinking sectors, it appears that worker flows between unemployment and employment are most
important for this purpose, while in growing sectors, this is true for transitions between non-registration
and employment. This means that, in reality, we observe elements of the Lucas and Prescott (1974) vision
of the world, namely employment-unemployment transitions; the pervasiveness of worker flows to and from
nonparticipation, however, points to features stressed by Rogerson (2005). The relative importance of
19
transitions for worker reallocation appears to depend on the growth rate of a given sector.
5.3 Worker Reallocation Over the Business Cycle
The effect of the business cycle on the economy as a whole and on the labor market in particular has been a
contentious issue at least since the times of Schumpeter (1942). On the one hand, recessions can be seen as
being “cleansing”, because they are times when outdated techniques and products are squeezed out of the
market (Caballero and Hammour, 1994). On the other hand, recessions coincide with sharp declines in job-
to-job transitions, which generally improve the quality of worker-firm matches (Barlevy, 2002). Recessions
can thus lead to a reduction in the average quality of newly created matches, i.e. they can have a “sullying”
impact.
We add a new dimension to this debate by looking at the cyclicality of sectoral and occupational changes.
The cylicality of gross flows and sectoral mobility can be seen in Figure A.6, which examines both transitions
going together with a change of sector (left panel in the figures), and changes of sector conditional on a certain
transition (right panel in the figures).24 The state of origin clearly matters. In a recession, fewer workers
enter a new employment involving a different sector directly from another job or from nonparticipation.
Furthermore, given a transition from those two states of origin, the rate of sectoral change goes down in a
recession as well. Workers take advantage of favorable business cycle conditions in order to engage in on-
the-job search, which then often results in a change of sector or occupation. On the contrary, in a recession,
workers search less on-the-job, and even if they are successful in finding a new job, this transition is less
likely to involve an occupational or sectoral change than in a cyclical upswing.25
The picture looks different for workers coming from unemployment. In a downturn, the number of
workers making a transition from unemployment to employment and switching sector increases. However,
the rate of sectoral change conditional on having made a transition from unemployment to employment is
falling. In other words, flows from unemployment to employment are generally going up in a recession.26
This also raises the number of UE transitions which coincide with a change of sector, but the share of UE
transitions involving a sectoral switch is falling. Therefore, in a recession, the rate at which unemployed
workers find a new job in the sector they were previously working in is going up. This is in all likelihood
due to the fact that, in a recession, the proportion of workers who have only very recently joined the pool of
the unemployed, is rising. These workers usually command more than average sector- specific human capital
and will be rehired quickly in their sector of origin.24We only present the evidence on sectoral mobility here. Occupational mobility displays similar cyclical features, cf. Bach-
mann and Burda (2007).25The pro-cyclicality of on-the-job search has been established by a number of researchers, including Burgess (1993) for the
UK, and Fallick and Fleischman (2004) for the United States.26The finding of procyclical exits from unemployment to employment is consistent with Burda and Wyplosz (1994).
20
It is also instructive to analyze the behavior of net and gross sectoral mobility, depicted in Figure A.4.
In a recession, gross employment flows fall, which is also due to a reduction in the number of job-to-job
transitions (cf. Bachmann, 2005). This is the “sullying” aspect of recessions. On the other hand, net
flows go up in a downturn. This means that sectoral reallocation increases in bad times, i.e. recessions in
Germany appear to be times of economic restructuring. In an upswing, the labor market is relatively tight,
leading workers to engage in on-the-job search. Direct job-to-job transitions are a consequence. However,
workers appear reluctant to change sector or occupation as this involves the loss of at least some sector- or
occupation-specific human capital. Therefore, net employment changes are relatively low. In a downturn,
the reverse is true: firms’ hiring activity is low, and more workers have to change sector in order to find a job
at all, even if this involves the loss of some specific human capital. In recessions, gross worker flows decline,
even while net worker flows are increasing.
6 Conclusion
Like all industrial countries, Germany has experienced at least two decades of considerable structural change.
This paper set out to document the extent to which the labor market developments have mirrored the
structural change in output composition. In particular, are gross and net labor market flows into and out
of employment informative about the way structural change occurred? Was the decrease in employment
in shrinking sectors a result of an increase in separations or a decrease in accessions? Was the increase in
employment in growing sectors a result of an increase in accessions or a decrease in separations? Did the
newly hired in growing sectors originate from outside the labor force, or were they unemployed, or even
already employed? Have workers become more prone to switch occupational and industrial attachment? Are
these processes sensitive to the business cycle? Has there been a recognizable change in recall behavior of
firms, that is, to reemploy those with previous experience in the sector? In order to analyze the dynamics
of structural change in more detail, we constructed aggregate worker flows from a micro employee data set
covering 2% of the socially insured labor force spanning the time period 1975-2001.
At the outset, we documented an important fact which has gone virtually unnoticed in the literature: the
pace of structural change in socially insured employment in the west German economy accelerated sharply
after 1990, i.e. the manufacturing sector began shrinking more quickly, and the growth rate of the service
sector increased significantly. While the employment share of the service sector rose by six percentage points
in the period 1976-1990, that pace of change quickened to ten percentage points over the period 1991-2000.
This development was accompanied by a significant increase in “turbulence” or variance of net employment
21
changes, as measured by the dispersion or variance of k-period growth rates. In contrast to phenomena
stressed by Lilien (1982), the changes we find in Germany appear to be of longer term nature. Cyclical
movements appear to mask low-frequency structural change which is more evident when differencing is
performed on longer intervals. Interestingly, we found that gross worker (employment) flows and net worker
flows - flows having a net impact on sectoral employment stocks - have not always moved together. In
particular, net worker flows increased dramatically in the early 1990s, while gross worker flows only started
to increase in a significant way after 1995. Put differently, the net sectoral “yield” from gross worker flows
increased sharply since 1990.
We then investigated net worker flows in more detail. We found that job-to-job flows play only a minor
role for net changes in sectoral employment, followed by transitions between employment and unemployment.
Most important are flows between employment and nonparticipation (defined as being outside the group of
employed or unemployed dependent-status employment). At the same time, gross flows can vary significantly
between sectors, as seen by a comparison of a sharply contracting sector (e.g. consumer goods) with a strongly
growing sectors (e.g. business-related services). In particular, we showed that the differences in employment
growth between the two sectors were due to the low inflow rate of the consumer goods sector and the high
inflow rate of the business-related services sector. By contrast, the outflow rates were relatively similar
between the two sectors. These results resemble the findings by Shimer (2005) using aggregate time series
data. We documented furthermore that, for the shrinking sector, flows to and from the state of unemployment
were most important for net flows. By contrast, hirings from, and separations to nonparticipation were most
important in the business services sector, which is similar to the findings of Fallick (1996), who focused on
the behavior of hirings in the US.
Finally, we investigated the behavior of net and gross flows over the business cycle for the time period
1980-2001. Net reallocation was found to be counter-cyclical, and gross reallocation to be pro-cyclical. We
interpret this as an indication of both clogging and cleansing effects of recessions: job-to-job transitions
involving a change of sector decline sharply in economic downturns; workers are forced to change sectors,
which leads to rising net reallocations. The mechanisms by which structural change occurs shed light on
the effects of active and passive labor market policies. In general, economies can achieve structural change
either by forcing costly mid-career industrial and occupational changes, or by “attrition”, i.e. parking
displaced workers in long-term unemployment, early retirement or disability pension, using retirements and
voluntary separations where possible to reduce workforces, while relying on labor force entrants as a source
of new workers. Thus while we refrained in this paper from modeling structural change explicitly, our
findings have implications for the relevant class of models which can help understand structural change
22

in Germany. Consistent with the recent contribution by Rogerson (2005), we find that German workers -
especially older ones - who lose their jobs in shrinking sectors tend to leave the labor force after extended
spells in unemployment. Growing sectors tend to recruit new employees from outside the socially insured
labor force. We do not find a significant component of net employment growth originating in transitions
through unemployment, as in Lucas and Prescott (1974).
The weight of the evidence presented in this paper supports the proposition that structural change
accelerated in Germany around 1990. Our analysis is silent on causes, however. The structural break
could be related to the significant appreciation of an undervalued real exchange rate, which resulted from
higher inflation and the collapse of the European Monetary System in the early 1990s. At the same time,
German unification unlocked new sources of production factors as well as new market opportunities, and
will continue to spur both structural change as well as institutional reform. Eastern enlargement of the
European Union represents much the same process, with much larger long-term impact, yet at a much lower
pace. To understand better the root causes of the shifts we have identified, research will need to focus on
more detailed data, i.e. geographically-based, matched firm-employee datasets.
23
References
Abraham, K. G., and L. F. Katz (1986): “Cyclical unemployment: Sectoral shifts or aggregate distur-
bances?,” Journal of Political Economy, 94(3), 507–22.
Bachmann, R. (2005): “Labour market dynamics in Germany: Hirings, separations, and job-to-job transi-
tions over the business cycle,” Collaborative Research Center 649 Discussion Paper 2005-45, Humboldt-
Universitat zu Berlin.
Bachmann, R., and M. C. Burda (2007): “Sectoral Transformation, Turbulence, and Labor Market Dy-
namics in Germany,” Ruhr Economic Papers 5, Rheinisch-Westfalisches Institut fur Wirtschaftsforschung,
Ruhr-Universitat Bochum, Universitat Dortmund, Universitat Duisburg-Essen.
Balassa, B. (1964): “The purchasing power parity doctrine: A reappraisal,” Journal of Political Economy,
72, 584–596.
Barlevy, G. (2002): “The sullying effect of recessions,” Review of Economic Studies, 69(1), 65–96.
Baumol, W. (1967): “Macroeconomics of unbalanced growth: The anatomy of urban crisis,” American
Economic Review, 57, 415–26.
Bender, S., A. Haas, and C. Klose (1999a): “Die IAB-Beschaftigtenstichprobe 1975-1995,” ZA-
Information, 45, 104–115.
(1999b): “Mobilitat allein kann Arbeitsmarktprobleme nicht losen,” IAB kurzbericht, 2.
(2000): “IAB employment subsample 1975-1995. Opportunities for analysis provided by the
anonymised subsample,” IZA Discussion Paper 117, Institute for the Study of Labor (IZA).
Bender, S., and T. von Wachter (2006): “In the right place at the wrong time - The role of firms and
luck in young workers’ careers,” American Economic Review, 96(5), 1679–1705.
Blanchard, O., and P. Diamond (1989): “The Beveridge Curve,” Brookings Papers on Economic Activity,
1, 1–76.
Burda, M. C., and A. Mertens (2001): “Estimating wage losses of displaced workers in Germany,”
Labour Economics, 8(1), 15–41.
Burda, M. C., and C. Wyplosz (1994): “Gross worker and job flows in Europe,” European Economic
Review, 38(6), 1287–1315.
24
Burgess, S. M. (1993): “A model of competition between unemployed and employed job searchers: An
application to the unemployment outflow rate in Britain,” Economic Journal, 103(420), 1190–1204.
Caballero, R. J., and M. L. Hammour (1994): “The cleansing effect of recessions,” American
Econonomic Review, 84(5), 1350–1368.
Candelon, B., and H. Lutkepohl (2001): “On the reliability of Chow-type tests for parameter constancy
in multivariate dynamic models,” Economics Letters, 73(2), 155–160.
Clark, C. (1940): The conditions of economic progress. London: Macmillan.
D’Agostino, A., R. Serafini, and M. Ward-Warmedinger (2006): “Sectoral explanations of employ-
ment in Europe - the role of services,” ECB Working Paper Series 625, European Central Bank.
Fallick, B. (1996): “The hiring of new labor by expanding industries,” Labour Economics, 3, 25–42.
Fallick, B., and C. A. Fleischman (2004): “Employer-to-employer flows in the U.S. labor market:
the complete picture of gross worker flows,” Finance and Economics Discussion Series 2004-34, Board of
Governors of the Federal Reserve System (U.S.).
Farber, H. S. (1999): “Mobility and stability: The dynamics of job change in labor markets,” in Handbook
of Labor Economics, ed. by O. Ashenfelter, and D. Card, vol. 3, pp. 2439–2483. Elsevier.
Fisher, A. G. (1935): The clash of progress and security. London: Macmillan.
Fitzenberger, B., and A. Kunze (2005): “Vocational training and gender: Wages and occupational
mobility among young workers,” Oxford Review of Economic Policy, 21(3), 392–415.
Fitzenberger, B., and R. Wilke (2004): “Unemployment durations in West-Germany before and after
the reform of the unemployment compensation system during the 1980s,” ZEW Discussion Paper 04-24,
Zentrum fur Europaische Wirtschaftsforschung.
Fourastie, J. (1949): Le grand espoir du XXe siecle; progres technique, progres economique, progres social.
Paris: Presses universitaires de France.
Fuchs, V. R. (1980): “Economic growth and the rise of service employment,” NBER Working Paper 486,
National Bureau of Economic Research.
Gathmann, C., and U. Schoenberg (2006): “How general is specific human capital? Using mobility
patterns to analyse skill transferability in the labour market,” IZA Discussion Paper 2485, Institute for
the Study of Labor (IZA).
25
Golan, A., J. Lane, and E. McEntarfer (2007): “The dynamics of worker reallocation within and
across industries,” Econonomica, 74, 1–20.
Greenaway, D., R. Upward, and P. Wright (2000): “Sectoral transformation and labour-market flows,”
Oxford Review of Economic Policy, 16(3), 57–75.
Hall, R. E. (2005): “Job loss, job finding, and unemployment in the U.S. economy over the past fifty
years,” in NBER Macroeconomics Annual, ed. by M. Gertler, and K. Rogoff. The MIT Press.
Hamermesh, D. S. (1989): “What do we know about worker displacement in the United States?,” Industrial
Relations, 28(1), 51–9.
Isaoglu, A. (2006): “Occupational mobility in Germany,” mimeo, European University Institute.
Jovanovic, B., and R. Moffitt (1990): “An estimate of a sectoral model of labor mobility,” Journal of
Political Economy, 98(4), 827–52.
Kambourov, G., and I. Manovskii (2004): “Occupational mobility and wage inequality,” IZA Discussion
Paper 1189, Institute for the Study of Labor (IZA).
Kuhn, P. J. (ed.) (2002): Losing work, moving on: International perspectives on worker displacement. W.
E. Upjohn Institute, Kalamazoo, Michigan.
Layard, R., S. Nickell, and R. Jackman (2005): Unemployment. Macroeconomic performance and the
labour market. Oxford, UK: Oxford University Press, Second edition.
Lee, D., and K. I. Wolpin (2006): “Intersectoral labor mobility and the growth of the service sector,”
Econometrica, 74(1), 1–46.
Lilien, D. (1982): “Sectoral shifts and sectoral unemployment,” Journal of Political Economy, 90(4), 777–
93.
Ljungqvist, L., and T. J. Sargent (2004): “European unemployment and turbulence revisited in a
matching model,” Journal of the European Economic Association, 2, 456–468.
Lucas, R., and E. Prescott (1974): “Equilibrium search and unemployment,” Journal of Economic
Theory, 7, 188–209.
Lutkepohl, H., and M. Kratzig (eds.) (2004): Applied time series econometrics. Cambridge University
Press, Cambridge.
26

Marimon, R., and F. Zilibotti (1998): “‘Actual’ versus ‘virtual’ employment in Europe. Is Spain differ-
ent?,” European Economic Review, 42, 123–153.
(1999): “Unemployment vs. mismatch of talents: Reconsidering unemployment benefits,” Economic
Journal, 109, 266–291.
Neal, D. (1999): “The complexity of job mobility among young men,” Journal of Labor Economics, 17(2),
237–61.
Ngai, L. R., and C. A. Pissarides (2005): “Structural change in a multi-sector model of growth,” IZA
Discussion Paper 1800, Institute for the Study of Labor (IZA).
Rogerson, R. (1987): “An equilibrium model of sectoral reallocation,” Journal of Political Economy, 95(4),
824–34.
(2005): “Sectoral shocks, specific human capital and displaced workers,” Review of Economic
Dynamics, 8(1), 89–105.
Rogerson, R., R. Shimer, and R. Wright (2005): “Search-theoretic models of the labor market: A
survey,” Journal of Economic Literature, 43(4), 959–988.
Schumpeter, J. (1942): Capitalism, socialism and democracy. New York: Harper & Row.
Shimer, R. (2005): “The cyclical behavior of equilibrium unemployment and vacancies,” American Eco-
nomic Review, 95(1), 25–49.
Statistische Amter der Lander (2006): Volkswirtschaftliche Gesamtrechnungen der Lander: Bruttoin-
landsprodukt, Bruttowertschopfung in den Landern und Ost-West-Großraumregionen Deutschlands 1991
bis 2005. Stuttgart: Statistisches Landesamt Baden-Wurttemberg.
van Riet, A., E. Ernst, C. Madaschi, F. Orlandi, A. S. Rivera, and R. Benoıt (2004): “Sectoral
specialisation in the EU a macroeconomic perspective,” Occasional Paper Series 19, European Central
Bank.
Vella, F., and G. Moscarini (2004): “Aggregate Worker Reallocation and Occupational Mobility in the
United States: 1976-2000,” 2004 Meeting Paper 183, Society for Economic Dynamics.
Velling, J., and S. Bender (1994): “Berufliche Mobilitat zur Anpassung struktureller Diskrepanzen am
Arbeitsmarkt,” Mitteilungen aus der Arbeitsmarkt- und Berufsforschung, 3.
27

Winkelmann, R., and K. F. Zimmermann (1998): “Is job stability declining in Germany? Evidence from
count data models,” Applied Economics, 30(11), 1413–20.
28
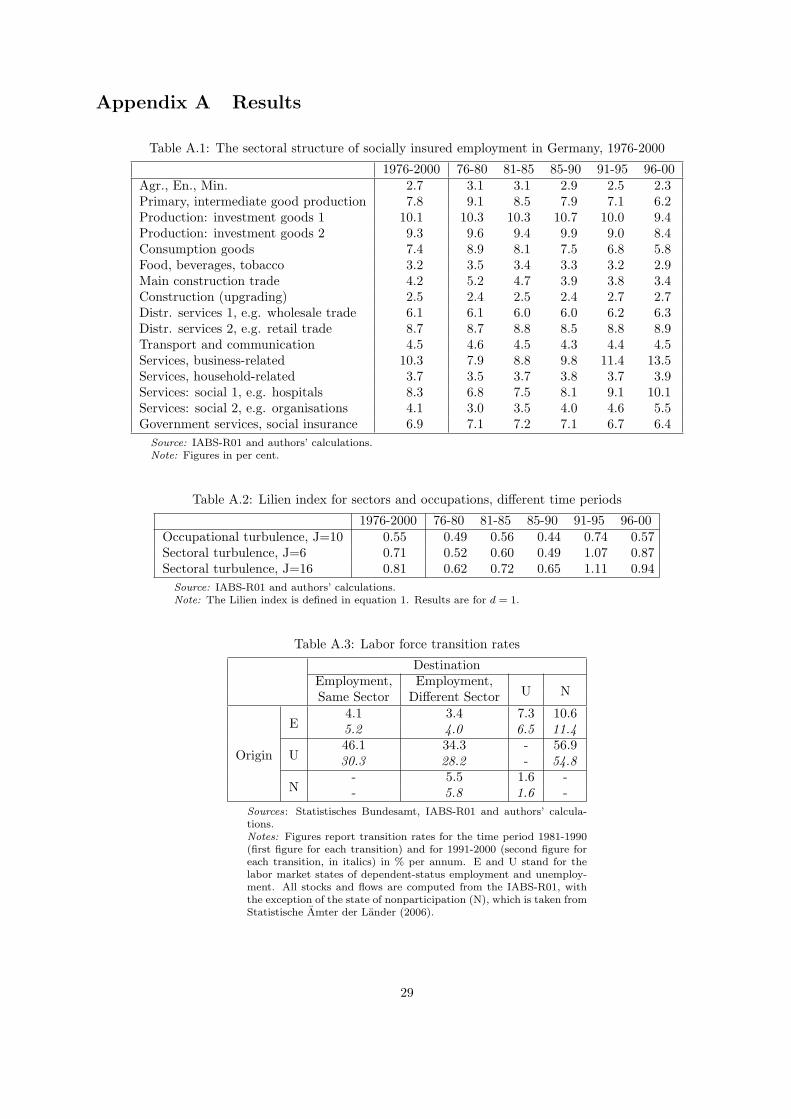
Appendix A Results
Table A.1: The sectoral structure of socially insured employment in Germany, 1976-2000
1976-2000 76-80 81-85 85-90 91-95 96-00Agr., En., Min. 2.7 3.1 3.1 2.9 2.5 2.3Primary, intermediate good production 7.8 9.1 8.5 7.9 7.1 6.2Production: investment goods 1 10.1 10.3 10.3 10.7 10.0 9.4Production: investment goods 2 9.3 9.6 9.4 9.9 9.0 8.4Consumption goods 7.4 8.9 8.1 7.5 6.8 5.8Food, beverages, tobacco 3.2 3.5 3.4 3.3 3.2 2.9Main construction trade 4.2 5.2 4.7 3.9 3.8 3.4Construction (upgrading) 2.5 2.4 2.5 2.4 2.7 2.7Distr. services 1, e.g. wholesale trade 6.1 6.1 6.0 6.0 6.2 6.3Distr. services 2, e.g. retail trade 8.7 8.7 8.8 8.5 8.8 8.9Transport and communication 4.5 4.6 4.5 4.3 4.4 4.5Services, business-related 10.3 7.9 8.8 9.8 11.4 13.5Services, household-related 3.7 3.5 3.7 3.8 3.7 3.9Services: social 1, e.g. hospitals 8.3 6.8 7.5 8.1 9.1 10.1Services: social 2, e.g. organisations 4.1 3.0 3.5 4.0 4.6 5.5Government services, social insurance 6.9 7.1 7.2 7.1 6.7 6.4
Source: IABS-R01 and authors’ calculations.Note: Figures in per cent.
Table A.2: Lilien index for sectors and occupations, different time periods
1976-2000 76-80 81-85 85-90 91-95 96-00Occupational turbulence, J=10 0.55 0.49 0.56 0.44 0.74 0.57Sectoral turbulence, J=6 0.71 0.52 0.60 0.49 1.07 0.87Sectoral turbulence, J=16 0.81 0.62 0.72 0.65 1.11 0.94
Source: IABS-R01 and authors’ calculations.Note: The Lilien index is defined in equation 1. Results are for d = 1.
Table A.3: Labor force transition rates
DestinationEmployment, Employment,Same Sector Different Sector U N
4.1 3.4 7.3 10.6E 5.2 4.0 6.5 11.4
46.1 34.3 - 56.9Origin U 30.3 28.2 - 54.8
- 5.5 1.6 -N - 5.8 1.6 -
Sources: Statistisches Bundesamt, IABS-R01 and authors’ calcula-tions.Notes: Figures report transition rates for the time period 1981-1990(first figure for each transition) and for 1991-2000 (second figure foreach transition, in italics) in % per annum. E and U stand for thelabor market states of dependent-status employment and unemploy-ment. All stocks and flows are computed from the IABS-R01, withthe exception of the state of nonparticipation (N), which is taken fromStatistische Amter der Lander (2006).
29
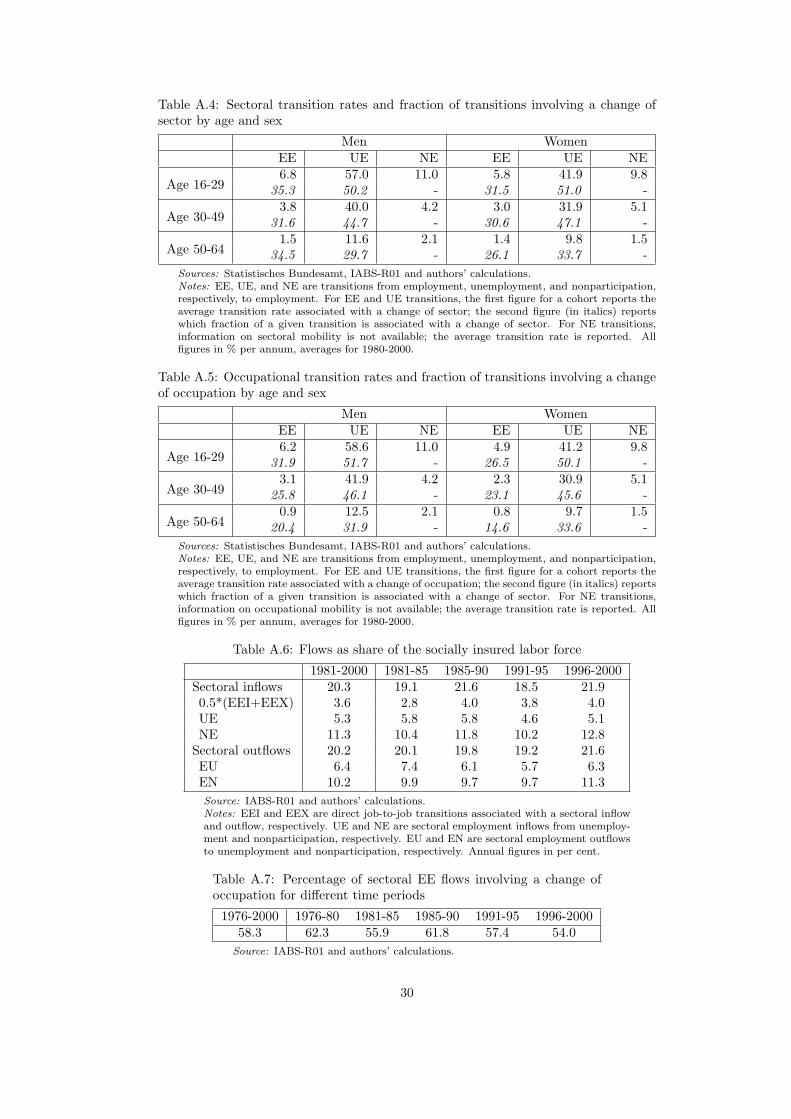
Table A.4: Sectoral transition rates and fraction of transitions involving a change ofsector by age and sex
Men WomenEE UE NE EE UE NE6.8 57.0 11.0 5.8 41.9 9.8
Age 16-29 35.3 50.2 - 31.5 51.0 -3.8 40.0 4.2 3.0 31.9 5.1
Age 30-49 31.6 44.7 - 30.6 47.1 -1.5 11.6 2.1 1.4 9.8 1.5
Age 50-64 34.5 29.7 - 26.1 33.7 -Sources: Statistisches Bundesamt, IABS-R01 and authors’ calculations.Notes: EE, UE, and NE are transitions from employment, unemployment, and nonparticipation,respectively, to employment. For EE and UE transitions, the first figure for a cohort reports theaverage transition rate associated with a change of sector; the second figure (in italics) reportswhich fraction of a given transition is associated with a change of sector. For NE transitions,information on sectoral mobility is not available; the average transition rate is reported. Allfigures in % per annum, averages for 1980-2000.
Table A.5: Occupational transition rates and fraction of transitions involving a changeof occupation by age and sex
Men WomenEE UE NE EE UE NE6.2 58.6 11.0 4.9 41.2 9.8
Age 16-29 31.9 51.7 - 26.5 50.1 -3.1 41.9 4.2 2.3 30.9 5.1
Age 30-49 25.8 46.1 - 23.1 45.6 -0.9 12.5 2.1 0.8 9.7 1.5
Age 50-64 20.4 31.9 - 14.6 33.6 -Sources: Statistisches Bundesamt, IABS-R01 and authors’ calculations.Notes: EE, UE, and NE are transitions from employment, unemployment, and nonparticipation,respectively, to employment. For EE and UE transitions, the first figure for a cohort reports theaverage transition rate associated with a change of occupation; the second figure (in italics) reportswhich fraction of a given transition is associated with a change of sector. For NE transitions,information on occupational mobility is not available; the average transition rate is reported. Allfigures in % per annum, averages for 1980-2000.
Table A.6: Flows as share of the socially insured labor force
1981-2000 1981-85 1985-90 1991-95 1996-2000Sectoral inflows 20.3 19.1 21.6 18.5 21.90.5*(EEI+EEX) 3.6 2.8 4.0 3.8 4.0UE 5.3 5.8 5.8 4.6 5.1NE 11.3 10.4 11.8 10.2 12.8
Sectoral outflows 20.2 20.1 19.8 19.2 21.6EU 6.4 7.4 6.1 5.7 6.3EN 10.2 9.9 9.7 9.7 11.3Source: IABS-R01 and authors’ calculations.Notes: EEI and EEX are direct job-to-job transitions associated with a sectoral inflowand outflow, respectively. UE and NE are sectoral employment inflows from unemploy-ment and nonparticipation, respectively. EU and EN are sectoral employment outflowsto unemployment and nonparticipation, respectively. Annual figures in per cent.
Table A.7: Percentage of sectoral EE flows involving a change ofoccupation for different time periods
1976-2000 1976-80 1981-85 1985-90 1991-95 1996-200058.3 62.3 55.9 61.8 57.4 54.0
Source: IABS-R01 and authors’ calculations.
30
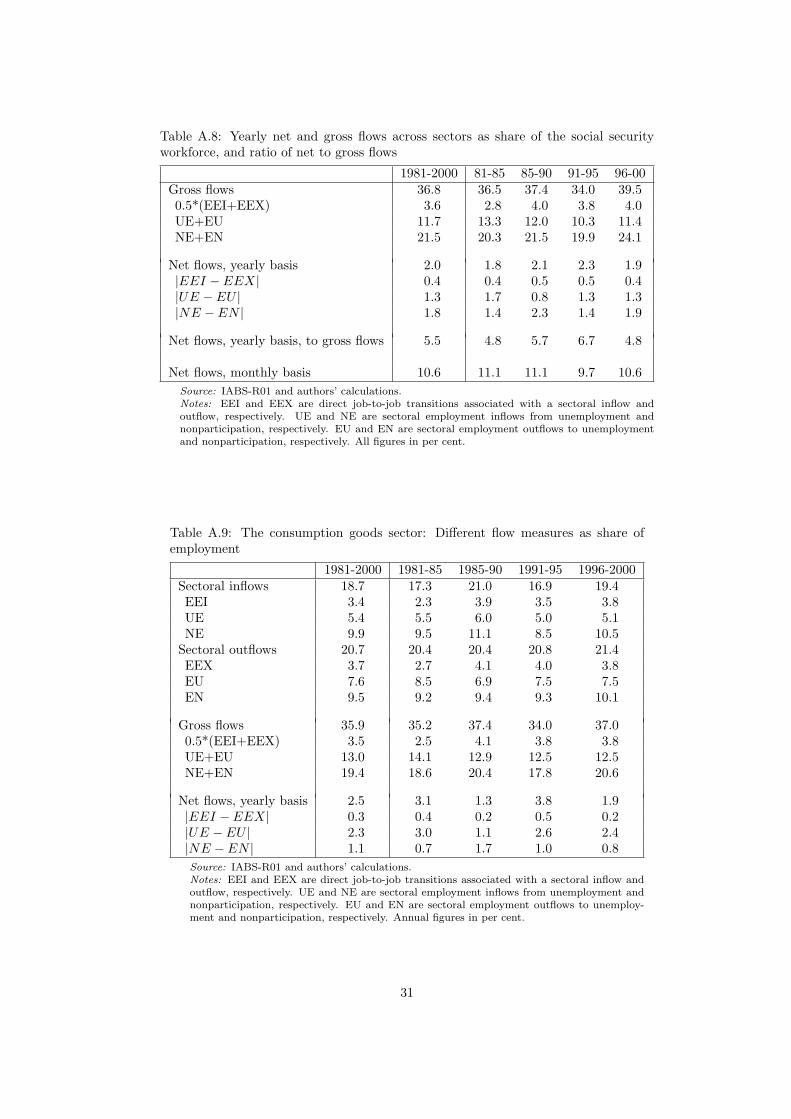
Table A.8: Yearly net and gross flows across sectors as share of the social securityworkforce, and ratio of net to gross flows
1981-2000 81-85 85-90 91-95 96-00Gross flows 36.8 36.5 37.4 34.0 39.50.5*(EEI+EEX) 3.6 2.8 4.0 3.8 4.0UE+EU 11.7 13.3 12.0 10.3 11.4NE+EN 21.5 20.3 21.5 19.9 24.1
Net flows, yearly basis 2.0 1.8 2.1 2.3 1.9|EEI − EEX| 0.4 0.4 0.5 0.5 0.4|UE − EU | 1.3 1.7 0.8 1.3 1.3|NE − EN | 1.8 1.4 2.3 1.4 1.9
Net flows, yearly basis, to gross flows 5.5 4.8 5.7 6.7 4.8
Net flows, monthly basis 10.6 11.1 11.1 9.7 10.6Source: IABS-R01 and authors’ calculations.Notes: EEI and EEX are direct job-to-job transitions associated with a sectoral inflow andoutflow, respectively. UE and NE are sectoral employment inflows from unemployment andnonparticipation, respectively. EU and EN are sectoral employment outflows to unemploymentand nonparticipation, respectively. All figures in per cent.
Table A.9: The consumption goods sector: Different flow measures as share ofemployment
1981-2000 1981-85 1985-90 1991-95 1996-2000Sectoral inflows 18.7 17.3 21.0 16.9 19.4EEI 3.4 2.3 3.9 3.5 3.8UE 5.4 5.5 6.0 5.0 5.1NE 9.9 9.5 11.1 8.5 10.5
Sectoral outflows 20.7 20.4 20.4 20.8 21.4EEX 3.7 2.7 4.1 4.0 3.8EU 7.6 8.5 6.9 7.5 7.5EN 9.5 9.2 9.4 9.3 10.1
Gross flows 35.9 35.2 37.4 34.0 37.00.5*(EEI+EEX) 3.5 2.5 4.1 3.8 3.8UE+EU 13.0 14.1 12.9 12.5 12.5NE+EN 19.4 18.6 20.4 17.8 20.6
Net flows, yearly basis 2.5 3.1 1.3 3.8 1.9|EEI − EEX| 0.3 0.4 0.2 0.5 0.2|UE − EU | 2.3 3.0 1.1 2.6 2.4|NE − EN | 1.1 0.7 1.7 1.0 0.8Source: IABS-R01 and authors’ calculations.Notes: EEI and EEX are direct job-to-job transitions associated with a sectoral inflow andoutflow, respectively. UE and NE are sectoral employment inflows from unemployment andnonparticipation, respectively. EU and EN are sectoral employment outflows to unemploy-ment and nonparticipation, respectively. Annual figures in per cent.
31
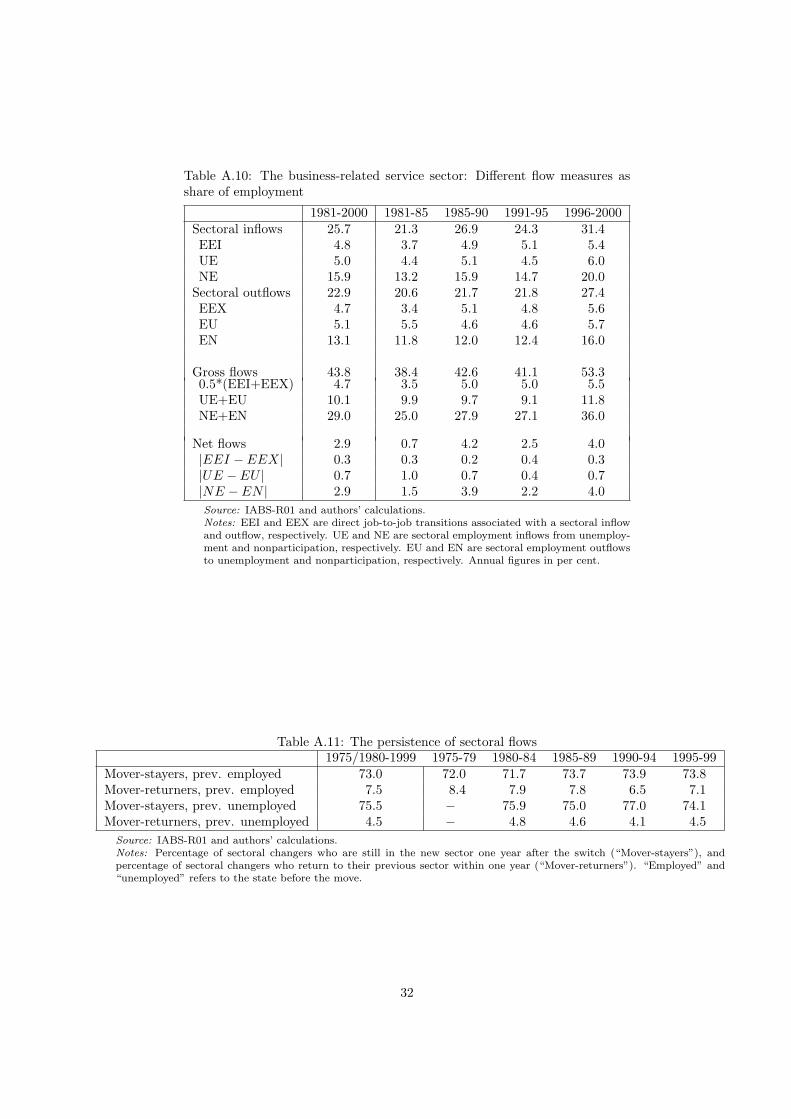
Table A.10: The business-related service sector: Different flow measures asshare of employment
1981-2000 1981-85 1985-90 1991-95 1996-2000Sectoral inflows 25.7 21.3 26.9 24.3 31.4EEI 4.8 3.7 4.9 5.1 5.4UE 5.0 4.4 5.1 4.5 6.0NE 15.9 13.2 15.9 14.7 20.0
Sectoral outflows 22.9 20.6 21.7 21.8 27.4EEX 4.7 3.4 5.1 4.8 5.6EU 5.1 5.5 4.6 4.6 5.7EN 13.1 11.8 12.0 12.4 16.0
Gross flows 43.8 38.4 42.6 41.1 53.30.5*(EEI+EEX) 4.7 3.5 5.0 5.0 5.5UE+EU 10.1 9.9 9.7 9.1 11.8NE+EN 29.0 25.0 27.9 27.1 36.0
Net flows 2.9 0.7 4.2 2.5 4.0|EEI − EEX| 0.3 0.3 0.2 0.4 0.3|UE − EU | 0.7 1.0 0.7 0.4 0.7|NE − EN | 2.9 1.5 3.9 2.2 4.0Source: IABS-R01 and authors’ calculations.Notes: EEI and EEX are direct job-to-job transitions associated with a sectoral inflowand outflow, respectively. UE and NE are sectoral employment inflows from unemploy-ment and nonparticipation, respectively. EU and EN are sectoral employment outflowsto unemployment and nonparticipation, respectively. Annual figures in per cent.
Table A.11: The persistence of sectoral flows1975/1980-1999 1975-79 1980-84 1985-89 1990-94 1995-99
Mover-stayers, prev. employed 73.0 72.0 71.7 73.7 73.9 73.8Mover-returners, prev. employed 7.5 8.4 7.9 7.8 6.5 7.1Mover-stayers, prev. unemployed 75.5 − 75.9 75.0 77.0 74.1Mover-returners, prev. unemployed 4.5 − 4.8 4.6 4.1 4.5
Source: IABS-R01 and authors’ calculations.Notes: Percentage of sectoral changers who are still in the new sector one year after the switch (“Mover-stayers”), andpercentage of sectoral changers who return to their previous sector within one year (“Mover-returners”). “Employed” and“unemployed” refers to the state before the move.
32
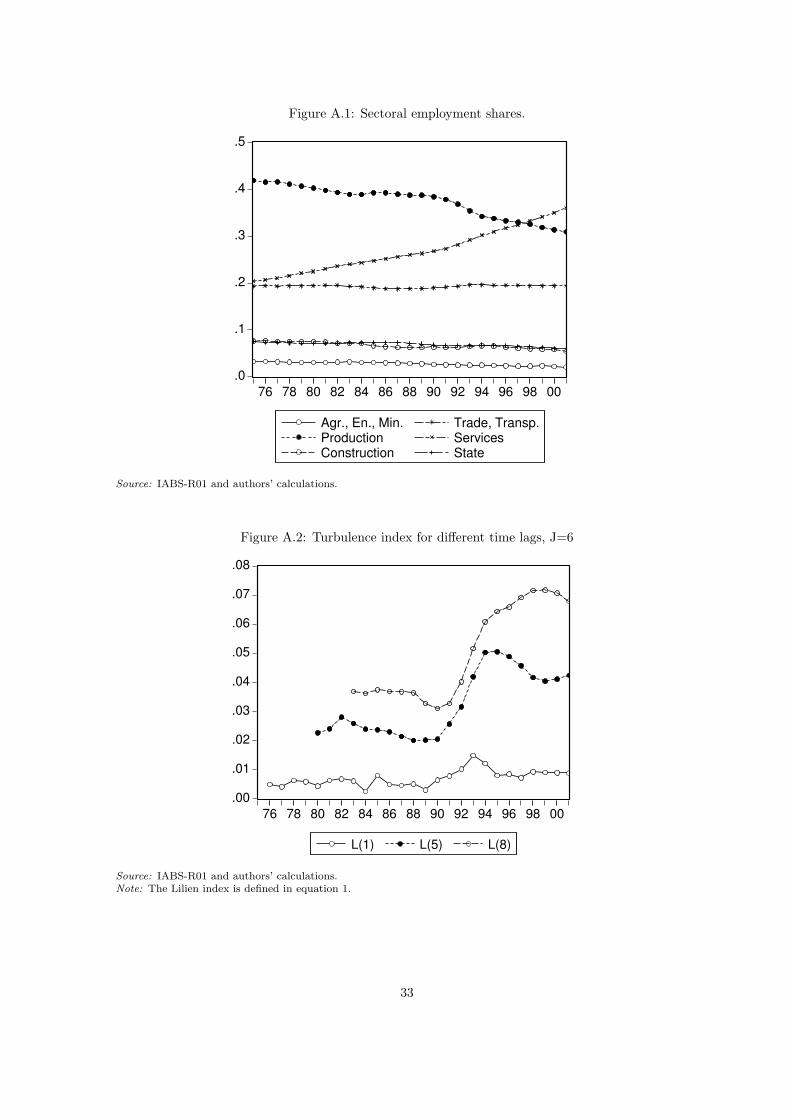
Figure A.1: Sectoral employment shares.
.0
.1
.2
.3
.4
.5
76 78 80 82 84 86 88 90 92 94 96 98 00
Agr., En., Min.ProductionConstruction
Trade, Transp.ServicesState
Source: IABS-R01 and authors’ calculations.
Figure A.2: Turbulence index for different time lags, J=6
.00
.01
.02
.03
.04
.05
.06
.07
.08
76 78 80 82 84 86 88 90 92 94 96 98 00
L(1) L(5) L(8)
Source: IABS-R01 and authors’ calculations.Note: The Lilien index is defined in equation 1.
33
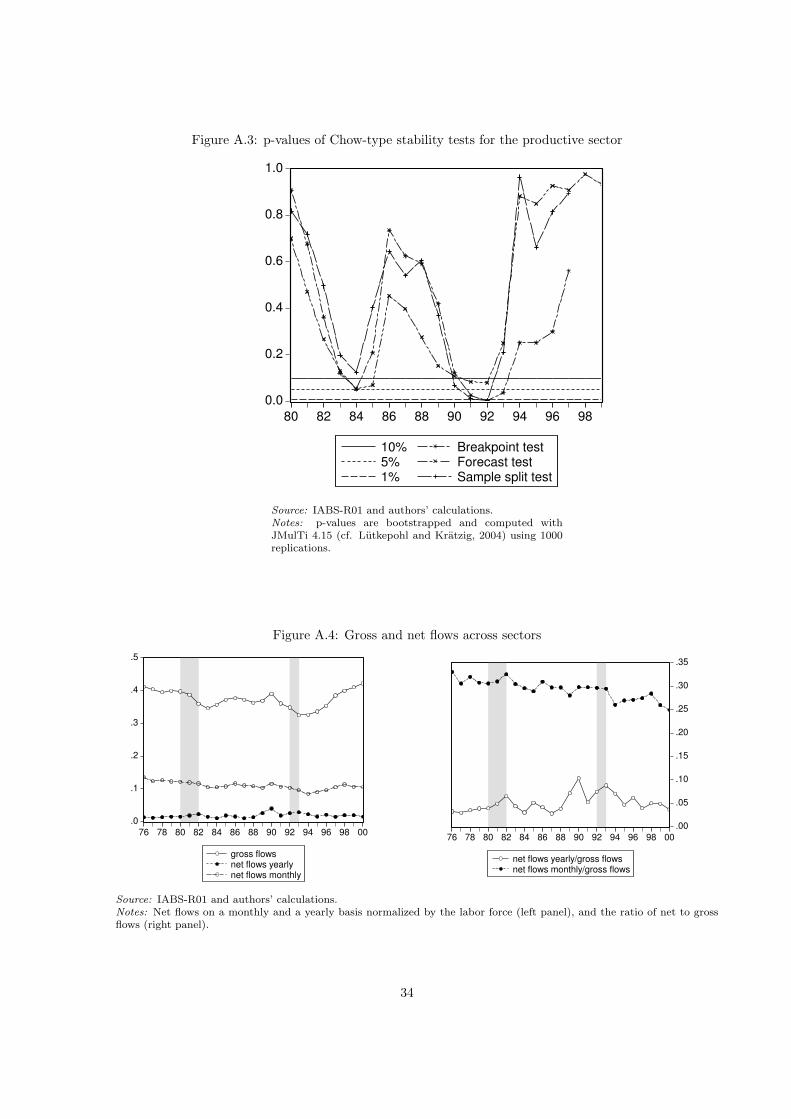
Figure A.3: p-values of Chow-type stability tests for the productive sector
0.0
0.2
0.4
0.6
0.8
1.0
80 82 84 86 88 90 92 94 96 98
10%5%1%
Breakpoint testForecast testSample split test
Source: IABS-R01 and authors’ calculations.Notes: p-values are bootstrapped and computed withJMulTi 4.15 (cf. Lutkepohl and Kratzig, 2004) using 1000replications.
Figure A.4: Gross and net flows across sectors
.0
.1
.2
.3
.4
.5
76 78 80 82 84 86 88 90 92 94 96 98 00
gross flowsnet flows yearlynet flows monthly
.00
.05
.10
.15
.20
.25
.30
.35
76 78 80 82 84 86 88 90 92 94 96 98 00
net flows yearly/gross flowsnet flows monthly/gross flows
Source: IABS-R01 and authors’ calculations.Notes: Net flows on a monthly and a yearly basis normalized by the labor force (left panel), and the ratio of net to grossflows (right panel).
34
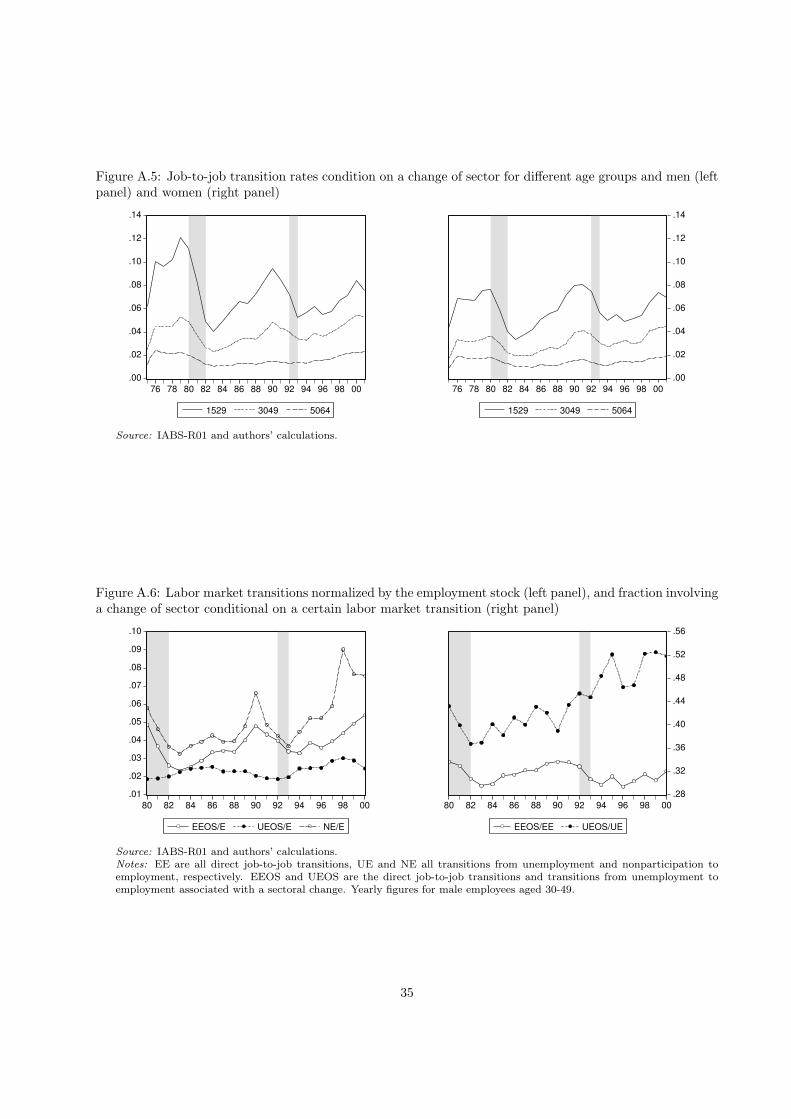
Figure A.5: Job-to-job transition rates condition on a change of sector for different age groups and men (leftpanel) and women (right panel)
.00
.02
.04
.06
.08
.10
.12
.14
76 78 80 82 84 86 88 90 92 94 96 98 00
1529 3049 5064
.00
.02
.04
.06
.08
.10
.12
.14
76 78 80 82 84 86 88 90 92 94 96 98 00
1529 3049 5064
Source: IABS-R01 and authors’ calculations.
Figure A.6: Labor market transitions normalized by the employment stock (left panel), and fraction involvinga change of sector conditional on a certain labor market transition (right panel)
.01
.02
.03
.04
.05
.06
.07
.08
.09
.10
80 82 84 86 88 90 92 94 96 98 00
EEOS/E UEOS/E NE/E
.28
.32
.36
.40
.44
.48
.52
.56
80 82 84 86 88 90 92 94 96 98 00
EEOS/EE UEOS/UE
Source: IABS-R01 and authors’ calculations.Notes: EE are all direct job-to-job transitions, UE and NE all transitions from unemployment and nonparticipation toemployment, respectively. EEOS and UEOS are the direct job-to-job transitions and transitions from unemployment toemployment associated with a sectoral change. Yearly figures for male employees aged 30-49.
35