Embed Size (px)
Citation preview

International Zinc Association
Zinc Sectorial Roadmap 2050 1 03/07/2012
SECTORAL ROADMAP ZINC 2050
MAIN OBJECTIVES On 8 March 2011 a Roadmap for transforming the EU into a competitive low carbon economy by 2050 was adopted by the European Commission. This Roadmap describes the pathway to reach the EU’s objectives of reducing greenhouse gas emissions (GHG) by 80 to 95% of the 1990 levels by 2050. This paper discusses the EU Zinc industry’s role in the EU’s vision of a low carbon economy and the possible actions up to 2050 by the zinc sector to support delivery of agreed GHG reductions.
SECTORAL ROLES IN THE 2050 ROADMAP The EU 2050 Roadmap outlines a pathway for an 80% reduction of the EU GHG emissions by 2050 (Figure 1) which would be achieved using a mix of current and additional policies. The targeted sectoral reductions are detailed. in Table1. Figure 1 below shows the pathway towards an 80% reduction of the GHG emissions by 2050. In Table 1, the targeted sectoral reductions are spelled out.
Figure 1: EU GHG emissions towards an 80% reduction (100% = 1990)

International Zinc Association
Zinc Sectorial Roadmap 2050 2 03/07/2012
GHG reductions compared to 1990
2005
2030 2050
Total -7% -40 to -44% -79 to -82%
Sectors
Power (CO2) -7% -54 to -68% -93 to -99%
Industry (CO2) -20% -34 to -40% -83 to -87%
Transport (incl. CO2 aviation, excl. maritime)
+30% +20 to -9% -54 to -67%
Residential and services (CO2) -12% -37 to -53% -88 to -91%
Agricultural (non-CO2) -20% -36 to -37% -42 to -49%
Other non-CO2 emissions -30% -72 to -73% -70 to -78%
Table 1
From this data, it can be concluded that the Power Sector will play a central role in the low carbon economy. The EU Roadmap proposes that CO2 emissions from electricity supplies can almost be totally eliminated by 2050. The industry sectors including Energy Intensive Industries (EII) are also addressed in the Roadmap. To reach the reduction targets, the EU has identified the following main drivers:
• Advanced resource and energy efficient process/equipment
• Increased recycling
• CCS technologies
• Abatement technologies for non-CO2 emissions Since solutions are sector specific, the Commission sees a need to develop specific Roadmaps in cooperation with the sectors concerned. This document outlines the Roadmap for the EU Primary Zinc Industry

International Zinc Association
Zinc Sectorial Roadmap 2050 3 03/07/2012
THE ZINC SECTOR The zinc industry in Europe The industrial production of zinc started in Europe in the 19th century. Since then the European zinc producers have been at the forefront of technological development and these technologies are now widely used by many other producers in the world. In 2010 the European zinc plants employed about 5600 people. The total direct and indirect employment in the EU primary zinc sector corresponds to about 17 000 people. Most of the European zinc plants have a very long history with production commencing more than one hundred years ago. Since then they have been and continue to be major contributors to the local economy. The zinc industry is well established in the EU thus it facilitates on time delivery, ensures constant demand and promotes the links between primary zinc producers and downstream semi-manufacturers in developing new alloys and producing new shapes and sizes. In addition, the presence of regional suppliers guarantees the security of supply and helps the users with their inventory management. The close proximity and the long established cooperation with the customer industries is strength of the EU primary zinc sector. Primary zinc plants are also producing intermediates which are used as raw material for the production of critical products such as precious and “hi-tech” metals for the electronics industry (flat screens, solar panels, etc.). Therefore the EU primary zinc industry is also of strategic importance for emerging technologies and crucial for security of supply of critical raw materials to the high-tech industries in the EU. The main use of zinc metal is in the galvanizing of steel to prevent corrosion, significantly extending the lifetime of steel products. Therefore, zinc also contributes to reducing CO2 emissions by extending the useful life of infrastructure and vehicles. When comparing for instance a galvanized steel structure with a painted steel structure, the Life Cycle Analysis shows that for the galvanized structure the total energy consumption is only 40% of the one for the painted structure. The energy savings translate to lower CO2 emissions. For instance, LCA studies showed that a galvanized steel structure of 500 t saves ~ 57 Tonnes CO2 emissions compared with an “equivalent” paint system. Recycling of recovered zinc containing products from end-use scrap plays a key role in the value chain. Various recycling routes are used depending on the product to be recycled. The main use of zinc being in the galvanizing of steel (~ 49 % of the total zinc production), the largest amount of zinc to be recycled comes from the steel industry and is treated in the primary zinc smelters. Zinc used in alloys (~29 % of total zinc) such as die casting alloys and brass are usually recycled to produce secondary zinc alloys. Zinc semi’s (~10 % of total zinc) such as zinc sheets for roofing can also be recycled to produce similar products or zinc oxides for applications such as chemical or other compounds.

International Zinc Association
Zinc Sectorial Roadmap 2050 4 03/07/2012
From the above flowchart, it can be seen that the potential of zinc recycling is high and that more than 85% of the products can be recycled at the end of their life cycle. Of course, the life cycle of some of these products is long; galvanized steel can have a life cycle of 60 years or more. Recycled zinc will constitute a main resource for the production of primary zinc in the future. Therefore, it is important that these materials can be treated close to their production location.
48%
29%
100% 10%
12%
1%
Others
Zinc production
Primary zinc
Alloys
Semi's
Zn oxides, dust and
chemicals
Galvanizing
Alloys
Semi's
Zn oxides, dust and
chemicals
SOURCES AND DESTINATIONS OF RECYCLED ZINC
EU27 primary zinc production facilities are located in
regional areas, where they form a significant employer,
providing a major socio-economic contribution to the
local economy as well as enabling a higher standard of
support services than would otherwise exist locally.
Zinc is an essential metal in prolonging the lifetime of
steel constructions leading to less consumption of
primary raw materials, lower energy consumption and
reduced CO2 emissions

International Zinc Association
Zinc Sectorial Roadmap 2050 5 03/07/2012
The zinc production in Europe Over the last twenty years the zinc sector has seen a remarkable evolution in Europe. For many years Europe had been the largest producer of zinc with strong domestic consumption and good possibilities for exports. In 1990, there were 22 zinc refineries in the countries of the EU27 plus Norway producing zinc metal using three technologies:
• 6 plants with a pyrometallurgical Imperial Smelting Furnace (ISF) technology
• 14 plants with Roasting-Leaching-Electrolysis process (RLE), full hydro
• 2 plants with RLE process, combined hydro and pyro processes. Total production from these plants in 1990 was 2173 kt of zinc metal per year and the average production per plant was 100 000 tons. From 1990 to 2010, the zinc metal sector saw the following evolution:
• From 1990 to 2000, the production increased to about 2400 kt per year of zinc metal in response to the increasing demand for zinc metal in Europe.
• No new plants were constructed; the production growth was achieved through expansions and productivity increases in the existing refineries.
• After 2000, a number of plants were closed down, mainly smelters using the ISF technology. The major reason for the closure of plants using the ISF technology was their comparatively higher energy consumption leading to much higher production costs. The ten zinc refineries which closed produced up to 740 kt zinc metal per year. More than half of that production loss has been compensated by production increases in the remaining RLE plants.
In 2010, zinc production was 2098 kt and this production was achieved in 12 plants:
• 1 plant with ISF technology
• 10 plants with RLE process, full hydro
• 1 plant with RLE process, combined hydro and pyro Figure 2 shows this evolution. The average production volume in the remaining existing plants is now close to 200 kt due to brownfield expansions and productivity increases. In 2010, the European zinc production was, about 3%, lower than the production achieved in 1990. From an exporter of zinc, the EU became an importer. In 2010, 366 kt of zinc have been imported into the EU and this zinc comes from zinc smelters with less energy efficient production processes. However the major change lies in the production process. Presently, most zinc is produced using the RLE, full hydro process, accounting for 93% of the total production. In 1990, the RLE, full hydro only represented 62% of total zinc metal production.

International Zinc Association
Zinc Sectorial Roadmap 2050 6 03/07/2012
Figure 2: Evolution of installed number of plants and zinc capacity in Europe
Zinc production in the EU fell substantially over 2000-
2010, especially during the recession. Also zinc usage
fell markedly during the recession. Zinc use was around
2.5 mt in 2000, around 2.3 mt in 2008, but fell to 1.8 mt in
2009.
Despite a big improvement in its net trade position
during the recession, the EU is the third-largest net
importer of zinc.
2221 21
20
17
15
12
2173
23212315
2402
2294
2184
2098
0
5
10
15
20
25
1900
2000
2100
2200
2300
2400
2500
1990 1993 1995 2000 2005 2008 2010
Evolution from 1990 to 2010
Number of plants Total Slab Zinc (kt)

International Zinc Association
Zinc Sectorial Roadmap 2050 7 03/07/2012
CO2 emissions by the zinc sector The process change occurring in the European plants has had a major impact on the CO2 emissions pattern. The RLE, full hydro process has the lowest energy consumption and 94% of the consumed energy is electricity.
The two other processes are using fossil fuels as well as electricity and the overall energy consumption is much higher than the RLE, full hydro process as shown in the graph in Figure 3 based on the 1990 situation.

International Zinc Association
Zinc Sectorial Roadmap 2050 8 03/07/2012
Figure 3 Energy consumption for the 3 types of zinc plants (1990)
Due to the closure of most of the pyro-metallurgical zinc smelters and the substitution of the production by RLE smelters, a significant decrease in CO2 emissions occurred during the period 1990 to 2010. This decrease in CO2 emissions was further enhanced due to the reduction of the CO2 emissions intensity linked to the production of electricity: from 442 kg CO2/GWh in 1990 down to 350 kg CO2/GWh in 2010. These numbers are average numbers for EU27 (Source: EEA; IEA).
Energy consumption in MJ/t Zn
0
5000
10000
15000
20000
25000
30000
35000
40000
45000
RLE, hydro RLE, hydro
+ pyro
ISF
Electricity MJ/t Zn
Other energy MJ/t Zn
The European RLE plants are the most efficient in the
world thanks to their high productivity rate and energy
efficiency. Zinc metal produced in the EU has a lower CO2
footprint than zinc produced elsewhere.
International Zinc Association
Zinc Sectorial Roadmap 2050 9 03/07/2012
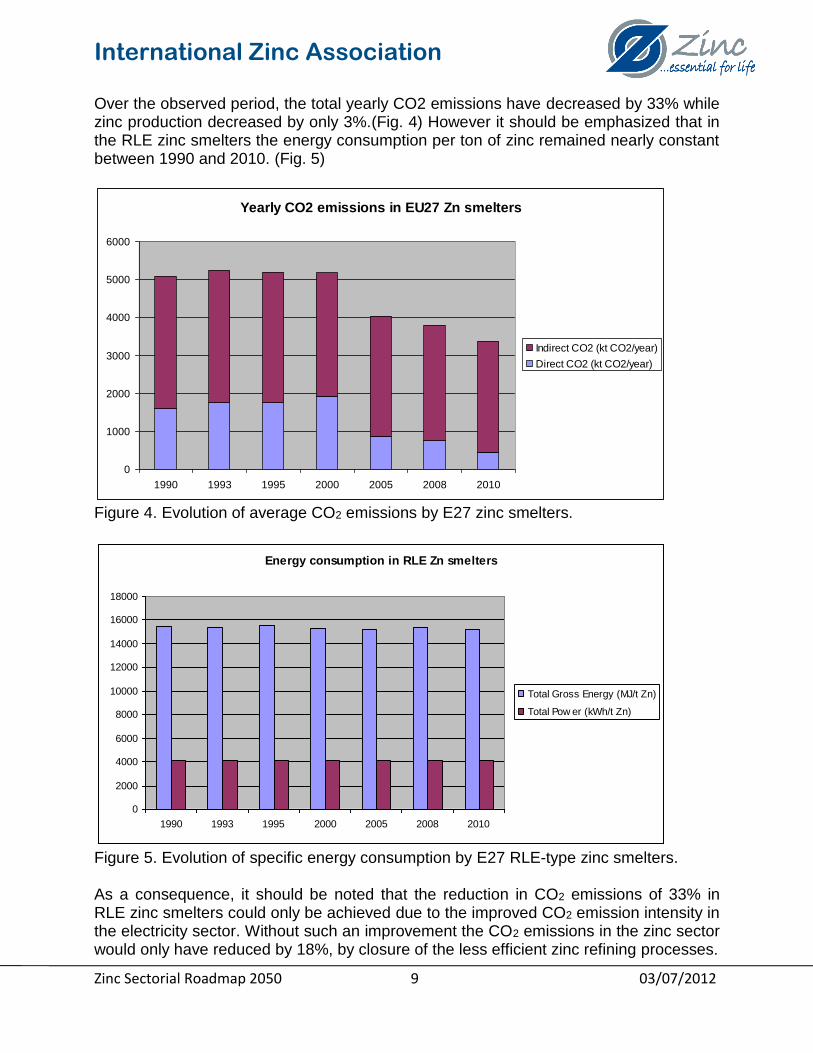
Over the observed period, the total yearly CO2 emissions have decreased by 33% while zinc production decreased by only 3%.(Fig. 4) However it should be emphasized that in the RLE zinc smelters the energy consumption per ton of zinc remained nearly constant between 1990 and 2010. (Fig. 5)
Figure 4. Evolution of average CO2 emissions by E27 zinc smelters.
Figure 5. Evolution of specific energy consumption by E27 RLE-type zinc smelters. As a consequence, it should be noted that the reduction in CO2 emissions of 33% in RLE zinc smelters could only be achieved due to the improved CO2 emission intensity in the electricity sector. Without such an improvement the CO2 emissions in the zinc sector would only have reduced by 18%, by closure of the less efficient zinc refining processes.
Yearly CO2 emissions in EU27 Zn smelters
0
1000
2000
3000
4000
5000
6000
1990 1993 1995 2000 2005 2008 2010
Indirect CO2 (kt CO2/year)
Direct CO2 (kt CO2/year)
Energy consumption in RLE Zn smelters
0
2000
4000
6000
8000
10000
12000
14000
16000
18000
1990 1993 1995 2000 2005 2008 2010
Total Gross Energy (MJ/t Zn)
Total Pow er (kWh/t Zn)
International Zinc Association
Zinc Sectorial Roadmap 2050 10 03/07/2012
ZINC SECTOR ROADMAP Reduction of electricity consumption Presently, 93% of the primary zinc is produced in smelters using the RLE, full hydro process. This process is considered as “Best Available Technology” (ref. IPPC/NFM). This process has energy consumption, as electricity, of 4000 to 4100 kWh per ton of zinc. The major part of this electricity - average of 3400 kWh/t Zn - is consumed in the electrolysis stage, where conversion efficiency is governed by physical laws. In addition, after the electrolysis stage, the produced zinc cathodes are melted and cast in commercial shapes and grades. This operation has an additional 110 kWh/t Zn, which is also ruled by physical laws. Therefore, it is unrealistic to consider a significant reduction of the energy consumption due to these physical laws or limitations. The remaining 500 to 600 kWh/ t Zn is consumed by equipment such as pumps, mixers, fans, filters, conveyors, etc. Improvement in the efficiency of this equipment in the future cannot be excluded, but once again the resulting reduction of energy consumption will be limited. A 20% efficiency improvement would result in a saving of about 100 kWh/ t Zn or 2.5% on the total consumption of a zinc plant. It can be assumed that once this more efficient equipment becomes available, it would progressively replace the existing one as part of the maintenance programs over the next 40 years.
GHG reductions of the power sector In the Roadmap for transforming the EU into a competitive low carbon economy by 2050 it is assumed that the power sector will reduce their average emissions of CO2 by 93 to 97% of the 1990 level by 2050. If such is the case the CO2 emissions attributed to the zinc sector would also be drastically reduced and would fall within the EU Roadmap targets set out for the Industry. If it is assumed that the power producers would reduce the average emissions by only 50%, the zinc sector would only achieve a 55% reduction of the CO2 emissions compared with the 1990 level.
The physical laws governing zinc electrolysis and metal melting prevent significant reductions of the electrical energy consumed during the zinc production process.
In the EU27, electricity represents now 85% of all energy used for the production of zinc.

International Zinc Association
Zinc Sectorial Roadmap 2050 11 03/07/2012
Reduction of the direct emissions In the RLE, full hydro process the direct emissions of CO2 represent about 33 kg CO2/t Zn and the level of these emissions has been basically constant since 1990. They mostly result from the combustion of fossil fuels for the heating of materials and solutions in the process. Most of the metal melting furnaces have already switched from gas heating to highly efficient electrical induction heating. This heat requirement is additional to the heat recovered in the process; all RLE smelters are equipped with a heat recovery system allowing the recovery of the heat generated during the roasting of the zinc concentrates. This process is exothermic and does not require external heat under normal operating conditions (except for furnace pre-heating after a shut-down). Here also it can be assumed that more efficient equipment will become available over the next 40 years, leading to an even higher heat recovery. In such a case the CO2 emissions could be reduced by 50%, but such reduction represents less than 1% of the total CO2 level of 1990. For the pyrometallurgical processes, and mainly for the ISF process, the direct emissions constitute the major part and amount to about 4600 kg CO2/t Zn. A reduction of those emissions will require the use of appropriate abatement technologies or CCS when available at an acceptable cost. In Europe, the ISF technology has suffered due to higher cost constraints since the early 2000’s, which has led to the closure of almost all these plants.
In-house energy production Taking into account the production level of the European zinc plants, the amount of electric energy consumed by those plants and the need for a secured continuous supply of this energy, in-house production from renewable resources such as wind or photovoltaic is not a realistic option. Even an approach on the basis of CHP would prove to be not workable because there is insufficient need for heat within the zinc plant and in most of the cases in the close vicinity.
85% of the direct emissions are originated by the
pyrometallurgical processes. Using appropriate
abatement technologies will require important
investments.

International Zinc Association
Zinc Sectorial Roadmap 2050 12 03/07/2012
A small production of electric energy can be considered by transforming part of the heat recovered from the roasting of the concentrates into electricity. In addition to the equipment needed for the electricity generation this will require further investments in more sophisticated and efficient heat recovery systems, which plants are actively exploring. However, the electricity so produced will represent at most about 5% of the total electric consumption of the plant.
Recycling The use of recycled materials as feed for primary zinc smelters has been the common practice in Europe for several years. These recycled materials originate from the steel industry treating galvanized steel scrap in their electric arc furnaces. During this process, a dust is produced containing amongst others an important amount of zinc. This dust has to undergo an upgrading process to make it acceptable for an RLE zinc plant; such process is rather energy intensive. After upgrading, the resulting product has characteristics comparable to the classical zinc sulfide concentrates used in the zinc smelters. The treatment of these recycled materials is therefore largely comparable to the one for the zinc concentrates in the RLE process. The recycled materials can also be used in the ISF process as an alternative for the traditional feed. Due to the limited availability and to some specific technical characteristics of these materials, they only can replace a part of the traditional feed for the zinc smelters. A plant that would operate only with recycled materials would require a specific process or at least a major adaptation of the RLE flow-sheet. Taking into account the treatment method (upgrading process followed by RLE process) and the fact that the recycled materials do not contain sulfur (no energy credit compared to zinc concentrates), the overall energy balance does not present an advantage compared to zinc concentrates.
Even though the availability of recycled materials is
under pressure of purchases from emerging markets, the
European zinc producers are using large quantities of
recycled zinc as feed for their plants.

International Zinc Association
Zinc Sectorial Roadmap 2050 13 03/07/2012
Technological breakthrough Starting in the early 60’s the zinc industry has seen over a period of about 25 years many technological developments leading to the presently used RLE technology. Today, the RLE technology is considered as “Best Available Technology” for the production of primary zinc and presents the lowest energy consumption. Alternative technologies are on the market and are used in some specific cases. They do not constitute a total change of the zinc process but are rather replacing part of the RLE process. However, these technologies did not bring a real reduction of the energy consumption; their benefits have been more on the investment aspect and on the technical applicability. Also in the field of recycling, more specifically for the recycling of the electric arc furnace dusts coming from the steel industry, new technologies may be investigating such as de-zincing processes or direct hydrometallurgical treatment of the dusts. Other processes leading to a significant reduction in the energy (electricity) consumption will be investigated. If their economic and technical feasibility can be demonstrated, these processes could constitute a technical breakthrough. Today it is not possible to predict neither whether these processes will prove to be successful nor the timing of when this will happen.
Production growth rates
Various scenarios may be considered:
Scenario 1: Status Quo; zinc production in EU27 remains at its 2010 level
Scenario 2: Small growth at 0.25% per year. This corresponds to a growth of 10% until 2050 and would be the result of productivity improvements without major investment
Scenario 3: Decline as result of closures leading to 20% less zinc production by 2050
Scenario 4: In addition to the small growth, a major expansion of one RLE plant
For these scenarios the impact on CO2 emissions can be calculated, integrating the various possible reductions spelled out above.
The RLE technology is the most energy efficient:
presently it is BAT.
No technological breakthrough is likely to come
available in the near or medium future.

International Zinc Association
Zinc Sectorial Roadmap 2050 14 03/07/2012
Analysis of the Scenarios The graph hereunder shows the percentage reductions which can possibly be achieved by the zinc smelters implementing measures to save energy and reduce the CO2 emissions under the four scenarios of production rates. The possible savings on CO2 emissions which can be made are small because of the physical laws governing the energy consumption of this type of operation.
When combining the reductions achieved by the zinc plants with the results to be achieved by the power sector, the CO2 emissions could be reduced even below the -83% to -87% target presently considered. This lower emission level could be achieved independent from the considered production scenario. Even with a growth in production of 17% the CO2 emissions would be reduced by more than 90% compared to the situation in 1990.
1990 2010 2030 2050
Status quo 100% 66% 62% 58%
Small growth 100% 66% 65% 64%
Closing 20% 100% 66% 56% 46%
Expansion 100% 66% 69% 68%
0%
20%
40%
60%
80%
100%
120%
CO2 emissions from zinc plants

International Zinc Association
Zinc Sectorial Roadmap 2050 15 03/07/2012
1990 2010 2030 2050
Status quo 100% 66% 38% 7%
Small growth 100% 66% 40% 8%
Closing 20% 100% 66% 35% 6%
Expansion 100% 66% 43% 8%
0%
20%
40%
60%
80%
100%
120%
CO2 emissions from zinc plants and power suppliers

International Zinc Association
Zinc Sectorial Roadmap 2050 16 03/07/2012
Conclusions
• Due to the nature of the Zn industry – if the electricity industry reaches its targets, so will the Zn industry! Therefore the Zn refining industry CAN be part of, and contribute to, an EU in 2050 that is meeting its low Carbon Economy targets
• The primary zinc sector is sustainable in a low carbon economy. The potential for growth exists and is compatible with the targets of a low carbon economy. . Zinc products also support lower CO2 footprint of infrastructure and vehicles, and zinc smelters contribute to the supply of critical raw materials to other EU sectors such as hi tech and renewable energy sectors.
• By implementing major technological changes the zinc sector has already contributed to the reduction of CO2 emissions over the last twenty years. Although further reductions look possible, they will be minor due to 94 % of zinc smelting sector CO2 profile relating to electricity supply.
• The European zinc sector has the highest energy efficiency and the lowest GHG emissions. Discouraging the sector will lead to production losses and closures in Europe and consequently to carbon leakage.
• The EU zinc industry is energy intensive and faces a severe competitive disadvantage compared to its global competitors due to the impact of EU ETS on energy costs and on electricity costs in particular. EU policies need to ensure that low emission Energy Intensive Industry is fully compensated for the additional costs resulting from the ETS until a level global playing field is established for CO2 costs.